
ABSTRACT
The field of extracellular vesicles (EVs) is an exponentially growing segment of biomedical sciences. However, the problems of normalisation and quantification of EV samples have not been completely solved. Currently, EV samples are standardised on the basis of their protein content sometimes combined with determination of the particle number. However, even this combined approach may result in inaccuracy and overestimation of the EV concentration. Lipid bilayers are indispensable components of EVs. Therefore, a lipid-based quantification, in combination with the determination of particle count and/or protein content, appears to be a straightforward and logical approach for the EV field. In this study, we set the goal to improve the previously reported sulfo-phospho-vanillin (SPV) lipid assay. We introduced an aqueous phase liposome standard (DOPC) to replace the purified lipid standards in organic solvents (used commonly in previous studies). Furthermore, we optimised the concentration of the vanillin reagent in the assay. We found that elimination of organic solvents from the reaction mixture could abolish the background colour that interfered with the assay. Comparison of the optimised assay with a commercial lipid kit (based on the original SPV lipid assay) showed an increase of sensitivity by approximately one order of magnitude. Thus, here we report a quick, reliable and sensitive test that may fill an existing gap in EV standardisation. When using the optimised lipid assay reported here, EV lipid measurements can be more reliable than protein-based measurements. Furthermore, this novel assay is almost as sensitive and as easy as measuring proteins with a simple BCA test.
Introduction
The field of extracellular vesicles (EVs) attracts substantial attention in biomedicine due to the proposed role of EVs in various biological processes and their potential to serve as biomarkers for diseases [Citation1–Citation3]. However, the availability of approaches for standardised quantification of EVs is limited [Citation4–Citation6]. Current interest in EV research urges reliable tools of standardisation and accurate enumeration of EVs.
One of the main problems is that contaminants of EV-enriched samples (such as protein aggregates and lipoproteins) may share biophysical parameters with EVs [Citation7–Citation9]. Particle enumeration methods (including nanoparticle tracking analysis and tuneable resistive pulse sensing) are error-prone because they cannot distinguish vesicular and non-vesicular structures. Methods used commonly for standardisation of EVs rely on the measurement of total proteins with colorimetric reactions (e.g. Micro BCA). Importantly, by definition, EVs are surrounded by phospholipid bilayers [Citation5,Citation10]; therefore, lipids (such as phospholipids and cholesterol) are essential components of all EVs. Ideally, lipid detection would help to distinguish protein aggregates from EVs. However, differentiation between EVs and lipoproteins still remains challenging.
Quantification and standardisation of EV samples based on lipid content, and estimation of EV purity based on protein to lipid ratio, have been prevented until recently by the lack of suitable methods. In 2015, our group has published that a simple benchtop colorimetric lipid assay (the sulfo-phospho-vanillin [SPV]) was suitable to determine the lipid content of EVs and to determine the protein/lipid (P/L) ratio of EV preparations [Citation11]. However, the broad use of this assay was prevented by its relatively low sensitivity which implies that a significant proportion of an EV preparation was required for the lipid test [Citation6]. Infrared (IR) spectroscopy was also used to determine the same P/L ratio of EV samples as determined by the SPV assay [Citation12], but it requires equipment usually not available in biomedical laboratories. An alternative approach is mass spectroscopy (MS)-based lipid quantification; however, it still has strong dependence on equipment, requires higher sample amounts, has long processing time and the technique may not be readily available to all laboratories [Citation2].
As pointed out by a recent review, lipid quantification focuses on the defining component of EVs: the lipid bilayer [Citation6]. As highlighted in the above article, until now there has been an important and urgent need for a more sensitive benchtop lipid quantification assay. Here, we report that we developed an improved version of our previous vanillin-based lipid assay detecting unsaturated lipid components of biological membranes. We have substantially increased the sensitivity of the lipid test compared to the previous assay making it suitable for routine quantification of most EV samples. This assay provides a more reliable method to measure EVs than protein-based measurement. It measures lipids even from a limited amount of samples with a sensitivity close to that of the Micro BCA assay.
Material and methods
Cell lines
AC16 human cardiomyocyte cell line (SCC109) was purchased from Merck and was cultured according to the instructions of the manufacturer. Before EV isolation, AC16 cells were differentiated according to the work of Davidson [Citation13]. Cells were cultured in tissue culture flasks coated with 0.02% gelatine (EMD Millipore) and 5 µg/mL fibronectin (Gibco) up to confluence. Once the cells reached confluence, they were cultured for an additional week in DMEM/F12 medium supplemented with 2% horse serum and 1x Insulin-Transferrin-Selenium (all from Gibco). EVs were isolated from serum-free conditioned medium.
H9c2 (2-1) BDIX rat heart myoblast cell line was purchased from ECACC through Sigma-Merck. Cells were cultured in DMEM medium (Sigma) supplemented with 10% FBS (Gibco), 1% MEM non-essential amino acid solution (Sigma), antibiotic-antimycotic solution (Gibco); 2 mM L-Glutamine (EMD Millipore) and 3.51g/L D-Glucose (Sigma). Before EV isolation, H9c2 cells were differentiated according to Ménard et al. [Citation14]. Cells were cultured up to confluence, then they were cultured for a day in DMEM medium supplemented with 1% FBS (Gibco), and for an additional week in DMEM medium supplemented with 1% FBS (Gibco) and 10 nM retinoic acid (Sigma). EVs were isolated from serum-free conditioned medium.
HL1 immortalised mouse cardiomyocyte cell line (SCC065) was purchased from Merck and was cultured according to the instructions of the manufacturer. Once the cells reached confluence, they were cultured for an additional day (when spontaneous contractions of the cells were detectable). EVs were isolated from serum-free conditioned medium.
THP-1 human leukemic monocyte cell line (from ECACC through Sigma-Merck) was cultured as described previously [Citation15]. The cell line was cultured in RPMI medium containing 10% FBS (Gibco), 2 mM glutamine (EMD Millipore) and 1% antibiotic-antimycotic solution (Gibco). EVs were isolated from serum-free conditioned medium.
EV isolation from conditioned cell culture medium
EVs were purified with minor modifications to what has been described previously by Osteikoetxea et al. [Citation11]. Prior to isolation, cells were washed three times with PBS, and EV production was allowed to take place for 24 h either in serum-free medium or in the presence of 12.5% EV-depleted FBS (Gibco). Three different size-based subpopulations were isolated including large EVs (lEV), mid-sized EVs (mEVs) and small EVs (sEV) by the combination of gravity driven filtration and differential centrifugation. Briefly, cells were removed by centrifugation at 300 g for 10 min at room temperature (RT), and then the supernatant was filtered by gravity through a 5 μm filter (Millipore, Billerica, MA) and submitted to a 2,000 g centrifugation for 30 min at 4°C to pellet lEVs (Avanti J-XP26 centrifuge, JA 25.15 rotor, Beckman Coulter Inc.). The supernatant was next filtered by gravity through a 0.8 μm filter (Millipore), and centrifuged at 12,500g for 40 min at 4°C to pellet mEVs (Avanti J-XP26 centrifuge, JA 25.15 rotor, Beckman Coulter Inc.). Finally, the supernatant was filtered by gravity through a 0.22 μm filter (Millipore) and ultracentrifuged in an Optima MAX-XP bench top ultracentrifuge with MLA-55 rotor (Beckman Coulter Inc.) at 100,000 g for 70 min at 4°C to pellet sEVs. Each EV pellet was resuspended once in phosphate-buffer-saline (PBS), and recentrifuged under the same conditions as used originally for pelleting.
Lipid determination using a commercially available lipid kit
Determination of EV preparations was carried out by using a commercially available kit (Quantification Kit, STA-613 Cell Biolabs, Inc.) following the instructions of the manufacturer. Lipid standard provided in this kit was also used for validation of liposome standards.
Optimisation of the SPV lipid assay for EVs
Preparation of liposomes
As a lipid standard, 1,2-Dioleoyl-sn-glycero-3-phosphocholine (DOPC) liposomes were used in 1 mg/mL concentration. DOPC was purchased from Sigma-Aldrich in lyophilised form. DOPC liposomes in PBS were prepared as described previously [Citation16]. Briefly, 1 mg DOPC was dissolved in 1 mL chloroform (Reanal) in a 2 mL test tube. Chloroform was evaporated at 60°C in a thermoblock (Labnet) under a fume hood. Next, PBS was added to the dried DOPC cake, and the tube was vortexed intensively for 2 min at maximum speed (Fisherbrand). The resulting crude liposome suspension was then sonicated with 35 kHz (Emmi 20, EMAG) at 45°C for 10 min followed by an additional 2 min intensive vortexing. The obtained liposome standard was stable at 4°C for at least 3 months; however, immediately before use, intensive vortexing of the standard was essential.
As controls, fully saturated liposomes (1,2-Dipalmitoyl-sn-glycero-3-phosphocholine, DPPC liposomes) and liposomes with 50–50 mol% of DOPC and DPPC were prepared. DPPC was purchased from Sigma-Aldrich in lyophilised form. Liposome suspensions were prepared as described for DOPC. In case of liposomes containing both DOPC and DPPC, lipids were mixed in chloroform before evaporation of the solvent.
Preparation of phospho-vanillin reagent
An optimised phospho-vanillin reagent was introduced to increase the sensitivity of the lipid assay described originally by Fings et al. [Citation17,Citation18] and first used for the detection of EVs by Osteikoetxea et al. [Citation11]. Briefly, 50 mg vanillin (Sigma) was dissolved in 50 mL of 17% phosphoric acid (Sigma). Thus, the final vanillin concentration was increased five times compared to what has been used earlier [Citation11]. The phospho-vanillin reagent was stable at 4°C in dark for at least 3 months.
Determination of lipid content of EVs by the SPV assay
A volume of 200 µL of 96% sulphuric acid (Molar Chemicals) was added either to 40 µL of liposome standards or to 40 µL EVs suspended in PBS or deionised water or NaCl HEPES buffer in 1.5 mL test tubes (Safe-Lock tubes, 1.5 mL, 0030 120-086, Eppendorf AG, Germany). The plastic composition and possible coating or wall component of the test tube were found to be critical for the success of the assay. We found that some test tubes, such as 1.5 mL tubes (LoBind T330-7LST Simport, Canada), may contain surface coats that can possibly interact with components of the assay and may cause artefacts.
After a brief vortexing, the open test tubes were incubated at 90°C (AccuBlock digital dry batch, Labnet) in a fume hood for 20 min. Tubes were cooled down to RT by placing them for at least 5 min at 4°C, and 120 µL of phospho-vanillin reagent was added to each tube and was vortexed. Next, 280 µL of each sample was transferred to a 96 well plate (Thermo) and the colour reaction was allowed to develop for 1 h at 37°C. Absorbance at 540 nm was determined with a plate reader (Multiskan MS, Labsystems).
Indirect determination of EV lipid concentration using ATR-FTIR spectroscopy
IR spectra were recorded by the means of a Varian 2000 FTIR spectrometer (Varian Inc., US) equipped with a Mercury-Cadmium-Telluride detector and a single reflection diamond ATR accessory (Specac Ltd, UK). A volume of 3 μL of the sample was placed on the top of the diamond ATR crystal and dry film spectra were collected (64 scans, 2 cm−1 spectral resolution) after solvent evaporation. At least three parallel measurements were done. A spectroscopic protein-to-lipid ratio (P/Lspectr) was determined using the protocol described in [Citation12]. Briefly, after PBS background spectral subtraction, the relative amount of protein was estimated by the integrated intensity of protein Amide I band (around 1650 cm−1) while the lipid content was approximated by the integrated area of C-H stretching bands from the 3020–2800 cm−1 wavenumber region. Conversion of the spectroscopic protein-to-lipid ratio (P/Lspectr) to nominal protein-to-lipid ratio (P/Lnom) required an adequate calibration curve. For this purpose, BSA–Brain Total Lipid Extract mixtures prepared in PBS buffer with varying protein-to-lipid ratios (from 0.2 to 4 mg/mg) were used.
Determination of size distribution and concentration of EVs
Size distribution and concentration of H9c2-derived mEVs and DOPC liposomes were determined by tuneable resistive pulse-sensing analysis using a qNano instrument (IZON Science) as described previously [Citation19]. In case of mEVs, twofold dilution of the sample (derived from 24 mL cell supernatant) was prepared in 0.2 μm filtered PBS. For DOPC liposomes, the DOPC liposome standard (with 1 mg/mL DOPC concentration) was 10-fold diluted with 0.2 μm filtered PBS and filtered with a 0.8 μm mesh filter (Millipore). Both samples were measured by qNano. At least 700 particles were counted using 10 mbar pressure (mEV) and 3 mbar pressure (DOPC liposomes) using a NP400 nanopore membrane. Calibration was performed with known concentration of beads CPC400G (mean diameter: 340 nm, purchased from IZON), diluted 1:1000 in 0.2 μm filtered PBS. Results were evaluated using IZON Control Suite 3.2 software.
Determination of protein content of EVs using BCA
Protein concentration of EVs was determined with the Micro BCA Protein Assay kit (Thermo) according to the instructions of the manufacturer. Briefly, EVs were diluted 5–10 times and were lysed with 0.5% Triton X-100 (Sigma) and 0.05% SDS (Sigma). Colour was developed for 1 h at 60°C and absorbance at 562 nm was measured (NanoDrop NP-1000 ThermoFisher).
Detection of EVs and liposomes by transmission electron microscopy (TEM)
Detection of EVs and liposomes with phosphotungstic acid contrasting
A volume of 2 µL of sample suspended in 0.22 µm filtered PBS was placed onto the surface of 300 mesh formvar-coated grids, and was incubated for 10 min at RT. The residual liquid was removed, and the samples were fixed (10 min at RT) with 4% glutaraldehyde diluted in 0.22 µm filtered PBS. After fixation, grids were washed 3 times (5 min) at RT with purified water and were contrasted with 2% phosphotungstic acid (10 min, RT) followed by 3 × 1 min washes. Samples were examined by JEOL 1011 transmission electron microscope (Japan).
Detection of EVs by immunoelectron microscopy
For immunoelectron microscopy, 2 µL of sample resuspended in 0.22 µm filtered PBS was placed onto the surface of 300 mesh formvar-coated Ni grids, and was incubated for 10 min at RT. Then the residual liquid was removed, and the samples were fixed (10 min at RT) with 0.22 µm filtered 4% paraformaldehyde in PBS, and washed 3 times for 5 min, at RT with 0.22 µm filtered PBS. For blocking, 1 h incubation with 0.22 µm filtered 5% BSA (Sigma) in PBS was used. As primary antibodies, polyclonal rabbit anti-CD63 IgG (H-193, sc-15363, Santa Cruz Biotechnology), monoclonal mouse anti-CD81 (1.3.3.22, ThermoFisher Scientific) or polyclonal rabbit anti-CD81 (FNab01501, FineTest) were applied overnight at 4°C in 1:50 dilution in 0.22 µm filtered 5% BSA in PBS. After washes (3 times 5 min with 0.22 µm filtered 5% BSA), polyclonal goat anti-rabbit IgG 10 nm gold pre-adsorbed (Abcam) or polyclonal goat anti-mouse IgG 5 nm gold pre-adsorbed (Sigma) were used for 3 h at RT. Samples were than washed 3 times for 5 min with 0.22 µm filtered 5% BSA, 3 times for 5 min with 0.22 µm filtered PBS and 3 times for 5 min with purified water. Finally, permanent fixation by 2% glutaraldehyde was applied for 10 min at RT followed by 3 times 5 min washes with purified water. For background contrasting, 2% phosphotungstic acid was used (10 min RT) followed by 3 × 1 min washes. Samples were examined by JEOL 1011 transmission electron microscope (Japan).
Determination of EV-related surface adhesion signal
EV-related surface adhesion signal of THP-1 cell-derived sEVs was determined as previously described by Németh et al. [Citation19]. For the measurements, an EPIC BenchTop system (Corning Inc.) was used with Corning EPIC 384 Well Cell Assay Microplates. Changes in the refractive index caused by adhesion of EVs onto the surface were recorded. Bare surface signal correlated with the quantity of EVs.
Results
Modification of the lipid assay by introducing a liposome standard and using an elevated vanillin concentration
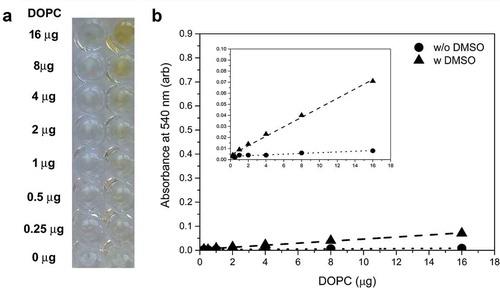
As a first step in our attempt to optimise the previously described lipid assay [Citation11,Citation17,Citation18,Citation20,Citation21], we introduced an aqueous phase liposome standard prepared from DOPC enabling an organic solvent-free lipid detection. One of the shortcomings of the previously used lipid assays is that lipid standards are dissolved in organic solvents. Organic solvents do not only impose health hazards, but their intense evaporation (i) often causes inaccuracy of pipetting and (ii) results in an increased concentration over time due to loss of solvent. Importantly, when lipid samples contain organic solvents (such as chloroform, dimethyl sulfoxide (DMSO) or acetone), a yellowish colour develops ()). Even though this colour shows correlation with the lipid content of the samples, the specificity and sensitivity of this reaction does not enable lipid determination. If the reaction mixture contains less than 8 µg lipid (which is the case for most EV preparations) the absorbance is only approximately 0.04) ()). The same phenomenon is mentioned in the technical notes of the commercial lipid quantification kit used in this study which is also based on the SPV assay. The manufacturer of the kit recommends subtraction of this yellowish background colour from the read at 540 nm after SPV reaction. In our modified lipid assay, we omitted organic solvents from the quantification method, and both our standards and samples were in aqueous phase. Thus, without organic solvents, we did not observe the yellow background colour (,b)).
Figure 1. Organic solvents cause artificial colouration. (a) Yellow colour develops when the reaction mixture contains organic solvent (e.g. DMSO). The figure shows wells containing decreasing amounts of DOPC (from the top: 16, 8, 4, 2, 1, 0.5, 0.25 and 0 µg) before addition of the phospho-vanillin reagent (after 90°C 20 min incubation). Reaction mixtures in the wells of the left column do not contain DMSO while in the right column they contain 20 µL DMSO/well. (b) Absorbance at 540 nm (arb: arbitrary units). Background of the reaction before adding phospho-vanillin reagent without DMSO is indicated as “w/o DMSO” while background with 20 µL DMSO is labelled as “w DMSO”. Scale of Y-axis was set to the axis of a standard SPV assay. Insert panel shows the curves with a zoomed Y-axis to make the linearity visible. The figure shows the result of a single representative measurement.
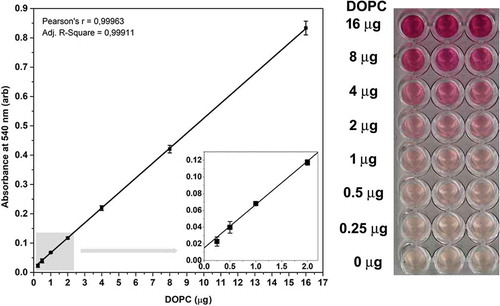
Next, we set the standard curve from 0.25 to 16 µg DOPC in 40 µL (6.25–400 ng/mL) using our new liposome standard and the modified lipid assay with an increased vanillin concentration. As shown in , the correlation (Pearson’s r value) between the absorbance at 540 nm and the lipid concentration is close to 1.00; therefore, the modified assay is suitable for detection of lipids in aqueous phase.
Figure 2. Standard curve of the improved lipid assay. Typical standard curve with three replicates of the optimised sulfo-phospho-vanillin lipid assay using DOPC liposome standard and optimised vanillin concentration. arb: arbitrary units, error bars refer to SD. Insert graph in the left panel highlights the standard curves between 0 and 2 µg DOPC. The right panel shows the colorimetric reaction in a 96 well plate.
Validation of the modified lipid assay
The next key question we addressed was if the modified lipid assay was suitable of measuring the lipid content of EV samples. The vanillin-based detection only measures unsaturated lipids [Citation21]. In Supplementary Material (S1) using DOPC (unsaturated) and DPPC (fully saturated) standards, we show evidence for the differential sensitivity of the assay for saturated and unsaturated lipids.
Based on the paper of Llorente et al [Citation22], we also performed an estimation of how the variable levels of unsaturated lipids in EVs may affect results of the SPV assay (S2). The result of our estimation was that while the plasma membrane of PC-3 prostate cancer cells contained approx. 2.14 mmol unsaturated carbon bonds/g lipids, sEVs contained approx. 2.10 mmol unsaturated carbon bonds/g lipids (a surprisingly close value). For comparison, DOPC has 2.54 mmol unsaturated carbon bonds/g lipids. Therefore irrespectively whether the saturation level differs between EVs and the plasma membrane, the mmol value of unsaturated carbon bonds/g lipids remains constant. Thus, the detected MS differences may not affect the results of the SPV assay significantly.
Next, we isolated EVs from the conditioned media of two T175 confluent tissue culture flasks (24 h serum free) of AC16, HL1 and H9c2 cells. The volume of the conditioned medium was 2 × 12 mL. As shown in , 15% of our EV preparation was enough to give readily detectable lipid results with the optimised lipid assay. Protein concentration of the EV samples was determined and the presence of EV membrane markers (CD63 and CD81) was confirmed by immunoelectron microscopy (). Representative TEM pictures of EVs contrasted with phosphotungstic acid are shown in Supplementary file S3.
Table 1. Lipid contents of EVs isolated from two T175 confluent tissue culture flasks. EVs were isolated from 24 mL serum-free conditioned medium (24 h). Sixteen per cent of EVs (5 μL out of 30 μL was used for lipid measurements).
Figure 3. Detection of EV markers by immunoelectron microscopy using nanogold labelling. (a, b) HL-1 cell line-derived mEVs and sEVs, respectively. (c) THP-1 sEVs. (d, e) AC16 cell-derived mEVs and sEVs, respectively. (f, g) H9c2cell-derived mEVs and sEVs, respectively. Gold particles with 10 nm diameter represent CD63 (a, c, d, e, f and g) and CD81 (b). Gold particles with 5 nm diameter indicate CD81 (c, d, e, f and g). We have found that mEVs were CD81 negative and CD63 positive. In case of HL-1 cell line double labelling was not possible with the used antibodies, HL-1 mEVs were found CD63 positive while HL-1 sEVs were CD81 positive.
The lipid assay was validated further with mEVs obtained from serum-free conditioned media of differentiated cells of H9c2 and AC16 cell lines as well as with commercial LDL.
The lipid content of mEVs was determined by both the new liposome-based colorimetric lipid assay and with the previously described ATR-FTIR spectroscopy-based method [Citation12]. The amount of lipids was calculated from spectroscopic and nominal P/L ratio with the help of the protein concentration determined by Micro BCA test (calculation can be found in Supplementary file S4). Results of our optimised lipid assay and ATR-FTIR are summarised in . The detected lipid content of mEVs was found equal using the two independent methods while the standard deviation of our colorimetric assay was found 10× lower as compared with the ATR-FTIR-based method.
Table 2. Lipid contents of medium-sized EVs measured by the optimised bench top assay and by the IR-based semi-quantitative method. EVs were isolated from 24 mL serum-free conditioned medium (24 h). Mean of three technical replicates ± SD.
As the SPV assay cannot differentiate lipids and lipoproteins, next the lipid content of an LDL sample (with 5 mg/mL protein content) was measured. The P/L percentage was experimentally found 24.89% ± 1.8% which is in a good agreement with the literature data where the P/L percentages of LDL were between 23% and 26% [Citation23].
Size and concentration of mEV particles (H9c2 cell line) and 10 times diluted, 0.8 µm filtered DOPC liposome standard were determined by qNano (). Total membrane surface/mL was calculated from both the diameter and the concentration of the particles. Lipid content of the samples was determined by the optimised lipid assay. We have found that the EV preparation contained 5.50 × 10⁻¹⁶ µg lipid/nm2 while the liposomes contained 1.22 × 10⁻¹⁵ µg lipid/nm2. The result shows that DOPC liposomes contain approximately 2.2 times more lipids compared with EVs. The difference is caused by membrane proteins of the EV membrane and/or protein aggregates potentially co-isolated with the EVs.
Figure 4. Particle size and concentration of medium-sized EVs and DOPC liposomes. Medium-sized EVs were isolated from serum-free conditioned media of H9c2 cells. DOPC liposome standard (1 mg/mL) was ten times diluted in PBS and filtered through 0.8 µm pore size membrane. Both samples were measured by qNano with NP400 membrane. (a) shows a representative bar chart of H9c2 EVs (H9c2 mEV) and liposomes (DOPC liposome), and (b) shows the DOPC liposomes and C a H9c2 mEV with transmission electronmicroscope using phosphotungstic acid contrasting.
To address the question of interference with the optimised assay by potential components of EV preparations, we added increasing concentrations of proteins and nucleic acids (DNA) to 2.5 µg DOPC liposomes, and assessed the 540 nm absorbance values. As summarised in , neither protein nor DNA concentration of the sample affected the lipid detection by the optimised assay.
Table 3. Protein and nucleic acid interference with the lipid assay. The presence of proteins or nucleic acids does not affect the optimised lipid assay. Bovine serum albumin (BSA) was used as a test protein and genomic DNA extracted from Saccharomyces cerevisiae cells was used as test nucleic acids. arb: arbitrary unit.
In addition, here we show an example in which EVs were isolated from either conditioned or non-conditioned medium samples supplemented with 12.5% EV-depleted serum (Gibco). The protein and lipid contents of the EV preparation were compared (). As shown in the table, all samples contained significant and relatively similar amounts of proteins. Importantly, lipid content was only measurable from the conditioned media.
Table 4. Protein and lipid concentrations of small and medium-sized AC16 EVs. Protein concentrations of mEV and sEV vesicles were determined by Micro BCA kit (Thermo). The lipid concentration was assessed by the optimised lipid assay. EVs (mEVs AC16 and sEVs AC16) were isolated form 24 mL conditioned medium (24 h) of two confluent T175 flasks of AC16 cell culture. The tissue culture medium contained 12.5% EV-depleted serum (Gibco). mEV medium and sEV medium are technical controls of 24 mL non-conditioned medium, containing 12.5% EV-depleted serum (Gibco).
Finally, correlation between the amount of EVs and either their protein or lipid concentration was studied. We have described previously that the bare surface signal of an EPIC optical biosensor correlates with the concentration of EVs [Citation19]. Here, we compared the bare surface EPIC signal with the protein concentration (measured with Micro BCA method) and the lipid concentration (measured with the optimised lipid assay). As shows, the bare surface signal of EPIC had a good correlation with the lipid concentration of the samples while it did not correlate with the protein concentration.
Figure 5. Correlation between the lipid and protein concentrations of EVs with the “bare surface signal” of an EPIC optical biosensor. Correlation between the EPIC “bare surface signal” and either the lipid concentration (a) or the protein concentration (b). Small EVs were isolated from serum-free conditioned medium of THP-1 cells. Data points are average of three replicates, error bars represents SD.
Comparison of the optimised lipid assay with a commercial lipid kit
First, we have compared the standard curves of the commercial lipid kit (following the instructions of the manufacturer) and our optimised lipid assay. We determined the relative standard deviation and percentage of RSD values (). It is widely accepted that the precision of an assay is required to be within 20% RSD [Citation24]. As shown in the figure, the 20% RSD value was reached at approximately 0.4 µg lipid in 40 µL with the optimised lipid assay as compared to 1.6 µg in 20 µL lipid in the case of the commercial lipid kit. This means that the sensitivity of the optimised lipid assay is approximately one order of magnitude higher than that of the commercial assay.
Figure 6. Percentage RSD of the optimised lipid assay and of a commercial lipid assay. Dashed line indicates 20% RSD which is the recommended acceptance limit for validations by ICH Quality Guidelines.
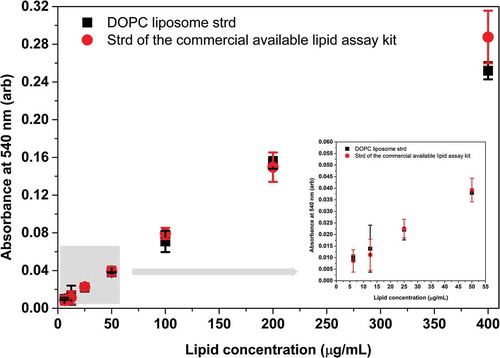
Finally, we also compared the newly introduced DOPC liposome standard. We measured the conventional, purified lipid standard of the commercial kit along with our DOPC standard by our novel, optimised assay. Since the commercial standard is dissolved in DMSO in the kit, we ensured that the 40 µL sample volume contained 10 µL DMSO and 30 µL PBS in the case of both (liposome and purified lipid) standards. The presence of DMSO explains the lower sensitivity of the assay in this case (, and statistics is summarised in Supplementary Table S5). Importantly, the DOPC and the purified lipid standards (in the 0.25–16 µg lipid range) did not differ significantly in our assay.
Figure 7. Comparison between the DOPC standard and the standard provided by the manufacturer of a commercial lipid kit. Both the DOPC liposome standard and the purified lipid standard of the commercial kit were measured by our optimised lipid assay. A volume of 10 µL DMSO was included in the 40 µL sample volume since the purified lipid standard was dissolved in DMSO. Reduced absorbance values were due to the presence of DMSO in the reaction mixture. Absorbance of DOPC liposome standard and standard of the commercial kit statistically do not differ at any concentration points. Insert graph highlights the results in the concentration range between 0 and 50 µg/mL. Data points represent average of three replicates, error bars shows SD. Statistics of the figure can be found in S5 Supplementary Table.
Discussion
There is an urgent need in the EV field to develop a reliable and reproducible method for the standardisation of EV samples. Currently, the best practice is combining the quantification of total protein content and the particle number [Citation6]. However, results obtained this way can be still confounded by the presence of protein aggregates in the EV sample resulting in overestimation of EV concentration.
Our group has published recently a simple benchtop lipid assay for EVs [Citation11]. During the period that has passed since this publication, we recognised that the lipid assay required more EVs than what researchers could easily spare from their preparations for determining the lipid content of the EV sample. Realising this apparent need we kept optimising the assay, and increased its sensitivity by approximately 10-fold. We increased the sensitivity of the previous assay by introducing an aqueous phase DOPC liposome standard instead of purified lipids dissolved in organic solvents as described previously [Citation11,Citation17,Citation18,Citation20,Citation21], and by using an optimised phospho-vanillin reagent concentration. The sensitivity of the lipid test is now close to the one of the frequently used protein Micro BCA assay. The quantification limit of the assay with 20% RSD is approximately 0.5 µg lipid with 0.2 µg detection limit () that makes the assay suitable for routine standardisation of EV samples. If the preparation is pure enough, an EV sample with approximately 0.5–1 µg protein content is sufficient for the lipid assay. Combining the lipid assay with a colorimetric protein measurement (e.g. Micro BCA), the quality of the EV samples (the presence of possibly co-isolated protein aggregates) can be quickly and easily tested as we confirmed earlier [Citation11]. The assay is not influenced by nucleic acids and proteins (); however, the sample buffer should not be significantly contaminated with molecules that can be heavily oxidised by sulphuric acid (such as sugars). In addition, residual iodixanol through its benzyl rings can increase the background of the assay. Of note, molecules that interfere with the lipid assay (such as sugars) may also interfere with the protein colorimetric assays [Citation7]. As highlighted in the section “Material and Methods”, the quality of plastic ware and the purity of the reagents are also essential.
The importance of lipid determination is strongly supported by our observation that only lipid measurement could discriminate between mock and EV-containing isolates (supplemented with EV-depleted foetal bovine serum). However, as our lipid assay cannot distinguish between membrane lipids and lipoproteins, standardisation of EV samples from blood plasma remains challenging [Citation9].
The vanillin-based SPV assay measures unsaturated lipids. The mol% of unsaturated lipids may vary between different EV preparations. Furthermore, the profiles of biological membranes are not constant for a particular cell type, and the mol% of unsaturated lipids depends on nutrient and culture conditions [Citation25]. However, if the level of unsaturation is expressed in mmol unsaturated carbon bonds/g lipids (which is the key parameter measured by the SPV assay), the variations seem to be disappear between different mammalian lipid membrane samples. This may sound unexpected if we consider that sEV membrane lipids are more saturated than those of the plasma membrane (as well as membranes of the plasma membrane-derived medium/large EVs). Importantly, the membranes of sEVs contain approximately twice as much cholesterol as compared to the plasma membrane [Citation22]. Of note, cholesterol has 2.58 mmol unsaturated carbon bonds/g lipid, which is higher than the average carbon bond/g lipid of a plasma membrane. The increased cholesterol concentration in sEV membranes may thus compensate for the increased level of saturated phospholipids in sEVs. Therefore, the difference between plasma membrane and sEV membranes may disappear because of the increased cholesterol level (if saturation is expressed in mmol unsaturated carbon bond/g lipid, the parameter detected by the SPV assay). In the case of DOPC liposomes used as standards, the unsaturation level is close that of the biological membranes.
Results obtained with the EPIC biosensor system show that the lipid content of a sample provides much more reliable information on EVs as compared to determination of total protein concentration (). Furthermore, we obtained the reported P/L ratio in the case of a commercial LDL sample [Citation22]. Finally, we have obtained comparable results both with the DOPC liposome standard and the commercially available lipid standard ().
In this study, we also used a simple immunoelectron microscopy approach which made it possible to identify EVs based on their protein markers without the need for cryo-electronmicroscopy. This approach provides information about the origin of the detected particles and for EV research it makes immunoelectron microscopy available for a wide range of laboratories.
Our assay can be used virtually in any standard laboratories where a fume hood, a thermo block, and a spectrophotometer are available (Supplementary video S6). It does not require expensive equipment (unlike IR spectroscopy or MS) and is free from aggregates that lipofil fluorescence dyes may form. In spite of its limitations (measuring unsaturated carbon bonds only and not being able to differentiate between lipids and lipoproteins), the optimised assay can be an easy, reliable and quick method for quantification of EVs and standardisation of EV experiments. Even if the SPV assay may not serve as a single stand-alone technique for EV standardisation, it may prove very helpful in combination with either protein or particle measurements and it may provide a novel basic tool for EV standardisation.
Supplemental Material
Download Zip (82.1 MB)Disclosure statement
Patent application of the reported lipid assay is pending. The patent applicant is Semmelweis University. Inventors of the patent application are Tamás Visnovitz, Xabier Osteikoetxea, Edit I Buzás, Barbara Sódar and Zoltán Varga.
Supplementary material
Supplementary data for this article can be accessed here.
Additional information
Funding
Related Research Data
References
- Consortium E-T, Van Deun J, Mestdagh P, et al. EV-TRACK: transparent reporting and centralizing knowledge in extracellular vesicle research. Nat Methods. 2017;14(3):228–12.
- Pocsfalvi G, Stanly C, Vilasi A, et al. Mass spectrometry of extracellular vesicles. Mass Spectrom Rev. 2016;35(1):3–21.
- Yáñez-Mó M, Siljander PRM, Andreu Z, et al. Biological properties of extracellular vesicles and their physiological functions. J Extracell Vesicles. 2015;14(4):27066.
- Maas SLN, de Vrij J, van der Vlist EJ, et al. Possibilities and limitations of current technologies for quantification of biological extracellular vesicles and synthetic mimics. J Control Release. 2015;200:87–96.
- Lötvall J, Hill AF, Hochberg F, et al. Minimal experimental requirements for definition of extracellular vesicles and their functions: a position statement from the international society for extracellular vesicles. J Extracell Vesicles. 2014;3:26913.
- Tkach M, Kowal J, Théry C. Why the need and how to approach the functional diversity of extracellular vesicles. Philos Trans R Soc B. 2018;373:20160479.
- György B, Módos K, É P, et al. Detection and isolation of cell-derived microparticles are compromised by protein complexes resulting from shared biophysical parameters. Blood. 2011;117(4):e39.
- Yuana Y, Levels J, Grootemaat A, et al. Co-isolation of extracellular vesicles and high-density lipoproteins using density gradient ultracentrifugation. J Extracell Vesicles. 2014;3:23626.
- Sódar BW, Á K, Pálóczi K, et al. Low-density lipoprotein mimics blood plasma-derived exosomes and microvesicles during isolation and detection. Sci Rep. 2016;6:24316.
- Melo SA, Luecke LB, Kahlert C, et al. Glypican-1 identifies cancer exosomes and detects early pancreatic cancer. Nature. 2015;523:177–182.
- Osteikoetxea X, Balogh A, Szabó-Taylor K, et al. Improved characterization of EV preparations based on protein to lipid ratio and lipid properties. PLoS One. 2015;10(3):e0121184.
- Mihály J, Deák R, Szigyártó IC, et al. Characterization of extracellular vesicles by IR spectroscopy: fast and simple classification based on amide and CH stretching vibrations. Biochim Biophys Acta. 2017;1859(3):459–466.
- Davidson MM, Nesti C, Palenzuela L, et al. Novel cell lines derived from adult human ventricular cardiomyocytes. J Mol Cell Cardiol. 2005;39(1):133–147.
- Ménard C, Pupier S, Mornet D, et al. Modulation of L-type calcium channel expression during retinoic acid-induced differentiation of H9C2 cardiac cells. J Biol Chem. 1999;274(41):29063–29070.
- Osteikoetxea X, Sodar B, Nemeth A, et al. Differential detergent sensitivity of extracellular vesicle subpopulations. Org Biomol Chem. 2015;13(38):9775–9782.
- Akbarzadeh A, Rezaei-Sadabady R, Davaran S, et al. Liposome: classification, preparation, and applications. Nanoscale Res Lett. 2013;8(1):102.
- Frings CS, Fendley TW, Dunn RT, et al. Improved determination of total serum lipids by the sulfo-phospho-vanillin reaction. Clin Chem. 1972;18(7):673–674.
- Frings CS, Dunn RT. A colorimetric method for determination of total serum lipids based on the sulfo-phospho-vanillin reaction. Am J Clin Pathol. 1970;53(1):89–91.
- Németh A, Orgovan N, Sódar BW, et al. Antibiotic-induced release of small extracellular vesicles (exosomes) with surface-associated DNA. Sci Rep. 2017;7(1):8202.
- Cheng Y-S, Zheng Y, VanderGheynst JS. Rapid quantitative analysis of lipids using a colorimetric method in a microplate format. Lipids. 2011;46(1):95–103.
- Johnson KR, Ellis G, Toothill C. The sulfophosphovanillin reaction for serum lipids: a reappraisal. Clin Chem. 1977;23(9):1669–1678.
- Llorente A, Skotland T, Sylvänne T, et al. Molecular lipidomics of exosomes released by PC-3 prostate cancer cells. Biochim Biophys Acta. 2013;1831(7):1302–1309.
- Kuchinskiene Z, Carlson LA. Composition, concentration, and size of low density lipoproteins and of subfractions of very low density lipoproteins from serum of normal men and women. J Lipid Res. 1982;23(5):762–769.
- Teasdale A, Elder D, Nims RW, editors. ICH quality guidelines: an implementation guide. Hoboken, NJ, USA: Wiley; 2017.
- Record M, Silvente-Poirot S, Poirot M, et al. Extracellular vesicles: lipids as key components of their biogenesis and functions. J Lipid Res. 2018;59(8):1316–1324.