
ABSTRACT
Extracellular vesicles (EVs) from a variety of stem cell sources are believed to harbour regenerative capacity, which may be exploited for therapeutic purposes. Because of EV interaction with other soluble secreted factors, EV activity may depend on the employed purification method, which limits cross-study comparisons and therapeutic development. Raman spectroscopy (RS) is a quick and easy method to assess EV purity and composition, giving in-depth biochemical overview on EV preparation. Hereby, we show how this method can be used to characterise EVs isolated from human liver stem cells and bone marrow mesenchymal stem/stromal cells by means of conventional ultracentrifugation (UC) and size exclusion chromatography (SEC) protocols. The obtained EV preparations were demonstrated to be characterised by different degrees of purity and a specific Raman fingerprint that represents both the cell source and the isolation procedure used. Moreover, RS provided useful hints to explore the factors underlying the functional diversity of EV preparations from the same cell source, thus representing a valuable tool to assess EV quality prior to functional assays or therapeutic application.
Introduction
Extracellular vesicles (EVs) from adult stem cell are believed to harbour regenerative capacity, which may be exploited for therapeutic purposes. Their use as an alternative to cell-based therapy in regenerative medicine is currently under investigation in multiple clinical scenarios spanning from renal failure [Citation1,Citation2] to myocardial infarction [Citation3,Citation4] to musculoskeletal regeneration [Citation5,Citation6] and neurological disorders [Citation7]. The increasing number of papers annually published on the regenerative potential of EVs and the clinical trials started in the field highlight the growing interest in their remarkable translational opportunity as an off-the-shelf therapy. In particular, EVs from human liver stem cells (HLSCs) [Citation8] and bone marrow mesenchymal stem/stromal cells (MSCs) [Citation2,Citation9,Citation10] have found promising application in the regenerative medicine field. Both cell types express markers typical of the mesenchymal lineage and are able to undergo multiple in vitro differentiations. EVs from HLSCs were demonstrated to contribute to liver repair after hypoxia [Citation8,Citation11] and renal recovery after acute kidney injury [Citation1]. On the other hand, paracrine factors of MSCs were shown to contain concomitant regenerative and immunomodulatory functions that act synergistically to accelerate the recovery of patients [Citation12,Citation13].
Despite the handling and safety advantages of the use of EVs in regenerative rehabilitation compared to their cellular counterpart, the main hurdle for their clinical application relies in the paucity of methods to assess the reproducibility of current isolation methods and in lack of quality and purity tests of EV suspensions before use. Indeed, such difficulties have often limited the comparison of results among laboratories leading to conflicting conclusions regarding the actual source of regenerative potential in the secretome of stem cells, about the best purification method to be used, as well as regarding their possible side effects in clinical practice [Citation14–Citation16].
In the last decade, several isolation methods have been described to isolate EVs [Citation17], including the mostly used differential ultracentrifugation (UC) and size exclusion chromatography (SEC), and new methods are continuously being developed. EV purity differs among isolation methods [Citation18], and each method enriches for different subpopulations of EVs, which likely has direct implications for EV functionality [Citation19], data reproducibility and data (mis)interpretation. The growing consciousness about the unpredictable and unverifiable consequences of the isolation method on EV purity and function [Citation14] has motivated the ISEV community to provide recommendations for the characterisation of EV samples [Citation20,Citation21]. However, still no consensus has been found about the most translational and reproducible method for EV production among those working in the regenerative medicine field, limiting therapeutic development.
The identification of a quick and easy method to assess EV purity and composition is crucial to ensure batch reproducibility. Simple measurements on particle counts and protein concentration may give a quick first overview, but they do not provide information on particle biochemical composition and cargo. Likely, such information is required for Food and Drug Administration (FDA) approval of EV-based therapeutics [Citation21].
Raman spectroscopy (RS) is an inelastic light-scattering technique that detects the molecule-specific vibrations of a sample illuminated by a monochromatic laser. Each molecular species has its own unique set of molecular vibrations that, without the use of any label, comprise the series of peaks or bands that determine the Raman spectrum (fingerprint). RS has already been applied to EV characterisation with both diagnostic and basic science purposes [Citation22–Citation24]. In particular, several studies reported the use of RS for single vesicle analysis from cell culture supernatants [Citation22,Citation23] taking advantage of optical tweezers to trap vesicles and to obtain single EV fingerprinting. However, the single vesicle approach was demonstrated to be time-consuming and inefficient because of the weak Raman signals that often need the enhancement mediated by nanostructured substrates or nanoparticles for a more effective analysis [Citation25–Citation27].
Starting from our previous data on RS of EVs from MSCs [Citation28], we provide herein a proof of concept for the use of the bulk characterisation by RS as suitable method to give quick in-depth information on EV purity and composition. We evaluated its ability to detect differences in stem cell–derived EV content in terms of protein-to-lipid and nucleic acids-to-lipid ratio. In parallel, we investigated the effect of the purification method on in vitro pro-proliferative activity of HLSC- and MSC-derived EVs comparing conventional UC protocols with a previously described SEC-based protocol [Citation29]. Our results demonstrate that Raman analysis can reveal differences in EV preparations resulting from the employed isolation procedure, using a 5 min acquisition protocol. This may help to quickly assess EV purity and composition and predict their functionality.
Materials and methods
All of the relevant experimental data have been submitted to the EV-TRACK knowledgebase (EV-TRACK ID: EV180050) [Citation30].
Cell culture and EV isolation
HLSCs were prepared from human cryopreserved normal adult hepatocytes purchased from Lonza (Basel, Switzerland) as described elsewhere [Citation31]. Bone marrow-derived MSCs were also obtained from Lonza, and HK-2 cells were purchased from ATCC. All cells were cultured in their corresponding medium (HLSCs: Alpha MEM with L-glutamine (Lonza), 25% (v/v) Endothelial basal medium supplemented with EGM-MV SingleQuots (Lonza), 10% (v/v) foetal bovine serum (FBS) and 100 U/mL penicillin/streptomycin (Gibco), MSCs: MSCBM hMSC basal medium (Lonza) with MSCGM hMSC SingleQuot Kit (Lonza), HK-2: DMEM high glucose (Euroclone), 1% (v/v) L-glutamine, 10% (v/v) FBS and 100 U/mL penicillin/streptomycin) at 37°C and 5% CO2. For EV production, stem cells were grown to 80–90% confluency, washed once with PBS and cultured for 16 h in EV production medium (RPMI 1640 (Euroclone) with 100 U/mL penicillin/streptomycin (Gibco), ± 0.1 mL medium/cm2). This medium contained a negligible amount of particles when analysed by Nanoparticle Tracking Analysis (see below). Conditioned medium was harvested from cells and centrifuged for 5 min at 300 g at 4°C. The supernatant was centrifuged for 15 min at 2000 g at 4°C and the resulting supernatant was filtered through 0.8 μm syringe filters for the removal of cells and debris. Conditioned medium was then stored at −80°C or processed for EV purification immediately. For EV purification, conditioned medium was equally distributed over tested purification methods. For the 1x UC protocol, conditioned medium was centrifuged at 100000 g for 70 min at 4°C in a type 70 Ti rotor (Beckman Coulter). Pellets were re-suspended and pooled in 150 μL of PBS. For the 2xUC protocol, pellets were re-suspended and pooled in 24 mL of PBS instead, and centrifuged again at 100000 g for 70 min at 4°C. Pellets were re-suspended in 150 μL of PBS. For the SEC protocol, conditioned medium was concentrated to 1–2 mL using 15 mL Amicon ultrafiltration units with 100 kD molecular weight cut-off (MWCO) at 2000 g at 4°C. A HiPrep 16/60 Sephacryl S-400 HR gel filtration column was connected to an ÄKTApurifier chromatography system, and equilibrated with 150 mL of PBS at room temperature. Concentrated medium was injected using a 2 mL loop, and EVs were eluted at 0.7 mL/min with PBS, while 5 mL fractions were collected. EV fractions (35–55 mL) and non-EV fractions (65–145 mL) were collected, filtered through 0.45 μm syringe filters, and concentrated using 15 mL Amicon ultrafiltration units with 100 kD and 30 kD MWCO, respectively, to a final volume of ≈ 200 μL. After EV purification, EVs were re-suspended thoroughly using 1 mL syringes with 26G needles, and centrifuged for 10 min at 5000 g at 4°C to remove any large aggregates, which interfere with quantitation. EV and non-EV preparations were stored at 4°C for maximally 5 days before use in in vitro assays. The remaining samples were store at −80°C after addition of 1% DMSO.
EV quantification and size measurement
EV concentration was quantified using Nanoparticle Tracking Analysis (NTA) using a Nanosight LM10 system or a Nanosight NS300 system with syringe pump. For both systems, EVs were diluted to appropriate dilutions using 0.1 μm filtered PBS, and five movies of 30 s were recorded at camera level 15, while a flow of 30 was applied (NS300 system only). Movies were analysed at detection threshold 6 using NTA 3.2 software, and PBS background (if any) was subtracted for concentration calculations. Protein concentration of samples was determined using a MicroBCA Protein Assay kit (Pierce) according to the manufacturer’s instructions using a calibration curve of bovine serum albumin (BSA).
SDS-PAGE and western blotting
To prepare cell lysates, cells grown in culture flasks were washed with PBS and lysed in 1x RIPA buffer (1% v/v NP-40, 0.5% w/v octyl glucoside, 6.4 mM EDTA, 0.1% w/v sodium dodecyl sulphate (SDS) in PBS) with protease inhibitor cocktail (Sigma-Aldrich, P8340) on ice for 20 min. Lysates were collected with cell scrapers and centrifuged for 10 min at 10000 g and 4°C to remove insoluble debris. Protein concentrations were determined using a MicroBCA Protein Assay kit as described above. EVs in PBS were mixed with 0.1 volume of 10X RIPA buffer and lysed on ice for 10 min. Subsequently, samples were mixed with sample buffer (final concentration: 10% v/v glycerol, 62 mM Tris HCl, 2% v/v SDS). For detection of all proteins except CD63 and flottilin-1, samples were reduced by addition of 8.3 mM dithiothreitol (DTT). Subsequently, samples were heated to 95°C for 10 min and electrophoresed over 4–12% Bis-Tris polyacrylamide gels (Thermo Fisher Scientific). Proteins were electrotransferred to Immobilon-FL polyvinylidene difluoride (PVDF) membranes (Merck Millipore, Amsterdam, The Netherlands) and blocked in 50% v/v Odyssey blocking buffer (LI-COR Biosciences, Leusden, The Netherlands) in Tris-buffered saline (TBS). Antibody incubations were performed in 50% v/v Odyssey blocking buffer (LI-COR Biosciences, Leusden, The Netherlands) in Tris-buffered saline with 0.1% Tween20 (TBS-T). Primary antibodies and dilutions included mouse-anti-Alix (Abcam, clone 3A9, 1:1000), rabbit anti-Calnexin (Origene, cat. no. TA336279, 1:1000), rabbit anti-Calreticulin (Proteintech, cat. no. 10,292–1-AP, 1:1000), mouse anti-CD63 (Abcam, clone MEM-259, 1:1000), rabbit anti-flotillin-1 (Merck Millipore, clone EPR6041, 1:1000), rabbit anti-TSG101 (Abcam, cat. no. ab30871, 1:1000), mouse anti-β-actin (Cell Signalling Technology, clone 8H10D10, 1:1000), rabbit anti-CD9 (Abcam, clone EPR2949, 1:1000), mouse anti-CD81 (Santa Cruz Biotechnology, clone B-11, 1:500). Secondary antibodies were applied at a 1:7500 dilution and included Alexa Fluor 680-conjugated anti-rabbit or anti-mouse antibodies (Thermo Fisher Scientific, cat. no. A-21076 and A-21057, respectively) and IRDye 800 CW anti-mouse or anti-rabbit antibodies (LI-COR Biosciences, cat. no. 926–32212 and 926–32211, respectively). Blots were visualised using an Odyssey Infrared Imager (LI-COR) at 700 and 800 nm.
Electron microscopy
Copper carbon-coated formvar grids were incubated for 20 min on 7 µL of EV solutions at room temperature in a humidified chamber. Grids were washed twice with PBS and were subsequently incubated on 1% glutaraldehyde in PBS for 15 min at room temperature. Grids were washed eight times with Milli-Q water (Merck Millipore) and stained with uranyl-oxalate (pH 7) for 7.5 min. Subsequently, grids were incubated for 5 min on methyl cellulose uranyl-acetate (pH 4) on a cold metal plate, after which embedding solution was carefully drained using filter paper. Grids were imaged using a Tecnai T12 transmission electron microscope (FEI, Eindhoven, The Netherlands).
EV purity assay
The purity of the EV suspensions was determined by means of two different methods. Firstly, a purity score was obtained by calculating the ratio between the number of particles and the total protein content measured by NTA and MicroBCA assay, respectively, on the same sample [Citation18]. Secondly, purity was determined through a previously published colorimetric nanoplasmonic assay [Citation32]. Briefly, EVs from 1x UC, 2x UC and SEC were incubated with gold spherical nanoparticles (6 nM) for 30 min. A UV-Vis Spectrophotometer allowed to measure the ratio between the absorption peak at 520 and 650 nm defined as the aggregation index (AI). The AI represents the quantification of the nanoparticles that remain dispersed in the solution and thus keep the 520 nm absorption peak and the aggregated ones that, once in clusters, shift their absorption peak at 650 nm. Gold nanoparticles remain dispersed in solution if they become coated with proteins, whereas they tend to aggregate when in contact with the vesicle membrane surface, thus being an indicator of the presence of soluble contaminant proteins. The AIs were normalised for the protein concentration and are indicative of the purity level of the sample.
Raman spectroscopy
EVs were analysed by means of Raman microspectroscopy (LabRAM Aramis, Horiba Jobin Yvon S.A.S, Lille, France) following a previously described protocol [Citation28]. Briefly, 5–10 µl drops of EV suspension were deposited on a calcium fluoride slide. All of the measurements were performed on the air-dried drop with 50x objective, 1800 grooves/mm diffraction grating, 400 µm entrance slit, and confocal mode (300 µm pinhole) in the spectral ranges 600–1800 cm−1 and 2600–3200 cm−1. The Raman shift was calibrated automatically using LabSpec 6 software (Horiba) using zero-order line and Si line of a Si reference sample. Taking advantage of Labspec6, baseline correction (sixth order polynomial curve), unit vector normalisation and post-acquisition calibration were carried out on normalised spectra, in order to compensate for autofluorescence, background interference and possible thermal drifts.
Raman spectra were also obtained for purified cholesterol (Chol), sphingomyelin (SM) and phosphatidyl-choline, (16:0/22:6; PC) purchased from Avanti Polar Lipids (Alabaster, AL, USA), and from SNAP-25 (Thermo Fisher Scientific, Waltham, MA, USA) and RNA (miRNA sequence of 21 bp; ATDBio Ltd, Southampton, UK) with the same acquisition parameters in order to compare peaks from reference molecules with those from EV samples.
Raman spectra from EVs were then used to measure the spectroscopic protein-to-lipid (P/L) and nucleic acid-to-lipid (NA/L) ratio, adapting the protocol validated by Mihály for IR spectroscopy [Citation33]. Since proteins, lipids and nucleic acids show distinctive absorption bands by both IR and Raman spectroscopy, we used the Raman spectrum to estimate the P/L and NA/L ratio by dividing the relative intensity of amide I protein band (1600–1690 cm−1) and nucleic acid band (720–800 cm−1) by the lipid-related band (2750–3040 cm−1), respectively [Citation34,Citation35].
Proximal tubular cell proliferation assays
Human proximal tubular cells (HK-2 cells) were seeded at 200–800 cells/well in a 96-well plate and incubated at 37°C. After 24 h, cells were washed with PBS and medium was replaced for HK-2 starvation medium (DMEM high glucose (Euroclone), 1% (v/v) L-glutamine, 100 U/mL penicillin/streptomycin, 1x ITS liquid medium supplement (Sigma-Aldrich), 10 µg/mL hydrocortisone and 25 ng/mL epidermal growth factor (EGF). EVs or PBS were added in triplicates, and cells were incubated for 72 h at 37°C. EVs were added at a dose of 10E4 or 10E5 particles/cell, or concentrated non-EV fractions of SEC purification of HLSC-derived EVs at a similar volume as EVs or 10-fold serial dilutions thereof. As a positive control for proliferation, cells were incubated with normal growth medium instead of starvation medium. Sixteen hours before the end of the incubation, BrdU labelling reagent (Roche) was added at a concentration of 10 μM. After 16 h, BrdU cell proliferation ELISA (Roche) was performed and analysed according to the manufacturer’s instructions.
Statistical analysis
RS data were analysed by descriptive and multivariate statistical analysis by means of Origin2018 (OriginLab, Northampton, MA, USA). Principal component analysis (PCA) of the normalised spectra provided principal components (PCs) that represent differences in the spectra of EVs. Linear discriminant analysis (LDA) was used to discriminate and classify the data. The PCA-LDA attributes to each spectrum of (n-1) canonical variables (n = number of the considered groups) that allow to construct a classifier for the EV groups and to potentially classify unknown spectra. The first two canonical functions are those that reflect the most variance in discriminant model. The smallest number of PC scores was selected for the LDA to prevent data over-fitting. To test the sensitivity, specificity and accuracy of the LDA model, leave-one-out cross-validation was used. One-way ANOVA was performed on PC scores and on proliferation assay results to verify the significance of group differences.
Results
Characterisation of EVs
EVs from HLSC and MSC in vitro cultures were successfully purified using 1x UC, 2x UC and SEC isolation protocols and characterised following the ISEV guidelines (MISEV2018) [Citation36]. NTA analysis showed that particle size distribution did not significantly differ between the three isolation methods, although generally UC-isolated EVs tended to be slightly smaller than those from SEC (mean size 1x UC EVs: 184 ± 33 nm (HLSC) versus 212 ± 34 nm (MSC); 2x UC EVs: 189 ± 27 nm (HLSC) versus 204 ± 42 nm (MSC); SEC EVs: 228 ± 50 nm (HLSC) versus 247 ± 68 nm (MSC), data from at least five isolations, ). Transmission electron microscopy (TEM) analysis () corroborated this data, and showed EVs with similar, “cup-shaped” morphology in all preparations. Furthermore, EVs obtained with all isolation protocols showed a similar expression of canonical EV markers CD81 and CD63 by western blot analysis, but CD9 and β-actin were virtually absent ()). Nuclear and endoplasmic reticulum proteins calnexin and calreticulin, respectively, were also absent in all EV preparations. HLSC EVs were enriched in Alix and TSG101, but these proteins could hardly be detected in MSC EVs. On the contrary, expression of flotillin-1 appeared to be more prominent in MSC EVs compared to HLSC EVs.
Figure 1. Characterisation of EV samples obtained with 1x UC, 2x UC and SEC protocols. a: Representative size distribution obtained using NTA on HLSC and MSC EV samples obtained with 1x UC, 2x UC and SEC protocols. b: Representative transmission electron microscopy (TEM) pictures of HLSC and MSC EVs obtained with all three isolation protocols. Scale bars represent 100 nm. c: Western blots of cell and EV lysates from HLSCs and MSCs. For cell lysates, 10 µg (HLSCs) and 5 µg (MSCs) of protein was loaded. EV lanes contained 2E10 particles (HLSCs) or 0.8E10 particles (MSCs). d: EV purity expressed as the ratio of particles and µg of protein, calculated by NTA and colorimetric microBCA protein assay respectively. e: Aggregation index (AI) of each sample obtained after the nanoplasmonic assay and normalised for the protein concentration as calculated by micro BCA protein assay. * indicates p < 0.05, ** p < 0.01 after one-way ANOVA with Tukey post-hoc test.
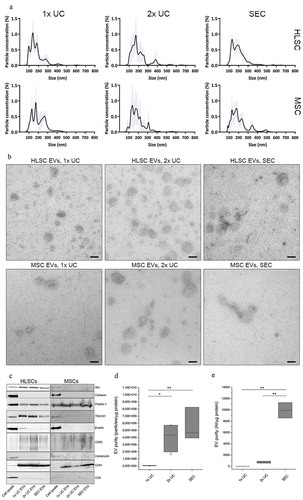
Despite these similar protein expression profiles among EVs from the same cell type but isolated using different isolation protocols, EV preparations differed in their purity expressed as the ratio of particles per microgram of protein, with significantly increased purity obtained with the 2x UC and SEC protocols compared to 1x UC (; ANOVA p < 0.05 for 1x UC vs 2x UC; p < 0.01 for 1x UC vs SEC). These data were confirmed by a nanoparticle-based assay that exploits the property of a colloidal solution of gold nanoparticles to shift from red to blue proportionally with the purity grade of the analysed EV preparation [Citation32,Citation37]. Consistently with observations from other authors [Citation37], the nanoplasmonic assay confirmed that both UC samples contain more exogenous contaminants compared to SEC samples, and thus a significantly lower normalised AI, that is a measure of soluble contaminants coating gold nanoparticles and preventing their aggregation on the membrane surface of EVs (; ANOVA p < 0.01 for 1x UC and 2x UC vs SEC).
Raman analysis of EVs
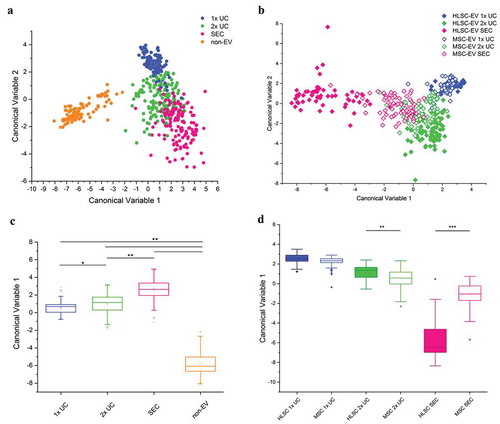
Starting from our previously published protocol [Citation28], we performed a bulk characterisation of EV suspensions from HLSC and MSC in order to evaluate the overall biochemical features of the EV preparations. Spectra were acquired on air-dried drops of EV suspensions, from both cell types, in the spectral range 600–1800 cm−1 and 2600–3200 cm−1. The intensity and signal-to-noise ratio of the spectra revealed a progressive increase going from 1x UC to 2x UC and SEC in both HLSC- and MSC-derived EVs ( and (); Supplementary Figure 1 shows average spectra and their corresponding standard deviations). In particular, the average spectra obtained for SEC EVs were characterised by more defined peaks and less intense contribution of fluorescence and background noise. Nonetheless, the same post-processing procedure (baseline subtraction and unit vector normalisation) was applied to all raw data in order to compare spectra to reference molecules and to proceed with statistical analysis. The 2x UC and SEC spectra of EVs from both cell types showed characteristic Raman bands of proteins (Amide I 1600–1690 cm−1; Amide III 1200–1300 cm−1), lipids (2700–3200 cm−1) and nucleic acids (720–820 cm−1). In particular, beside the bands related to CH and CH2 groups (respectively, centred at 1450 cm−1 and 2940 cm−1) of both proteins and lipids, the main peaks which appeared in all samples were located at 679 cm−1 (nucleic acids), 710–713 cm−1(phospholipids), 928–940 cm−1 (proteins; Pro and Hydroxy-Pro), 1003 cm−1 (Phe); 1055 and 1130 cm−1 (lipids and proteins). Although attenuated in 1x UC samples, bands and peaks specifically associated with nucleic acids (679 cm−1; 788 cm−1; 1115.9 cm−1; 1337 cm−1) were present in all samples. Further peak assignment is reported in Supplementary Table 1. As a reference, in , the Raman spectra of reference molecules of single-stranded RNA, protein (SNAP25 was selected as a reference protein; it is a membrane-bound protein of the SNARE family, known to mediate fusion of cytoplasmic vesicles) and of typical membrane lipids (Chol, SM and PC) are shown. All the obtained Raman data from EV samples were considered for multivariate PCA-LDA analysis in order to verify the ability of RS to distinguish among EVs isolated by means of the three considered isolation procedures, 1x UC, 2x UC and SEC (). Spectra obtained from non-EV fractions obtained during SEC purification were also included in the analysis and used as internal control. In Supplementary Figure 2, the loadings of the first three PCs used to build the classification model are reported. The scatter plot in graphically represents the PCA-LDA results on EV and non-EV spectra, showing that the proposed procedure was capable to distinguish between EV samples and non-EV samples. Each dot is defined by the scores attributed by the multivariate analysis PCA-LDA to each spectrum from HLSC- and MSC-derived EVs and non-EV fractions, i.e. canonical variables 1 and 2 that reflect the most variance in the discriminant model and allow the classification of spectra. Significant differences in the canonical variable 1 for EV and non-EV samples and between the different isolation methods were observed (). After leave-one-out cross-validation, the classification model was demonstrated to reach a good sensitivity and specificity with an overall accuracy in distinguishing EVs from non-EVs of 97%, when spectra of HLSC- and MSC-derived EVs are considered as a whole. We then verified the ability of the method to distinguish between HLSC- and MSC-derived EVs isolated by 1x UC, 2x UC and SEC. The PCA-LDA analysis was, therefore, repeated considering only the EV spectra (). The mean value of canonical variable 1 obtained for HLSC- and MSC-derived EVs was demonstrated to be significantly different between 2x UC (p < 0.01) and SEC (p < 0.001) samples, but no significant difference was obtained between 1x UC samples from the two cell types (). Our results demonstrated that the purity of EV preparations (as assessed by purity and nanoplasmonic assays) correlated with the specificity of the Raman fingerprint (specificity of 99.2% for HLSC-SEC-derived EVs and 94.9% for MSC-SEC-derived EVs versus 1x and 2x UC samples). Hence, the purer the EVs, the more accurate RS could distinguish the cell source.
Figure 2. Raman spectra of EV samples and reference molecules. a-b: Mean Raman spectra obtained on air-dried drop of EV samples isolated by 1x UC, 2x UC and SEC protocols from HLSC (a) and MSC (b) supernatants. All spectra were baseline corrected, aligned and normalised before averaging. c: Representative Raman spectra of reference molecules: cholesterol (Chol), sphingomyelin (SM), phosphatidylcholine (PC), SNAP 25 recombinant protein and single stranded RNA. All spectra were obtained with 532 nm laser line and 30 s of exposure for 2 accumulations.
Figure 3. Multivariate statistical analysis of Raman spectra. PCA-LDA analysis performed on all spectra obtained on EV and non-EV samples from HLSC and MSC (n ≥ 25 per sample). a,b: Scatter plots representing the values obtained for the Canonical Variable 1 and Canonical Variable 2 after LDA. In the classification model shown in (a), spectra from EVs were grouped based on their isolation method and non-EV spectra were analysed as an internal control. In (b), spectra were grouped based on both isolation method and cell source. In both analyses, the first 20 PC scores calculated by means of PCA were used for the LDA. Each dot represents a single spectrum. c,d: Box plots representing the Canonical Variable 1 obtained for every considered group of samples after the corresponding LDA analysis. In (c), the ability of RS to distinguish between EV and non-EV samples and between EV samples isolated by means of different protocols was verified. In (d), the Canonical Variable 1 was considered to evaluate the ability of RS to distinguish between HLSC- and MSC-derived EVs, isolated by different procedures. * indicates p < 0.05, ** p < 0.01, *** p < 0.001 after one-way ANOVA with Tukey post-hoc test.
Spectroscopic protein-to-lipid and nucleic acid-to-lipid ratio
In order to deepen the biochemical constituents that account for the spectral differences among the isolation procedures in both HLSC- and MSC-derived EVs, the spectroscopic P/L was calculated for all samples. P/L and NA/L were calculated for all EV-samples by dividing the relative intensity of amide I protein band (1600–1690 cm−1) and nucleic acid band (720–800 cm−1) by the lipid-related band (2750–3040 cm−1), respectively. As shown in , the P/L value in the samples varied depending on the isolation protocols. Specifically, the P/L obtained for HLSC-derived EV after 1x UC was significantly higher (p < 0.001) compared to 2x UC and SEC isolated EVs from the same cell type. Significant differences were also observed between the P/L of 2x UC and SEC isolated EVs from MSCs, but not between 1x UC and 2x UC EVs from MSCs.
Figure 4. Spectroscopic protein-to-lipid and nucleic acid-to-lipid ratios. Box plots showing the spectroscopic protein-to-lipid ratio (P/L) in (a) and nucleic acid-to-lipid ratio (NA/L) in (b). Differences in the P/L and NA/L values obtained for HLSC- and MSC-derived EVs isolated by different methods were compared. ** indicates p < 0.01, *** p < 0.001 after one-way ANOVA with Tukey post-hoc test.
The same spectroscopic measurement was also performed to verify the NA/L, in order to assess if differences in the nucleic acid load of EVs were detectable between EV preparations with different purity degrees. As shown in , no difference was detected in the NA load among MSC-derived EVs, whereas a significant difference in NA/L was found between HLSC-derived EVs, in particular between 1x UC samples and the purer 2x UC and SEC samples.
Collectively, these data demonstrate that 1x UC and 2x UC protocols result in the co-isolation of more non-EV protein contaminants than the SEC procedure. Furthermore, the Raman data suggested that the HLSC secretome is richer than the MSC-derived secretome in soluble protein factors that can be co-isolated with EVs when undergoing a1x UC isolation protocol. On the contrary, the reported differences in the NA/L do not show a direct correlation with the purity degree of EV samples.
Proliferation assay
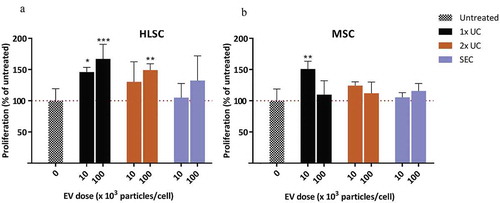
To assess differences in the ability of EVs isolated by means of different purification methods to affect proliferation, the proliferative effects of MSC- and HLSC-derived EVs were tested on in vitro cultures of the proximal tubular cells. After 72 h of treatment with equal numbers of particles as determined by NTA, a pro-proliferative effect of EVs was observed which depended on the purification method used. In particular, EVs isolated using the 1x UC protocol from both MSC- and HLSC-derived conditioned medium dose-dependently affected the proliferation of HK-2 cells (, )). Interestingly, MSC-derived EVs isolated using the 2x UC and SEC protocols did not alter the proliferative rate of HK-2 cells compared with untreated cells. On the contrary, HLSC-derived EVs isolated by means of the 2x UC protocol-induced cell proliferation (p < 0.01), but not their corresponding SEC-isolated EVs. In general, EVs from both stem cell sources promoted proliferation of proximal tubular cells, but these effects decreased with increasing EV purity. Notably, concentrated HLSC-derived non-EV fractions showed strong pro-proliferative effects on proximal tubular cells (data not shown).
Figure 5. Proliferation assay. Effect of HLSC (a) and MSC (b) derived EVs at doses of 10E4 or 10E5 particles/cell on HK-2 cells cultured under serum-free conditions. After 72 h, proliferation was determined using a BrdU cell proliferation ELISA. Proliferation of treated samples was expressed as a percentage of the proliferation of untreated cells. * indicates p < 0.05, ** p < 0.01, *** p < 0.001 after one-way ANOVA with Dunnett’s post hoc test.
Discussion
Secretome-based approaches are increasingly being applied in regenerative medicine. In particular, EVs released by stem cells have been demonstrated to induce regenerative effects via horizontal transfer of proteins, nucleic acids and bioactive lipids to the target cells. Unfortunately, the cellular origin and the isolation method of EVs can affect EV performance. In addition, the complexity of EV preparations in terms of subpopulation enrichment and contamination with other secretome or culture medium-derived products [Citation38,Citation39] can represent an impediment for regulatory approval of regenerative stem cell-derived therapeutics. A cost-effective, robust and straightforward method for the quality and purity control of EVs is thus urgently needed.
We demonstrated herein that RS can be used to characterise stem cell-derived vesicles isolated by means of different protocols and with different purity degrees, obtaining a specific Raman fingerprint that accounts for both the cell source and the isolation procedure used. Our data suggest that the Raman fingerprint of the EVs obtained by 1x UC protocol is strongly influenced by the presence of co-isolated soluble factors that seem to mask the source-related biochemical features of EVs. In our experimental setting, once the isolation procedure allowed the preparation of a pure EV sample, RS revealed its cell-specific spectroscopic features. Our findings support the use of RS for the label-free bulk characterisation of stem cell-derived EVs before their application in vitro and in vivo to verify the reproducibility of the isolation and the presence of co-isolated soluble factors. Hence, it may be used for manufacturing and quality control in the pre-clinical phase of EV-based therapeutics.
Besides providing an overall biochemical characterisation of the sample, the Raman spectrum was also demonstrated to give information about the purity of EVs. For this, we adapted the IR-based spectroscopic method proposed and validated by Mihály and colleagues [Citation33] and verified the ability of the method to reflect differences among EV subpopulations. As previously suggested, the spectroscopic P/L data can become an additional parameter in the routine quality control of EV preparations and can help exploring the observed differences in EV preparations. Although the investigation of the mechanisms underneath the differences in the functionality of stem-cell derived secretome and EVs goes beyond the scope of the present work, our findings support the hypothesis that such differences in the biological effect of the secretome of HLSCs and MSCs can be both related to EV and non-EV components, in accordance with previously reported data demonstrating that not all proteins involved in the regenerative functions of stem cells are released as vesicular cargos [Citation40,Citation41]. As a matter of fact, the 1x UC of HLSC-derived EVs were demonstrated to have a higher P/L ratio compared to purer 2x UC and SEC samples that might be explained by contaminant protein components that are washed out and removed from the EV preparation when the 2x UC and SEC protocols are applied. 1x UC samples were also demonstrated to be more effective in inducing the proliferation of proximal tubular cells, compared to the other EV preparations in a dose-dependent manner suggesting that the pro-proliferative effect of HLSC-secretome might derive from the synergistic action of EVs and soluble factors. However, it should be noted that, although we did not observe a loss of EV integrity in 2x UC and SEC protocols compared to the 1x UC protocol by TEM analysis, changes in EV integrity could partially contribute to the loss of EV activity in preparations of higher purity. Our data are in agreement with previously reported data that demonstrated how conditioned medium can induce kidney regeneration after acute injury [Citation1]. EV-depleted medium reduced but did not abrogate the regenerative effect, even though the latter was not able to induce pro-proliferative effects. Similarly, the low dose of 1x UC MSC-derived EVs was able to induce proliferation in proximal tubular cells, but MSC-derived EV preparations showed less marked differences in the P/L value when comparing the three isolation procedures making us speculate that EVs from MSC are part of a less soluble protein-enriched secretome compared to the HLSC one.
In parallel, the spectroscopic NA/L was calculated following the same protocol, but no significant difference was noted among the considered EV samples. In this regard, we have to mention that this result could be due to the complexity of EV sample that limit the sensitivity of the Raman spectrum in detecting nucleic acids when other molecular entities are more abundant and can partially mask their signal.
Taken as a whole, our data showed the ability of RS to perform a bulk biochemical characterisation of EV preparations and suggested the Raman approach as a rapid (≤ 5 min), label-free method for the investigation of stem cell-derived secretome. Compared to the single vesicle approach that require even more sophisticated instruments and laborious protocols, the proposed procedure for RS can be considered an economical and fast alternative for other-omic approaches, such as differential proteomics [Citation40], which already proved to be a successful tool to characterise the secretome of stem cells. It is worth noting that, beside the above-described advantages, the proposed method has some limitations. Some compounds may mask the EV-fingerprint, thereby limiting proper Raman fingerprinting. For example, in our hands, Raman analysis is not suitable for EV preparations obtained by either commercial precipitation kits containing PEG or other polymers, nor density gradient purification mediated by sucrose, iodixanol or similar moieties that usually remain in the preparation even after the introduction of a washing step.
We hypothesise that Raman analysis can be introduced in the pipeline of stem cell-derived EVs production as quality control and as a tool to identify the best EV-isolation procedure for a specific cell type. Our Raman data should be considered integrative to existing protein-based databases (e.g. Vesiclepedia, Exocarta) and, if further validated, could lead to the generation of online databases that can merge Raman data of EVs from various sources with the existing protein and RNA databases generated by the EV community to foster transparency and reproducibility of data and help comparison and standardisation of methods.
Supplemental Material
Download PDF (292.4 KB)Disclosure statement
No potential conflict of interest was reported by the authors.
Supplemental data
Supplemental data for this article can be accessed here.
Additional information
Funding
Related Research Data
References
- Herrera Sanchez MB, Bruno S, Grange C, et al. Human liver stem cells and derived extracellular vesicles improve recovery in a murine model of acute kidney injury. Stem Cell Res Ther. 2014;5(6):124.
- Bruno S, Grange C, Collino F, et al. Microvesicles derived from mesenchymal stem cells enhance survival in a lethal model of acute kidney injury. Plos One. 2012;7:3.
- Adamiak M, Sahoo S. Exosomes in myocardial repair: advances and challenges in the development of next-generation therapeutics. Mol ther. 2018. DOI:10.1016/j.ymthe.2018.04.024
- Lai RC, Arslan F, Lee MM, et al. Exosome secreted by MSC reduces myocardial ischemia/reperfusion injury. Stem Cell Res. 2010;4(3):214–12.
- De Bari C, Roelofs AJ. Stem cell-based therapeutic strategies for cartilage defects and osteoarthritis. Curr Opin Pharmacol. 2018;40:74–80.
- Vonk LA, van Dooremalen SFJ, Liv N, et al. Mesenchymal stromal/stem cell-derived extracellular vesicles promote human cartilage regeneration in vitro. Theranostics. 2018;8(4):906–920.
- Drommelschmidt K, Serdar M, Bendix I, et al. Mesenchymal stem cell-derived extracellular vesicles ameliorate inflammation-induced preterm brain injury. Brain Behav Immun. 2017;60:220–232.
- Herrera MB, Fonsato V, Gatti S, et al. Human liver stem cell-derived microvesicles accelerate hepatic regeneration in hepatectomized rats. J Cell Mol Med. 2010;14(6B):1605–1618.
- Tomasoni S, Longaretti L, Rota C, et al. Transfer of growth factor receptor mRNA via exosomes unravels the regenerative effect of mesenchymal stem cells. Stem Cells Dev. 2013;22:5.
- Gatti S, Bruno S, Deregibus MC, et al. Microvesicles derived from human adult mesenchymal stem cells protect against ischaemia-reperfusion-induced acute and chronic kidney injury. Nephrol Dialysis Transplantation. 2011;26(5):1474–1483.
- Rigo F, De Stefano N, Navarro-Tableros V, et al. Extracellular vesicles from human liver stem cells reduce injury in an Ex vivo normothermic hypoxic rat liver perfusion model. Transplantation. 2018;102(5):E205–E210.
- Silva AM, Teixeira JH, Almeida MI, et al. Extracellular vesicles: immunomodulatory messengers in the context of tissue repair/regeneration. Eur J Pharm Sci. 2017;98:86–95.
- Nooshabadi VT, Mardpour S, Yousefi-Ahmadipour A, et al. The extracellular vesicles-derived from mesenchymal stromal cells: A new therapeutic option in regenerative medicine. J Cell Biochem. 2018. DOI:10.1002/jcb.26726.
- Tkach M, Kowal J, Thery C. Why the need and how to approach the functional diversity of extracellular vesicles. Philos Trans R Soc London, Ser B. 2018;372:1737.
- Vizoso FJ, Eiro N, Cid S, et al. Mesenchymal stem cell secretome: toward cell-free therapeutic strategies in regenerative medicine. Int J Mol Sci. 2017;18:9.
- Muraca M, Piccoli M, Franzin C, et al. Diverging concepts and novel perspectives in regenerative medicine. Int J Mol Sci. 2017;18(5):17.
- Gardiner C, Di Vizio D, Sahoo S, et al. Techniques used for the isolation and characterization of extracellular vesicles: results of a worldwide survey. J Extracell Vesicles. 2016;5. DOI:10.3402/jev.v5.32945.
- Webber J, Clayton A. How pure are your vesicles? J Extracell Vesicles. 2013;(2). Epub 2013/ 09/07. DOI:10.3402/jev.v2i0.19861
- Mol EA, Goumans MJ, Doevendans PA, et al. Higher functionality of extracellular vesicles isolated using size-exclusion chromatography compared to ultracentrifugation. Nanomed Nanotechnol Biol Med. 2017;13(6):2061–2065.
- Lotvall J, Hill AF, Hochberg F, et al. Minimal experimental requirements for definition of extracellular vesicles and their functions: a position statement from the international society for extracellular vesicles. J Extracell Vesicles. 2014;3:26913.
- Lener T, Gimona M, Aigner L, et al. Applying extracellular vesicles based therapeutics in clinical trials - an ISEV position paper. J Extracell Vesicles. 2015;4. DOI:10.3402/jev.v4.30087.
- Tatischeff I, Larquet E, Falcon-Perez JM, et al. Fast characterisation of cell-derived extracellular vesicles by nanoparticles tracking analysis, cryo-electron microscopy, and Raman tweezers microspectroscopy. J Extracell Vesicles. 2012;1. DOI:10.3402/jev.v1i0.19179
- Smith ZJ, Lee C, Rojalin T, et al. Single exosome study reveals subpopulations distributed among cell lines with variability related to membrane content. J Extracell Vesicles. 2015;4. DOI:10.3402/jev.v4.28533.
- Krafft C, Wilhelm K, Eremin A, et al. A specific spectral signature of serum and plasma-derived extracellular vesicles for cancer screening. Nanomedicine. 2016. Epub 2016/ 12/15. DOI:10.1016/j.nano.2016.11.016.
- Tirinato L, Gentile F, Di Mascolo D, et al. SERS analysis on exosomes using super-hydrophobic surfaces. Microelectron Eng. 2012;97:337–340.
- Lee C, Carney RP, Hazari S, et al. 3D plasmonic nanobowl platform for the study of exosomes in solution. Nanoscale. 2015;7(20):9290–9297.
- Lee C, Carney R, Lam K, et al. SERS analysis of selectively captured exosomes using an integrin-specific peptide ligand. J Raman Spectroscopy. 2017;48(12):1771–1776.
- Gualerzi A, Niada S, Giannasi C, et al. Raman spectroscopy uncovers biochemical tissue-related features of extracellular vesicles from mesenchymal stromal cells. Sci Rep. 2017;7. DOI:10.1038/s41598-017-10448-1.
- Nordin JZ, Lee Y, Vader P, et al. Ultrafiltration with size-exclusion liquid chromatography for high yield isolation of extracellular vesicles preserving intact biophysical and functional properties. Nanomed Nanotechnol Biol Med. 2015;11(4):879–883.
- Van Deun J, Mestdagh P, Agostinis P, et al. EV-TRACK: transparent reporting and centralizing knowledge in extracellular vesicle research. Nat Methods. 2017;14(3):228–232.
- Bruno S, Grange C, Tapparo M, et al. Human liver stem cells suppress T-Cell Proliferation, NK activity, and dendritic cell differentiation. Stem Cells Int. 2016. DOI:10.1155/2016/8468549.
- Maiolo D, Paolini L, Di Noto G, et al. Colorimetric nanoplasmonic assay to determine purity and titrate extracellular vesicles. Anal Chem. 2015;87(8):4168–4176.
- Mihaly J, Deak R, Szigyarto IC, et al. Characterization of extracellular vesicles by IR spectroscopy: fast and simple classification based on amide and C-H stretching vibrations. Biochim Biophys Acta, Biomembr. 2017;1859(3):459–466.
- Rygula A, Majzner K, Marzec KM, et al. Raman spectroscopy of proteins: a review. J Raman Spectroscopy. 2013;44(8):1061–1076.
- Czamara K, Majzner K, Pacia MZ, et al. Raman spectroscopy of lipids: a review. J Raman Spectroscopy. 2015;46(1):4–20.
- Théry C, Witwer KW, Aikawa E, et al. Minimal information for studies of extracellular vesicles 2018 (MISEV2018): a position statement of the international society for extracellular vesicles and update of the MISEV2014 guidelines. J Extracell Vesicles. 2019;8(1):1535750.
- Paolini L, Zendrini A, Di Noto G, et al. Residual matrix from different separation techniques impacts exosome biological activity. Sci Rep. 2016;6. DOI:10.1038/srep23550.
- Lehrich BM, Liang Y, Khosravi P, et al. Fetal bovine serum-derived extracellular vesicles persist within vesicle-depleted culture media. Int J Mol Sci. 2018;19:11.
- Wei ZY, Batagov AO, Carter DRF, et al. Fetal bovine serum RNA interferes with the cell culture derived extracellular RNA. Sci Rep. 2016;6. DOI:10.1038/srep31175
- Niada S, Giannasi C, Gualerzi A, et al. Differential proteomic analysis predicts appropriate applications for the secretome of adipose-derived mesenchymal stem/stromal cells and dermal fibroblasts. Stem Cell Int. 2018. Article ID 7309031. DOI:10.1155/2018/7309031
- Qin Y, Wang L, Gao Z, et al. Bone marrow stromal/stem cell-derived extracellular vesicles regulate osteoblast activity and differentiation in vitro and promote bone regeneration in vivo. Sci Rep. 2016;6. DOI:10.1038/srep21961