
ABSTRACT
Features like small size, low refractive index and polydispersity pose challenges to the currently available detection methods for Extracellular Vesicles (EVs). In addition, the lack of appropriate standards to set up the experimental conditions makes it difficult to compare analyses obtained by different technical approaches. By modifying synthetic nanovesicles with recombinant antigenic regions of EV-enriched tetraspanins, we aimed to construct an EV-mimetic that can be used as a suitable standard for EV analyses.
To this end, the sequences of the large extracellular loops of the tetraspanins CD9, CD63 and CD81 were tagged with a target sequence for the biotin ligase BirA, and co-transformed with a BirA expression plasmid into Escherichia coli. GST fusion proteins were then isolated by affinity chromatography and released using thrombin. Biotinylated recombinant tetraspanin-loops were then coupled to (strept)avidin-coated synthetic nanovesicles and analysed and characterised by Dot-blot, Western-blot, Nanoparticle Tracking Analysis, Flow Cytometry and Transmission Electron Microscopy.
With this method, we were able to efficiently produce tetraspanin-domain decorated nanovesicles that share biophysical properties with natural EVs, can be detected using specific antibodies against common EV markers such as tetraspanins, and can be used as robust reference materials for detection techniques that are often used in the EV field.
Introduction
Extracellular Vesicles (EVs) are released by most cell types, either by fusion of multivesicular bodies with the plasma membrane at the end of the endocytic recycling pathway (usually named exosomes), or by direct budding form the plasma membrane (commonly called microvesicles or ectosomes) [Citation1]. EVs are emerging as a potent mechanism of intercellular communication because of their ability to act as a vehicle for the exchange of genetic and protein material between cells [Citation1]. In the last two decades, EVs have become the focus of many studies because of their putative use as non-invasive biomarkers and their potential in bioengineering and clinical applications [Citation2]. However, current quantitative and qualitative detection methods for EVs are hindered by intrinsic features of EVs, such as small size, low refractive index and polydispersity. These factors together with the lack of well-characterised and reproducible Reference Materials (RM) make it difficult to compare results between samples and different laboratories [Citation3,Citation4].
We therefore aimed to design an Extracellular Vesicle-Mimetic (EVMs) based on the use of niosomes as a scaffold of self-assembled nanovesicles. This strategy can thus be considered either a fully synthetic-bottom-up EV, or a semi-synthetic artificial EV with surface modifications following a classification recently proposed [Citation5]. Niosomes are obtained by hydration of non-ionic surface-active agents with appropriate amounts of cholesterol and other amphiphilic molecules [Citation6]. Niosomes, similarly to liposomes, display a bilayer structure, nanometric scale size, a refractive index comparable to that of EVs [Citation7,Citation8]. Additionally, niosomes can be modified through bioconjugation processes with proteins and fluorescent dyes [Citation5]. Furthermore, niosomes have lower production costs and are stable for longer periods of time when compared to liposomes, two characteristics of special importance for a RM development [Citation6,Citation9]. The use of synthetic rather natural EVs can offer advantages like a higher and more controllable production yield important for scale-up applications [Citation10].
The tetraspanins CD9, CD63 and CD81 are among the most abundant membrane proteins on natural EVs and are routinely used as markers for their characterisation. Within the tetraspanin protein structure, the large extracellular loop (LEL) is the most antigenic region, and is where the majority of available anti-tetraspanin antibodies bind [Citation11,Citation12]. Since the production of recombinant transmembrane domains is highly complex, we took the alternative approach of using only the immunogenic LEL domain of the tetraspanins for the construction of the EVMs. In addition, we decided to take advantage of the high-affinity interaction between (strept)avidin–biotin molecules to decorate the surface of the niosomes with these recombinant large extracellular tetraspanin loops. This strategy shows that these nanovesicles can serve as adaptable EVMs and can be successfully used as a novel RM for EV research. They can be isolated and purified by various EV-isolation methods and analysed on multiple platforms used within the EV research field, including Nanoparticle Tracking Analysis (NTA), Electron Microscopy (EM) and Flow Cytometry (FC).
Materials and methods
Antibodies
Primary antibodies anti-CD9 (clones VJ 1/10 and VJ1/20), anti-CD63 (clones TEA 3/10 and TEA 3/18 and H5C6), anti-CD81 (clone Eat2) mAbs have been previously described [Citation13] and were purchased from Immunostep or BD Bioscience either unconjugated or as PE-conjugates. Anti-CD81 (clone 5A6) mAb was kindly provided by Dr Shoshana Levy (Stanford, USA).
Synthetic nanovesicles
Commercially available niosomes (Nio-N-GF-MAL) were purchased from Nanovex Biotechnologies (Asturias, Spain). According to the manufacturer’s description, these niosomes are composed of a formulation of lipids and non-ionic surfactants (Span 60 (Sorbitane monostearate), Tween 60 (Polyoxyethylenesorbitan monolaurate), Cholesterol and DSPE-2000-MAL (1,2-distearoyl-sn-glycero-3-phosphoethanolamine-N-[maleimide(polyethylene glycol)-2000] (ammonium salt)) with the following molar ratios: 0.5:0.5:1:0.01) that were hydrated with 2 mL PBS 20 mM pH 7 at 60°C. To generate fluorescent niosomes, 1,2 dioleoyl-sn-glycerol phosphoethanolamine modified with carboxyfluorescein molecules was included in the formulation. The mixture is then shaken for two minutes and sonicated using a bath sonicator for 15 min to produce nanovesicles with a size range between 50 and 300 nm.
Surface modification of niosomes was also performed by Nanovex Biotechnologies. The bioconjugation with streptavidin (SA) or avidin was performed through thiol activated groups within the molecules of the bilayer, thereby generating a covalent bond between (strept)avidin molecules and the niosomes. One milligram of a sulfhydryl-containing protein (SA or avidin) was dissolved in a 4 mL niosome solution and incubated for 2 h after previous deprotection of the reactive groups of the SATA activated strept(avidin) with hydroxylamine-HCL. To remove residual hydroxylamine and deacylation products, samples were desalted by gel filtration using Sephadex G-75. The bioconjugated niosomes were purified using a column of Agarose 6%. The amount of unbound (strep)avidin was measured by a Bradford assay in the filtrated fraction. Final niosome solutions were analysed using Dynamic Light Scattering (DLS) and NTA to determine their size and concentration, respectively. The change in the Z potential of the bioconjugated niosomes confirmed the presence of (strep)avidin on the surface of niosomes. In the niosome stocks used in the manuscript the amount of (strept)avidin conjugated to the surface was reported to be 232 μg/mL of avidin in the fluorescent niosomes and 224 μg/mL of SA in non-fluorescent niosomes.
Construction of recombinant biotinylated tetraspanin LEL expression plasmids
AviCD9LELAvi, AviCD63LELAvi and AviCD81LELAvi sequences were cloned into the pGEX-4T2 expression vector. DNAs sequences corresponding to the LEL of CD9, CD63 and CD81 tetraspanins were amplified by PCR using master mix solution 2X (Promega), 100 ng of template DNA (CD9-, CD63- or CD81-GFP) constructs [Citation14,Citation15] and the primers () that included the recognition sequences for BirA and restriction sites for XhoI and BamHI. Products of PCR amplification were inserted in the TOPO® TA vector (Invitrogen) and transformed into supercompetent bacteria by heat shock. Ampicillin-resistant clones were expanded and sequenced. Validated clones were digested with XhoI and BamHI and ligated in the reading frame of GST in the final vector pGEX-4T2. Products of ligation were verified by restriction pattern with XhoI and BamHI.
Table 1. Oligonucleotides used for PCR amplification of different human tetraspanin LELs. The restriction sites for XhoI (green) and BamHI (blue), as well as the recognition sites for the biotin ligase enzyme or AviTag (red) were inserted at N- and C-terminus during the PCR amplification.
Expression and purification of recombinant tetraspanins
Protease-deficient supercompetent Escherichia coli BL21 cells were co-transformed with AviCD9 LELAvi-pGEX-4T2, AviCD63 LELAvi-pGEX-4T2 or AviCD81 LELAvi-pGEX-4T2 constructs together with a pBirAcm, an engineered pACYC184 plasmid with an IPTG inducible BirA gene to over-express the biotin ligase (isolated from the K12 E. coli strain AVB99, Avidity LLC). Colonies were selected and grown overnight in 50 mL of Luria-Bertani (LB) medium containing 0.1 mg/mL ampicillin (Normon) and 0.1 mg/mL chloramphenicol (Sigma). The seed culture was then transferred into 200 mL of fresh LB medium with antibiotics and the indicated concentration of D-Biotin (Thermo Scientific) and cultured for 3 h at 37°C and 200 rpm. Isopropyl-beta-D-thiogalactopyranoside (IPTG, Sigma) was then added to a final concentration of 0.3 mM and bacterial culture continued for 2 h at 37°C and 200 rpm.
Cells were harvested by centrifugation at 4700 g for 15 min at 4°C. The bacterial pellet was resuspended in 10 mL of the indicated lysis buffers (), supplemented with protease inhibitors cocktail (Roche) and sonicated as indicated. Bacterial lysates were centrifuged at 18,000 g for 30 min at 4°C. Supernatant was collected and GST fusion proteins were purified by affinity chromatography using glutathione-sepharose 4B (GE Healthcare). Proteins were cleaved and eluted from GST using site specific protease thrombin (GE Healthcare). Benzamidine-sepharose (Sigma-Aldrich) was used for the removal of thrombin as previously described in detail [Citation16]. Protein concentration of the preparations was measured with Micro BCA Protein Assay Kit (Pierce Company) following the manufacturer’s instructions.
Table 2. Different cell lysis conditions used in the optimisation of the production of recombinant tetraspanin LELs.
Samples along the purification process were boiled in Laemmli buffer and resolved by 10% or 12% SDS-PAGE. Gels were incubated with Coomassie Brilliant Blue for 5 min, followed by de-stain solution for 10 min.
For generation of non-biotinylated CD9LEL similar procedures were followed using CD9EC2-GST construct [Citation15].
Western blot and dot blot analysis
For western blot analysis, samples were loaded onto 10% or 12% polyacrylamide gels.
Where indicated, AviCD9LELAvi, as well as a CD9LEL constructs that were not tagged with the Avi sequence were produced and 6 μL of each recombinant peptide was incubated with SA (Nanovex Biotechnologies) for 15 min at RT using two different ratios (3-fold molar excess and 10-fold molar excess of SA/tetraspanin LEL). Samples were boiled in Laemmli buffer and resolved in a polyacrylamide gel. After electrophoresis, the proteins were transferred to a PVDF membrane (Biorad).
For dot blot analysis, samples were spotted onto a 0.22 μm pore size nitrocellulose membrane (GE Healthcare) and let to dry.
Membranes were subsequently blocked with 5% non-fat dry milk and blotted with ABC Peroxidase Standard Staining Kit (Thermo Fisher Scientific) for 30 min at RT or incubated overnight with primary antibodies at 4°C in a humidified chamber. After washing, membranes were probed with secondary antibody anti-mouse horseradish peroxidase (Thermo Fisher Scientific) and Enhanced chemiluminescent (ECL) HRP substrate (Thermo Scientific). Chemiluminescence signal was detected using the LAS4000 mini Image System analyser from Fujifilm and software ImageQuant-TL (GE Healthcare).
Immunofluorescent analysis
100 μL of biotinylated CD9, CD63 and CD81 LELs were incubated with 5 μL of SA-sepharose beads (GE Healthcare) for 30 min. Primary antibodies against the three different tetraspanins (hybridoma supernatants) were added and incubated overnight at 4°C. Next, samples were washed three times with TBS-T and incubated for 30 min at 4°C with an AlexaFluor 488 goat anti‐mouse IgG secondary antibody (Invitrogen). Samples were washed three times with TBS-T and mounted on coverslips with fluoromount (Thermo Fisher). Confocal images were obtained with a Leica TCS-SP5 confocal scanning laser microscope and Leica confocal LAS software.
Coupling of recombinant tetraspanins to nanovesicles
CD9, CD63 and CD81 biotinylated recombinant tetraspanin-LEL were incubated with (strept)avidin-coupled niosomes. Incubation of recombinant tetraspanins and nanovesicles was performed ON in a tube rotator at RT. Unbound LEL peptide was removed by Size Exclusion Chromatography (SEC). Sepharose CL-2B (GE Healthcare) was stacked in a 1 mL syringe (BD, Plastipak) and equilibrated using 0.22 μm filtered PBS, thereby allowing the Sepharose to reach a final matrix length of 6 cm at a diameter of 0.75 cm. Gravity elution was next performed and 20 sequential fractions of two drops (approximately 100 μL) were collected for each sample.
Natural EVs
Human breast carcinoma cell-derived EVs were isolated by SEC from conditioned media of MCF7 cell cultures as described previously [Citation17]. Mouse dendritic-cell derived EVs were isolated from conditioned cell culture medium by differential ultracentrifugation as detailed in [Citation18].
Nanoparticle tracking analysis (NTA)
Size distribution and concentration of nanovesicles was determined by measuring the rate of Brownian motion using a NanoSight LM10 system (Malvern) equipped with 405 nm laser. For each sample, at least two videos of 30 s were recorded and analysed with a detection threshold 10. Data was obtained using a shutter speed of 345 and a camera gain of 1.00. The measurements were performed and monitored at ambient temperature. Recorded videos were analysed with NTA Software version 2.2. Samples were diluted in PBS until particle concentration was within the dynamic range of NTA Software.
Electron microscopy (EM)
For cryo-EM, niosome samples were directly adsorbed onto glow-discharged holey carbon grids (QUANTIFOIL). For vitrification, grids were blotted at 95% humidity and rapidly plunged into liquid ethane with VITROBOT (Maastricht Instruments BV).
For immuno-EM, samples were fixed in 2% paraformaldehyde in PBS and deposited onto Formvar/carbon-coated EM grids, previously pre-coated with Poly-L-lysine (MW of 15,000–30,000 kDa, Sigma Aldrich) as described before [Citation19]. The niosome-coated grids were washed with PBS and finally blocked with PBS/1% BSA for 15 min. Blocked grids were transferred to a drop of PBS/0.1% BSA containing primary antibody and incubated ON at 4°C in a humidified chamber. The grids were washed on a drop of PBS, transferred to a drop of PBS/0.1% BSA containing secondary antibodies conjugated to 15 nm gold-particles (Aurion) and incubated for 2 h at RT in a humidified chamber. Grids were washed with dH2O and fixed with 1% glutaraldehyde, washed with H2O and stained with 2% uranyl acetate for 1 min at RT. Afterwards, samples were vitrified as described above and visualised using a JEM-2200FS Field Emission TEM equipped with a digital camera (JEOL).
Bead-assisted flow cytometry
Bead-assisted bulk FC analysis of niosome or EV samples was performed as previously described [Citation17]. Briefly, samples were incubated with aldehyde/sulphate-latex beads (4 µm from Invitrogen) and sequentially incubated with primary antibodies (hybridoma supernatants) and secondary anti-mouse IgG conjugated to Alexa 647 (Life Technologies). Samples were analysed using a FACS Canto II (Becton Dickinson) and FlowJo software (version X Tree Star).
High-resolution flow cytometry
For immunocharacterisation of decorated niosomes, samples were incubated for 1 h at RT with phycoerythrin (PE)-conjugated monoclonal antibodies. Antibodies used were: anti-CD9PE (clone VJ 1/20, Immunostep) and anti-CD63PE (Clone H5C6, BD Bioscience) at concentrations suggested by the manufacturer. Sucrose density gradient were used for the removal of free unbound dye [Citation20]. Briefly, bottom-up density gradient floatation was performed by mixing samples with 1.5 mL 2.5 M sucrose. Samples were next overlaid in SW40 tubes (Beckman-Coulter) with fifteen 700 μL sucrose fractions of decreasing molarity (2.0 M until 0.4 M). Gradients were then subjected to ultracentrifugation for 16 h at 200,000g (SW40 rotor; 4°C; 39,000 rpm; RCF average 192,072g; RCF max 270,519g; κ-factor 144.5). Twelve fractions of 1 mL were collected from which the density was determined by refractometry using an Atago Illuminator (Japan). Prior to acquisition, sucrose samples were diluted 20 times in PBS. As described previously, qualitative and quantitative analysis of niosome-containing samples was then performed using a jet-in-air-based BD Influx™ flow cytometer (Becton Dickinson) optimised for the detection of submicron-sized particles [Citation20,Citation21]. Data obtained was analysed using FlowJo Software version X.
Statistical analysis
Data analysis was performed using GraphPad Prism version 6.0 (GraphPad Software Inc). Error bars represent the standard deviation (SD).
Results and discussion
Production of recombinant avilelavi proteins
For the production of recombinant human tetraspanin LEL domains we chose three members that are widely employed in EV research, namely CD9, CD63 and CD81. Sequences corresponding to their LELs were amplified by PCR. The 15 aminoacid sequence of the AviTag peptide, that allows recognition and site-specific biotinylation by the highly specific E. coli biotin ligase A enzyme (BirA) [Citation16], was then introduced at both N- and C-term ends () together with restriction sites for subcloning into pGEX-4T2 vector in reading frame with the glutathione-S-transferase (GST). The plasmids coding for the Avi-tagged LEL of either CD9, CD63 or CD81 (AviCD9 LELAvi-pGEX-4T2, AviCD63 LELAvi-pGEX-4T2 or AviCD81 LELAvi-pGEX-4T2) were co-transformed into E. coli (BL21 DE3) cells, together with a plasmid encoding for BirA enzyme. Cells were grown and selected in the presence of antibiotics (ampicillin and chloramphenicol). Cultures were supplemented with D-Biotin and IPTG, to induce both GST and biotinylation.
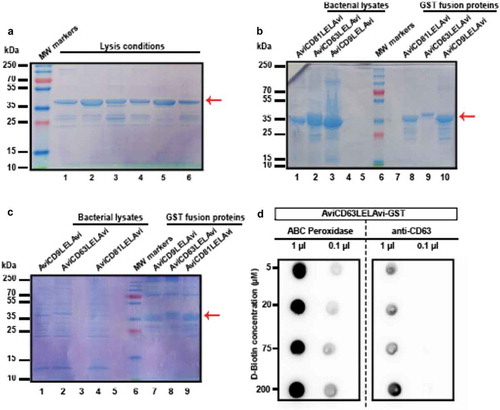
Bacterial lysis was optimised by testing six different conditions (). These supernatants were affinity-purified with glutathione-sepharose and analysed by SDS-PAGE and Coomassie Blue staining (). Fusion protein recovery was greatly improved by increasing Sarkosyl concentration to 20% (lysis condition 7 in ; ). To determine biotin concentration for maximal biotinylation of the recombinant tetraspanin, AviCD63LELAvi transformed E. coli were cultured in the presence of different concentrations of D-biotin. Total bacterial lysates were analysed by dot-blot to assess recombinant tetraspanin production, as well as biotinylation. When normalised to the total load of protein detected with anti-CD63 mAb, we found that biotinylation efficiency (as detected with ABC Peroxidase) slightly increased with 20 µM of biotin when compared to the 5 µM condition (ratio of ABC signal/anti-CD63 signal was 1.4 when 5 µM was set to 1). 20 µM of D-biotin was the concentration of choice for all further experiments, since no major differences were observed when the biotin concentration was increased to either 75 µM (ratio of 1.5) or 200 µM (ratio of 1.3) ().
Figure 1. Optimisation of the purification process of the recombinant biotinylated tetraspanin-LEL peptides. (a) Cell lysis optimisation. Six different lysis conditions (indicated in ) were tested. 10 µL of the obtained AviCD63LELAvi-GST coupled to Glutathione-sepharose beads were lysed in Laemmli buffer, subjected to SDS-PAGE and analysed by Coomassie Blue staining. (b) Efficiency of recombinant protein recovery. Non-soluble fraction of the bacterial lysates obtained with lysis condition 2, as well as the recombinant affinity purified AviLELAvi-GST proteins, were tested by SDS-PAGE to check the recovery of GST fusion proteins from E.coli. Lanes 1–3: Bacterial lysates. Lanes 8–10: 10 µL of LELs-GST-Glutathione-sepharose. (c) Final optimisation of lysis conditions. Total bacterial lysates obtained using condition 7, as well as the recombinant affinity purified AviLELAvi-GST proteins were analysed by SDS-PAGE. Lanes 1,2,4: Non-soluble bacterial lysates. Lanes 7–9: 10 µL of LELs-GST-Glutathione-sepharose obtained. Red arrows indicate the expected molecular weight for the recombinant fusion tetraspanins, which is 37 kDa. (d) Optimisation of D-biotin labelling. Dot Blot analysis using an ABC Peroxidase Standard Kit and anti-CD63 specific antibody (clone TEA 3/10) for detection of the indicated volumes of bacterial cell lysates from AviCD63LELAvi-GST-transformed cultures grown in the presence of the indicated biotin concentrations.
Purification of the biotinylated GST fusion recombinant LEL-tetraspanins was then performed by affinity chromatography. First, the highly specific interaction between GST and glutathione was employed to capture proteins of interest on sepharose beads. In a second step, proteins were cleaved and eluted from GST using the site-specific protease thrombin. Next, thrombin was removed using benzamidine-sepharose beads (). Each sequential step of the production of the recombinant AviLELAvi peptides was evaluated by SDS-PAGE analysis and Coomassie Blue staining. These analyses clearly showed that the recombinant GST-LEL is greatly enriched after affinity purification with glutathione-sepharose beads (bands at 37 kDa in lanes 1–3 and 2–4, respectively (). Cleavage with thrombin was complete, as only the 23 kDa band of GST could be detected in lanes 5–7 (). Because the cleaved tetraspanin-LELs are difficult to detect by Coomassie Blue staining due to their small size (a faint band can be appreciated for CD9LEL in lane 8, red arrow in ), Western Blot analyses were used to confirm both the biotinylation and purity of the final recombinant CD9, CD63 and CD81 products (). The molecular weight detected for these peptides corresponds to the 12–15 kDa expected for the LEL of tetraspanins plus the two AviTags (, red arrows, lanes 5–7).
Figure 2. Production of recombinant tetraspanin-LELs. (a) Schematic illustration of the affinity chromatography method used for recombinant tetraspanin LELs purification using glutathione-sepharose beads, thrombin and benzamidine-sepharose beads. (b) Follow up of recombinant tetraspanin LELs production. The purification process was followed by Coomassie Blue staining after SDS-PAGE separation. Lanes 1–3: Samples of 10 µL Glutathione-sepharose beads before Thrombin treatment. Lanes 5–7: 10 µL of Glutathione-sepharose beads after treatment with Thrombin. Lanes 8–10: 20 µL of each supernatant after benzamidine-sepharose removal of Thrombin. Red arrows indicate the final LEL biotinylated product. (c) Western blot analysis of recombinant tetraspanin LELs. Samples were subjected to SDS-PAGE and detected by chemiluminiscence using Avidin-Biotin-HRP Complexes. Lanes 2–4: Samples of 10 µL of AviLELAvi-GST of CD9, CD63 and CD81 coupled to Glutathione-sepharose. Lanes 5–7: Samples of 20 µL of AviCD9LELAvi, AviCD63LELAvi and AviCD81LELAvi. Lanes 8–10 Samples of 10 µL of Glutathione-sepharose beads after Thrombin treatment. Red arrows indicate the final LEL biotinylated product. (d) Dot blot immunodetection of recombinant tetraspanin LELs. The final products, biotinylated CD9, CD63 and CD81 LELs, were detected by Dot-blot using ABC Peroxidase Standard Staining Kit and monoclonal antibodies directed against CD9 (clone VJ 1/20), CD63 (TEA 3/10) and CD81 (5A6).
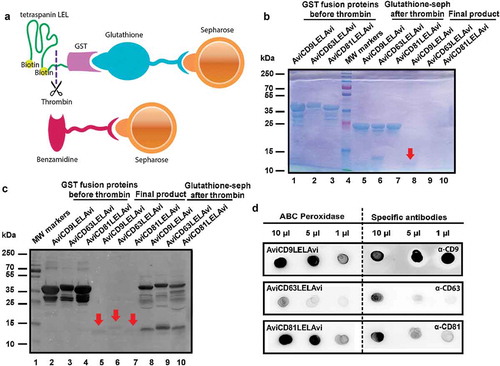
Dot Blot analysis, performed using tetraspanin specific monoclonal antibodies or the Avidin-Biotin HRP Complex (ABC Peroxidase), showed strong positive reactions, indicating that the recombinant LEL-tetraspanins were biotinylated and maintained immunogenicity by proper folding (). Within the final product, MicroBCA assays revealed a higher yield for CD9 and CD81 (112.3 ± 16.4 and 106.2 ± 14.3 μg/mL) recombinant peptides than for CD63 (53.8 ± 14.8 μg/mL mean ± SD from five independent determinations). Since the LEL of CD63 contains two sites for N-glycosylation, the absence of this post-translational modification may be affecting the protein stability and final yield, although it does not seem to impair antibody recognition.
To assess the degree of biotinylation of the recombinant tetraspanin LELs, we produced and purified AviCD9LELAvi, as well as an untagged CD9LEL protein. Recombinant LELs were incubated with SA and analysed by Western blot using an anti-CD9 antibody (). When the Avi-tagged biotinylated CD9 LEL was incubated with SA, the majority of CD9 signal was found at higher molecular weights (, lanes 3–4), due to the binding of one or two LEL peptides to the 52.8 kDa SA molecule. As expected, no binding between SA and the untagged CD9LEL could be observed (, lanes 5–6), proving that the interaction between the tetraspanin LEL and SA molecules was mediated by biotin. Different amounts of SA (3-fold molar and 10-fold molar excess) were tested but showed no improved binding of CD9LEL to SA (, lane 4). However, a small amount of Avi-tagged LEL peptide remained unbound (, lanes 3–4), suggesting that, although highly efficient, complete biotinylation was not achieved. Interestingly, the signal of the SA-bound recombinant peptide was much stronger when compared to the signal obtained when only the soluble peptide was analysed (, lane 2). This suggests that, even though the soluble peptide can be recognised by the CD9 antibody, the recognition is greatly enhanced upon binding to SA. Since the LEL domain is biotinylated at both its C- and N-terminus, binding to the tetrameric SA may help to acquire a three-dimensional conformation that more closely resembles that of the native tetraspanin molecule. Indeed, binding of most anti-tetraspanin mAbs seems to be conformation-dependent since reactivity is lost under reducing conditions.
Figure 3. Biotinylation efficiency of recombinant tetraspanins. (a) Samples were run on 12% SDS-PAGE and CD9 was visualised using a specific monoclonal antibody (clone VJ 1/10) followed by a secondary goat anti-mouse antibody conjugated to HRP. Lane 1: 20 µL of non-biotinylated CD9LEL. Lane 3: 20 µL of AviCD9LELAvi. Lanes 3–4: 20 µL of AviCD9LELAvi and Streptavidin with a 3-fold molar excess and 10-fold molar excess, respectively. Lanes 5–6: 20 µL CD9LEL and Streptavidin with a 3-fold molar excess and 10-fold molar excess, respectively. (b) Representative images of streptavidin beads incubated with recombinant tetraspanins (lower panels) and stained with specific mAbs and secondary antibodies. Primary antibodies used were anti-CD9 (VJ 1/20), -CD63 (TEA 3/10) and -CD81 (5A6). Upper panels show negative controls obtained either by staining streptavidin beads not loaded with recombinant tetraspanins with both primary and secondary antibodies (upper pannel, right) or streptavidin beads incubated with AviCD9LELAvi recombinant tetraspanin and stained with unmatched anti-CD63 (TEA3/10) primary antibody. An optical section acquired with a Leica TCS-SP5 confocal microscope is shown.
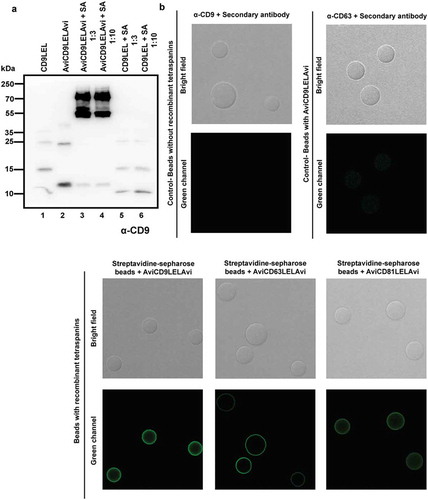
As a proof of concept to show that our biotinylated recombinant proteins bind to SA and can be detected by a variety of immunoassays, we incubated biotinylated recombinant tetraspanins with SA-coated sepharose beads, and stained these beads for immunofluorescence analysis using confocal microscopy. A bright specific signal could be observed on the beads when biotinylated recombinant CD9-, CD63- and CD81-LELs were incubated with SA-beads and detected with their corresponding specific antibodies (, lower panels). No signal was observed when uncoated SA-beads were stained or when AviCD9LELAvi-coated microspheres were stained with a primary antibody against CD63 tetraspanin (, upper panels).
Decoration of synthetic nanovesicles with biotinylated recombinant tetraspanins
Synthetic niosomes, surface-bioconjugated to (strept)avidin molecules, and either fluorescently labelled or not, were incubated with the biotinylated recombinant tetraspanin LEL peptides. Although the binding of biotin to (strep)avidin is known to be a fast process in solution, after immobilisation onto a surface the kinetics of the process can be more complex and therefore longer incubation times may be necessary for optimal coupling [Citation22–Citation24]. The coupling process was therefore performed with an estimation of two AviLELAvi molecules (containing two biotin molecules each) per (strept)avidin molecule (that have four potential biotin binding-sites available), during an overnight incubation in a tube rotator at RT. SEC was used to remove the unbound LEL tetraspanins. After SEC, 20 fractions were collected from each sample and analysed by dot blot to determine in which fractions the decorated nanovesicles eluted. Avidin–Biotin–HRP Complex (ABC peroxidase) would bind to both the free biotin-binding sites on the (strept)avidin, as well as to free biotin molecules on the tetraspanin LEL. So, to unequivocally evaluate the presence of recombinant tetraspanins on the niosome-containing fractions, the dot blots were also developed using specific monoclonal antibodies against each tetraspanin. Dot-blot analyses demonstrated that the decorated nanovesicles typically eluted between fractions 6 and 10 (). The small variability in the elution of the positive decorated niosomes-containing fractions between different SEC columns may be due to the variability in collecting the fractions from the SEC process. Dot blot analysis, a fast and simple technique, is useful to precisely determine the nanovesicle-containing fractions after SEC and could aid to the standardisation of this isolation protocol.
Figure 4. Characterisation of tetraspanin-LEL-decorated niosomes. (a) Evaluation of SEC elution profile of decorated niosomes by dot blot. Niosomes were coupled to biotinylated recombinant tetraspanins (CD9, CD63 and CD81LEL proteins). 1 μL of each of the 20 fractions collected after SEC was spotted onto a nitrocellulose membrane for dot-blot analysis using ABC-peroxidase and specific monoclonal antibodies against tetraspanins CD9, CD63 and CD81 (clones VJ 1/10, TEA 3/10 and 5A6, respectively). (b) NTA-based size determination and quantification. SEC elution profile was confirmed by quantitative NTA analyses of different SEC fractions collected from CD9-niosome samples (upper plot). Particle concentration and mean size distribution of the pooled positive SEC fractions were also measured. A representative size distribution profile is shown for CD63-decorated niosomes (lower graph). (c) Bead-assisted flow cytometry of decorated niosomes. 4 µm latex beads were coated with decorated niosomes (pool of positive fractions recovered after SEC) and labelled with primary anti-CD9 (VJ 1/20) and anti-CD63 (TEA 3/10) mAb followed by Alexa647-labelled anti-mouse secondary antibody. Single beads were selected in the side scatter (SSC)/forward scatter (FSC) dot plot for all samples (left panel). Alexa647-positivity was evaluated in histograms (upper panels) or in a SSC/Alexa647 dot plot (lower panels). GeoMean values for both CD9- and CD63-decorated niosomes is indicated in the histogram plots, showing high positivity when compared to the negative controls. Uncoated beads incubated with primary and secondary antibodies were used as negative control (filled grey histograms). The percentage of Alexa647-positive beads is indicated in the dot plots. Experiment shown is representative for n = 3.
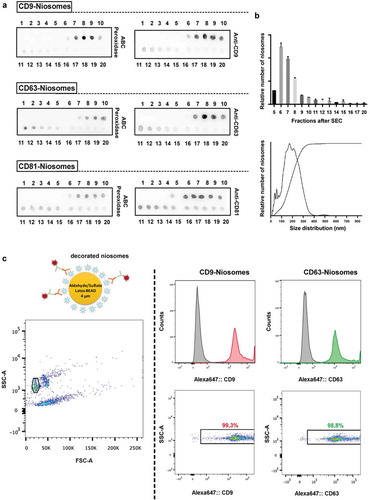
To further determine the presence of nanovesicles in the dot blot fractions, different SEC-fractions of CD9-decorated niosomes were tested by NTA. Data shows that the majority of niosomes eluted in fractions 6–8 (, upper plot), thereby confirming the elution profile previously obtained by dot blot analysis. For further analyses, decorated niosomes-containing fractions were pooled and their size distribution and concentration were determined by NTA. The vast majority of decorated niosomes appeared to be between 100 and 300 nm in size diameter, as displayed in a representative size distribution profile of CD63-niosomes (, lower plot). Concentration of pooled positive fractions, for both CD9 and CD63 decorated nanovesicles, was determined to be around 1 × 10¹¹ particles/mL.
Bulk analysis of the presence of recombinant CD9 and CD63 on artificial nanovesicles was carried out by bead-assisted FC [Citation17] (). Here, the pooled positive fractions of decorated niosomes were adsorbed onto 4 µm diameter aldehyde/sulphate latex beads, incubated with antibodies directed against CD9 or CD63 and stained with a secondary antibody conjugated to Alexa Fluor 647. Bright positivity was observed for beads that had been previously incubated with CD9 or CD63 decorated niosomes when compared to uncoated beads incubated with both primary and secondary antibodies ().
Cryo-electron microscopy of tetraspanin-decorated niosomes
Cryo-EM allows visualisation of samples in their native frozen-hydrated state. Cryo-EM analyses of niosome-samples revealed the presence of single nanovesicles with a spherical morphology, similar to the one observed for EVs [Citation25]. A bilayer membrane could be clearly appreciated at higher magnification (, lower panel). Interestingly, some lamellar and multilamellar structures were also visualised (). Although rare, the presence of these multilamellar structures has been reported with various EV samples isolated from biological fluids [Citation26]. The size range of these nanovesicles coincided with the size distribution profile that we previously determined by NTA. The majority of nanovesicles were between 100 and 200 nm, but a few smaller (50 nm) and bigger (>200 nm) niosomes were also detected. Thus, our bioengineered niosomes reproduce the heterogeneity observed with natural EVs.
Figure 5. Cryo-Electron Microscopy of decorated niosomes. (a) Cryo-EM of CD9-Niosomes. (b) Immunogold staining of CD9 and CD63-decorated niosomes. Antibodies used were anti-CD9 (clone VJ 1/10) on AviCD9LELAvi-decorated niosomes and anti-CD63 (clone TEA 3/18) on AviCD63LELAvi decorated niosomes. (c) Cryo-Electron Tomography analysis of a CD63-decorated niosome. CD63-decorated niosome observed without any inclination (0°), or after tilting the sample either −57° or +43°. Magnification of bilayer membrane structure is shown. Bars = 100 nm for all images.
To further characterise the presence of recombinant tetraspanins on the surface of these nanovesicles in their native state, cryo-EM was combined with immunogold labelling. To this end, an incubation step with specific antibodies directed against CD9 or CD63 was followed by incubation with secondary antibodies conjugated to 15 nm gold particles. Niosomes positively decorated with CD9 and CD63 were observed (), although the number of gold-particles associated to the niosome-surface was lower than expected. Due to the small size of niosomes steric hindrance interactions between antibodies (with an average size of around 10 nm and coupled to gold nanoparticles of 15 nm) are likely to affect labelling intensity. Another important consideration when performing immunolabelling is the chemical fixation process, which might alter the ultrastructure of samples [Citation27].
Because of the perspective of view in 2-D images, a gold nanoparticle may seem to be close to the membrane of nanovesicles whereas it is actually not. Thus, to confirm the specificity of the attachment of the gold nanoparticles to the membrane of decorated niosomes we performed a cryo-Electron Tomography (cryo-ET) approach. Cryo-ET offers the possibility to observe samples from different tilt angles, thereby avoiding the ambiguity derived from 2-D projection images [Citation28]. By observing a positively stained CD63-decorated niosome under two different tilt angles, −57° and +43° (, left and right, respectively) we confirmed that the position of the gold nanoparticles was the same as observed for the untilted CD63-decorated niosome ().
Side by side comparison of tetraspanin-decorated niosomes and natural EVs
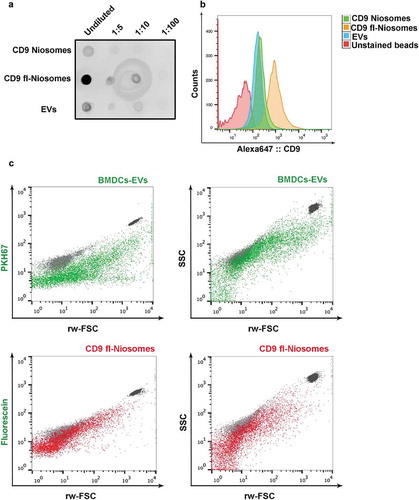
So far, we have provided evidence that most techniques employed for the characterisation of naturally occurring EVs can be easily applied to tetraspanin-decorated niosomes. To provide a side by side comparison, we isolated EVs from conditioned media of the breast cancer carcinoma cell line MCF7 by SEC. We measured particle concentration of these EV samples and of niosomes decorated with CD9 peptide (both regular and fluorescent) and we loaded serial dilutions of equal amounts of particles on a nitrocellulose membrane that was developed with anti-CD9 mAb in a dot-blot. A very similar signal was obtained with natural EVs and CD9-decorated niosomes (), whereas fluorescent-CD9 niosomes showed a brighter CD9 signal. When matching number of EV and niosome particles were incubated with sulphate-aldehyde latex beads, and analysed by FC, same results were generated (). Although different sources of naturally occurring EVs may present different quantities of tetraspanins on their surface, these data show that we are able to produce niosomes with immunoreactive tetraspanin regions with similar antigen-densities as those found on naturally occurring EVs.
Figure 6. Side by side comparison of CD9-decorated niosomes and natural EVs. (a) Dot blot analysis of serial dilutions of CD9-niosomes, CD9-fluorescent niosomes and EVs isolated by SEC from MCF7 conditioned media. Number of particles were previously matched by NTA quantification of the three samples. (b) Bead-assisted flow cytometry of CD9-decorated niosomes and EVs isolated from MCF7 cell culture supernatant. Upon capture, beads were incubated with anti-CD9 VJ1/20 mAb and stained with secondary anti-mouse-Alexa 647. Negative control corresponds to beads coated with EVs in the absence of primary antibody. (c) High-resolution flow cytometry. Dot plots of fluorescence vs. reduced wide-angle FSC (rw-FSC) or SSC vs. rw-FSC of EVs from DC conditioned medium (green) or CD9-decorated fluorescent niosomes (red). As a reference 200 nm and 100 nm yellow-green fluorescent (505/515) FluoSphere Carboxylate-Modified Microspheres (ThermoFisher) are plotted alongside (light and dark grey populations, respectively).
High-resolution flow cytometric analyses of tetraspanin-decorated niosomes
To obtain further evidence for the presence of recombinant tetraspanins on the surface of niosomes at a single particle level, and to test the suitability of these decorated niosomes as standards for flow cytometric analysis of EVs, the bioengineered niosomes were analysed by high-resolution FC [Citation21].
Again, a side by side comparison was performed with CD9-decorated niosomes and natural EVs, in this case derived from DC-conditioned media and enriched by differential ultracentrifugation. The scatter plot of both samples was very similar, in both fluorescence vs FSC and SSC vs FSC dot plots (green dots for EVs and red dots for niosomes, ). For comparison, calibration polystyrene beads of 200 nm in diameter (dark grey) or 100 nm in diameter (light grey) were also included, clearly highlighting a very different scattering behaviour of this reference material ().
For high-resolution FC detection fluorescence threshold triggering was performed [Citation20]. To this end, we first assessed whether the fluorescent signal derived from the carboxyfluorescein labelled 1,2 dioleoyl-sn-glycerol phosphoethanolamine incorporated within the bilayer of the niosomes was enough to resolve them above the threshold and background noise (). Again, decorated niosomes were compared in side by side measurements on the same day with natural EVs isolated from BMDCs and stained with PKH67, as described before [Citation29]. The scatter pattern observed within the fluorescein vs. rw-FSC dot plots of CD9-niosomes resembles the pattern found in EV samples. The dot plots displaying SSC vs. rw-FSC also show similar scatter characteristics, although the natural BMDC-derived EVs preparations displayed a slightly more complex pattern than the decorated niosomes (). These results thus show that niosomes decorated with fluorescein-molecules display enough fluorescence to be resolved by fluorescence-based high-resolution flow cytometric analysis and do not need further generic labelling to perform fluorescence-threshold triggering.
Figure 7. High-resolution flow cytometric analysis of decorated fluorescent niosomes. (a) Dot plots displaying fluorescence from fluorescein or PKH67 vs. reduced wide-angle FSC (rw-FSC) and SSC vs. rw-FSC of fluorescein containing CD9-niosomes and mouse BMDC-derived PKH67-stained EVs. (b) Serial dilutions of the CD9-niosome sample were analysed. Fluorescence vs. rw-FCS dot plots for serial dilutions (1:20, 1:40, 1:80, 1:160 from left to right) are shown. Number of events for each dilution plot are indicated. Plots are representative for n = 3.
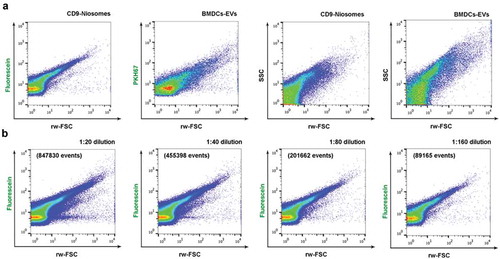
To confirm that nanovesicles were individually measured samples were serially diluted and acquired. Upon dilution of fluorescein-labelled niosomes, the reduction in event rate displayed a linear correlation and both light scatter and fluorescent signals remained unaltered (), thereby ruling out swarm detection [Citation28–Citation30].
The next step was to determine tetraspanin expression at the single niosome level. Here, niosome samples were stained with PE-conjugated anti-tetraspanin antibodies and floated into a sucrose density gradient to separate them from unbound dye. Interestingly, when performing density gradient floatation to separate niosomes from unbound antibodies, we observed that niosomes migrated to the lowest density fraction of the gradient (density = 1.10–1.06 g/mL) (). Depending on the cellular origin, naturally occurring EVs usually float to a buoyant density of 1.13–1.19 g/mL, [Citation30]. This difference in buoyant density likely reflects differences in the content of the vesicles. The difference in buoyant density of both types of nanovesicles could be of specific interest for spike-in experiments, since niosomes could then be easily separated from EVs by density fractionation.
Figure 8. Immunocharacterisation of CD9 and CD63 decorated niosomes by high-resolution flow cytometry. (a) Flow cytometric dot plots displaying CD9 and CD63 signal of fluorescein-containing CD9 and CD63-niosomes after staining with either anti-CD9-PE (clone VJ 1/20) or anti-CD63-PE (Clone H5C6) or matched PE-conjugated negative controls (CD9-niosomes stained with anti-CD81-PE or CD63-niosomes stained with anti-CD9-PE). Percentages of gated events are shown. (b) Histogram overlays for both CD9 and CD63-niosomes and their respective negative controls (darker histograms). GeoMean Fluorescence Intensities of the total populations are indicated. (c) Schematic representation of density gradient flotation performed on antibody-labelled decorated niosomes. Bar graph displaying the fractionation profile of CD9 and CD63-niosomes after sucrose density gradient flotation. The number of events in each fraction is determined using quantitative time-based flow cytometric analysis (number of fluorescein-positive events in 30 s).
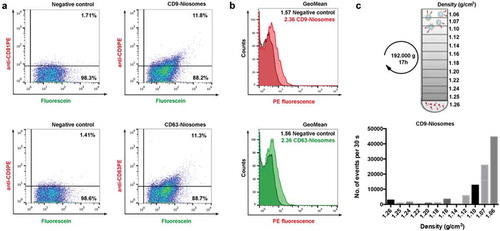
Stained niosomes were thereafter analysed by high-resolution FC using fluorescent threshold triggering. 11.8% of CD9-niosomes stained with anti-CD9-PE displayed specific positive signal when compared to a CD9-niosome sample that was stained with CD81-PE (, upper right panel). For CD63-niosomes, 11.3% of events were found positive (, lower right panel). Interestingly, when PE-fluorescence was displayed in histograms overlaid with their respective controls, it was clear that the mean fluorescence intensity (MFI) of the entire population of niosomes was shifted (). This indicates that the majority of the niosomes are labelled with tetraspanins, but not all of them could be resolved from the background due to the low number of epitopes on the surface. Indeed, when compared to the control sample there was a 1.5-fold change in the Geo-Mean of the total decorated niosome-population for both CD9 and CD63-niosomes. This range of positive events over the background is comparable to that observed when analysing antibody-stained natural EVs [Citation31]. These data further show that the size of the EV imposes an enormous handicap when being analysed by techniques relying on staining or labelling. Smaller and brighter probes are therefore urgently needed to achieve more quantitative results.
Single vesicle characterisation of EVs is highly challenging due to intrinsic features of the sample, including the limited number of antigens on the surface, which is directly limited by the size of the vesicle. Assuming a similar antigen distribution as the one of the cell of origin, it has been described that, even for high density antigens, the number of molecules that might be present on the surface of EVs can go down to 10 molecules [Citation32]. For our design, we decided to use niosomes because of their similar size range and refractive index when compared to naturally occurring EVs. The use of particles with similar features to natural EVs allows good comparison, also for immunodetection, since analogous restrictions due to number of antigenic molecules and fluorescence intensity or gold labelling efficacy will occur. It is important to mention that antibody-labelling strategies for single EV-detection, such as the ones used along this manuscript for high-resolution FC and cryo-EM, have been proved useful for characterisation of EV-subsets. They however carry their own limitations, like the already mentioned effects of antigen density distribution and steric hindrance of antibodies. Further improvements for the application of FC to the EV field are needed to obtain small sized but very bright fluorochromes to overcome these limitations. Yet, despite the fact that single-vesicle FC is still highly challenging, the high-throughput characterisation of small vesicles with specific markers is one of the most powerful techniques available at this moment. The availability of proper standards suitable for immunolabelling would therefore greatly benefit the advances in the optimisation of this technique. Moreover, the EVM here described have proven to also be suited for other isolation and characterisation techniques currently employed in the EV field, such as SEC, density gradients, NTA, western-blot, bead-based FC and EM.
In addition, EV Mimetics may offer new possibilities as drug delivery systems and vaccines [Citation33,Citation34]. Among the numerous nanotechnology-based therapies, lipid-based nanoparticles and niosomes have interesting biological properties, which include extensive biocompatibility, biodegradability and the ability to entrap both hydrophilic and hydrophobic drugs [Citation34–Citation36]. These EVM may be able to increase the half-life in circulation of the cargo, minimise toxicity and increase the therapeutic effect [Citation33–Citation37].
Thus, here we describe for the first time a nano-biotechnological approach to generate an EVM. These bioengineered nanovesicles open up new possibilities for optimisation, cross-standardisation and comparison of EV-measurements between laboratories and techniques.
The requirement for suitable standards for EV isolation, characterisation and analysis methods in the fast developing EV-field is obvious [Citation38], particularly since the techniques for EV isolation and characterisation are constantly evolving, and their applicability is exponentially increasing. Appealing features such as size distribution, morphology and particle concentration make these bioengineered nanovesicles suitable for different EV isolation and detection procedures. We have chosen to initiate the development of EVMs with tetraspanin LELs, but the technology that we describe here is adaptable to the incorporation of different protein markers. By taking advantage of the high-affinity interaction between (strept)avidin and biotin molecules it is possible to perform surface-decoration with any potential protein of interest, which make these nanovesicles tuneable. In addition, they can be generically stained with fluorescent dyes. Since the here-described surface-decorated niosomes display similar biophysical properties as naturally occurring EVs, and are suited for staining with antibodies directed against the most widely used tetraspanins within the EV-field, they can be powerful intrinsic controls for EV characterisation platforms like NTA, Electron Microscopy and FC. Additionally, they are detectable by different bulk-based analysis techniques, such as dot blot, western blot and bead-based FC. Moreover, because of their specific density properties, they could be easily adapted as spike-ins for robust assessment in all these techniques.
Acknowledgments
The authors would like to thank Dr. David Gil and Dr. Maite Rejas for great assistance and guidance with Electron Microscopy, Henar Suarez for her help in bead-based flow cytometry and Ger Arkesteijn for his assistance with high resolution flow cytometry.
Disclosure statement
No potential conflict of interest was reported by the authors.
Additional information
Funding
Related Research Data
References
- Yáñez-Mó M, Siljander PR, Andreu Z, et al., Biological properties of extracellular vesicles and their physiological functions. J Extracell Vesicles. 2015;4:27066.
- Fais S, O’Driscoll L, Borras FE, et al. Evidence-based clinical use of nanoscale extracellular vesicles in nanomedicine. ACS Nano. 2016;10:3886–17.
- Consortium E-T, Van Deun J, Mestdagh P, et al. EV-TRACK: transparent reporting and centralizing knowledge in extracellular vesicle research. Nat Methods. 2017;14:228–232.
- Valkonen S, van der Pol E, Boing A, et al. Biological reference materials for extracellular vesicle studies. Eur J Pharm Sci. 2017;98:4–16.
- Garcia-Manrique P, Matos M, Gutierrez G, et al. Therapeutic biomaterials based on extracellular vesicles: classification of bio-engineering and mimetic preparation routes. J Extracell Vesicles. 2018;7:1422676.
- Marianecci C, Di Marzio L, Rinaldi F, et al. Niosomes from 80s to present: the state of the art. Adv Colloid Interface Sci. 2014;205:187–206.
- Chen C, Zhu S, Wang S, et al. Multiparameter quantification of liposomal nanomedicines at the single-particle level by high-sensitivity flow cytometry. ACS Appl Mater Interfaces. 2017;9:13913–13919.
- van der Pol E, Coumans FA, Sturk A, et al. Refractive index determination of nanoparticles in suspension using nanoparticle tracking analysis. Nano Lett. 2014;14:6195–6201.
- Bartelds R, Nematollahi MH, Pols T, et al. Niosomes, an alternative for liposomal delivery. PLoS One. 2018;13:e0194179.
- Armstrong JPK, Stevens MM. Strategic design of extracellular vesicle drug delivery systems. Adv Drug Deliv Rev. 2018;130:12–16.
- Stipp CS, Kolesnikova TV, Hemler ME. Functional domains in tetraspanin proteins. Trends Biochem Sci. 2003;28:106–112.
- Masciopinto F, Campagnoli S, Abrignani S, et al. The small extracellular loop of CD81 is necessary for optimal surface expression of the large loop, a putative HCV receptor. Virus Res. 2001;80:1–10.
- Yanez-Mo M, Tejedor R, Rousselle P, et al. Tetraspanins in intercellular adhesion of polarized epithelial cells: spatial and functional relationship to integrins and cadherins. J Cell Sci. 2001;114:577–587.
- Mittelbrunn M, Yanez-Mo M, Sancho D, et al. Cutting edge: dynamic redistribution of tetraspanin CD81 at the central zone of the immune synapse in both T lymphocytes and APC. J Immunol. 2002;169:6691–6695.
- Barreiro O, Yanez-Mo M, Sala-Valdes M, et al. Endothelial tetraspanin microdomains regulate leukocyte firm adhesion during extravasation. Blood. 2005;105:2852–2861.
- Fairhead M, Howarth M. Site-specific biotinylation of purified proteins using BirA. Methods Mol Biol. 2015;1266:171–184.
- Suarez H, Gamez-Valero A, Reyes R, et al. A bead-assisted flow cytometry method for the semi-quantitative analysis of extracellular vesicles. Sci Rep. 2017;7:11271.
- Nolte-’T Hoen EN, van der Vlist EJ, de Boer-Brouwer M, et al. Dynamics of dendritic cell-derived vesicles: high-resolution flow cytometric analysis of extracellular vesicle quantity and quality. J Leukoc Biol. 2013;93:395–402.
- Guo F, Jiang W. Single particle cryo-electron microscopy and 3-D reconstruction of viruses. Methods Mol Biol. 2014;1117:401–443.
- van der Vlist EJ, Nolte-’T Hoen EN, Stoorvogel W, et al. Fluorescent labeling of nano-sized vesicles released by cells and subsequent quantitative and qualitative analysis by high-resolution flow cytometry. Nat Protoc. 2012;7:1311–1326.
- Nolte-’T Hoen EN, van der Vlist EJ, Aalberts M, et al. Quantitative and qualitative flow cytometric analysis of nanosized cell-derived membrane vesicles. Nano-medicine. 2012;8:712–720.
- Dubacheva GV, Araya-Callis C, Geert Volbeda A, et al. Controlling multivalent binding through surface chemistry: model study on streptavidin. J Am Chem Soc. 2017;139:4157–4167.
- Gonzalez M, Bagatolli LA, Echabe I, et al. Interaction of biotin with streptavidin. Thermostability and conformational changes upon binding. J Biol Chem. 1997;272:11288–11294.
- Wilchek M, Bayer EA, Livnah O. Essentials of biorecognition: the (strept)avidin-biotin system as a model for protein-protein and protein-ligand interaction. Immunol Lett. 2006;103:27–32.
- Yuana Y, Koning RI, Kuil ME, et al. Cryo-electron microscopy of extracellular vesicles in fresh plasma. J Extracell Vesicles. 2013;2:21494.
- Zonneveld MI, Brisson AR, van Herwijnen MJ, et al. Recovery of extracellular vesicles from human breast milk is influenced by sample collection and vesicle isolation procedures. J Extracell Vesicles. 2014;3. doi: 10.3402/jev.v3.24215. eCollection 2014.
- Yi H, Strauss JD, Ke Z, et al. Native immunogold labeling of cell surface proteins and viral glycoproteins for cryo-electron microscopy and cryo-electron tomography applications. J Histochem Cytochem. 2015;63:780–792.
- Stewart PL. Cryo-electron microscopy and cryo-electron tomography of nanoparticles. Wiley Interdiscip Rev Nanomed Nanobiotechnol. 2017;9:e1417.
- Libregts S, Arkesteijn GJA, Nemeth A, et al. Flow cytometric analysis of extracellular vesicle subsets in plasma: impact of swarm by particles of non-interest. J Thromb Haemost. 2018;16:1423–1436.
- Konoshenko MY, Lekchnov EA, Vlassov AV, et al. Isolation of extracellular vesicles: general methodologies and latest trends. Biomed Res Int. 2018;2018:8545347.
- Groot Kormelink T, Arkesteijn GJ, Nauwelaers FA, et al. Prerequisites for the analysis and sorting of extracellular vesicle subpopulations by high-resolution flow cytometry. Cytometry A. 2016;89:135–147.
- Nolan JP. Flow cytometry of extracellular vesicles: potential, pitfalls, and prospects. Curr Protoc Cytom. 2015;73:13–14, 11–16.
- Kooijmans SA, Vader P, van Dommelen SM, et al. Exosome mimetics: a novel class of drug delivery systems. Int J Nanomedicine. 2012;7:1525–1541.
- Kim OY, Lee J, Gho YS. Extracellular vesicle mimetics: novel alternatives to extracellular vesicle-based theranostics, drug delivery, and vaccines. Semin Cell Dev Biol. 2017; 67:74–82. doi: 10.1016/j.semcdb.2016.12.001.
- Mizrahy S, Hazan-Halevy I, Landesman-Milo D, et al. Advanced strategies in immune modulation of cancer using lipid-based nanoparticles. Front Immunol. 2017;8:69.
- Smith DM, Simon JK, Baker JR Jr. Applications of nanotechnology for immunology. Nat Rev Immunol. 2013;13:592–605.
- Torchilin VP. Recent advances with liposomes as pharmaceutical carriers. Nat Rev Drug Discov. 2005;4:145–160.
- Lotvall J, Hill AF, Hochberg F, et al. Minimal experimental requirements for definition of extracellular vesicles and their functions: a position statement from the international society for extracellular vesicles. J Extracell Vesicles. 2014;3:26913.