
 ?Mathematical formulae have been encoded as MathML and are displayed in this HTML version using MathJax in order to improve their display. Uncheck the box to turn MathJax off. This feature requires Javascript. Click on a formula to zoom.
ABSTRACT
Liver constitutes the major metabolic factory in the organism and is involved in the synthesis, secretion and clearance of many blood-circulating molecules. Previously, we have characterised the protein and RNA cargo of extracellular vesicles (EVs) secreted by two hepatic cellular models, a mouse hepatocyte progenitor cell line (MLP29) and primary rat hepatocytes (RHs). Here, we report the metabolome profile of these vesicles by performing a targeted UHPLC-MS metabolomics analysis of these two cellular models and their respective secreted EVs. Visual inspection of the data through principal component analysis allows clear separation of the metabolic profile of cells and EVs, and also of both cellular models. Correlation matrix supported that lipid composition of EVs is mainly determined by parent cell composition. EVs derived from MLP29 and RHs showed a negative correlation in their percentage composition of ceramides, glycerophospholipids, sphingomyelins and triglycerides. Metabolites enriched in EVs were also different depending on the cellular model. EVs secreted by MLP29 were enriched in different species of sphingomyelins and ceramides underrepresented in EVs secreted by RHs. Remarkably, triglycerides constitute an important percentage of the composition of EVs derived from RHs. We further investigate if the differences in lipid composition were also accompanied by differences in mechanical behaviour, by using atomic force microscopy complemented with nanoindentation-based methodology. To compare the stiffness and brittleness of EVs derived from MLP29 cell line and RH primary cells, FZ curves were performed in the centre of single vesicles and the differences found in their force-vs.-indentation curves suggest that RHs EVs are softer (less stiff) and less resistance to mechanical failure than MLP29 EVs. Therefore, we can conclude that EVs from different origin carry a characteristic lipid composition related to their parental cell composition, and exhibit different mechanical properties.
Abbreviations: For the identification of the different species of lipids, the following abbreviations has been employed: Cer, ceramide; ChoE, Cholesteryl Ester; CMH, monohexosylceramide; DAG, diglycerid; LPC, lysophosphatidylcholin; LPI, lysophosphatidyinositol; PC, phosphocoline; PE, phoethanolamine; PI, phosphoinositol; SM, sphingomyelin; TAG, triglycerid
Introduction
The liver is a complex organ with different cell types cooperating in a multi-task systemic mission. Since our group published the first description of extracellular vesicles (EVs) released by hepatocytes [Citation1], several groups continued the molecular characterisation of vesicles of liver origin, and nowadays, different studies have shown the role played by EVs in the cross-talk of different hepatic cell populations (reviewed in [Citation2]). Among the different populations of liver cells, our group had used as cellular models the mouse liver progenitor cell line, MLP29 [Citation3], and primary culture model of hepatocytes obtained from rats through liver perfusion (RHs). We have isolated and extensively characterised the small EVs released by those cells through flotation density gradient, cryo-EM and immunoblotting [Citation1]. We have already published the protein profile [Citation1,Citation4] and the transcriptomic profile [Citation5]. Their different origin has also been reflected in their cargo content, since EVs from primary RHs maintain the gene expression and the presence of enzymes involved in the hepatic function, while MLP29 EVs are loaded with proteins and transcripts related to cell cycle regulation and differentiation [Citation1,Citation5].
In the present study, we continue with the molecular characterisation of the content of EVs secreted by these two cellular models. The rationale behind our study design is to demonstrate that EVs coming from very different cell backgrounds, such different species, proliferative capabilities and biological activity, had a reflection in their metabolite composition as well. Furthermore, we try to infer if those differences had an impact in the physical properties of the vesicles.
In the recent years, changes in the metabolite composition of cells have been proved to be relevant in pathologic condition including cancer [Citation6]. More importantly, EVs seem to be able to transfer metabolites to acceptor cells changing their metabolic status [Citation7,Citation8]. We have analysed by targeted ultra-high performance liquid chromatography coupled to mass spectrometry (UHPLC-MS), the presence of 302 metabolites in the EVs, and compared their abundance with those in the parental cell. It has been pointed out that targeted UHPLC-MS, although loses information about not considered metabolites, provides the necessary sensitivity and specificity to work in the EV field which requires special considerations, as detailed reviewed in [Citation9]. As result, we have found significant differences between both cellular models that may also reflect again their differences in species, culture type, and cellular function, since they are equipped with different protein and transcriptome profile.
To further characterise the vesicles, we have investigated if the differences in the lipid composition are accompanied by differences in the mechanical properties by using atomic force microscopy [Citation10]. For imaging isolated EVs, which are weakly bonded to the substrate, we have preferred AFM imaging jumping mode (JM) [Citation11,Citation12], although tapping mode has been also employed [Citation13]. Beyond imaging, AFM also enables the quantification of mechanical properties, related to the stiffness and brittleness of these biological objects, using the nanoindentation methodology [Citation14]. This technique consists on monitoring the deflection of the AFM tip while a single force-vs -Z-piezo is obtained by pushing on the top of an isolated EV. When compared EVs derived from MLP29 and RH cells, our results revealed important differences in the physical properties between both types of vesicles.
Material and methods
Cell culture
All media and reagents for tissue culture were purchased from GIBCO (Life technologies Inc.). MLP29 cells are a murine liver progenitor cell line [Citation3]. All animal experimentation was conducted in accordance with Spanish guidelines for the care and use of laboratory animals, and protocols approved by the CIC bioGUNE ethical review committee (Permit Number: P-CBG-CBBA-3610). All surgery was performed under anaesthetic gas Isoflurane (IsoFLO, Abbott Laboratories), and all efforts were made to minimise suffering. RHs were obtained by liver perfusion of nine-week-old healthy Wistar male rats as described previously [Citation15].
Production and purification of EVs
For EV production, MLP29 cells or fresh RH suspension were plated to non-collagenised (MLP29) or collagen-coated (RH) 150-mm dishes, at 15–30 million cells per dish. Cells were cultured in complete DMEM medium [Dulbecco’s modified Eagle medium supplemented with 10% (v/v) foetal bovine serum (FBS), 0.1 mg/ml streptomycin and 100 units/ml penicillin (GIBCO, Life technologies Inc.)] for 24 h (MLP29 cells) or for 4 h (RH) at 37°C and 5% of CO2, washed two times with Dulbecco`s modified phosphate-buffered saline (PBS) and incubated 48 h (MLP29 cells) or 36 h (RH) in 25-mM HEPES-containing complete DMEM medium previously depleted of contaminating vesicles by overnight centrifugation at 110,000x g [Citation16]. After incubation, media were collected and EVs were isolated as previously described [Citation17]; briefly, culture supernatant was centrifuged at 1500x g for 10 min to remove lifted cells and cellular debris. The resultant supernatant was subjected to filtration on 0.22 μm pore filters, followed by ultracentrifugation at 10,000x g and 100,000x g for 30 min and 75 min, respectively. The resulting pellets were solubilised in PBS, pooled, and again ultra-centrifuged at 100,000x g for 75 min. The final pellet of small EVs was solubilised in PBS to between 1/700th and 1/2000th the original volume of the culture supernatant, and aliquots were stored at −80°C.
Nanoparticle tracking analysis (NTA)
Size distribution within EVs preparations was analysed by measuring the rate of Brownian motion using a NanoSight LM10 system (NanoSight, Amesbury, UK), which is equipped with a fast video capture and particle-tracking software. A volume of 300 µl of a dilution 1:100 in PBS of the original EVs preparation, obtained as described above, was loaded into the laser camera. NTA post acquisition settings were kept constant between samples, and each video was then analysed to give a profile of the size distribution.
Electron microscopy
For negative staining, vesicles were adsorbed onto glow-discharged Formvar-Carbon Niquel grids, washed with distilled water and stained with freshly prepared 2% uranyl acetate in aqueous suspension. Negative stained samples were imaged at room temperature using a JEM-1230 transmission electron microscope (JEOL) equipped with a thermionic tungsten filament and operated at an acceleration voltage of 120 kV. Images were taken using the ORIUS SC1000 (4008 × 2672 pixels) cooled slow-scan CCD camera (GATAN). For cryo-electron microscopy, EV preparations were directly adsorbed onto glow-discharged holey carbon grids (QUANTIFOIL, Germany). Grids were blotted at 95% humidity and rapidly plunged into liquid ethane with the aid of a VITROBOT (Maastricht Instruments BV, The Netherlands). Vitrified samples were imaged at liquid nitrogen temperature using a JEM-2200FS/CR transmission cryo-electron microscope (JEOL, Japan) equipped with a field emission gun and operated at an acceleration voltage of 200 kV.
Metabolite extraction
Different metabolite extraction methods (platforms) were employed in order to have a wide coverage of the chemical diversity of the molecules [Citation18], fractionating the extracts into pools of species with similar physicochemical properties as described by Barr et al. [Citation19]. Initially, proteins were precipitated from the lysed cell and EVs samples by adding 600-μl methanol at room temperature. After short vortex mixing, the samples were spiked with 450-μl chloroform at room temperature. Both extraction solvents were spiked with metabolites not detected in un-spiked cell and EVs extracts as internal standards. As the employed UHPLC-MS methods cover amino acids and lipids from different classes, multiple internal standards covering most of those classes were used: tryptophan-d5(indole-d5), PC(13:0/0:0), FA(19:0) and dehydrocholic acid were spiked in the methanol and used as internal standards in the first UHPLC–MS platform analysis (Platform 1); SM(d18:1/6:0), PE(17:0/17:0), PC (19:0/19:0), TAG(13:0/13:0/13:0), Cer(d18:1/17:0) and ChoE(12:0) were added to the chloroform and used as internal standards in the second UHPLC–MS analysis (Platform 2); and tryptophan-d5(indole-d5) was also used for the amino acid analysis (Platform 3).
Samples were incubated at −20°C for 30 min and after brief vortex two aliquots were collected. For the analysis of fatty acyls, bile acids, and lysoglycerophospholipids (Platform 1), 425 μl of supernatants were collected after centrifugation at 16,000x g for 15 min at 4°C, dried under vacuum and reconstituted in methanol before being transferred to vials for UHPLC-MS analysis. 10 μl aliquots from the extracts prepared for Platform 1 were transferred to microtubes and derivatised for amino acid analysis (Platform 3) [Citation13].
The second aliquot was used for the analysis of glycerolipids, cholesteryl esters, sphingolipids and glycerophospholipids (Platform 2). The cell extracts were mixed with 75 μl water (pH 9). After brief vortex mixing, the samples were incubated for 1 h at −20°C. After centrifugation at 16,000x g for 15 min at 4°C, 180 μl of the organic phase was collected and the solvent removed. The dried extracts were then reconstituted in 50 μl acetronitrile/isopropanol (1:1), resuspended for 10 min, centrifuged (16,000x g for 5 min at 4°C), and transferred to vials for UHPLC–MS analysis.
UHPLC-MS metabolic profiling
Targeted serum metabolic profiles were semi-quantified as previously described [Citation19]. Briefly, UHPLC-single quadrupole–MS was used for amino acid analysis while two separate UHPLC-time-of-flight–MS based platforms analysed the methanol and chloroform/methanol extracts. For each of the three analytical platforms, randomised sample injections were performed. The overall quality of the analysis procedure was monitored using five repeat injections of a pooled sample, considered as the quality control sample. The complete condition set for each platform can be found elsewhere [Citation20]. The retention time stability (generally < 6 s variation, injection-to-injection), mass accuracy (generally < 3 ppm for m/z 400–1000, and < 1.2 mDa for m/z 50–400)] and sensitivity of the system throughout the course of the run were examined.
Data analysis
All data were processed using the TargetLynx application manager for MassLynx 4.1 software (Waters Corp., Milford, USA). A set of predefined retention time, mass-to-charge ratio pairs, Rt-m/z, corresponding to metabolites included in the analysis are fed into the programme. Associated extracted ion chromatograms (mass tolerance window = 0.05 Da) are then peak-detected and noise-reduced in both the UHPLC and MS domains such that only true metabolite related features are processed by the software. A list of chromatographic peak areas is then generated for each sample injection.
Data normalisation was based on multiple internal standards and pool calibration samples approach as described by [Citation21]. The LC-MS features were identified prior to the analysis, either by comparison of their accurate mass spectra and chromatographic Rt with those of available reference standards or, where these were not available, by accurate mass MS/MS fragment ion analysis. Lipid nomenclature and classification follows the LIPID MAPS convention, www. lipidmaps.org.
Atomic force microscopy
The mechanical properties of small, spherical EVs made from different compositions of lipids were probed by an atomic force microscopy tip. Measurements were performed with an AFM microscope (Nanotec Electrónica S.L., Madrid, Spain) operated in Jumping mode plus (JM+) for imaging in liquid [Citation11]. We used triangular silicon-nitride cantilevers (Bruker, SNL-10) with a tip radius ≈5 nm and a nominal spring constant k_cl≈0.06 N/m, calibrated using Sader´s method [Citation22]. These cantilevers were chosen because their spring constant was similar to the spring constant of the EVs. The experiments were carried out under physiological conditions with the sample and cantilevers submerged in EV buffer (Hank’s Balanced Salt Solution from GIBCO® (Thermofisher Scientific)) at a controlled temperature of 18°C. The first step in liquid-based AFM experiments is the immobilisation of EVs to a flat solid substrate. Each type of sample requires a particular absorption methodology and we used the “trial and error” method to find the best condition [Citation23]. EVs use hydrophobic and/or electrostatic interactions to be immobilised in a substrate, such as glass, mica or HOPG (highly oriented pyrolytic graphite). After several AFM experiments with EVs absorbed in different types of substrates, nickel-functionalised Muscovite mica (Ni-mica) was selected as the best substrate to image EVs by liquid-based AFM. To prepare Ni-mica substrate we exfoliated the mica to obtain a new flat layer, and then a 200-µl drop of NiCl2 (5 mM) solution was incubated overnight to finally be dried using pure gas nitrogen. To immobilise the EVs in the Ni-mica substrate a 25-µl drop of the sample was incubated on Ni-mica during 30 min at 4°C. After incubation this surface was washed 10 times with buffer until a volume of 80 µl was reached. The tip was also pre-wetted with a 20 µl drop of buffer. All the images were acquired and analysed with WSxM software (Nanotec Electronica) [Citation24]. The feedback force (set point) in imaging mode was 0.05V and the limit was set to 0.08V. All images were acquired with 256 points. Resulting in images of 256 × 256 pixels. The jump off ≈ 90 nm, jump sample ≈ 180 nm and control cycles ≈ 30. Jumping mode + provides topographic images of these hydrated EVs absorbed in Ni-mica and the lateral displacement of the tip occurs when it is not in contact with the sample, so that dragging forces are mostly avoided during scanning using a safety Z_lift≈150 nm.
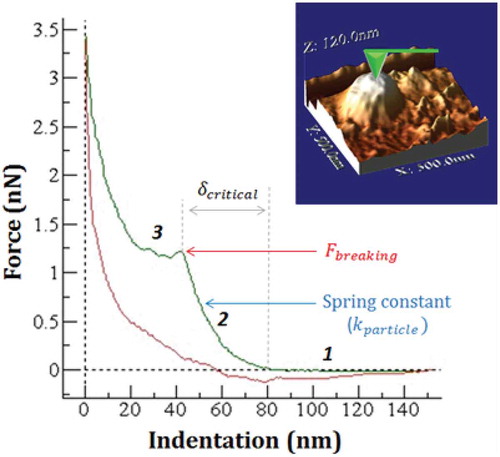
In nanoindentation experiments, we followed the well-established procedures defined for the study of virus mechanics [Citation25]. Each single force-vs.-Z-piezo (FZ) curve was obtained at the very top the single EVs. Each FZ curve gives the relation between the Z-piezo extension (height) and the bending of the cantilever (force). All FZs were performed at the same Z-piezo displacement (~150 nm), at a loading rate of ~100 nm/s (256 points with samples/point = 124). These FZs can be converted into force-vs.-indentation curves (FICs) by recording a calibration FZ of the cantilever deflection on the substrate next to the EV. Whereas the FZ performed on the substrate only accounts for the deformation of the cantilever, the FZ performed on the particle contains the deformation of both the cantilever and the particle. Force-vs.-indentation curve (FIC) of each particle was obtained by subtracting the contribution of the cantilever from the curve performed on the particle. The elastic constant (stiffness) of each EV was obtained from the slope of the initial linear part of the force-vs.-indentation curve (FIC). The linear part of the FIC is sometimes preceded by a short-range nonlinear region due to electrostatic, van der Waals, and hydration forces, which was excluded from the fitting. All the FICs have been performed under identical experimental conditions, such as rate and kind of tip. The region in the indentation curve that follows the linear regime correspond with the elastic limit of the EV and in most cases shows rupture events. From this non-linear region of the FIC we can extract mechanical properties of the EVs, such as the breaking force F_breaking (pN) (maximum force required to break a particle), critical deformation δ_critical (nm) (deformation at which the particle breaks) and critical strain ε (normalised critical deformation). The values were obtained using WSxM software [Citation24].
Statistics
In the study, we compare percentage composition of metabolites in EVs and cells. Therefore, all the data were transformed into a percentage of the total sum of normalised peak intensities of Platform 1 + 2 (lipids) or Platform 3 (amino acids). The percentages were employed for Principal Component Analysis (PCA) representation (using Factominer package of R), matrix correlation comparison (using corrplot package from R) and univariate test using aov linear model. Univariate statistic test was performed with aov function for all the metabolites (302) or the 16 families of metabolites with BH correction for multiple testing, and (*) denotes p-values under 0.05 meanwhile dash (#) denotes significance without correction for multivariate analysis. For each cellular model, we used four independent preparations. The properties of MLP29 and RH-derived EVs characterised by atomic force microscopy were compared through t-test analysis
Results
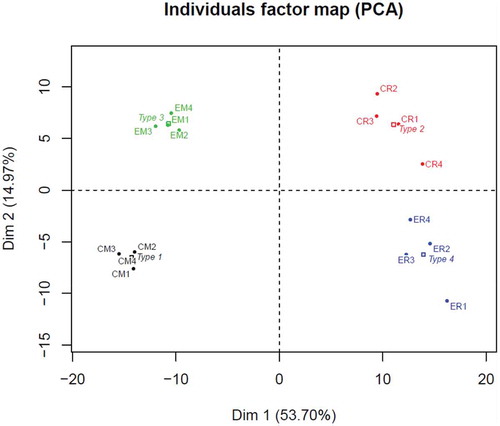
MLP29- and RH-secreted EVs were characterised using NTA and negative electron microscopy (Figure 1 in Supplementary Material) showing the presence of vesicles with a particle size of between 100 and 400 nm, being the majority around 150 nm. The protein and RNA content, as well as, the density distribution using sucrose gradient, have been previously reported [Citation1,Citation5]. Here, we have studied the metabolite content of EVs from these two models by UHPL-MS, and by using PCA analysis, observed a clear separation between both cellular models, as well as between cells and EVs ().
Figure 1. Representation of the first two dimensions of the principal component analysis (PCA) for the 302 metabolites, expressed as percentage of total composition for MLP29 cells (CM) and EVs (EM) and RH cell (CR) and EVs (ER). The dots named Type represent an average of the four samples (biological replicates) included in the study (1 for CM, 2 for CR, 3 for EM and 4 for ER).
Lipid composition
Intriguingly, the PCA analysis reflects larger differences between cells than between the cells and their corresponding EVs (). Those differences were also confirmed by correlation analysis among the percentage composition of species within lipid families, where negative correlation was found for almost all the families () when comparing MLP29 and RH cells. On the contrary, positive correlation between EVs and their parental cells can be found for all the structural glycerophospholipids, with the exception of 1-ether, 2-acylglycerophosphocholines (). The EV content of sphingomyelins and ceramides were also clearly determined by the parental cell composition, as judged, by the positive correlation between EVs and parental cells. In order to analyse the difference between the two cellular models, it is important to distinguish between family compositions and species composition (In Figure 2 in Supplementary Material, we show the percentage composition of EVs from RH and MLP29 for all the species analysed, grouped by families). For instance, ceramides show clear difference in species composition between RH and MLP29 EVs (Figures 2(a,b) in Supplementary Material). However, among total composition, ceramides are about the same percentage of the total composition in both types of cell-derived EVs (). Thus, for understanding the actions mediated for EVs it is important to reach species composition of the lipid fractions and not only stay with the global lipid content.
Figure 2. Correlation matrix analysis for the amino acid group and each lipid families; values are correlation coefficient and only significant values (p < 0.05) are coloured. The colour gradient is in accordance with the correlation coefficient value. Each of the presented correlations was calculated among all the species belonging to that family. The numerical value used for each species is the average of four samples (biological replicates). Within each family, a correlation matrix was generated between the four group of samples existing; EVs from MLP29 (EV_MLP), cells from MLP29 (C_MLP), EVs from RH (EV_RH) and cells from RH (C_RH).
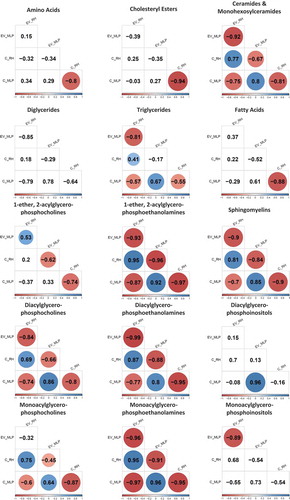
Figure 3. Comparison between the percentage composition of EVs from RH and MLP29. For each group the bar represents the average of the percentage for each family of lipids respect to the total signal of lipids, and the error bar represents SEM (n = 4, biological replicates). T-test was assayed between both groups for each family of lipids, and significance is represented as * for those comparisons with p < 0.05 after correction for multiple comparison. The symbol # represents a p > 0.05 after correction for multiple comparison, but < 0.05 without that correction. Black bars correspond to RH and grey bars correspond to MLP29.
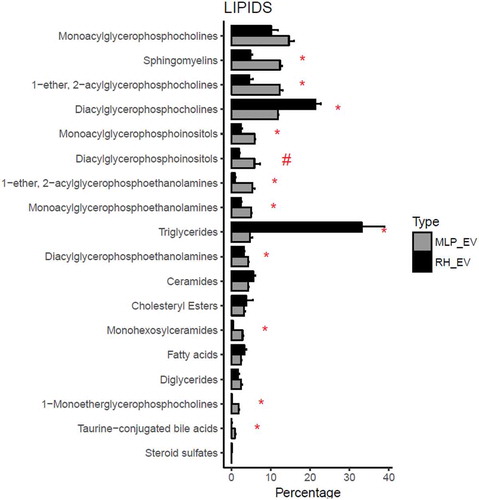
Remarkably, the main difference between RH and MLP29 EVs is the high contribution of triglycerides in the EV preparation obtained from RH, and in a less extent diacylglycerophosphocholines (). In fact, the influence of these large differences is reflected in the other families that relatively are more abundant in MLP29 EVs compared to RH EVs (). This has also an effect in the profile of metabolites enriched in EVs vs. the parental cell. In , we present the common species that are significantly enriched or impoverished in EVs from both cellular models (the result for each model individually is provided in Figure 3 in Supplementary Material). With the exception of PC (O-18:1/22:4), free fatty acid 18:2n-x, and PE (16:0/18:1) that were almost absent in both types of EVs, it seems clear that most of lipids are enriched or impoverished in EVs with respect to the parental cell, in opposite manner for each cell type (). This opposite trend could be a reflection of the different composition of the respective parental cells. If the composition of both cellular models is compared (), it can be observed that both ceramides and triglycerides are more abundant in RH cells, and therefore these lipids are impoverished in EVs derived from RHs with respect to their cell of origin, and the opposite occurs for MLP29 EVs. The enrichment or impoverishment in the composition of EVs with respect to their parental cells, grouped by lipid families, are presented in , and clearly shows opposite trends between MLP29 and RH EVs.
Figure 4. Metabolites impoverished or enriched in EVs common to MLP29 and RH. The bar represents the log2 of the ratio between the mean of the percentages for EVs and the mean of the percentages for their parental cells. Error bar represents the 95% confidence interval calculated as 1.96*SE, while the line at 0 represents neither enrichment nor impoverishment. Therefore, values to the left represent impoverishment in EVs while values to the right represents enrichment in EVs. Only those species whose percentages have a statistically significant difference between cells and EVs for both types of cells are presented in this graph. PC(O-18:1/12:4) and 18:2n-x were undetected in RH_EVs and a arbitrary value has been given to draw the graph. Dark grey bars represent RH and light grey MLP29.
Figure 5. Comparison between the percentage composition of cells for RH and MLP29. For each group the bar represents the average of the percentage for each family of lipids respect to the total signal of lipids, and the error bar represents SEM (n = 4, biological replicates). T-test was assayed between both groups for each family of lipids, and significance is represented as * for those comparisons with p < 0.05 after correction for multiple comparison. The symbol # represents a p > 0.05 after correction for multiple comparison, but < 0.05 without that correction. Black bars correspond to RH and grey bars correspond to MLP29.
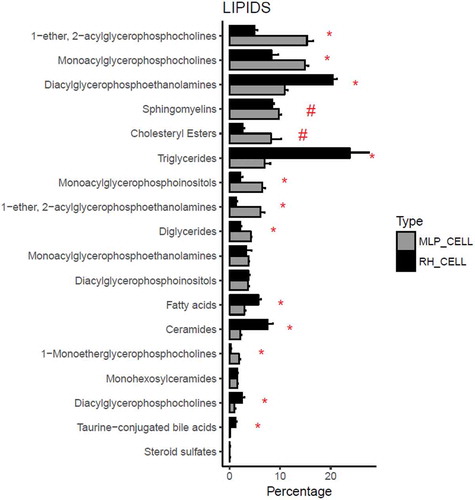
Figure 6. Families of lipids impoverished or enriched in EVs. The bar represents the log2 of the ratio between the mean of the percentages for EVs and the mean of the percentages for their parental cells (n = 4, biological replicates). Error bar represents the 95% confidence interval calculated as 1.96*SE, while the line at 0 represents neither enrichment nor impoverishment. Therefore, values to the left represent impoverishment in EVs while values to the right represents enrichment in EVs. T-test was assayed between the percentage of each family in EVs or in cells, and significance is represented as * for those comparisons with p < 0.05 after correction for multiple comparison. The symbol # represents a p > 0.05 after correction for multiple comparison, but < 0.05 without that correction. Graph a corresponds to MLP29 and graph b corresponds to RH.
In summary, the targeted metabolomics profile highlights that the lipid content of the EVs secreted by two hepatic cellular models is different, and mainly the depletion of the polysunsaturated species of fatty acids (18:2n-x), the diacylglycerophophoetanolamine PE (16:0/18:1), and the 1-ether, 2-acylglycerophosphocholine PC(O-18:1/22:4) are common (). Interestingly, also in both cellular models the most abundant species in this latter family was the PC(O-24:1/20:4) (Figure 2(h) in Supplementary Material). Because of these two features, the correlation between 1-ether, 2-acylglycerophosphocholines are positive between EVs (). For the other species, the correlation is negative as between the parental cells.
Amino acid composition
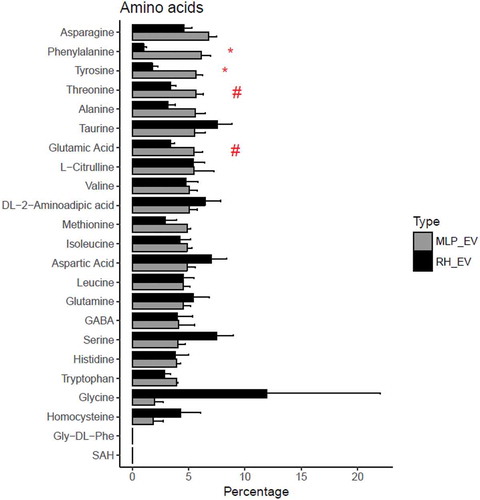
Because the amino acids are quantified by a different technique which included a preliminary reaction, we represented each amino acid as a percentage of the total sum of the amino acids. Each cellular model has a different percentage composition (Figure 4 in Supplementary Material) being differentiate clearly in several amino acids, probably as a reflection of their function. Significant differences were also obtained between the EVs secreted by these cellular models (). Thus, phenylalanine, tyrosine, threonine, and glutamic acid were significantly lower in RH EVs compared to MLP29 EVs, and on the contrary, the content of glycine seems to be higher in RH EVs but with high variability among the samples.
Figure 7. Comparison between the percentage composition of EVs from RH and MLP29. For each group the bar represents the average of the percentage for each amino acid respect to the total signal of amino acids, and the error bar represent SEM (n = 4, biological replicates). T-test was assayed between both groups for each amino acid, and significance is represented as * for those comparisons with p < 0.05 after correction for multiple comparison. The symbol # represents a p > 0.05 after correction for multiple comparison, but < 0.05 without that correction. Black bars correspond to RH and grey bars correspond to MLP29.
Mechanical properties of extracellular vesicles
AFM topographic images agreed with the analysis by cryo-TEM (Figure 5 in Supplementary Material). The visualisation of the surface topography of EVs by AFM show EV particles that are pleiomorphic (roughly spherical or elongated) made of small unilamellar vesicles (closed lipid bilayers) with a diameter between 30–150 nm (). The imaging force were kept between 60–150 pN, which led to averages heights of 34.5 ± 9 nm and 32.5 ± 9 nm for MLP29 and RH EVs (), respectively. These values agree with the dimensions obtained by transmission electron microscopy (TEM) and are compatible with the structure of EVs. In addition, we have measured by nanoindentation-based methodology different mechanical properties of the two types of EVs, MLP29 vs. RHs, which differ in their lipid composition. Although more than 50 single vesicles were analysed, in order to compare the stiffness and brittleness of the single EVs derived from these two different cellular models, only complete FIC curves which includes a rupture point were taken into consideration (see ). The averaged spring constant, critical deformation and the averaged breaking force are presented in . We found statistically significant differences between MLP29 and RH EVs regarding the elastic constant k (N/m) and the breaking force (pN), showing that MLP29 EVs are more rigid and require more force to be broken under a nanoindentation pressure.
Table 1. Elastic constant k (N/m), breaking force (pN) and indentation at which EV ruptures (critical deformation (nm)), mean ± SD. n indicates the number of particles measured. Highlighted in grey, those parameters which are statistically significant different, with a value of p < 0.001.
Figure 8. High resolution AFM topography of one MLP29 EV in buffer conditions; (a) 3D surface reconstruction of this MLP29 EV particle. (b) 2D topographic image (500 × 500 nm scan size, 256 × 256 pixels) of the same particle, indicating the line where the cross-sectional height profile (c) was calculated from the force map. The profile along the top of the EVs was determined by averaging the height of a five-pixel radius of influence. The height of the particle was considered as the maximum value obtained in this topographical profile.
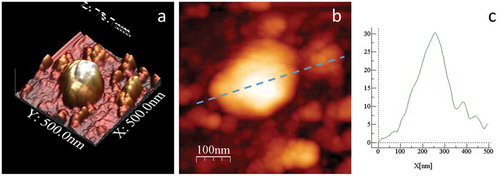
Figure 9. Single force-indentation curve (FIC) on top of a MLP29 EV seen on top of the image. It was obtained by subtracting the contribution of the cantilever from the curve FZ performed on the particle. This nanoindentation curve shows the evolution of the force along the z-piezo elongation, exhibiting three main stages: before contact (1), during elastic deformation (2) and after breaking (3). Mechanical parameters such as the critical indentation, breaking force or elastic constant can be obtained from this indentation curve.
Discussion
In the present work, we compared two different cellular models. Apart of the difference in species, MLP29 are mouse progenitor cells, while RHs come from a primary culture of differentiated and specialised cells. This comparison is important since supports that EVs are strongly dependent of the donor cells employed as model, and that the composition of the vesicles have an effect on their physical properties. The difference had a clear impact in the metabolic composition, at the level of lipid species that is reflected in the composition of the EVs. Previous studies involving cell lines did not showed such clear differences between cell lines [Citation26]. Our results suggest that there is a high correlation between EVs and their parental cells supporting lipidomics as a useful technique to identify the source of circulating EVs.
Ceramides are more abundant in RH than MLP29 cells, but approximately the same percentage in EVs, as a result of enrichment in MLP29 EVs. This ceramide enrichment has previously been described for exosomes [Citation27], a fact that linked to the involvement of ceramides in the biogenesis of exosomes [Citation28]. Monohexosylceramides are equally abundant in both cell lines but again enriched in MLP29 EVs, and subsequently, their percentage is higher in MLP29 EVs. Interestingly, there is a negative correlation between ceramides species among both cell lines and EVs, being more represented in RH EVs slightly longer chains (Figure 2(a) in Supplementary Material). The length and asymmetry of the ceramides has been correlated to the ability to form interdigitation influencing membrane fluidity and permeability [Citation29]. Shorter ceramides will promote a positive curvature, and reduces bilayer permeability [Citation30].
Diglycerides are also equally abundant in EVs but more abundant in RH cells, thus, there is an enrichment in MLP29 EVs versus its parental cell line. Sphingomyelins are enriched in MLP29 EVs, and also more abundant in the MLP29 cells than in RH. Therefore, represent a higher percentage of the lipid composition of MLP29 EVs than in the composition of RH EVs. As mentioned in the previous families, the enrichment of both sphingomyelins and diglycerides has been described in exosomes [Citation31]. We also should mention that for both families, a negative correlation among species exists in both types of EVs. In the case of diglycerides, the percentage of polyunsaturated chains is higher for RH EVs (Figure 2(g) in Supplementary Material), while in the case of sphingomyelins the species with long chain acyls are more predominant in RH EVs (Figure 2(j) in Supplementary Material). Again, long chains seem to have a role in the interdigitation of the outer membrane [Citation27,Citation32] which finally may influence the physical properties of the membrane. It is interesting that it has been described that sphingomyelins and their interaction with cholesterol increases the range of membrane stiffness [Citation33].
Among glycerophospholipids, there are differences depending on the families. Diacylglycerophosphocholines and monoacylglycerophosphocholines show an opposite trend, being more abundant the first in RH cells and EVs, and the last, more represented in MLP29. Interestingly, we have previously reported the increase in blood of diacylglycerophosphocholines after hepatotoxic treatment, presumably released from hepatocytes [Citation34]. In the case of diacylglycerophosphoethanolamines, they are relatively more abundance in RH cells than in MLP29 cells, meanwhile the relationship between both types of EVs is the opposite. It has been described that hepatocytes use a different synthesis route than cultured cells to form phosphoetanolamines, and that route is accelerated in presence of diacylglycerol [Citation35]. Interestingly, our data indicate that the relative composition in EVs from both types is similar in spite of the more abundance in the parental cell. It is interesting to remark that the shift from monoacyl to diacylglycerophosphocholines will have an impact in the asymmetry of the membranes, favouring the transport of certain lipids [Citation36]. Moreover, exist a negative correlation between MLP29 and RH, and clearly the percentage of saturated species is higher in MLP29, while percentage of unsaturated is higher of RH EVs (Figure 2(d,e,m) in Supplementary Material). Unsaturated species of glycerophopholipids creates “extra space” between the two hydrocarbon acyl chains, and that makes the membrane more permeable to water [Citation37]. This affects membrane properties such as lipid packing, molecular cross-sectional area, the tendency for curvature, membrane permeability, and viscoelasticity [Citation36,Citation38].
Accordingly, the differences in EVs lipid composition, and their higher saturation in MLP EVs, it is also accompanied by differences in EVs physic-mechanical properties. We previously found differences in the density of both types of EV, being 1.12–1.15 g/L the flotation density of MLP29 in sucrose gradient, while the EVs derived from RH float in a density between 1.17–1.20 g/L [Citation5]. The characterisation of exosomes by atomic force was first reported in 2010 [Citation39], and it has been reported to characterise saliva exosomes [Citation40], and differences between glioblastoma-derived exosomes and non-tumoural-derived exosomes [Citation41]. Moreover, AFM indentation experiments have also been used to measure the stiffness and strength of lipid-based biocontainers such as synaptic and endocytosis vesicles [Citation42–Citation44]. Our results obtained by nanoidentation analysis suggested that RH EVs were softer and less resistance to mechanical stress. The differences in lipid composition could produce a softening of the structure of RH-derived EVs, in so much as a decrease in particle stiffness of 25% was observed between MLP29 and RH-derived EVs. The effect over elasticity in membranes of the increasing poly-unsaturated acyl-chains has been described previously using atomic force [Citation45]. More interestingly, the averaged spring constant of these MLP29 EVs was similar to influenza virus, a matrix shell enveloped virus of 100 nm in diameter and 5 nm thick. Besides, the averaged breaking force for MLP29 EVs were 0.9nN, a little lower than the forces required to puncture the influenza envelope (above 1nN). This high structural strength of MLP29 EVs, almost similar to virus protein shells [Citation25], could be explained by the fact that influenza virions share an underlying protein composition with exosomes, perhaps because influenza virions could be formed by subverting EV production machinery [Citation46]. The differences found between MLP29 and RH suggest that MLP29 EVs had a better protection against the external environment, meanwhile RH EVs are more fragile. This may explain more rupture in the isolation process that would be translated in more contaminated samples, as we have been observed by cryo-EM experiments during the last decade at our lab, Figure 5 in Supplementary Material. In another hand, the higher flexibility of RH EVs can be best described in terms of protein structure and dynamics, since areas with a high local mechanical flexibility (low stiffness) may inextricably correspond to conformational highly dynamic regions [Citation14], and their mechanical softening could be required to improve their interaction with cells. Nevertheless, a correct interpretation of EV mechanics in terms of stability would require an adequate linkage between the ability of this lipid enveloped particles to resist chemical and mechanical stresses [Citation47].
We should also mention that other glycerophospholipids are more represented in EVs from MLP29. For instance, monoacylphosphoethanolamines have positive enrichment into the EVs of MLP29. In other cases, such dyacilgliceridphosphoinositols, diacylglycerophosphoethanolamines, 1-ether, 2-acylglycerophosphocholines, 1-ether, 2-acylglycerophosphoethanolamines and monoacylphosphoinositols, there is not a positive enrichment of the families into the EVs, but they are also more abundant in the MLP29 cells. Remarkably, lipid species with higher percentage at RH EVs harbour the polyunsaturated chain 20:4 (arachidonic acid) for many of the phospholipid families (Figure 2D, E, F, M, N, O in Supplementary Material). In agreement, we also observe more unesterified arachidonic acid in RH EVs (Figure 2(l) in Supplementary Material). It has been related the presence of arachidonic phospholipids to the ability of releasing triglycerides, associated to the presence of an enzyme that regulate the introduction of arachidonic acid into phospholipids [Citation48].
Indeed, there is a release of triglycerides. Triglycerides are highly present both in EVs and cells from RH. Opposite, for MLP29 they represent a low percentage of their lipid composition, suggesting that the progenitor cell line is not engaged in the synthesis of triglycerides as mature hepatocyte does. However, for MLP29 EVs, some species of triglycerides are enriched in EVs compared with their parental cell line, in concrete species with more unsaturated bonds (Figure 2(k) in Supplementary Material). Triglycerides are not commonly part of membranes [Citation49]. They has been described in big microvesicles (in 10,000x g centrifugation) from Huh7 cells [Citation26] but their presence may be related to co-isolation of lipid droplets or autophagosomes [Citation27,Citation50]. Interestingly, there is indeed autophagy activity in primary hepatocytes cell cultures [Citation51] and therefore such contamination is a possibility. On the other hand, it is also possible that triglycerides were also transported in EVs. Indeed, it has been showed that the presence of arachidonoyl phospholipids are required for triglycerides release from hepatocytes [Citation48], and the hypothesis for this phenomena would be related to the requirement of certain membrane composition to favour lipid transportation, since biophysical studies suggested that greater lipid transport is generally observed with more fluid and highly curved membrane surfaces [Citation52]. As described above, RH EVs are more abundant on arachidonoyl phospholipids than MLP29 EVs, and the differences found between both types of EVs could be the reflection of the function of EVs in lipid transport.
Fatty acids are in similar percentage in both types of EVs in spite of being more abundant in RH cells. Clearly, RH EVs had more polyunsaturated fatty acids than MLP29 EVs. It has been described that exosomes are rich in monounsaturated fatty acids, as it is the case of MLP29 [Citation31]. As mentioned, for RH EVs there is more non-esterified arachidonic acid (20:4n-6), a metabolite that play an important role in cell communication as it regulate special calcium channels [Citation53]. There is a common absence of some species, for instance gamma-linoleic acid (18:3n-6), although the fact that they are not impoverish in EVs means that the amounts in the cells are very low as well compared with other fatty acids (Figure 2(k) in Supplementary Material). We should also mention that the cholesteryl esters composition is quite similar for both types of EVs, although we can observe that relative to the parental cell, EVs from MLP29 are impoverished in metabolites from this family, and again, this seems to confirm that EVs from MLP29 had characteristic similar to other exosomes-enriched preparations analysed previously [Citation26]. As it happened with phospholipids, the species with higher percentage for RH EVs harbour a 20:4 chain (Figure 2(c) in Supplementary Material).
Finally, we should mention that there are differences in amino acids, mainly the low percentage of phenylalanine and tyrosine in RH both cells and EVs. It is worth to mention that hepatocytes have the complete enzymatic cascade to perform phenylalanine conversion to tyrosine, and the tyrosine catabolism, whose last step is catabolised by the fumarylacetoacetate hydrolase [Citation54] an enzyme present in RH EVs [Citation4], so it is possible to speculate that hepatocytes can consume these two amino acids in a more efficient way than MLP29 cells. Moreover, MLP29 are proliferating cells, and this could explain the relative importance of some essential amino acids. It has been described that in proliferative cells amino acids represent a more important part of the total biomass of the cell [Citation55]. Although the important differences observed between both cellular models reflects the role of donor cell into EVs generation, we should not forget that both cell types are different not only in biological properties and proliferative capabilities, but also in species, limiting the conclusions of our study. Moreover, more profound studies would be necessary to address how pathological conditions may affect EVs composition, and therefore their physical properties and their potential role in the pathogenesis and as a source of biomarkers.
Conclusions
MLP29 EVs are enriched in sphingomyelins, glycosphingolipids (monohexosylceramides) and ceramides, in concordance with previous reports for EVs [Citation27,Citation31]. When look at the species, there is a tendency of enrichment (vs. the parental cells) of unsaturated species in certain families, very evident for triglycerides, as well as, glycerophosphocholines. Again, these data are in agreement with the observation for colorectal cancer-derived exosomes that had a higher unsaturated/saturated ratio than cells for those families [Citation56]. At this respect, MLP29 EVs composition is in better agreement with a previous description of lipids in exosomes [Citation27], although some other report disagrees, suggesting them as enriched in microvesicles preparations instead of exosomes [Citation26]. On the other hand, the characteristics of RH EVs are quite different from other cell lines, including the hepatocyte-derived cellular carcinoma Huh7. From one side, due to the large variation among the different preparations, there is no significant enrichment in terms of families. Instead, the species enriched belong to different families such monounsaturated fatty acids, lysophosphoinositols and the 1-ether,2-acylglycerophosphocholine (for instance PC(O–16:0/14:0), see 3B in Supplementary Material). Among the percentage composition, triglycerides are very relevant, a lipid that has not been considered to be included in exosomes since they normally are not part of the membrane composition [Citation27,Citation49]. Although the presence of triglycerides may be the consequence of copurification of lipid droplets and/or autophagosomes, as being suggested, it could also suggest that EVs play a role in the release of triglycerides from liver, a function facilitate by their differential composition, rich in arachidonoyl phospholipids. More important, the presence of non-esterified arachidonic acid suggests complex physiological role for these vesicles in the systemic context. The difference in composition is also accompanied by differences in the mechanical properties of the vesicles. MLP29-derived EVs are less fragile, with a structure almost as resistant as the influenza virus, pointing towards the high resistance of these particles in the extracellular environment. In the other hand, the higher flexibility of RH-derived EVs uncovers highly dynamic regions and their mechanical softening would improve their interaction with other cells, which reinforce the idea of a role for lipid transportation between cells.
Supplemental Material
Download MS Word (1.9 MB)Acknowledgements
The authors thank Pedro J. de Pablo and Alvaro Ortega-Esteban for the training in liquid-based AFM including nanoindentation technique, and Aida Llauró Portell for help in starting up the Nanotec Scanning Probe Microscope at the CIC bioGUNE. We are also thankful to the Animal Facility of CIC bioGUNE.
Disclosure statement
No potential conflict of interest was reported by the authors. Miriam Perez-Cormenzana, Rebeca Mayo and Cristina Alonso are employees of OWL Metabolomics
Supplementary material
Supplementary data for this article can be accessed here.
Additional information
Funding
Related Research Data
References
- Conde-Vancells J, Rodriguez-Suarez E, Embade N, et al. Characterization and comprehensive proteome profiling of exosomes secreted by hepatocytes. J Proteome Res. 2008 Dec;7(12):5157–16. PubMed PMID: 19367702; PubMed Central PMCID: PMC2696236.
- Royo F, Jm F-P. Liver extracellular vesicles in health and disease. J Extracell Vesicles. 2012;1. PubMed PMID: 24009882; PubMed Central PMCID: PMC3760641. DOI:10.3402/jev.v1i0.18825
- Medico E, Mongiovi AM, Huff J, et al. The tyrosine kinase receptors ron and sea control “scattering” and morphogenesis of liver progenitor cells in vitro. Mol Biol Cell. 1996 Apr;7(4):495–504. PubMed PMID: 8730094; PubMed Central PMCID: PMC275904.
- Rodriguez-Suarez E, Gonzalez E, Hughes C, et al. Quantitative proteomic analysis of hepatocyte-secreted extracellular vesicles reveals candidate markers for liver toxicity. J Proteomics. 2014 May 30;103:227–240. PubMed PMID: 24747303; PubMed Central PMCID: PMC5119459.
- Royo F, Schlangen K, Palomo L, et al. Transcriptome of extracellular vesicles released by hepatocytes. PloS one. 2013;8(7):e68693. PubMed PMID: 23874726; PubMed Central PMCID: PMC3708910.
- Ryland LK, Fox TE, Liu X, et al. Dysregulation of sphingolipid metabolism in cancer. Cancer Biol Ther. 2011 Jan 15;11(2):138–149. PubMed PMID: 21209555.
- Zhao H, Yang L, Baddour J, et al. Tumor microenvironment derived exosomes pleiotropically modulate cancer cell metabolism. eLife. 2016 Feb 27;5:e10250. PubMed PMID: 26920219; PubMed Central PMCID: PMC4841778.
- Record M, Carayon K, Poirot M, et al. Exosomes as new vesicular lipid transporters involved in cell-cell communication and various pathophysiologies. Biochim Biophys Acta. 2014 Jan;1841(1):108–120. PubMed PMID: 24140720.
- Ramirez MI, Amorim MG, Gadelha C, et al. Technical challenges of working with extracellular vesicles. Nanoscale. 2018 Jan 18;10(3):881–906. PubMed PMID: 29265147.
- Binnig G, Quate CF, Gerber C. Atomic force microscope. Phys Rev Lett. 1986 Mar 3;56(9):930–933. PubMed PMID: 10033323. DOI:10.1103/PhysRevLett.56.930
- Ortega-Esteban A, Horcas I, Hernando-Perez M, et al. Minimizing tip-sample forces in jumping mode atomic force microscopy in liquid. Ultramicroscopy. 2012 Mar;114:56–61. PubMed PMID: 22356789.
- PJd P, Colchero J, Gómez-Herrero J, et al. Jumping mode scanning force microscopy. Appl Phys Lett. 1998;73(22):3300–3302.
- Sharma S, LeClaire M, Gimzewski JK. Ascent of atomic force microscopy as a nanoanalytical tool for exosomes and other extracellular vesicles. Nanotechnology. 2018 Apr 3;29(13):132001. PubMed PMID: 29376505. DOI:10.1088/1361-6528/aaab06
- Mateu MG. Mechanical properties of viruses analyzed by atomic force microscopy: a virological perspective. Virus Res. 2012 Sep;168(1–2):1–22. PubMed PMID: 22705418. DOI:10.1016/j.virusres.2012.06.008
- Royo F, Moreno L, Mleczko J, et al. Hepatocyte-secreted extracellular vesicles modify blood metabolome and endothelial function by an arginase-dependent mechanism. Sci Rep. 2017 Feb 17;7:42798. PubMed PMID: 28211494; PubMed Central PMCID: PMC5314384.
- Thery C, Regnault A, Garin J, et al. Molecular characterization of dendritic cell-derived exosomes. Selective accumulation of the heat shock protein hsc73. J Cell Biol. 1999 Nov 01;147(3):599–610. PubMed PMID: 10545503; PubMed Central PMCID: PMC2151184.
- Raposo G, Nijman HW, Stoorvogel W, et al. B lymphocytes secrete antigen-presenting vesicles. J Exp Med. 1996 Mar 01;183(3):1161–1172. PubMed PMID: 8642258; PubMed Central PMCID: PMC2192324.
- Baker M. Metabolomics: from small molecules to big ideas. Nat Methods. 2011;8(2):117–121. 02//print. DOI:10.1038/nmeth0211-117
- Barr J, Caballeria J, Martinez-Arranz I, et al. Obesity-dependent metabolic signatures associated with nonalcoholic fatty liver disease progression. J Proteome Res. 2012 Apr 6;11(4):2521–2532. PubMed PMID: 22364559; PubMed Central PMCID: PMC3321123. DOI:10.1021/pr201223p
- Royo F, Palomo L, Mleczko J, et al. Metabolically active extracellular vesicles released from hepatocytes under drug-induced liver-damaging conditions modify serum metabolome and might affect different pathophysiological processes. Eur J Pharm Sci. 2017 Feb 15;98:51–57. PubMed PMID: 27771515. .
- Martinez-Arranz I, Mayo R, Perez-Cormenzana M, et al. Enhancing metabolomics research through data mining. J Proteomics. 2015 Sep 8;127(Pt B):275–288. PubMed PMID: 25668325. DOI:10.1016/j.jprot.2015.01.019
- Sader JE, Chon JWM, Mulvaney P. Calibration of rectangular atomic force microscope cantilevers. Rev Sci Instrum. 1999;70(10):3967–3969.
- Moreno-Madrid F, Martin-Gonzalez N, Llauro A, et al. Atomic force microscopy of virus shells. Biochem Soc Trans. 2017 Apr 15;45(2):499–511. PubMed PMID: 28408490. DOI:10.1042/BST20160316
- Horcas I, Fernandez R, Gomez-Rodriguez JM, et al. WSXM: a software for scanning probe microscopy and a tool for nanotechnology. Rev Sci Instrum. 2007 Jan;78(1):013705. PubMed PMID: 17503926. DOI:10.1063/1.2432410
- Michel JP, Ivanovska IL, Gibbons MM, et al. Nanoindentation studies of full and empty viral capsids and the effects of capsid protein mutations on elasticity and strength. Proc Natl Acad Sci U S A. 2006 Apr 18;103(16):6184–6189. PubMed PMID: 16606825; PubMed Central PMCID: PMCPMC1458852. DOI:10.1073/pnas.0601744103
- Haraszti RA, Didiot MC, Sapp E, et al. High-resolution proteomic and lipidomic analysis of exosomes and microvesicles from different cell sources. J Extracell Vesicles. 2016;5:32570. PubMed PMID: 27863537; PubMed Central PMCID: PMC5116062.
- Skotland T, Sandvig K, Llorente A. Lipids in exosomes: current knowledge and the way forward. Prog Lipid Res. 2017 Apr;66:30–41. PubMed PMID: 28342835. DOI:10.1016/j.plipres.2017.03.001
- Trajkovic K, Hsu C, Chiantia S, et al. Ceramide triggers budding of exosome vesicles into multivesicular endosomes. Science. 2008 Feb 29;319(5867):1244–1247. PubMed PMID: 18309083. DOI:10.1126/science.1153124
- Pinto SN, Silva LC, Futerman AH, et al. Effect of ceramide structure on membrane biophysical properties: the role of acyl chain length and unsaturation. Biochim Biophys Acta. 2011 Nov;1808(11):2753–2760. PubMed PMID: 21835161. DOI:10.1016/j.bbamem.2011.07.023
- Garcia-Arribas AB, Alonso A, Goni FM. Cholesterol interactions with ceramide and sphingomyelin. Chem Phys Lipids. 2016 Sep;199:26–34. PubMed PMID: 27132117. DOI:10.1016/j.chemphyslip.2016.04.002
- Llorente A, Skotland T, Sylvanne T, et al. Molecular lipidomics of exosomes released by PC-3 prostate cancer cells. Biochim Biophys Acta. 2013 Jul;1831(7):1302–1309. PubMed PMID: 24046871.
- Rog T, Orlowski A, Llorente A, et al. Interdigitation of long-chain sphingomyelin induces coupling of membrane leaflets in a cholesterol dependent manner. Biochim Biophys Acta. 2016 Feb;1858(2):281–288. PubMed PMID: 26654782. DOI:10.1016/j.bbamem.2015.12.003
- Needham D, Nunn RS. Elastic deformation and failure of lipid bilayer membranes containing cholesterol. Biophys J. 1990 Oct;58(4):997–1009. PubMed PMID: 2249000; PubMed Central PMCID: PMCPMC1281045. DOI:10.1016/S0006-3495(90)82444-9
- Gonzalez E, van Liempd S, Conde-Vancells J, et al. Serum UPLC-MS/MS metabolic profiling in an experimental model for acute-liver injury reveals potential biomarkers for hepatotoxicity. Metabolomics. 2012;8(6):997–1011. PubMed PMID: 23139648; PubMed Central PMCID: PMCPMC3490499.
- Bleijerveld OB, Klein W, Vaandrager AB, et al. Control of the CDPethanolamine pathway in mammalian cells: effect of CTP: phosphoethanolaminecytidylyltransferase overexpression and the amount of intracellular diacylglycerol. Biochem J. 2004 May 1;379(Pt 3):711–719. PubMed PMID: 14759225; PubMed Central PMCID: PMCPMC1224125. DOI:10.1042/BJ20031422
- Weijers RN. Lipid composition of cell membranes and its relevance in type 2 diabetes mellitus. Curr Diabetes Rev. 2012 Sep;8(5):390–400. PubMed PMID: 22698081; PubMed Central PMCID: PMC3474953.
- Holte LL, Peter SA, Sinnwell TM, et al. 2H nuclear magnetic resonance order parameter profiles suggest a change of molecular shape for phosphatidylcholines containing a polyunsaturated acyl chain. Biophys J. 1995 Jun;68(6):2396–2403. PubMed PMID: 7647244; PubMed Central PMCID: PMC1282150. DOI:10.1016/S0006-3495(95)80422-4
- Harland CW, Bradley MJ, Parthasarathy R. Phospholipid bilayers are viscoelastic. Proc Natl Acad Sci U S A. 2010 Nov 09;107(45):19146–19150. PubMed PMID: 20974934; PubMed Central PMCID: PMC2984223. DOI:10.1073/pnas.1010700107
- Sharma S, Rasool HI, Palanisamy V, et al. Structural-mechanical characterization of nanoparticle exosomes in human saliva, using correlative AFM, FESEM, and force spectroscopy. ACS Nano. 2010 Apr 27;4(4):1921–1926. PubMed PMID: 20218655; PubMed Central PMCID: PMCPMC2866049. DOI:10.1021/nn901824n
- Sharma S, Gillespie BM, Palanisamy V, et al. Quantitative nanostructural and single-molecule force spectroscopy biomolecular analysis of human-saliva-derived exosomes. Langmuir. 2011 Dec 6;27(23):14394–14400. PubMed PMID: 22017459; PubMed Central PMCID: PMCPMC3235036. DOI:10.1021/la2038763
- Sharma S, Das K, Woo J, et al. Nanofilaments on glioblastoma exosomes revealed by peak force microscopy. J R Soc Interface. 2014 Mar 6;11(92):20131150. PubMed PMID: 24402921; PubMed Central PMCID: PMCPMC3899882. DOI:10.1098/rsif.2013.1150
- Laney DE, Garcia RA, Parsons SM, et al. Changes in the elastic properties of cholinergic synaptic vesicles as measured by atomic force microscopy. Biophys J. 1997 Feb;72(2 Pt 1):806–813. PubMed PMID: 9017205; PubMed Central PMCID: PMCPMC1185603.
- Jin AJ, Prasad K, Smith PD, et al. Measuring the elasticity of clathrin-coated vesicles via atomic force microscopy. Biophys J. 2006 May 1;90(9):3333–3344. PubMed PMID: 16473913; PubMed Central PMCID: PMCPMC1432129. DOI:10.1529/biophysj.105.068742
- Spyratou E, Mourelatou EA, Makropoulou M, et al. Atomic force microscopy: a tool to study the structure, dynamics and stability of liposomal drug delivery systems. Expert Opin Drug Deliv. 2009 Mar;6(3):305–317. PubMed PMID: 19327046. DOI:10.1517/17425240902828312
- Bruno MJ, Rusinova R, Gleason NJ, et al. Interactions of drugs and amphiphiles with membranes: modulation of lipid bilayer elastic properties by changes in acyl chain unsaturation and protonation. Faraday Discuss. 2013;161:461–480; discussion 563-89. PubMed PMID: 23805753; PubMed Central PMCID: PMCPMC3703894.
- Hutchinson EC, Charles PD, Hester SS, et al. Conserved and host-specific features of influenza virion architecture. Nat Commun. 2014 Sep 16;5:4816. PubMed PMID: 25226414; PubMed Central PMCID: PMCPMC4167602.
- de Pablo PJ. Atomic force microscopy of virus shells. Semin Cell Dev Biol 2018 Jan;73:199–208. PubMed PMID: 28851598. DOI:10.1016/j.semcdb.2017.08.039
- Rong X, Wang B, Dunham MM, et al. Lpcat3-dependent production of arachidonoyl phospholipids is a key determinant of triglyceride secretion. eLife. 2015 Mar 25;4. PubMed PMID: 25806685; PubMed Central PMCID: PMC4400582. DOI:10.7554/eLife.06557
- van Meer G, Voelker DR, Feigenson GW. Membrane lipids: where they are and how they behave. Nat Rev Mol Cell Biol. 2008 Feb;9(2):112–124. PubMed PMID: 18216768; PubMed Central PMCID: PMC2642958. DOI:10.1038/nrm2330
- Hessvik NP, Overbye A, Brech A, et al. PIKfyve inhibition increases exosome release and induces secretory autophagy. Cell Mol Life Sci. 2016 Dec;73(24):4717–4737. PubMed PMID: 27438886. DOI:10.1007/s00018-016-2309-8
- Rodriguez-Enriquez S, Kai Y, Maldonado E, et al. Roles of mitophagy and the mitochondrial permeability transition in remodeling of cultured rat hepatocytes. Autophagy. 2009 Nov;5(8):1099–1106. PubMed PMID: 19783904; PubMed Central PMCID: PMC4170191.
- Lev S. Nonvesicular lipid transfer from the endoplasmic reticulum. Cold Spring Harb Perspect Biol. 2012 Oct 01;4(10). PubMed PMID: 23028121; PubMed Central PMCID: PMC3475164. DOI:10.1101/cshperspect.a013300
- Shuttleworth TJ. Arachidonic acid, ARC channels, and orai proteins. Cell Calcium. 2009 Jun;45(6):602–610. PubMed PMID: 19278724; PubMed Central PMCID: PMC2744097. DOI:10.1016/j.ceca.2009.02.001
- Lindblad B, Lindstedt S, Steen G. On the enzymic defects in hereditary tyrosinemia. Proc Natl Acad Sci U S A. 1977 Oct;74(10):4641–4645. PubMed PMID: 270706; PubMed Central PMCID: PMC432003.
- Hosios AM, Hecht VC, Danai LV, et al. Amino acids rather than glucose account for the majority of cell mass in proliferating mammalian cells. Dev Cell. 2016 Mar 7;36(5):540–549. PubMed PMID: 26954548; PubMed Central PMCID: PMCPMC4766004. DOI:10.1016/j.devcel.2016.02.012
- Lydic TA, Townsend S, Adda CG, et al. Rapid and comprehensive ‘shotgun’ lipidome profiling of colorectal cancer cell derived exosomes. Methods. 2015 Oct 01;87:83–95. PubMed PMID: 25907253; PubMed Central PMCID: PMC4615275. DOI:10.1016/j.ymeth.2015.04.014