
ABSTRACT
As one of the most abundant constituents of the tumour microenvironment (TME), cancer-associated fibroblasts (CAF) display critical roles during tumour progression and metastasis. Multiple classes of molecules including growth factors, cytokines, proteases and extracellular matrix proteins, are produced by CAF to act as mediators of the stroma-tumour interactions. One of the main channels for this communication is associated with extracellular vesicles (EV), which are secreted particles loaded with protein and genetic information. In this study, we evaluated the effects of EV derived from CAF primary human cell lines (n = 5) on proliferation, survival, migration, and invasion of oral squamous cell carcinoma (OSCC) cells. As controls, EV from human primary-established normal oral fibroblasts (NOF, n = 5) were used. Our in vitro assays showed that CAF-EV significantly induces migration and invasion of OSCC cells and promote a disseminated pattern of HSC-3 cell invasion in the 3D organotypic assay. Furthermore, gene expression analysis of EV-treated cancer cells revealed changes in the pathways associated with tumour metabolism and up-regulation of tumour invasion genes. Our findings suggest a significant role of CAF-EV in promoting the migration and invasion of OSCC cells, which are related to the activation of cancer-related pathways.
Introduction
Oral squamous cell carcinoma (OSCC) is the sixth most common cancer worldwide and represents more than 90% of all malignancies of the head and neck, affecting mostly the floor of mouth and tongue [Citation1]. As a solid tumour, the cooperation between cancer cells and tumour microenvironment (TME) is essential for OSCC progression, in which the so-called cancer-associated fibroblasts (CAF) play a major role [Citation2]. CAF is the most abundant cell type within the TME and are recognized as fibroblast-like cells that acquire the ability to express isoform α of the smooth muscle actin (α-SMA) [Citation3]. These cells originate either from resident fibroblasts, mesenchymal stem cells recruited from bone marrow or cancer cells that have undergone an epithelial-mesenchymal transition (EMT) [Citation4]. In OSCC, CAF has been shown to promote tumour cell migration and invasion [Citation5], proliferation [Citation6], adhesion [Citation7], immunosuppression [Citation8], angiogenesis [Citation9], and worsen the patients’ prognosis [Citation10].
A major mode of communication between tumour cells and TME components is through the secretion of extracellular vesicles (EV) [Citation11]. EV is a heterogeneous group of particles composed of a lipid bilayer and loaded with transmembrane and cytosolic proteins, as well as DNA and different types of RNA [Citation12]. EV, as an umbrella term, covers vesicles that vary in size (from 30 to 2000 nm in diameter) and intracellular origin or biogenesis, which are generally reported as exosomes or microvesicles [Citation13]. Exosomes are thought to be around 30–150 nm in diameter and are formed by inward budding of endosomal membranes. In turn, microvesicles are larger vesicles ranging from 100 to 1000 nm in diameter, ubiquitously assembled at and released from the plasma membrane through outward protrusion or budding [Citation14].
EV may carry a common set of components involved in their biogenesis and structure, but also several factors to interact with target cells [Citation15]. It is known that cancer-derived EV exert complex cross-talk effects on neighbouring stroma cells, contributing to the formation of pre-metastatic niches, promoting angiogenesis, modulating tumour stroma and interfering with the immune response [Citation16]. Furthermore, EV derived from TME cells may also modulate recipient cells, contributing to the formation of a highly complex stroma able to modulate the invasive and metastatic potential of the cancer cells [Citation16]. Together, EV secreted by both tumour and TME cells may instigate a functional pathway, favouring cancer progression [Citation17]. In this study, we show that CAF-EV interacts with OSCC cells and are able to stimulate their invasive potential.
Material and methods
Cell culture
Five primary cell cultures of both CAF and normal fibroblasts (NOF) were established, respectively, from OSCC and healthy human oral mucosa. CAF was isolated from histologically well-differentiated OSCC, removed from the floor of the mouth or the lateral border of the tongue. Fragments from both normal and cancerous tissues were washed three times in Dulbecco’s modified Eagle’s media (DMEM, Invitrogen, CA, USA) with antibiotics (1:200) and Mycozap™ 2 µl/ml (Lonza, Basel, Swiss), immediately after removal. With the aid of sterilized tweezers and scalpel, tissue fragments were cut in smaller pieces and incubated in DMEM supplemented with 10% fetal bovine serum (FBS, Invitrogen, CA, USA) and antibiotics. The media was exchanged every week until cells detached and became confluent. Both cell types were cultured up to the seventh passage maximum.
Four commercial human tongue OSCC cell lines, representing different levels of aggressiveness, were used in this study, as follows: HSC-3 and SAS (Health Science Research Resources Bank, Osaka, Japan), showing higher invasive and metastatic potential, and the less aggressive SCC-15 and SCC-25 cell lines (ATCC, VA, USA). OSCC cells were cultured in 1:1 DMEM/F-12 containing 10% FBS (Invitrogen, CA, USA), antibiotics and 0.4 ng/ml hydrocortisone (all from Sigma-Aldrich, Missouri, USA). All cell lines were grown in a humidified atmosphere of 5% CO2 at 37ºC. This study was approved by the Human Research Ethics Committee from the School of Dentistry, University of Campinas, Brazil.
Quantitative PCR (qRT-PCR)
Total RNA was isolated with TRIzol® reagent and quantitative reverse transcription-PCR (qRT-PCR) was performed with the StepOne Plus instrument (Applied Biosystems, CA, USA) as previously described [Citation3]. Individual samples were normalized according to the levels of the housekeeping PPIA (Peptidylprolyl Isomerase A) and efficiency curves were created through serial cDNA dilutions. The primer sequences used in this study are described in Supplementary Table 1.
Western blot
Western blot analysis was performed as described before [Citation5], using anti-α-SMA (monoclonal anti-human, clone 1A4, Dako, 1:400) and anti-β-actin (clone AC15, Sigma-Aldrich,1:30,000) as primary antibodies, and a fluorescent anti-mouse (APC/Cy7-conjugated antibody, Abcam, 1:1000) as the secondary antibody. The protein sign was detected using the UVITEC chamber (Cambridge, UK) under infrared light, and the relative expression was calculated using the Image J v1.46o software (National Institute of Health, Bethesda, Maryland, USA).
Immunofluorescence
Then, 1000 NOF and CAF were plated with 500 µl of complete medium in each well of an 8-wells culture chamber slide (Lab Tek, Nunc, Naperville, IL, USA) and incubated for 24 h. After washing with 150 µl of 1 × PBS, cells were fixed in 70% ethanol for 30 min and washed again three times with 500 µl of 1 × PBS. Cells were then incubated for 1 h with mouse anti-α-SMA antibody (monoclonal anti-human, clone 1A4, Dako, 1:100), followed by incubation with goat anti-mouse IgG conjugated with fluorescein (Vector Labs, Burlingame, CA, USA) at 1:250. Cells were mounted with Vectashield containing DAPI (Vector Labs, Burlingame, CA, USA) and examined under a photomicroscope equipped with epifluorescence (DMR Microscope, Leica, Germany). To generate fluorescent labelled images, cells were excited at 480/40 nm with a 527/30 bandpass filter.
Senescence assay
The Senescence Detection Kit® (Abcam, Cambridge, UK) was used to measure the percentage of senescent cells among CAF and NOF cultures through the expression of β-galactosidase activity, following the manufacturer’s instructions.
EV isolation, quantification, and characterization
EV was isolated using a differential ultracentrifugation method with some modifications [Citation18]. After culturing cells under serum-free conditions for 48 h, the conditioned medium (CM) was collected and centrifuged as following: 200 g for 10 min, 10.000 g for 90 min, and 100.000 g for 90 min, all at +4ºC. After air drying, EV were recovered in 100 µl of filtered PBS and stored at −80ºC. EV protein quantification was obtained using the colorimetric DC Protein Assay (BioRad®, CA, USA) following the manufacturer’s instructions. Nanoparticle Tracking Analysis (NTA – NanoSight NS300, Wiltshire, UK) was used to check the size distribution and the concentration of the vesicles, and immunoelectron microscopy (ImmunoEM) was applied using a gold-conjugated antibody against CD63 (1:50, BD Pharmingen, CA, USA), both as previously described [Citation19]. The Exo-Check™ exosome antibody array (System Biosciences, CA, USA) was also used to characterize the EV preparations, following the manufacturer’s recommendations. The relative expression of each protein was calculated using the Image J v1.46o software (National Institute of Health, USA).
EV treatment of human OSCC cell lines
To assess the effects of EV on malignant phenotypes, oral cancer cells were cultured in serum-free media containing 0.05 µg EV/103 cells. Initially, tumour cells were treated with EV from each one of the five NOF or CAF lines, and afterward with a pool of vesicles. To prepare pooled EV, equal amounts of vesicles from each of the five NOF or CAF lines were merged. The same total concentration (0.05 µg pooled EV/103 cells) was applied to each assay. Cancer cells were also cultured in the absence of EV (negative control), in order to be compared with the test groups.
Invasion and horizontal migration assays
Transwell inserts (Corning, New York, USA) were used in 24-well plates to assess the individual effect of each NOF- and CAF-EV in the cancer cell invasion (HSC-3, SAS, SCC-15, SCC-25) through myogel solidified with low-melting agarose [Citation20]. Cells were plated on top of the inserts together with EV in serum-free medium, either individually or pooled into two groups (CAF vs. NOF). After 72 h of incubation, the invasive cells were measured [Citation21]. The 3D-myoma organotypic model [Citation22] was applied with the HSC-3 cells co-cultured with pooled NOF or CAF derived EV. HSC-3 cells were seeded together with pooled NOF-EV and CAF-EV on the discs and allowed to invade into the myomas for 14 days. After that, the myomas were fixed in 4% formalin solution and immunostained with the pan-cytokeratin antibody (monoclonal mouse anti-human cytokeratin, AE1/AE3–M3515, dilution 1:200, Dako, CA, USA). Pictures were taken from the slides and analyzed on Image J v1.46o (National Institute of Health, USA).
Scratch wound healing assay was used to assess the effect of pooled NOF- and CAF-EV in HSC-3 cell migration, using the Zeiss Cell Observer spinning disc confocal (ZEISS, Ostalbkreis, Germany). Starved cells were seeded in a 24-well plate together with pooled NOF- and CAF-EV and proceed as explained before [Citation20].
Proliferation and apoptosis analyses
The bromodeoxyuridine-labelling assay (Cell Proliferation ELISA BrdU assays, Roche, Mannheim, Germany) was used to evaluate HSC-3 cell proliferation, whereas cell death was assessed by annexin V-labelling assay [Citation21] upon EV treatment. Cells were incubated with pooled NOF- or CAF-EV and proliferation and apoptosis were determined 24 h later. The annexin-V labelling assay was also used to determine the apoptosis rate of NOF and CAF cell lines after serum deprivation during EV isolation procedures.
To confirm the apoptosis results on HSC-3 treated cells, ruling out the possibility of a false positive result based on the transfer of phosphatidylserine from EV to cells, a TUNEL assay (Roche, Mannheim, Germany) was performed following the manufacturer’s instructions. As positive control of the reaction, cells were treated with 0.03 μM staurosporine (Invitrogen, CA, USA) as previously described [Citation21].
EV proteomics
EV (3 × 10⁸) from CAF and NOF were suspended in up to 30 µl of urea buffer (50 mM Tris-HCl pH 7.5, 8 M urea, 2 M thiourea, and 1 mM DTT) for protein extraction. The content of EV proteins was analyzed by mass spectrometry. Briefly, samples in urea buffer were sonicated for 5 min at RT. The protein extracts were reduced, alkylated, trypsin digested and desalted as previously described [Citation23]. Tryptic-digested peptides were dried in a speed-vac instrument and identified in an ETD enabled LTQ Orbitrap Velos mass spectrometer (Thermo Fisher Scientific, Bremen, Germany) connected to the EASY-nLC system (Proxeon Biosystem, Florida, USA) through a Proxeon nanoelectrospray ion source in a data-dependent mode. Peptides were separated by a 2–30% acetonitrile gradient in 0.1% formic acid using an analytical PicoFrit Column (20 cm × ID75 μm, 5 μm particle size, New objective) at a flow rate of 300 nl/min over 220 min. The nanoelectrospray voltage was set to 2.2 kV, and the source temperature was 275°C. All instrument methods for the LTQ Orbitrap Velos were run in the data-dependent analysis (DDA) mode. The full scan MS spectra (m/z 300–1.600) were acquired in the Orbitrap analyzer after accumulation to a target value of 1e6. The resolution in the Orbitrap was set to r = 60.000. The 20 most intense peptide ions with charge states of ≥2 were sequentially isolated to a target value of 5.000 and fragmented in the linear ion trap by low-energy CID (normalized collision energy of 35%). The signal threshold for triggering an MS/MS event was set to 1.000 counts. Dynamic exclusion was enabled with an exclusion size list of 500, exclusion duration of 60 s, and a repeat count of 1. An activation q = 0.25 and activation time of 10 ms was used. Protein data were processed using Proteome Discoverer 1.3 (Thermo Fisher Scientific, CA, USA) following a published protocol [Citation24]. Peptides were identified by using the Sequest search engine, where target-decoy searches were performed against the Homo Sapiens UniProt database (HUMAN_Uniprot_release_07012015.fasta). The parent and fragment mass tolerances were set at 10 ppm and 0.5 Da, respectively. The enzyme used was trypsin, and the maximum allowable cleavages were set to 2. FDR for the peptide and protein levels were both set at 0.01.
Protein data analysis
The protein datasets generated by Proteome Discoverer analysis were clustered in categories depending on their known main biological function using two different open source bioinformatics resources: DAVID Bioinformatics Resource 6.82 and PANTHER (Protein Analysis Through Evolutionary Relationships) database 3. In both cases, the whole Homo sapiens genome was employed as a background list. The analysis of cellular components and biological processes was performed in DAVID and selecting the GO terms for Cellular Component (GOTERM_CC_FAT) and for Biological Process (GOTERM_BP DIRECT). Pathway over-representation analysis was performed using DAVID bioinformatics resource and comparing the representation of the different KEGG terms (KEGG_PATHWAY) to the expected pathway representation in human. This analysis was coupled with the pathway enrichment analysis performed with PANTHER using the PANTHER Molecular Function, Pathway keywords and exported as a bar chart of representation percentages.
Microarray gene expression analysis of EV-treated HSC-3 cells
HSC-3 cells were incubated with pooled NOF- or CAF-EV (or without EV) in triplicates. After incubation, cells were washed in PBS and total RNA was extracted by Qiagen RNA kit, followed by DNAse digestion (Qiagen, Hilden, Germany). Following manufacturer’s instructions, biotinylated cDNA was synthesized and fragmented to 35 to 200 nt (GeneChip 3ʹIVT Express kit, Affymetrix, CA, USA) and hybridized to arrays (Affymetrix GeneChip Human Genome U133 Plus 2.0 Arrays). The arrays were scanned on GeneChip Scanner 3000, and the dChip software [Citation25] was used for expression analyses (GEO, GSE85435).
To generate the final list of interest, we selected the genes with significantly differing expression (p < 0.05) between NOF- and CAF-EV treatment presenting fold changes ≥1.3 (for up-regulation) or ≤1.3 (for down-regulation), which were normalized by the control. The list was imported into the Enrichr system (http://amp.pharm.mssm.edu/Enrichr/) [Citation26] to analyze the main enriched pathways (KEGG 2016) and transcription factors (ChEA 2016), using the Homo sapiens genome as background. The criteria for selecting the top terms were: (1) lowest p-value (up to ≤0.05), (2) minimum of two genes assigned in the cluster, and (3) exclusion of pathways annotated for viral conditions or diseases not associated with cancer.
Statistical analysis
Mann-Whitney U test or one-way analysis of variance (ANOVA) with post hoc comparisons based on the Tukey’s multiple comparisons test were applied using the GraphPad Prism 5 software. The level of significance considered was 5% (p ≤ 0.05).
Results
Characterization of CAF cell lines
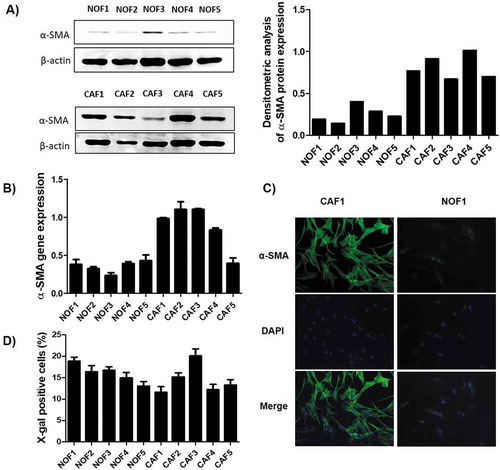
Cells were tested for the expression of α-SMA, the most reliable marker for CAF. As expected, CAF cells showed higher amounts of this marker in both western blot ()) and qPCR ()). To confirm, immunofluorescence staining showed that CAF cells presented the typically stressed actin fibres more evident than NOF ()). Among the other putative markers tested by qPCR, only TIMP-1 showed higher expression in CAF compared to NOF cells. The complete panel of the tested markers is presented in Supplementary Figure 1. The senescence level, represented by the β-galactosidase activity, was similar among all cell lines, showing an average activity varying from 12% to 21% ()).
Figure 1. Characterization of the primary NOF and CAF cell cultures. The relative expression of α-SMA was higher in CAF when compared to NOF cells, as revealed by both western blot (a), which can be graphically visualized by the densitometry analysis relative to β-actin expression, and by qRT-PCR (b). (c) Representative images of CAF and NOF immunofluorescence assay revealed the stressed actin fibres typical of CAF. (d) The senescence of these cells was accessed by the expression of β-galactosidase activity, and the bars represent the percentage of positive cells. The senescence rate was of approximately 20% maximum for all cell cultures.
Characterization of EV
NOF and CAF cells were tested after 48 h of serum deprivation for EV isolation and showed no increase of apoptosis when comparing to cells cultured in complete medium (Supplementary Figure 2(a)). The size distribution of the isolated EV was similar in NOF- and CAF-EV, most of them being around 100 and 200 nm (Supplementary Figure 2(b)). The concentration of EV, as measured by EV/ml of CM, varied among cell lines but CAF4 and CAF5 were the most productive (Supplementary Figure 2(c)). The samples were enriched in some EV markers, such as CD81, TSG101, FLOT1, and ALIX, showing similar expression in both groups (Supplementary Figure 2(d,e)). Some of the vesicles were positively labelled with the anti-CD63 antibody in the ImmunoEM and were seen as round- or cup-shaped bilayer structures with varied size, which were mostly distributed as isolated rather than aggregated particles (Supplementary Figure 2(f)).
Effects of CAF-EV on OSCC invasion
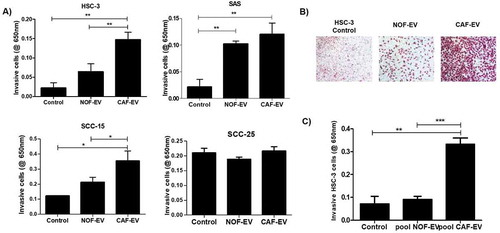
EV from each NOF and CAF cell line was cultured with OSCC cells and let to invade into a myogel matrix. The CAF-EV were individually able to induce invasion of the OSCC cell lines, with more intense effects in the aggressive cell lines: HSC-3 when compared to control (p = 0.006) and to NOF-EV (p = 0.01); and SAS for the comparison with control (p = 0.007) ()). A lower effect was found in the less aggressive cell line SCC-15 when compared to control (p = 0.047) and to NOF-EV (p = 0.048). The invasion of SCC-25 was not significantly different for any comparisons between treatments or control ()). Still, when the vesicles were pooled into NOF or CAF group, the invasion was significantly induced by the pooled CAF-EV in HSC-3 cells comparing to control (p = 0.01) and to NOF-EV (p = 0.001; ,c)).
Figure 2. CAF-EV induce invasion of OSCC cells. (a) CAF-EV from each of the five cell lines were individually able to induce significantly the invasion of the tumour cells (HSC-3, SAS, SCC-15) in the myogel-coated transwell when compared to NOF-EV and to the control without vesicles. (b) Representative images of the invaded HSC-3 cells. (c) Pooled CAF-EV were also able to induce a higher invasion rate of HSC-3 cells. *p ≤ 0.05, **p ≤ 0.01, ***p ≤ 0.001.
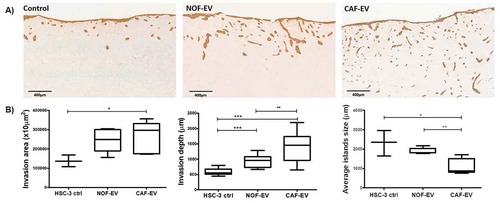
Since HSC-3 cells were the most responsive to pooled EV, the subsequent analyses were performed on this cell line. ) illustrates the assessment of the invasive potential of the HSC-3 cells in the 3D-myoma organotypic model. The HSC-3 cells cultured with pooled CAF-EV invaded in a broader area when compared to the control without EV (p = 0.039, ) left); deeper when compared to NOF-EV (p = 0.003) and to the negative control (p < 0.0001) () middle); and showing smaller tumor islands when compared to the NOF-EV group (p = 0.005) and to the negative control (p = 0.047) () right).
Figure 3. CAF-EV promote a budding pattern of invasion. Pooled NOF- or CAF-EV were cultured with HSC-3 cells and let to invade within the 3D-myoma organotypic model for 14 days. (a) Representative images of the invaded cells stained with pan-cytokeratin (scale bars represent 400 µm). (b) Quantification of the invaded cells. CAF-EV induced HSC-3 cells to invade deeper and in smaller tumour cell islands compared to the NOF-EV treated and to the control cells (HSC-3 cells without EV). *p ≤ 0.05, **p ≤ 0.01, ***p ≤ 0.001.
Effects of CAF-EV on HSC-3 cell migration, proliferation, and apoptosis
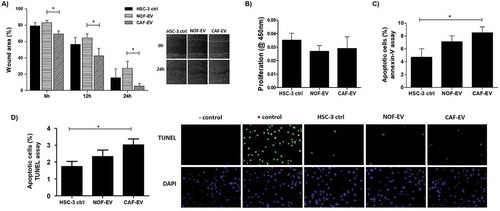
Migration, proliferation, and apoptosis were evaluated in HSC-3 cells incubated with pooled EV. On the horizontal cell migration assay, HSC-3 cells cultured with CAF-EV closed the wounds faster than NOF-EV at 12 and 24 h (p < 0.05; )). The treatment did not impair the proliferation of tumour cells (). The apoptosis rate was significantly higher in CAF-EV group when compared to the control in the annexin-V assay (p < 0.05; ), as well as in the TUNEL assay (p < 0.05; ).
Figure 4. Effect of CAF-EV on migration, proliferation, and apoptosis of HSC-3 cells. (a) Pooled NOF-and CAF-EV were added to the scratched wounds of HSC-3 cells. HSC-3 cells migrated faster when cultured with CAF-EV at 6 h, 12 h and 24 h (p < 0.05) compared to NOF-EV. Pictures represent the initial (0 h) and final (24 h) views of the wounded areas, delimitated by a white line. The graph on the left panel shows the decrease of wound area in percentages when the area at 0 h was set to be 100%. The EV treatment did not affect the proliferation at 24 h (b), but the apoptosis rate at 24 h was significantly higher in HSC-3 cells treated with CAF-EV compared to the control (c), showed as a percentage of apoptotic cells, as resulted from an annexin-V based apoptosis assay. (d) To confirm the results, a TUNEL assay was also performed in EV-treated HSC-3 cells, resulting in similar findings. *p ≤ 0.05.
Protein content analysis from oral NOF- and CAF-EV
To determine the protein content profile of CAF and NOF-EV, we performed a mass spectrometry-based proteomic discovery analysis approach and analyzed three independent experiments. A total of 77 and 141 proteins were detected, respectively, in CAF-EV and NOF-EV, of which 50 proteins were common between both vesicle population (~35% overlap), most likely representing constitutive fibroblast secreted EV ((a)). The set of proteins exclusively identified in CAF-EV (27 proteins) or NOF-EVs (64 proteins), along with common proteins, including the up-or down-regulates proteins considering a fold-change cut off ≥2, are shown in Supplementary Table 2. Among the identified proteins in our dataset, some are listed amidst the top EV markers in EVpedia database (www.evpedia.info/), such as Glyceraldehyde-3-phosphate dehydrogenase (GAPDH), Pyruvate kinase (PKM), Heat shock cognate 71 kDa protein (HSPA8), L-lactate dehydrogenase A chain and B chain (LDHA, LDHB), and Annexin 2 and 5 (ANXA2, ANXA5). The recognition of common EV markers can improve the current methods of identification and characterization of these vesicles. It is worthy to mention that the current EV databases do not present a protein dataset originated specifically from oral NOF or CAF. After screening the three fibroblast-derived EV protein dataset available in EVpedia for Homo sapiens (accessed on 15 August 2018), it was found that 45 proteins described in this study have not been identified before in fibroblasts (either normal or CAF). The list was manually reviewed and is detailed in the Supplementary Table 3.
Figure 5. Proteome of constitutive EV released from Fibroblasts. (a) Venn diagram of the numerical values for common and unique proteins present in CAF (violet) and NOF (grey). (b) Analysis of cellular component GO terms. The proteins detected in both CAF and NOF fractions (total 50 constitutive EV proteins) were grouped using GO terms related to cellular component analysis process using DAVID [Citation56]. (c) Analysis of molecular function GO terms of total EV proteins of both groups. (d, e) EV proteins were grouped in CAF (D) or NOF (E) using (GO) terms related to biological process analysis using DAVID (p < 0.05) and shown in Supplementary Table 7. The graph shows the percentage of proteins identified by mass spectrometry that fall into designated GO category relative to the total number of proteins in the category. GO FAT was used to minimize the redundancy of general GO terms in the analysis. Categories with enrichment greater than 6% are shown.
![Figure 5. Proteome of constitutive EV released from Fibroblasts. (a) Venn diagram of the numerical values for common and unique proteins present in CAF (violet) and NOF (grey). (b) Analysis of cellular component GO terms. The proteins detected in both CAF and NOF fractions (total 50 constitutive EV proteins) were grouped using GO terms related to cellular component analysis process using DAVID [Citation56]. (c) Analysis of molecular function GO terms of total EV proteins of both groups. (d, e) EV proteins were grouped in CAF (D) or NOF (E) using (GO) terms related to biological process analysis using DAVID (p < 0.05) and shown in Supplementary Table 7. The graph shows the percentage of proteins identified by mass spectrometry that fall into designated GO category relative to the total number of proteins in the category. GO FAT was used to minimize the redundancy of general GO terms in the analysis. Categories with enrichment greater than 6% are shown.](/cms/asset/2679c638-3c6c-47c9-8a31-93a64c96c270/zjev_a_1578525_f0005_oc.jpg)
Analysis of GO terms showed that the cellular component terms “extracellular region”, “membrane-bounded vesicle”, “extracellular organelle”, “extracellular vesicle”, and “extracellular exosome” were the highest enriched fractions (above 68%) of constitutive EVs (CAF and NOF in total) (Supplementary Table 4, ), which are consistent with the vesicular and extracellular nature of these EV proteins. As for the terms “endosome”, “endolysosome”, “lysosomal membrane” and “lytic vacuole membrane” were the major exclusively enriched in CAF-EV (Supplementary Table 5), while “cell junction”, “adherens and anchoring junction”, “cytosol”, “cell-substrate junction” and “focal adhesion” were among the major exclusive terms in NOF-EV(Supplementary Table 6). The GO analysis of molecular functions showed that protein binding is the major category for both NOF and CAF, although in significantly different proportions (25% enrichment for NOF, and approximately 7.5% for CAF). In line, identical protein binding, serine-type endopeptidase activity, signalling receptor and protein kinase binding were the most enriched for the CAF-EV proteins set, while RNA binding, ATP binding, calcium ion, protein domain specific, metal ion, integrin and identical protein binding, were the top enriched for the NOF-EV proteins (). DAVID analysis of biological processes revealed GO terms related to response to negative regulation of endopeptidase activity, receptor-mediated endocytosis, platelet degranulation, and collagen catabolic process as significantly predominant categories (each one representing 12% of all processes verified, p < 0.05) in CAF-EV protein content (Supplementary Table 7, )). In the other hand, NOF-EV protein content analyzed revealed the top enriched terms related to negative regulation of apoptotic process (14.5%) and cell adhesion (12.9%) (Supplementary Table 7, )).
CAF-EV modulates gene expression of HSC-3 malignant cell line
In order to determine whether the EV content has a modulatory effect on tumour cells, cDNA microarray was applied on total RNA isolated from HSC-3 cells treated with NOF- or CAF-EV. A total of 32 genes were significantly differentially expressed (FC ≥ 1.3), demonstrating the EV modulation of gene expression pattern in the malignant oral cell line. From these, 29 were up-regulated and 3 were down-regulated in HSC-3 cells after CAF-EV treatment (Supplementary Table 8). One of the negatively regulated genes by CAF-EV was the Cell Division Cycle 27 gene (CACD27), which is relevant for the cell cycle progression controlling. The KEGG pathways enrichment analysis was applied to this group of genes and the most significantly annotated were: Proteoglycans in cancer, Metabolic pathways, Leukocyte transendothelial migration, and Regulation of actin cytoskeleton. All genes clustered into these enriched pathways were up-regulated in CAF-EV treatment group (Supplementary Table 9).
In an attempt to better understand the modulation of gene expression by CAF-EV, we searched for transcription factors associated with the listed genes using Enrichr system [Citation26] (Supplementary Table 10). To narrow down the possibilities, the String tool (https://string-db.org/) [Citation27] was used to detect interactions between these transcription factors and the CAF-EV proteins. It was found that the SMAD Family Member 3 (SMAD3) can regulate the expression of seven of the CAF-EV modulated genes (POLR2J4, POLD4, BCL2L11, GPC1, GBA, FLOT1, FAM129B), and also interacts with 3 CAF-EV proteins: Importin subunit beta-1 (KPNB1), Thrombospondin-1 (THBS1), and Interstitial collagenase (MMP1).
Discussion
The molecular mechanisms associated with CAF-promoting tumorigenesis are only partially understood, hampering the development of stromal-directed therapies. Therapies targeting functional proteins expressed by CAF, depletion of CAF by apoptosis and reprogramming CAF into normal fibroblasts are the current strategies in testing, but the results so far are limited [Citation28]. Here we identified that EV released by CAF are key promoters of OSCC migration and invasion via activation of specific biological processes including structural and motility pathways.
CAF constitute the main component of TME and are typically characterized by mesenchymal markers, such as α-SMA [Citation4]. Besides α-SMA, CAF expressed higher mRNA amounts of TIMP-1, a member of the tissue inhibitor of metalloproteinases family, when compared with NOF. In consonance, upregulation of TIMP-1 was shown to induce a transformation of normal liver fibroblasts into CAF [Citation29] and to stimulate the accumulation of CAF within prostate and colon cancer tissues [Citation30]. It is well accepted that CAF represents indeed a heterogeneous cell population, and the expression of different markers possibly reflect the cell of origin, the activation state, and the tumour-promoting properties of the cells [Citation4]. Among the heterogeneous subtypes of CAF in OSCC, the myofibroblastic and the senescent subtypes are the most characterized ones. Both subtypes are α-SMA-positive cells, characterized by tumour-promoting roles, but senescent CAF show β-galactosidase activity [Citation31]. Once the CAF cell lines presented activity of the β-galactosidase in under 20% of cells used in the present study, a myofibroblastic pattern was observed in all cell lines. To avoid the replicative senescence induction of CAF, the cells in the experiments reported here were cultured up to a maximum of seven passages.
CAF-EV induced OSCC cell invasion into a gelatinous matrix and migration towards a wounded area, and the strongest effect on invasion was seen in HSC-3, the most aggressive cell line. In this case, CAF-EV may work by boosting an innate characteristic of the cancer cells. Similarly, Leca et al. [Citation32] observed an increased migration of pancreatic ductal adenocarcinoma cells after the uptake of CAF-derived ANXA6 + EV, and Luga et al. [Citation33] showed that CAF exosomes stimulate breast cancer cell migration and metastasis in a CD81-dependent manner [Citation32,Citation33].
Tumour invasion was also tested into a solid human leiomyoma tissue, and HSC-3 cells treated with CAF-EV invaded deeper and as smaller budding islands. High amounts of tumour budding have been shown to significantly associate with lymph node metastasis, depth of invasion, CAF-abundant stroma in OSCC, and poor prognosis in oral tongue cancer [Citation34–Citation36]. The budding formation is considered the first step in the metastasis process of a solid tumour, as the buds seem to be involved in degradation of the peritumoral connective tissue, evasion of host response and invasion into lymphatic and blood vessels leading to local and distant metastasis [Citation37,Citation38]. Since our results demonstrated the correlation between CAF-EV and tumour cells spreading in a human leiomyoma matrix, it may represent the initial step for local invasion and metastasis. The treatment with CAF-EV did not alter the proliferation of the cancer cells, which confirms a real invasive and migratory phenotype. Interestingly, the budding phenomenon could be related to the apoptotic phenotype promoted by CAF-EV. As previously hypothesized by Itoh et al. (2017), the CAF-led invasion is characterized by the movement of individual cancer cells away from the tumour, and adequate cancer cell apoptosis may promote cancer dissemination [Citation39].
Protein cargo of CAF-EV has not been extensively addressed before. It is important to recognize proteins that are unique or differentially expressed in vesicles derived from this cellular subtype, to better characterize them and understand the mechanisms underlying their functional phenotypes. GO analysis of EV proteins profile revealed that biological processes related to cell adhesion and negative regulation of apoptosis were the most frequent terms for NOF-EV. On contrary, CAF-EV seems to lose those properties since its protein content was mainly related to collagen catabolism and platelet degranulation. This proteolytic profile can explain the migrative/invasive phenotype of cancer cells when treated with CAF-EV. It has been shown that increased adhesion to the extracellular matrix (ECM) and decreased adhesion to tumour cells can result in invasive tumour behaviours [Citation40]. During the initial process of tumour invasion, extracellular proteases degrade the basement membrane, leading to the migration of motile cancer cells through the basal lamina stroma and subsequent remodelling of the tumour stroma, where CAF play a pivotal role [Citation41]. This remodelling results in structural and mechanical changes in the stroma, promoting proangiogenic signalling and providing a safe niche for cancer cell survival and proliferation [Citation42]. In addition, platelet activation and degranulation have been shown to promote pro-survival and pro-angiogenic signalling in ovarian cancer cells [Citation43]. Platelets contribute to cancer metastasis via facilitating tumour cell migration, invasion, arrest within the vasculature, and even providing protection from host-immune system defences [Citation44].
Bioinformatic tools were applied to uncover the genes differentially expressed in HSC-3 cells treated with CAF- or NOF-EV, and most of them were involved in metabolism pathways. It is hypothesized that nutrient/oxygen deprived epithelial cancer cells present within solid tumours are able to survive these conditions as a result of their ability to undergo extensive metabolic reprogramming, the so-called reverse Warburg effect, and exploit the metabolic capacities of stromal cells such as CAF [Citation41]. In the other hand, it was recently shown that EV can function as independent, extracellular metabolic units able to modify the concentrations of critical nutrients, with the potential to affect the physiology of their microenvironment [Citation45]. More specifically, CAF-EV can induce central carbon metabolism in target cells and promote tumour growth under nutrient deprivation or nutrient stressed conditions, disabling tumour cells oxygen-based energy production [Citation46]. In line with our results, Principe et al. (2018) suggested an enrichment of proteins involved in metabolism and energy pathways in CAF-EV when compared to normal fibroblasts [Citation47]. Therefore, our study suggests a modulation of genes involved in OSCC tumour metabolism, regulated by the transfer of CAF-EV cargo.
Interestingly, Rho-associated coiled-coil kinase 2 (ROCK2) was clustered into three of the enriched pathways for CAF-EV modulated genes. ROCK2 is an oncoprotein with important roles in tumour proliferation, apoptosis, adhesion, migration, and invasion, and its deregulated expression has been reported in different solid tumours [Citation48]. Enhanced expression of ROCK2 in an OSCC cell line was shown to increase the activity of Rho GTPase signalling cascade, promoting tumour cell migration and invasion [Citation49]. We have recently shown that in human OSCC samples, ROCK2 is highly expressed in 74% of the cases, its amount is associated with advanced clinical stage, and its expression followed the increase of CAF density within the stroma [Citation48], which may suggest a crosstalk between tumour and CAF cells. Together, these results suggest that blocking tumour ROCK2 expression and/or its modulation by CAF-EV could hamper OSCC invasion.
The top transcription factors associated with the CAF-EV modulated genes were assessed, and SMAD3 was found to be one of the most representative molecules. SMAD3 is the major intracellular mediator of TGF-β signalling, functioning as both positive and negative regulator in carcinogenesis [Citation50]. It was recently reported that hepatocellular carcinoma cells could promote cancer cell proliferation and lung metastases formation in a paracrine/endocrinal way through SMAD3-containing exosomes [Citation51]. Since we did not detect SMAD3 as an EV content, we speculated that proteins inside the vesicles could interact with SMAD3 to modulate the gene expression in cancer cells. Three proteins overexpressed in CAF-EV from our dataset were found to interact with SMAD3, being them Importin subunit beta-1 (KPNB1), Thrombospondin-1 (THBS1), and Interstitial collagenase (MMP1).
Among the genes from our dataset that can possibly interact with SMAD3, some has been related to tumorigenesis. Glypican 1 (GPC1) is a surface proteoglycan overexpressed in many cancer cells with the most abundant increase observed in pancreatic cancer, found to be specifically enriched on cancer cell-derived exosomes [Citation52]. In addition, GPC1 has been suggested as an early diagnostic and prognostic marker for pancreatic ductal adenocarcinoma [Citation53]. The Bcl2-Interacting Mediator of Cell Death (BCL2L11) belongs to the BCL-2 family, and acts as a central regulator of the intrinsic apoptotic cascade and mediates cell apoptosis [Citation54]. The overexpression of this gene can justify the apoptotic phenotype induced by CAF-EV in our study. The Family With Sequence Similarity 129 Member B (FAM129B) is up-regulated in many types of cancer, including breast, kidney, large intestine, and lung, and was associated with tumour cell proliferation and invasion [Citation55]. Finally, Flotillin 1 (FLOT1) was shown to be up-regulated in oral tongue cancer cell lines and tumour tissue, and its overexpression was correlated with shortened overall survival [Citation56]. FLOT1 are lipid raft proteins that play important roles in cell adhesion, actin cytoskeleton reorganization, endocytosis, phagocytosis and the transduction of cellular signals [Citation56].
In summary, our results show that CAF-EV promotes migration and budding pattern of invasion in OSCC cells. The budding formation may represent the initial steps of the local tumour invasion and could be related to the further development of distant metastases. CAF-EV-treated tumour cells revealed a modified gene expression associated with metabolic pathways and up-regulation of genes associated with tumour invasion such as ROCK2, FLOT1, and FAM129B. These results suggest an active transference of EV cargo from the surrounding stroma to the tumour, and the detailed molecular mechanisms by which this process develops needs to be further investigated.
Disclosure of interest
The authors report no conflict of interest.
Supplemental Material
Download Zip (714 KB)Acknowledgments
The skilful technical assistance of Ms Maija-Leena Lehtonen (University of Oulu), Ph.D. Ilkka Miinalainen (Biocenter Oulu Microscopy Service), Ph.D. Maija Risteli (University of Oulu), Ph.D. Sami Yokoo (LNBio) and Ph.D. Fabio Teo (Unicamp) is appreciated.
Disclosure statement
No potential conflict of interest was reported by the authors.
Supplementary material
Supplemental data for this article can be accessed here.
Additional information
Funding
Related Research Data
References
- Warnakulasuriya S. Global epidemiology of oral and oropharyngeal cancer. Oral Oncol. 2009;45(4–5):309–12.
- Wu JS, Sheng SR, Liang XH, et al. The role of tumor microenvironment in collective tumor cell invasion. Future Oncol. 2017 May;13(11):991–1002.
- Sobral LM, Zecchin KG, Nascimento de Aquino S, et al. Isolation and characterization of myofibroblast cell lines from oral squamous cell carcinoma. Oncol Rep. 2011a Apr;25(4):1013–1020.
- Prime SS, Cirillo N, Hassona Y, et al. Fibroblast activation and senescence in oral cancer. J Oral Pathol Med. 2017 Feb;46(2):82–88.
- Sobral LM, Bufalino A, Lopes MA, et al. Myofibroblasts in the stroma of oral cancer promote tumorigenesis via secretion of activin A. Oral Oncol. 2011b Sep;47(9):840–846.
- Kellermann MG, Sobral LM, Da Silva SD, et al. Mutual paracrine effects of oral squamous cell carcinoma cells and normal oral fibroblasts: induction of fibroblast to myofibroblast transdifferentiation and modulation of tumor cell proliferation. Oral Oncol. 2008 May;44(5):509–517.
- Cirillo N, Hassona Y, Celentano A, et al. Cancer-associated fibroblasts regulate keratinocyte cell-cell adhesion via TGF-β-dependent pathways in genotype-specific oral cancer. Carcinogenesis. 2017 Jan;38(1):76–85.
- Takahashi H, Sakakura K, Kudo T, et al. Cancer-associated fibroblasts promote an immunosuppressive microenvironment through the induction and accumulation of protumoral macrophages. Oncotarget. 2017 Jan 31;8(5):8633–8647.
- Kayamori K, Katsube K, Sakamoto K, et al. NOTCH3 is induced in cancer-associated fibroblasts and promotes angiogenesis in oral squamous cell carcinoma. PLoS One. 2016 Apr 28;11(4):e0154112.
- Dourado MR, Guerra ENS, Salo T, et al. Prognostic value of the immunohistochemical detection of cancer-associated fibroblasts in oral cancer: A systematic review and meta-analysis. J Oral Pathol Med. 2018 May;47(5):443–453.
- Webber J, Yeung V, Clayton A. Extracellular vesicles as modulators of the cancer microenvironment. Semin Cell Dev Biol. 2015 Apr;40:27–34.
- Tkach M, Théry C. Communication by extracellular vesicles: where we are and where we need to go. Cell. 2016 Mar 10;164(6):1226–1232.
- Verma M, Lam TK, Hebert E, et al. Extracellular vesicles: potential applications in cancer diagnosis, prognosis, and epidemiology. BMC Clin Pathol. 2015;15:6.
- Kalra H, Drummen GP, Mathivanan S. Focus on extracellular vesicles: introducing the next small big thing. Int J Mol Sci. 2016 Feb 6;17(2):170.
- Lo Cicero A, Stahl PD, Raposo G. Extracellular vesicles shuffling intercellular messages: for good or for bad. Curr Opin Cell Biol. 2015 Aug;35:69–77.
- Becker A, Thakur BK, Weiss JM, et al. Extracellular vesicles in cancer: cell-to-cell mediators of metastasis. Cancer Cell. 2016 Dec 12;30(6):836–848.
- Han L, Xu J, Xu Q, et al. Extracellular vesicles in the tumor microenvironment: therapeutic resistance, clinical biomarkers, and targeting strategies. Med Res Rev. 2017 Nov;37(6):1318–1349.
- Théry C, Amigorena S, Raposo G, et al. Isolation and characterization of exosomes from cell culture supernatants and biological fluids. Curr Protoc Cell Biol. 2006 Apr;Chapter 3: Unit 3.22. (3):3–22.
- Al-Samadi A, Awad SA, Tuomainen K, et al. Crosstalk between tongue carcinoma cells, extracellular vesicles, and immune cells in vitro and in vivo models. Oncotarget. 2017 May 10;8(36):60123–60134.
- Salo T, Sutinen M, Hoque Apu E, et al. A novel human leiomyoma tissue derived matrix for cell culture studies. BMC Cancer. 2015 Dec;16(15):981.
- Bufalino A, Cervigne NK, de Oliveira CE, et al. Low miR-143/miR-145 cluster levels induce activin a overexpression in oral squamous cell carcinomas, which contributes to poor prognosis. PLoS ONE. 2015;10(8):e0136599.
- Nurmenniemi S, Sinikumpu T, Alahuhta I, et al. A novel organotypic model mimics the tumor microenvironment. Am J Pathol. 2009 Sep;175(3):1281–1291.
- Winck FV, Prado Ribeiro AC, Ramos Domingues R, et al. Insights into immune responses in oral cancer through proteomic analysis of saliva and salivary extracellular vesicles. Sci Rep. 2015 Nov;5(5):16305.
- Kawahara R, Meirelles GV, Heberle H, et al. Integrative analysis to select cancer candidate biomarkers to targeted validation. Oncotarget. 2015 Dec 22;6(41):43635–43652.
- Li C, Wong WH. Model-based analysis of oligonucleotide arrays: expression index computation and outlier detection. Proc Natl Acad Sci U S A. 2001 Jan 2;98(1):31–36.
- Kuleshov MV, Jones MR, Rouillard AD, et al. Enrichr: a comprehensive gene set enrichment analysis web server 2016 update. Nucleic Acids Res. 2016 Jul 8;44(W1):W90–7.
- Szklarczyk D, Morris JH, Cook H, et al. The STRING database in 2017: quality-controlled protein-protein association networks, made broadly accessible. Nucleic Acids Res. 2017;45:D362–68.
- Xu Y, Zhou X, Mei M, et al. Reprograming carcinoma-associated fibroblasts by microRNAs. Curr Mol Med. 2017;17(5):341–349.
- Zheng X, Xu M, Yao B, et al. IL-6/STAT3 axis initiated CAFs via up-regulating TIMP-1 which was attenuated by acetylation of STAT3 induced by PCAF in HCC microenvironment. Cell Signal. 2016 Sep;28(9):1314–1324.
- Gong Y, Scott E, Lu R, et al. TIMP-1 promotes accumulation of cancer associated fibroblasts and cancer progression. PLoS One. 2013 Oct 15;8(10):e77366.
- Kabir TD, Leigh RJ, Tasena H, et al. A miR-335/COX-2/PTEN axis regulates the secretory phenotype of senescent cancer-associated fibroblasts. Aging (Albany NY). 2016 Aug;8(8):1608–1635.
- Leca J, Martinez S, Lac S, et al. Cancer-associated fibroblast-derived annexin A6+ extracellular vesicles support pancreatic cancer aggressiveness. J Clin Invest. 2016 Nov 1;126(11):4140–4156.
- Luga V, Zhang L, Viloria-Petit AM, et al. Exosomes mediate stromal mobilization of autocrine Wnt-PCP signaling in breast cancer cell migration. Cell. 2012 Dec 21;151(7):1542–1556.
- Almangush A, Pirinen M, Heikkinen L, et al. Tumor budding in oral squamous cell carcinoma: a meta-analysis. Br J Cancer. 2018 Feb 20;118(4):577–586.
- Almangush A, Leivo I, Siponen M, et al. Evaluation of the budding and depth of invasion (BD) model in oral tongue cancer biopsies. Virchows Arch. 2018 Feb;472(2):231–236.
- Almangush A, Bello IO, Keski-Säntti H, et al. Depth of invasion, tumor budding, and worst pattern of invasion: prognostic indicators in early-stage oral tongue cancer. Head Neck. 2014 Jun;36(6):811–818.
- Angadi PV, Patil PV, Hallikeri K, et al. Tumor budding is an independent prognostic factor for prediction of lymph node metastasis in oral squamous cell carcinoma. Int J Surg Pathol. 2015 Apr;23(2):102–110.
- Seki M, Sano T, Yokoo S, et al. Tumor budding evaluated in biopsy specimens is a useful predictor of prognosis in patients with cN0 early stage oral squamous cell carcinoma. Histopathology. 2017 May;70(6):869–879.
- Itoh G, Chida S, Yanagihara K, et al. Cancer-associated fibroblasts induce cancer cell apoptosis that regulates invasion mode of tumours. Oncogene. 2017 Aug;36(31):4434–4444.
- Yingzi L, Naveed H, Liang J, et al. Effects of mechanical properties on tumor invasion: insights from a cellular model. Conf Proc IEEE Eng Med Biol Soc. 2014;2014:6818–6821.
- Mitchell MI, Engelbrecht AM. Metabolic hijacking: A survival strategy cancer cells exploit? Crit Rev Oncol Hematol. 2017 Jan;109:1–8.
- Wang K, Wu F, Seo BR, et al. Breast cancer cells alter the dynamics of stromal fibronectin-collagen interactions. Matrix Biol. 2017;60–61:86–95.
- Egan K, Crowley D, Smyth P, et al. Platelet adhesion and degranulation induce pro-survival and pro-angiogenic signalling in ovarian cancer cells. PLoS One. 2011;6(10):e26125.
- Serhan K, Gartung A, Panigrahy D. Drawing a link between the thromboxane A(2) pathway and the role of platelets and tumor cells in ovarian cancer. Prostaglandins Other Lipid Mediat. 2018 Jul;137:40–45.
- Iraci N, Gaude E, Leonardi T, et al. Extracellular vesicles are independent metabolic units with asparaginase activity. Nat Chem Biol. 2017 Sep;13(9):951–955.
- Zhao H, Yang L, Baddour J, et al. Tumor microenvironment derived exosomes pleiotropically modulate cancer cell metabolism. Elife. 2016 Feb;27(5):e10250.
- Principe S, Mejia-Guerrero S, Ignatchenko V, et al. Proteomic analysis of cancer-associated fibroblasts reveals a paracrine role for MFAP5 in human oral tongue squamous cell carcinoma. J Proteome Res. 2018 Jun 1;17(6):2045–2059.
- Dourado MR, de Oliveira CE, Sawazaki-Calone I, et al. Clinicopathologic significance of ROCK2 expression in oral squamous cell carcinomas. J Oral Pathol Med. 2018 Feb;47(2):121–127.
- Jiang L, Liu X, Kolokythas A, et al. Downregulation of the Rho GTPase signaling pathway is involved in the microRNA-138-mediated inhibition of cell migration and invasion in tongue squamous cell carcinoma. Int J Cancer. 2010 Aug 1;127(3):505–512.
- Bae E, Sato M, Kim RJ, et al. Definition of smad3 phosphorylation events that affect malignant and metastatic behaviors in breast cancer cells. Cancer Res. 2014 Nov 1;74(21):6139–6149.
- Fu Q, Zhang Q, Lou Y, et al. Primary tumor-derived exosomes facilitate metastasis by regulating adhesion of circulating tumor cells via SMAD3 in liver cancer. Oncogene. 2018; 37:6105–6118.
- Melo SA, Luecke LB, Kahlert C, et al. Glypican-1 identifies cancer exosomes and detects early pancreatic cancer. Nature. 2015 Jul 9;523(7559):177–182.
- Lu H, Niu F, Liu F, et al. Elevated glypican-1 expression is associated with an unfavorable prognosis in pancreatic ductal adenocarcinoma. Cancer Med. 2017 Jun;6(6):1181–1191.
- Zhang H, Duan J, Qu Y, et al. Onco-miR-24 regulates cell growth and apoptosis by targeting BCL2L11 in gastric cancer. Protein Cell. 2016 Feb;7(2):141–151.
- Ji H, Lee JH, Wang Y, et al. EGFR phosphorylates FAM129B to promote Ras activation. Proc Natl Acad Sci U S A. 2016 Jan 19;113(3):644–649.
- Li H, Zhang Y, Chen SW, et al. Prognostic significance of Flotillin1 expression in clinically N0 tongue squamous cell cancer. Int J Clin Exp Pathol. 2014 Feb 15;7(3):996–1003.