
 ?Mathematical formulae have been encoded as MathML and are displayed in this HTML version using MathJax in order to improve their display. Uncheck the box to turn MathJax off. This feature requires Javascript. Click on a formula to zoom.
ABSTRACT
Phosphatidylserine (PS) has skewed distributions in the plasma membrane and is preferentially located in the inner leaflet of normal cells. Tumour cells, however, expose PS at the outer leaflet of cell surfaces, thereby potentially modulating the bio-signalling of cells. Interestingly, exosomes – or, more properly, small extracellular vesicles (sEVs) – which are secreted from tumour cells, are enriched with externalized PS, have been proposed as being involved in the progression of cancers, and could be used as a marker for tumour diagnostics. However, the sEV fractions prepared from various methods are composed of different subtypes of vesicles, and knowledge about the subtypes enriched with exposed PS is still limited. Here, we differentiated sEVs from cancer cell lines by density gradient centrifugation and characterized the separated fractions by using gold-labelling of PS in atomic force microscopy, thrombin generation assay, size and zeta potential measurements, and western blot analysis. These analyses revealed a previously unreported PS+-enriched sEV subtype, which is characterized by a lower density than that of canonical exosomes (1.06 g/ml vs. 1.08 g/ml), larger size (122 nm vs. 105 nm), more negative zeta potential (−28 mV vs. −21 mV), and lower abundance of canonical exosomal markers. The identification of the PS-exposed subtype of sEVs will provide deeper insight into the role of EVs in tumour biology and enhance the development of EV-based tumour diagnosis and therapy.
Introduction
Phosphatidylserine (PS) is a negatively charged phospholipid, and its localization is normally restricted to the inner leaflet of the plasma membrane. Upon apoptosis, this asymmetric distribution is remodelled and PS is exposed onto the outer leaflet, which is believed to act as an “eat me” signal that facilitates the recognition and uptake of apoptotic cells by phagocytes [Citation1,Citation2]. PS is also externalized under conditions other than apoptosis [Citation2–Citation5]; for example, viable cancer cells reportedly have elevated levels of exposed PS [Citation6–Citation12], which has been proposed to be involved in processes such as modulating cell signalling and vesicle formation [Citation5]. Interestingly, it has been pointed out that the level of the exposed PS is correlated with the progression of tumour malignancy [Citation7]. PS has also been reported to be externalized on the surfaces of the endothelial cells of tumour vessels [Citation13], indicating the potential of the exposed PS to act as a tumour marker. An increasing number of reports have used PS-binding molecules or PS-recognizing antibodies as imaging probes or therapeutic agents for tumours [Citation9,Citation14,Citation15].
Extracellular vesicles (EVs) are secreted from cells and play various roles in intercellular communication [Citation16,Citation17]. In cancer, tumour cells communicate with the surrounding cells, including fibroblasts, endothelial cells, mesenchymal stem cells, and immune cells, by exchanging their EVs to modulate the tumour microenvironment, angiogenesis, metastasis, and the immune system [Citation18,Citation19]. Several studies have shown that EVs contain a higher quantity of PS (approximately twofold) than their parental cells [Citation20,Citation21], and PS in tumour-derived EVs has been reported to be exposed on their membrane surfaces [Citation22–Citation25]. Based on these observations, the detection of PS+ EVs in body fluids is proposed as a diagnostic tool for tumour progression [Citation2,Citation26–Citation28]. The surface-exposed PS can also be used as an affinity target for collecting EVs [Citation29,Citation30], as a labelling target [Citation31], and as an anchoring molecule to display foreign molecules on EVs [Citation32].
Multiple types of vesicles are secreted from cells via distinct generation mechanisms, thereby complicating the concept and terminology of exosomes. In this work, following the International Society for Extracellular Vesicles (ISEV)’s suggestion, we define the terms for vesicles as follows: “EVs” represent all types of vesicles that are secreted from cells (which should include exosomes, microvesicles, and apoptotic bodies, among others); “small EVs (sEVs)” are the subtype of EVs that are enriched in the pellets after high-speed centrifugation (in this study, they are contained in a 160K (160,000-g) fraction. They are also called “crude exosomes” in some studies); and “exosomes (or canonical exosomes)” refer to a fraction of sEVs that carries Alix, Tsg101, CD63, and CD81 and has a density of 1.08–1.17 g/mL [Citation33,Citation34]. In several reports, as well as in our study described below, sEVs were further fractionated into subclasses by using appropriate methodologies, such as density gradient centrifugation [Citation35,Citation36], which suggests that ultracentrifuged pellets (sEVs or crude exosomes) contain distinct types of sEVs representing different generation pathways and/or biological functions.
The heterogeneous nature of sEVs has been extended to their lipid composition. It has been reported that distinct types of EVs can be prepared from mesenchymal stem cells by using different lure molecules, each of which has a specific affinity to certain types of lipids [Citation37]. In this study, we focused on the externalization of PS in sEVs derived from tumour cells and investigated whether different subtypes of sEVs are separated by density gradient centrifugation. For this purpose, sEVs prepared from the conditioned media of tumour cell lines were further fractionated by iodixanol density gradient centrifugation, and subtypes of sEVs with different densities, markers, sizes, and zeta potentials were characterized by focusing on exposed PS on the particles. Interestingly, one subtype with abundant exposed PS was devoid of canonical exosome markers, suggesting it has a distinct biogenetic pathway different from canonical exosomes.
Material and methods
EV isolation
MIA PaCa-2 (human pancreas carcinoma) and HT-29 (human colorectal adenocarcinoma) cell lines were purchased from American Type Culture Collection (ATCC, Manassas, VA, USA). MIA PaCa-2 and HT-29 cell lines were cultured in Dulbecco’s Modified Eagle’s Medium (DMEM, Gibco, Thermo Fisher Scientific, Waltham, MA, USA) supplemented with 10% (v/v) heat-inactivated fetal bovine serum (FBS, Gibco) and penicillin-streptomycin (Wako Pure Chemical Industries, Ltd., Osaka, Japan) at 37°C in a 5% CO2 atmosphere. Cells with three passages from frozen stock were used. When MIA PaCa-2 cells were grown to 70% confluency, the medium was changed to a serum-free medium. After additional incubation for 68 h, the conditioned medium was collected and the viability of the cells (>95%) was confirmed by trypan blue exclusion test. The medium was sequentially centrifuged at 300 g for 10 min at 4ºC; 2000 g for 10 min (KUBOTA 5500 with ST-722M rotor, Kubota Corporation, Tokyo, Japan); and 10,000 g for 30 min (Optima L-90K with SW32Ti rotor, Beckman Coulter, Indianapolis, IN, USA) for lot A1. Alternatively, the conditioned medium was centrifuged at 500 g for 10 min at 4ºC and 10,000 g for 30 min (KUBOTA 5922 with RA-410M rotor) for lots B1-B3 (Figure S1). Thereafter, for all lots, the supernatant was filtrated using Stericup-GP (0.22 µm pore, polyethersulfone, Merck Millipore, Billerica, MA, USA), followed by centrifugation at 160,000 g for 70 min at 4ºC (Optima L-90K with SW32Ti rotor, Beckman Coulter). The pellet, resuspended in 0.5 mL PBS, was mixed with 1.5 mL 60% (wt/vol) iodixanol and transferred to the bottom of a tube, then overlaid with a continuous iodixanol gradient (8–40%, 20 mM HEPES/NaOH buffer, pH7.2). After centrifugation at 100,000 g for 17 h at 4ºC (Optima L-90K with SW32Ti rotor), 10 individual 3.2-mL fractions were collected and washed with 30 mL of PBS followed by centrifugation at 160,000 g for 2 h. The pellet was resuspended in 0.5 mL of PBS and aliquoted to store at −80ºC. Lot A1 was used for experiments unless otherwise noted. For the isolation of sEVs from HT29, we omitted the low-speed centrifugation, which we confirmed not to disturb the following density gradient step and to reduce experimental time. Briefly, HT29 cells were incubated in a serum-free medium for 65 h, and then the conditioned medium was centrifuged at 8900 g for 10 min at 4ºC (J2-21 M/E with JA-14 rotor, Beckman Coulter) before centrifugation at 160,000 g. Thereafter, the supernatant was treated same as described above to fractionate sEVs. The density of the fractions was determined by measuring the refractive index. Protein contents were measured using a BCA protein assay kit (Thermo Scientific Pierse, Rockford, IL, USA) according to manufacturer’s instructions, using BSA as a standard.
Western blotting (WB) and silver staining analyses
Expression of certain proteins was investigated via WB with specific antibodies, and the total proteins contained in each fraction were accessed via silver staining analysis. Samples were boiled in SDS sample buffer with or without β-mercaptoethanol before SDS polyacrylamide gel electrophoresis. Premade gels of 7.5–15% or 15% (Extra PAGE One Precast Gel, Nacalai Tesque, Inc., Kyoto, Japan) were used. Separated proteins were then transferred onto a nitrocellulose membrane using the iBlot Gel Transfer Device (Thermo Fisher Scientific). The membrane was blocked with Blocking One (Nacalai Tesque) and then incubated with primary antibodies followed by secondary antibodies conjugated with horseradish peroxidase (HRP). After each incubation step, membranes were washed with TBS-T (Tris buffer saline containing 0.05% Tween 20) and finally visualized using an enhanced chemiluminescence (ECL) system. The primary antibodies used in this study were mouse monoclonal anti-human CD63 (SHI-EXO-M02, Cosmo Bio Co., Ltd., Tokyo, Japan), CD81 (11–558-C100, EXBIO Praha, a.s., Vestec, Czech Republic), β-actin (A1978, Sigma-Aldrich, St. Louis, MO, USA), Alix (4469, BioLegend, San Diego, CA, USA), Tsg101 (612,696, BD Biosciences, Franklin Lakes, NJ, USA), rabbit monoclonal anti-human histone H2B (ab52599, Abcam), rabbit polyclonal anti-human Hsp70 (System Biosciences, LLC, Palo Alto, CA, USA), and goat polyclonal anti-human EpCAM/TROP-1 (R&D Systems, Inc., Minneapolis, MN, USA). Secondary antibodies conjugated with horseradish peroxidase (HRP) were goat anti-mouse and anti-rabbit IgG (H + L) (Bio-Rad Laboratories, Hercules, CA, USA) and rabbit anti-goat IgG (H + L) (Jackson ImmunoResearch Laboratories, Inc., West Grove, PA, USA). For silver staining, samples were boiled in SDS sample buffer with β-mercaptoethanol, and gel-electrophoresis was performed as described above. Silver staining of gels was performed using Sil-Best Stain One (Nacalai Tesque) according to manufacturer’s instructions.
Nanoparticle tracking analysis (NTA)
Numbers and sizes of particles contained in each fraction were evaluated by the nanoparticle tracking analysis (NTA) method using the NanoSight LM10 system (Malvern Instruments Ltd., Worcestershire, UK) equipped with a 405-nm laser and a digital camera (Marlin F033B, Allied Vision Technologies). The measurements were carried out by following the reported protocol [Citation38]. In brief, the equipment was first calibrated with silica spheres with a diameter of 100 nm (Polysciences, Inc., Warrington, PA). Then, the samples were diluted with PBS, and 30-s motion videos were captured per measurement. Ambient temperature was recorded manually. The parameters for the minimum expected particle size, minimum tracking length, and blur were automatically determined by the system. The camera level and detection threshold were set at values of 14 and 4, respectively. NTA-software version 2.3 was used for data analysis. For each sample, measurement was independently performed five times, so that more than 1,000 particles in total were analyzed. The average histogram was plotted from the data of five measurements, and diameters (mean, standard deviation, and mode) were determined.
Atomic force microscopy (AFM)
The morphologies of the materials contained in each fraction were observed via AFM. AFM observation was performed using Asylum MFP-3D (Oxford Instruments, Abingdon, UK) with AC (tapping) mode at ambient temperature. Commercial silicon tips, OMCL-AC200TS, and BL-AC40TS (Olympus Corp., Tokyo, Japan) were used for scanning in air and in PBS, respectively. EV solution (10–15 µL) was applied to mica substrates pretreated with 3-aminopropyltriethoxysilane (APTES, Tokyo Chemical Industry, Tokyo, Japan). The APTES-treated mica (AP-mica) was prepared by placing freshly cleaved mica (Ted Pella, Inc., Redding, USA) in a glass desiccator with 30 µL of APTES under vacuum for 1 h. EVs preferably adsorbed onto AP-mica rather than onto bare mica (our unpublished data). After putting the EV solution on AP-mica in a humidified chamber at r.t. for 1–2 h, the substrate was rinsed with PBS (3 times) and imaged by AFM in PBS. To analyze vesicle size, 4 × 4 µm2 images were subjected to SPIP software (Image Metrology A/S, Hørsholm) with detection thresholds of >5 nm in height, and the vesicles with >15 nm in maximum height (Zmax) and <2.0 in aspect ratio were counted. The height (Zmax) and diameter (calculated from the object area under the assumption that the object had a round shape) of the objects were analyzed by SPIP, and histograms were made from data generated for more than 100 objects. AFM imaging in air was carried out to detect gold nanoparticles (GNPs) bound on EVs, as described below.
Zeta-potential analysis
The surface charge of the vesicle is reflected by its zeta-potential; therefore, we evaluated the electrophoretic mobility of individual vesicles using an on-chip microcapillary electrophoresis (µCE) system equipped with a laser-dark field microscope to determine the zeta potentials [Citation39]. A microcapillary is suitable for accurate particle electrophoresis because an electroosmotic flow (EOF) in a microcapillary with open ends is a simple plug flow. In order to exclude the effect of electroosmosis, the EOF velocity was evaluated using charge-free beads 500 nm in diameter as a control experiment. The μCE chip-based system comprises a microcapillary chip with microchannels (width: 200 μm; height: 100 μm; length: 10 mm) with open reservoirs at both ends and a laser dark-field microscope equipped with a CMOS camera. The inner surface of the microchannels was coated with anti-biofouling polymers, such as a phospholipid copolymer containing 2-methacryloyloxyethyl phosphorylcholine (MPC) and 3-methacryloxyethyl triethoxysilane (METESi), to suppress the nonspecific adsorption of proteins and EVs. Afterwards, 250 μl of EV sample diluted with 10 mM of HEPES buffer solution was introduced into a microcapillary of a chip, and platinum electrodes were introduced into the reservoirs. After the water level of the reservoirs was carefully adjusted to stop the hydrodynamic flow, the velocity of vesicles, Um., was evaluated by the electrophoresis experiment, which was performed by applying an electric field of 50 V/cm in the microchannel. The EOF velocity, Ueo, was evaluated using charge-free latex particles 500 nm in diameter coated with hydroxypropylcellulose. The true electrophoretic velocity of the vesicles, Uep, was calculated by subtracting Ueo from their measured velocity, Um. The zeta potential of vesicles, ζ, was calculated using the Smoluchowski equation:
where E was the electric field strength, η was the viscosity coefficient of the buffer solution, and εr and ε0 were the relative permittivity of the solution and the permittivity of the vacuum, respectively.
Gold nanoparticle labelling of EVs and detection
To localize certain molecules in AFM observation, we used the gold nanoparticle (GNP) labelling method, in which GNPs with defined sizes acted as markers in AFM observation. Gold nanoparticles of a diameter of 20 nm conjugated with MFGE8 (MFGE8-GNPs) were provided by IMRA America, Inc. (Ann Arbor, MI, USA). EVs were adsorbed on AP-mica as described above and washed with PBS. After blocking with 5% BSA in PBS for 5 min, the substrate was incubated with MFGE8-GNPs in 1% BSA/PBS for 1 h at ambient temperature. Then, the substrate was washed with PBS (3 times) and water (5 times), and subsequently dried. The labelled EVs on the substrate were imaged by AFM in air, and 2 × 2 µm2 images were subjected to SPIP software with detection thresholds of >1.5 nm in height. The objects recognized by >5 nm in maximum height (Zmax) and <2.0 in aspect ratio were counted as EVs. More than 300 EVs in total were counted by using independently prepared two samples. MFGE8-GNPs were distinguishable by their defined round shape with a height of 18–28 nm in the topographic image and, additionally, the emphasized contrast in the phase image, which is sensitive to viscoelastic properties and adhesion forces as well as topographic differences. Both height and phase images were used to confirm GNPs.
Thrombin generation assay
The formation of a functionally active prothrombinase complex (factor Xa/factor Va) on the surfaces of EVs was analyzed by the production of thrombin converted from prothrombin by the catalytic activity of the prothrombinase complex. Thrombin production was evaluated according to previous reports [Citation11,Citation25], with some modifications. In brief, EVs were incubated with factor Xa (20 pM, final concentration) and factor Va (1 nM, final concentration) for 4 min at 37ºC in 50 mM of HEPES buffer (pH7.4) containing 150 mM of NaCl, 5 mM of CaCl2, and 0.1% BSA, prior to the addition of prothrombin (1 µM, final concentration). After 5 min at 37ºC, the reaction was stopped by the addition of EDTA (7 mM, final concentration). Thrombin production was assayed by measuring the absorbance of the solutions at 405 nm as a function of time immediately after the addition of 0.2 mM of chromogenic substrate s-2238 (Sekisui Medical Co., Ltd., Tokyo, Japan). The absorbance change was measured using a Shimadzu UV-2550 spectrophotometer equipped with a kinetics module. The initial rates of the activity were determined from the slopes of absorbance, and thrombin yields were estimated using a standard curve obtained from the measurements of known amounts of thrombin. Bovine factor Xa and factor Va were purchased from Thermo Fisher Scientific. Human prothrombin was purchased from Enzyme Research Laboratories (South Bend, IN, USA). Thrombin from human plasma was purchased from Sigma-Aldrich.
EV-TRACK
We have submitted all relevant data of our experiments to the EV-TRACK knowledgebase (EV-TRACK ID: EV190002) [Citation40].
Results
Further fractionation of sEVs from MIA PaCa-2 by density gradient centrifugation
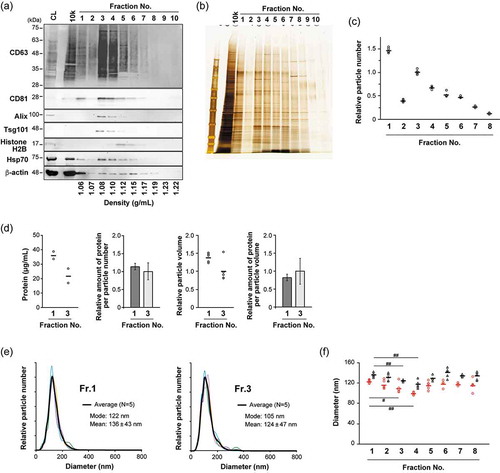
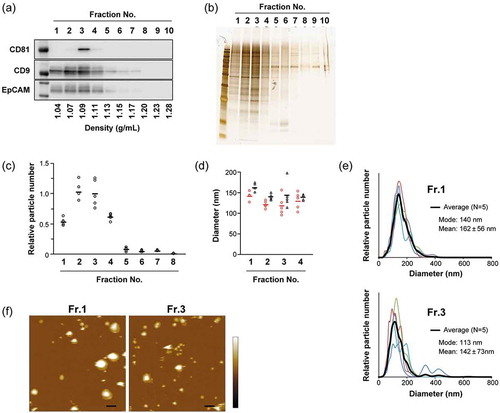
To further fractionate sEVs, iodixanol density gradient (8–40%) centrifugation was employed in this study. First, the conditioned medium of MIA PaCa-2 human pancreatic carcinoma cell line was sequentially centrifuged at 300, 2000, 10,000, and 160,000 g, and the resultant 160K precipitates (which enriched sEVs) were subjected to density gradient centrifugation and then divided into 10 fractions; from the top to the bottom of the tube, the fractions were numbered Fr.1 to Fr.10 (Figure S1(a)). An equal volume of each fraction was subjected to SDS-PAGE and analyzed by western blotting (WB) and silver staining. WB showed that the canonical exosome makers, including CD63, CD81, Alix and Tsg101, were most abundant in Fr. 3 and Fr. 4 ()). Based on their observed densities (approximately 1.10 g/mL), these fractions should be enriched with the sEV-subtype, which is often regarded as exosomes [Citation33,Citation34]. Interestingly, the overall distributions of proteins among the fractions estimated by silver staining indicated that Fr. 1 contained similar numbers of or more proteins than Fr. 3 or Fr. 4 ()). The particle numbers estimated by NTA showed a bimodal distribution, with peaks at Fr. 1 and Fr. 3 ()). When the amount of proteins in Fr. 1 and Fr. 3 were quantified by BCA assay, higher protein concentration per solution volume was confirmed, whereas the ratio of protein content to particle number in Fr. 1 was roughly the same as that in Fr. 3 ()). The NTA analyses indicated that the sizes of the particles contained in Fr. 1 were larger than in Fr. 3, and the mode diameters were 122 nm and 105 nm, respectively ()). The data also showed that, as the density became higher, both mean and mode diameters gradually decreased in the fractions from 1 to 4, then became larger in the fractions with higher density ()). The tendency for Fr. 1 to include a relatively large number of particles with a larger size was consistently observed from different preparation lots of MIA PaCa-2 sEVs; however, the particle number detected in Fr. 6 was changed in the alternative procedures for low-speed centrifugation (Figure S1). While Fr. 1 was devoid of Alix and Tsg101, similar amounts of β-actin, Src, Hsp70, and CD9 were included in both Fr. 1 and Fr. 3 (Figure S2(a)). These results indicate the existence of distinct vesicles in the fractions resolved by densities.
Figure 1. Analyses of 10 individual fractions of MIA PaCa-2 sEVs separated by iodixanol density gradient centrifugation. An equal volume (15 µL) of fraction samples was loaded for western blotting (a) and silver staining (b) analyses. Particle concentrations (c) were estimated by NTA using NanoSight (n = 5). (d) Protein concentration was estimated by BCA assay (n = 2). The relative amount of protein was calculated based on the particle numbers and mode diameters (for volumes) estimated by NTA. (e) Particle diameter distribution profiles for Fr. 1 and Fr. 3 estimated by NTA. Black lines show the average histogram calculated from the data of five measurements, the plots of which are superimposed (thin coloured lines). Mode and mean (± SD) diameters for the average histogram are indicated. (f) Circles (red) and triangles (black) indicate mode and mean diameters estimated from each measurement, respectively. The mean values of the five measurements are represented as solid horizontal lines. Two-tailed unpaired t-test was used to evaluate statistical significance: # p < 0.05; ## p < 0.01.
AFM observations of fractionated MIA PaCa-2 sEVs
To further characterize the subtypes of sEVs possessing distinct densities, AFM was employed to observe the materials included in the fractions. Each fraction sample was placed on a mica substrate pre-modified with 3-aminopropyltriethoxysilane (termed AP-mica). After rinsing with PBS, the adsorbed objects were imaged in PBS by tapping mode AFM. In Fr.1 and Fr.3, many round-shaped objects with smooth surfaces were observed along with some deformed (partially or fully flattened) objects () and Figure S3). The height of the flattened layer was approximately 4 or 8 nm (E and F in Figure S3), which corresponds to the height of single or double lipid bilayers. These observations were consistent with the previously reported adsorption behaviours of liposomes on mica substrates [Citation41]. These round objects likely represent EVs, since CD63 was detected on the objects by immuno-gold labelling (Figure S4). In addition to the round-shaped vesicles, the objects with irregular shapes as well as apparent aggregates of smaller objects were observed in Fr.6 () and Figure S6(a)). The fraction also contained a large number of tiny objects that made the surface of AP-mica rough, which may represent proteins and nucleic acids present in the fraction. In contrast, tiny objects were not observed in the background in both Fr.1 and Fr.3, suggesting that the vesicles were highly enriched in Fr.1 and Fr.3.
Figure 2. AFM analysis of fractionated MIA PaCa-2 sEVs. (a) AFM images obtained in PBS, indicated by colour changes corresponding to the height; colour bar: 70 nm. Scale bars, 500 nm. (b) Height and diameter histograms estimated by AFM. (c) The size distributions are presented as box plots (with median and quartiles). Whiskers in the box plots represent 1.5 times the interquartile range (IQR) or the highest or lowest point, whichever is shorter. The small circles represent outliers. X marks indicate the mean values. Vesicles with a height >15 nm were analyzed; Fr. 1: n = 125, Fr. 3: n = 174. Two-tailed unpaired t-test was used to evaluate statistical significance: * p < 0.001. The diameter was calculated from the object area under the assumption that the objects were round.
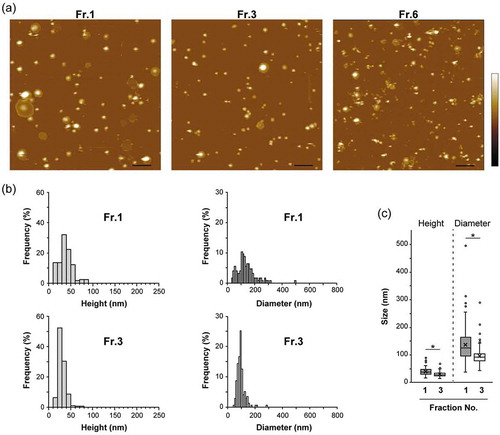
The quantitative differences in the sizes of the vesicles between Fr.1 and Fr.3 were estimated. In the analysis, objects with a maximum height of >15 nm and an aspect ratio of <2.0 were counted as EVs. Distribution analysis of height and diameter (calculated from the object area under the assumption that they were round objects) revealed that the vesicle size differed between Fr.1 and Fr.3 – that is, the larger vesicles were more concentrated in Fr.1 (,c), and Figure S5), which is consistent with the NTA data (,f)). Other preparation lots also showed similar results in the AFM and NTA analyses (Figure S1 and S6). In AFM analysis, both heights and diameters showed significantly wider distributions in Fr.1 than in Fr.3 () and Figure S5), whereas the vesicles collapsed to be planar were removed from the objects for analysis. This is different from the size distribution estimated by NTA ()). In our experiments, Fr.1 had the tendency to deform on the substrate surface in aqueous solutions; that is, some vesicles were partially or fully flattened. In contrast, vesicular deformation was less frequently observed in Fr.3. These phenomena are possibly associated with different molecular compositions in the membrane and/or different loads in vesicles, which can alter the rigidity (stiffness) of vesicles and regulate interaction between the membrane and substrate surfaces. AFM data suggest that the vesicles in Fr.1 and Fr.3 have distinct characters.
To further characterize these vesicles, the surface charges of the vesicles were estimated. The surface charge of the vesicles is reflected to the zeta potential, therefore, to determine the zeta potentials of particles, we evaluated the electrophoretic mobility of individual vesicles using an on-chip μCE system equipped with a laser-dark field microscope [Citation39]. The results indicate that the zeta potentials of Fr.1 vesicles distributed in a more negative range than those of Fr.3 ()). The mean potential was −28 mV for Fr.1, whereas it was −21 mV for Fr.3 ()). Because AFM observation used a positively charged AP-mica substrate, a stronger interaction could be generated between the substrate surface and the Fr.1 vesicles, which possibly resulted in vesicle collapse, as shown above. All these data indicate that MIA PaCa-2 sEVs can be separated into at least two subtypes with distinct properties by iodixanol density gradient centrifugation.
Figure 3. Distributions of zeta potentials of vesicles in Fr. 1 and Fr. 3 fractionated MIA PaCa-2 sEVs are shown by histograms (a) and box and whisker plots (b). Boxes represent the interquartile range (IQR) with median and whiskers extending to the extreme values within 1.5 times the IQR. A dot represents one outlier. X marks indicate the mean values. The zeta potentials were evaluated on an on-chip microcapillary electrophoresis system. Fr.1: n = 106, Fr.3: n = 69. Two-tailed unpaired t-test was used to evaluate statistical significance: * p < 0.001.
Detection of exposed PS on the surfaces of sEVs by using PS-binding proteins
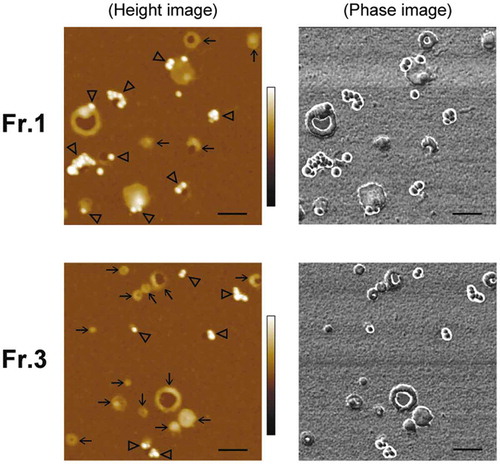
To examine whether PS is externalized, PS on EV surfaces were labelled with gold-nanoparticle (GNP) and the bound GNPs were detected by AFM observation. To label PS, we used GNP conjugated with milk fat globule-epidermal growth factor-factor 8 (MFGE8). MFGE8, also called lactadherin, is known to PS-binding proteins and has been suggested to be more appropriate for evaluating PS exposure compared to the conventional PS-binding protein, annexin V [Citation42]. Each subtype of MIA PaCa-2 sEVs was adsorbed on the AP-mica and then incubated with MFGE8-GNPs. In the analysis, AFM images were obtained in air after sample drying because, in aqueous solutions, GNPs bound on soft and deformable vesicle membranes tend to move due to the flexibility of the membrane, which makes it difficult to obtain clear scanning images of GNPs (our unpublished results). In the images obtained in air, GNPs were easily distinguishable from other objects because they had high sphericity with a height of 18–28 nm in topographic (height) images and also showed high contrast in phase imaging [Citation43] ( and Figure S7). The rate of vesicles onto which the GNPs were bound has been estimated to be 49% and 28% for Fr.1 and Fr.3, respectively (). Preincubation with free MFGE8 drastically reduced the number of vesicles that bound the GNPs, indicating that the binding was specific (Figure S8). The difference in the PS+ rates between the fractions was not likely caused by the rupture of the vesicles because, before drying, the vesicles in both fractions visually retained their vesicular shape on the substrates after the labelling procedure (Figure S9). It was unlikely that MFGE8 on EVs could influence less binding of MFGE8-GNPs in Fr.3, because the amounts of MFGE8 in Fr.3 were not higher than those in Fr.1 (Figure S2(b)), and after removing the surface proteins by proteinase K treatment, the level of the PS+ vesicles was still higher in Fr.1 than in Fr.3 (Figure S10(b)).
Table 1. The rate of vesicles bound with MFGE8-GNPs. The vesicles adsorbed on the substrates were counted using two independently prepared samples, and the total numbers are indicated.
Figure 4. Detection of PS on EV surfaces by gold labelling. MIA PaCa-2 sEVs were labelled using 20-nm GNPs conjugated with MFGE8 and imaged by AFM in air. Representative AFM images of MIA PaCa-2 Fr.1 (upper) and Fr.3 (lower). In the topographic (height) image, arrows and arrowheads indicate the vesicles unbound and bound with GNPs, respectively (left). GNPs were discerned by their regular round shape, height, and clear phase contrast (right). Scale bars: 200 nm, colour bars: 50 nm.
PS exposure on EV surfaces was also examined by using annexin V, which binds to PS in a calcium-dependent manner and is often used to detect PS exposed on apoptotic cell surfaces. MIA PaCa-2 sEVs were labelled with biotinylated annexin V followed by a GNP-conjugated anti-biotin secondary antibody. AFM observation revealed that the rate of GNP-bound vesicles in Fr.3 was 14%, whereas it was 29% in Fr.1, twice as much as in Fr.3 (Figure S10). The binding of GNPs to the vesicles was inhibited by preincubation with annexin V or in the presence of a chelating agent (data not shown), indicating that the binding of GNPs to the vesicles was mediated by the binding between annexin V and PS.
Finally, exposed PS on sEVs was evaluated by procoagulant activity assay. Thrombin generation assay is usually used to assess the procoagulant activity of platelets and platelet membrane vesicles (platelet microparticles), and this activity is known to be dependent on PS exposed on their surfaces [Citation11]. This assay has also been applied to the assessment of EVs from cells [Citation25]. The procoagulant prothrombinase complex of factor Xa and factor Va, which is assembled depending on the PS-rich membrane, facilitates the conversion from prothrombin to thrombin, an active serine protease. Factor Xa and factor Va were incubated with fractionated EVs; then, after the addition of prothrombin, thrombin generation was evaluated by using a chromogenic substrate for thrombin (Figure S11). Thrombin was not produced in the absence of factor Xa/factor Va, prothrombin, or EV fractions. The largest amount of thrombin was generated in the presence of Fr.1 (). Production was dependent on the added amounts of EVs and was inhibited by externally added MFGE8 (Figure S11). Both thrombin yields per particle number and per protein quantity in Fr.1 were higher than in Fr.3 (). These results show that PS was externalized on sEVs in a functionally active state, and Fr.1 had a larger amount of surface PS compared to Fr.3.
Figure 5. Thrombin generation assay for MIA PaCa-2 sEVs. Thrombin concentrations generated in the presence of an equal volume of fraction samples (left, n = 3). Relative thrombin production was calculated per particle number (centre) and per protein content (right).
Fractionation and characterization of HT-29 sEVs
To confirm that the two observed subtypes of sEVs were not specific to the cell line used (MIA PaCa-2), we fractionated sEVs from another tumour cell: the HT-29 human colon adenocarcinoma cell line. The quantities of proteins and nucleic acids were concentrated in Fr.2 and Fr.3 (,b)). WB analyses revealed that CD9 and CD81 were enriched in Fr.3 ()), supporting the presence of canonical exosomes in Fr.3. Quantification of particle numbers showed that Fr.1 of HT-29 also includes many particles ()) (in contrast to MIA PaCa-2, the distribution of particles was unimodal in HT-29). Size measurement by NTA indicated that both mean and mode diameters decreased in the fractions from 1 to 4, although their size distribution was relatively wide compared to the case of MIA PaCa-2 (,e)). AFM images revealed the tendency for vesicles with a larger size to be more frequently observed in Fr.1 than in Fr.3 ()). These NTA and AFM results show that HT-29 sEVs were also separated into two subtypes with distinct sizes.
Figure 6. Analyses of 10 individual fractions of HT-29 sEVs separated by iodixanol density gradient centrifugation. Western blotting (a) and silver staining (b) analyses. Particle concentration (c) and diameters (d and e) were estimated by NTA (n = 5). (d) Circles (red) and triangles (black) indicate mode and mean diameters estimated from each measurement, respectively. The mean values of the five measurements are represented as solid horizontal lines. (e) In diameter distribution profiles for Fr.1 and Fr.3; black lines show the average histogram calculated from the data of five measurements, the plots of which are superimposed (thin coloured lines). Mode and mean (± s.d.) diameters for the average histogram are indicated. (f) AFM images for Fr.1 and Fr.3 obtained in PBS. Scale bars: 200 nm, colour bar: 100 nm.
External localization of PS in sEVs from HT-29 was confirmed by labelling with MFGE8-GNPs followed by AFM observation. The rate of GNP-bound vesicles in Fr.1 was 63% and decreased to 22% in Fr.3 ( and Figure S12). Taken together, HT-29 sEVs shared common properties with MIA PaCa-2 sEVs – that is, they were separated into two types of vesicles as representatively shown in Fr.1 and Fr.3, the size of the vesicles was larger, and the rate of PS+ vesicles was higher in Fr.1 than in Fr.3.
Discussion
Density gradient centrifugation has often been used to prepare exosomes from ultracentrifuged pellets (sEVs), in which the low-density nature of membranous vesicles is utilized to separate them from high-density molecules (such as supra-molecular protein complexes). Recent reports have also shown that the density gradient centrifugation can be applied to separate subtypes of sEVs [Citation35,Citation36], in which additional sEV subtypes having higher densities than canonical exosomes have been identified. Because the fraction with a high density contained vesicular structures, they should represent a subtype of sEVs. In these studies, however, the subtype of sEVs with a lower density has not been examined. In our analyses, tumour cells also produced low-density sEVs along with canonical and high-density subtypes of sEVs. The characteristics of this low-density subtype, when compared to the canonical exosome, are (1) a scarcity of classical exosome markers irrespective of the abundancy of proteins (,d)), (2) larger sizes (,f) and ), (3) more negative zeta potentials (), and (4) exposed PS ( and ,).
Several studies have reported marker proteins for subtypes of sEVs [Citation35,Citation36,Citation44]. In our study, although the amounts of CD63, CD81, Tsg101, and Alix were reduced or absent in the low-density fraction, another classical exosome marker, CD9, was present (Figure S2). Thery et al. reported that Rab27a inhibition by shRNA impaired the vesicular secretion of CD63, Tsg101, and Alix, but not CD9 and MFGE8 [Citation44]. In another report, they differentiated the subtype of sEVs enriched in CD63/CD81/CD9 from the subtype devoid of CD63/CD81 but enriched in CD9, the latter of which has been suggested to originate at the plasma membrane and early endocytic locations [Citation36]. Because these sEV subtypes are determined based on proteomic analysis combined with the pull-down assay using the corresponding antibodies, it was not possible to compare these sEV subtypes with the sEV subtypes in the present study. However, these reports have shown that there are multiple types of sEVs having different secretion mechanisms and marker proteins with different patterns.
While focusing on lipids in EV subtypes, Lim et al. revealed that mesenchymal stem cells secrete three types of EVs with distinct lipid compositions [Citation37], for which the affinity-based separation method was used. One of the subtypes, which was isolated by using annexin V as an affinity agent, contained reduced amounts of classical exosome markers (CD81, CD9, Alix, and Tsg101). This annexin V-binding subtype of sEVs shares similarities (i.e. enriched exposed PS and protein compositions) with the low-density subtype in this study, despite the differences in cells and isolation protocols used in the two studies.
As regards the vesicles with a lower density, L-exosomes have been reported to have a larger size (152 nm) and lower density (1.13 g/mL) than canonical exosomes (1.18 g/mL) [Citation45]. CD63 and CD81 are similarly abundant in both canonical exosomes and L-exosomes, but miRNA species are differentially loaded onto the two types of exosomes. However, the density of L-exosomes (1.13 g/mL) is higher than the low-density subtype in this study. In addition, it has been reported that EVs produced from microvilli have lower density and are devoid of CD63, which resembles the lower-density subtype in this study [Citation46]. However, their sizes, 50–80 nm, as estimated by TEM, were much smaller than our subtype.
On the other hand, the high-density fraction (Fr. 6) in our study showed a clearly different signature compared with the low-density fraction (Fr. 1) or the fraction of canonical exosomes (Fr. 3), and many objects with non-vesicular structures were present in Fr. 6, in contrast to Fr. 1 and Fr. 3 () and Figure S6(a)). In this regard, it was noteworthy that most of the β-actin in the high-density fraction was proteinase K-sensitive (Figure S13), implying that it resided outside of the vesicles. This possibility was also supported by AFM observation; the non-vesicular objects were considerably reduced after the proteinase K treatment (Figure S14), in accordance with reduced particle numbers (Figure S15(a)). The silver staining indicated that there were many proteins in the fraction other than β-actin, most of which were digested with proteinase K (Figure S15(b)). Further, RNase A treatment also decreased non-vesicular objects to a certain degree (Figure S14). After proteinase K or RNase A treatment, we found residual vesicles in Fr.6, some of which were CD63-positive (Figure S16 and S17) and therefore suggested that they were similar in protein composition to the canonical exosomes (Fr.3) (Figure S2). WB detected Ago2 in the high-density fractions (Figure S2), and bioanalyzer analysis showed RNA to be enriched in the fractions (Figure S18(a)), suggesting that most (but not all) of the RNA resides outside sEVs. Similar observations have already been reported from several groups [Citation45,Citation47,Citation48]. DNA molecules were also enriched in the high-density fractions with a nuclease-sensitive mode (Figure S18(b,c)); however, their distribution among fractions was slightly different from those of RNA. Additionally, histone H2B, one of the core histone proteins in nucleosomes, was detected in Fr.5 and Fr.6 by WB ()). All these observations indicate that the high-density fractions contain proteins and nucleic acids, which are not included in EVs and were attacked by digestive enzymes. Because we employed a “floating up” method in gradient density centrifugation, these molecules are suggested to loosely associate outside of EVs [Citation35]. As shown in , the amounts of entities in Fr.6 were dramatically reduced when low-speed centrifugation was repeated three times instead of two, suggesting that the proteins and/or nucleic acids associated outside of the vesicles might have dissociated from the vesicles under the conditions. These high-density sEVs could represent the class of sEVs, the surfaces of which were decorated by endocytosed extracellular molecules within multivesicular bodies proposed by Weaver’s group [Citation49].
Recently, the protruded structures of cells, such as cilia, microvilli, filopodia, podosomes, retraction fibres, and invadopodia, have garnered attention as sources of EV secretion [Citation46,Citation50–Citation52]. Among them, invadopodia is a cancer cell-specific structure that is involved in tumour cell invasion and has been reported to be associated with enhanced secretion of EVs [Citation52]. Because malignant tumour-derived cell lines were used in this study, vesicles generated from invadopodia could be included in the sEV preparations. Indeed, β-actin and Src, which are enriched in invadopodia (and some other protruded structures) were found from low-density sEVs, canonical exosomes, and high-density sEV fractions (Figure S2(a)). Interestingly, the activated form of Src (pY416-Src) was absent in the low-density sEVs but noticeable in the high-density fraction, suggesting different biological roles of these three subtypes, for example, on cell migration. Because most protruded structures are associated with β-actin, further studies are needed to determine the origin of these β-actin and/or Src-enriched subtypes of sEVs.
Because malignant tumour cells expose PS on their plasma membranes, these cells are expected to release EVs onto which PS is exposed. Indeed, sEVs derived from ascites and serum of ovarian cancer patients have been shown to display PS on their surfaces [Citation23,Citation24,Citation53]. The exposed PS on EVs has been suggested to have a role in the uptake of sEVs by NK cells, the augmentation of tumour growth [Citation23], the modulation of T cell signalling [Citation24], and the stimulation of TGF-β production from macrophages [Citation25]. All these observations indicate the pivotal roles of PS+ EVs on tumour progression, making PS+ EVs a promising diagnostic marker in liquid biopsy [Citation26,Citation27,Citation54].
In general, freezing/thawing process can affect properties of vesicles [Citation55]. To examine the effect of the freezing/thawing process on PS externalization on EVs, MIA PaCa-2 EVs before (unfrozen) and after one freezing/thawing cycle were labelled with MFGE8-GNPs, and the rates of GNP-bound PS+ vesicles were compared by AFM analysis (Figure S19). Although the overall rates of PS+ vesicles were increased after the freezing/thawing cycle, in both cases, the rates of PS+ vesicles in Fr.1 were higher than those in Fr.3; before and after the freezing/thawing cycle, the rates were 40% and 50% for Fr.1 and 14% and 30% for Fr.3, respectively. These data indicate that the difference in PS exposure between Fr.1 and Fr.3 is not due to artefacts from the freezing/thawing process.
In this study, PS externalized on vesicular surfaces was evaluated using two different PS-binding proteins, annexin V and MFGE8. The detection rates of PS+ vesicles were higher with MFGE8 than with annexin V for MIA PaCa-2 EVs ( and Figure S10) and HT-29 EVs (data not shown). Binding of annexin V to PS is dependent on the presence of calcium ions, which require fixation and rinsing procedures for AFM observations. These extra steps could have reduced the detection rates of PS. Alternately, the differences may represent distinct binding properties of these proteins: MFGE8 binds preferentially to highly curved membrane compared to annexin V [Citation42,Citation56,Citation57], which might be due to the oligomerization of annexin V upon binding [Citation58,Citation59].
The mode diameter of low-density sEVs was larger than that of the canonical exosome (122 vs. 105 nm, respectively), from which the ratio of the surface area of these vesicles was calculated to be 1.4:1.0. However, the thrombin production assays indicated that the low-density sEVs had 1.9-fold higher activity than Fr.3 under the assumption that the same numbers of vesicles were used. AFM analyses using MFGE8 ()) and annexin V (Figure S10) have also demonstrated the increased accessibility of PS molecules in the low-density sEVs. The more negative property in zeta potential analyses also supported the enriched PS on the surface of the low-density sEVs. All these results indicate that the vesicles enriched in Fr.1 define a new subtype of sEVs, one which is distinct from canonical exosomes.
In conclusion, this study demonstrated that two subtypes of sEVs containing different rates of PS+ vesicles can be separated by density gradient centrifugation from conditioned media of tumour cell lines. One subtype is in good agreement with the canonical exosomes; however, the PS+ vesicles are more concentrated in another subtype that has a lower density, larger size, and more negative surface potential. These two subtypes of sEVs may be generated from a distinct pathway. Previously, PS+ EVs have been shown to be involved in tumour growth and metastasis and are considered promising tumour markers; however, the majority of them might not be typical exosomes, that is generated by ESCRT-dependent mechanism. The difference in PS exposure between sEV subtypes will broaden our understanding of the heterogeneity in sEVs. Clarifying the difference in the generation mechanism and cargo molecules and what and how phenotypes of the parental tumour cells affect the existence of these sEV subtypes will provide insight into tumour biology as well as valuable information toward the development of more effective tumour diagnosis and therapy.
Supplemental Material
Download MS Word (5.6 MB)Acknowledgments
The authors thank Dr A. Takahashi (Japanese Foundation for Cancer Research) for kindly providing the primers for genomic PCR.
Disclosure statement
K. Shiba received research fund from IMRA America, Inc. Y. Ichikawa is an employee of IMRA America, Inc. No potential conflict of interest was reported by the authors.
Supplementary Material
Supplemental data for this article can be accessed here.
Additional information
Funding
Related Research Data
References
- Nagata S, Suzuki J, Segawa K, et al. Exposure of phosphatidylserine on the cell surface. Cell Death Differ. 2016;23:952–15.
- Birge RB, Boeltz S, Kumar S, et al. Phosphatidylserine is a global immunosuppressive signal in efferocytosis, infectious disease, and cancer. Cell Death Differ. 2016;23:962–978.
- Schutters K, Reutelingsperger C. Phosphatidylserine targeting for diagnosis and treatment of human diseases. Apoptosis. 2010;15:1072–1082.
- Zwaal RF, Comfurius P, Bevers EM. Surface exposure of phosphatidylserine in pathological cells. Cell Mol Life Sci. 2005;62:971–988.
- Rysavy NM, Shimoda LM, Dixon AM, et al. Beyond apoptosis: the mechanism and function of phosphatidylserine asymmetry in the membrane of activating mast cells. Bioarchitecture. 2014;4:127–137.
- Utsugi T, Schroit AJ, Connor J, et al. Elevated expression of phosphatidylserine in the outer membrane leaflet of human tumor cells and recognition by activated human blood monocytes. Cancer Res. 1991;51:3062–3066.
- Riedl S, Rinner B, Asslaber M, et al. In search of a novel target - phosphatidylserine exposed by non-apoptotic tumor cells and metastases of malignancies with poor treatment efficacy. Biochim Biophys Acta. 2011;1808:2638–2645.
- Vallabhapurapu SD, Blanco VM, Sulaiman MK, et al. Variation in human cancer cell external phosphatidylserine is regulated by flippase activity and intracellular calcium. Oncotarget. 2015;6:34375–34388.
- Chu Z, Abu-Baker S, Palascak MB, et al. Targeting and cytotoxicity of SapC-DOPS nanovesicles in pancreatic cancer. PLoS One. 2013;8:e75507.
- Desai TJ, Toombs JE, Minna JD, et al. Identification of lipid-phosphatidylserine (PS) as the target of unbiasedly selected cancer specific peptide-peptoid hybrid PPS1. Oncotarget. 2016;7:30678–30690.
- Connor J, Bucana C, Fidler IJ, et al. Differentiation-dependent expression of phosphatidylserine in mammalian plasma membranes: quantitative assessment of outer-leaflet lipid by prothrombinase complex formation. Proc Natl Acad Sci U S A. 1989;86:3184–3188.
- Woehlecke H, Pohl A, Alder-Baerens N, et al. Enhanced exposure of phosphatidylserine in human gastric carcinoma cells overexpressing the half-size ABC transporter BCRP (ABCG2). Biochem J. 2003;376:489–495.
- Ran S, Downes A, Thorpe PE. Increased exposure of anionic phospholipids on the surface of tumor blood vessels. Cancer Res. 2002;62:6132–6140.
- Sharma B, Kanwar SS. Phosphatidylserine: A cancer cell targeting biomarker. Semin Cancer Biol. 2018;52:17–25.
- Belzile O, Huang X, Gong J, et al. Antibody targeting of phosphatidylserine for the detection and immunotherapy of cancer. Immunotargets Ther. 2018;7:1–14.
- Yáñez-Mó M, Siljander PR, Andreu Z, et al. Biological properties of extracellular vesicles and their physiological functions. J Extracell Vesicles. 2015;4:27066.
- Théry C, Ostrowski M, Segura E. Membrane vesicles as conveyors of immune responses. Nat Rev Immunol. 2009;9:581–593.
- Naito Y, Yoshioka Y, Yamamoto Y, et al. How cancer cells dictate their microenvironment: present roles of extracellular vesicles. Cell Mol Life Sci. 2017;74:697–713.
- Becker A, Thakur BK, Weiss JM, et al. Extracellular vesicles in cancer: cell-to-cell mediators of metastasis. Cancer Cell. 2016;30:836–848.
- Skotland T, Sandvig K, Llorente A. Lipids in exosomes: current knowledge and the way forward. Prog Lipid Res. 2017;66:30–41.
- Record M, Carayon K, Poirot M, et al. Exosomes as new vesicular lipid transporters involved in cell-cell communication and various pathophysiologies. Biochim Biophys Acta. 2014;1841:108–120.
- Muhsin-Sharafaldine MR, Saunderson SC, Dunn AC, et al. Procoagulant and immunogenic properties of melanoma exosomes, microvesicles and apoptotic vesicles. Oncotarget. 2016;7:56279–56294.
- Keller S, König AK, Marmé F, et al. Systemic presence and tumor-growth promoting effect of ovarian carcinoma released exosomes. Cancer Lett. 2009;278:73–81.
- Kelleher RJ Jr, Balu-Iyer S, Loyall J, et al. Extracellular vesicles present in human ovarian tumor microenvironments induce a phosphatidylserine-dependent arrest in the T-cell signaling cascade. Cancer Immunol Res. 2015;3:1269–1278.
- Lima LG, Chammas R, Monteiro RQ, et al. Tumor-derived microvesicles modulate the establishment of metastatic melanoma in a phosphatidylserine-dependent manner. Cancer Lett. 2009;283:168–175.
- Sharma R, Huang X, Brekken RA, et al. Detection of phosphatidylserine-positive exosomes for the diagnosis of early-stage malignancies. Br J Cancer. 2017;117:545–552.
- Lea J, Sharma R, Yang F, et al. Detection of phosphatidylserine-positive exosomes as a diagnostic marker for ovarian malignancies: a proof of concept study. Oncotarget. 2017;8:14395–14407.
- Koch CJ, Lustig RA, Yang XY, et al. Microvesicles as a biomarker for tumor progression versus treatment effect in radiation/temozolomide-treated glioblastoma patients. Transl Oncol. 2014;7:752–758.
- Nakai W, Yoshida T, Diez D, et al. A novel affinity-based method for the isolation of highly purified extracellular vesicles. Sci Rep. 2016;6:33935.
- Shih CL, Chong KY, Hsu SC, et al. Development of a magnetic bead-based method for the collection of circulating extracellular vesicles. N Biotechnol. 2016;33:116–122.
- Imai T, Takahashi Y, Nishikawa M, et al. Macrophage-dependent clearance of systemically administered B16BL6-derived exosomes from the blood circulation in mice. J Extracell Vesicles. 2015;4:26238.
- Yang Y, Hong Y, Cho E, et al. Extracellular vesicles as a platform for membrane-associated therapeutic protein delivery. J Extracell Vesicles. 2018;7:1440131.
- Tauro BJ, Greening DW, Mathias RA, et al. Comparison of ultracentrifugation, density gradient separation, and immunoaffinity capture methods for isolating human colon cancer cell line LIM1863-derived exosomes. Methods. 2012;56:293–304.
- Paolini L, Zendrini A, Di Noto G, et al. Residual matrix from different separation techniques impacts exosome biological activity. Sci Rep. 2016;6:23550.
- Willms E, Johansson HJ, Mäger I, et al. Cells release subpopulations of exosomes with distinct molecular and biological properties. Sci Rep. 2016;6:22519.
- Kowal J, Arras G, Colombo M, et al. Proteomic comparison defines novel markers to characterize heterogeneous populations of extracellular vesicle subtypes. Proc Natl Acad Sci U S A. 2016;113:E968–E977.
- Lai RC, Tan SS, Yeo RW, et al. MSC secretes at least 3 EV types each with a unique permutation of membrane lipid, protein and RNA. J Extracell Vesicles. 2016;5:29828.
- Gardiner C, Ferreira YJ, Dragovic RA, et al. Extracellular vesicle sizing and enumeration by nanoparticle tracking analysis. J Extracell Vesicles. 2013;2:19671.
- Akagi T, Ichiki T. Microcapillary chip-based extracellular vesicle profiling system. Methods Mol Biol. 2017;1660:209–217.
- Consortium E-T, Van Deun J, Mestdagh P, et al. EV-TRACK: transparent reporting and centralizing knowledge in extracellular vesicle research. Nat Methods. 2017;14(3):228–232.
- Richter RP, Brisson AR. Following the formation of supported lipid bilayers on mica: a study combining AFM, QCM-D, and ellipsometry. Biophys J. 2005;88:3422–3433.
- Albanyan AM, Murphy MF, Rasmussen JT, et al. Measurement of phosphatidylserine exposure during storage of platelet concentrates using the novel probe lactadherin: a comparison study with annexin V. Transfusion. 2009;49:99–107.
- Stark M, Möller C, Müller DJ, et al. From images to interactions: high-resolution phase imaging in tapping-mode atomic force microscopy. Biophys J. 2001;80:3009–3018.
- Bobrie A, Colombo M, Krumeich S, et al. Diverse subpopulations of vesicles secreted by different intracellular mechanisms are present in exosome preparations obtained by differential ultracentrifugation. J Extracell Vesicles. 2012;1:18397.
- Palma J, Yaddanapudi SC, Pigati L, et al. MicroRNAs are exported from malignant cells in customized particles. Nucleic Acids Res. 2012;40:9125–9138.
- Marzesco AM, Janich P, Wilsch-Bräuninger M, et al. Release of extracellular membrane particles carrying the stem cell marker prominin-1 (CD133) from neural progenitors and other epithelial cells. J Cell Sci. 2005;118:2849–2858.
- Arroyo JD, Chevillet JR, Kroh EM, et al. Argonaute2 complexes carry a population of circulating microRNAs independent of vesicles in human plasma. Proc Natl Acad Sci U S A. 2011;108:5003–5008.
- Turchinovich A, Weiz L, Langheinz A, et al. Characterization of extracellular circulating microRNA. Nucleic Acids Res. 2011;39:7223–7233.
- Sung BH, Ketova T, Hoshino D, et al. Directional cell movement through tissues is controlled by exosome secretion. Nat Commun. 2015;6:7164.
- Ma L, Li Y, Peng J, et al. Discovery of the migrasome, an organelle mediating release of cytoplasmic contents during cell migration. Cell Res. 2015 Jan;25(1):24–38.
- Wood CR, Rosenbaum JL. Ciliary ectosomes: transmissions from the cell’s antenna. Trends Cell Biol. 2015;25(5):276–285.
- Hoshino D, Kirkbride KC, Costello K, et al. Exosome secretion is enhanced by invadopodia and drives invasive behavior. Cell Rep. 2013;5:1159–1168.
- Li X, Wang X. The emerging roles and therapeutic potential of exosomes in epithelial ovarian cancer. Mol Cancer. 2017;16:92.
- Reiner AT, Tan S, Agreiter C, et al. EV-associated MMP9 in high-grade serous ovarian cancer is preferentially localized to annexin V-binding EVs. Dis Markers. 2017;2017:9653194.
- Tegegn TZ, De Paoli SH, Orecna M, et al. Characterization of procoagulant extracellular vesicles and platelet membrane disintegration in DMSO-cryopreserved platelets. J Extracell Vesicles. 2016;5:30422.
- Otzen DE, Blans K, Wang H, et al. Lactadherin binds to phosphatidylserine-containing vesicles in a two-step mechanism sensitive to vesicle size and composition. Biochim Biophys Acta. 2012;1818:1019–1027.
- Shi J, Heegaard CW, Rasmussen JT, et al. Lactadherin binds selectively to membranes containing phosphatidyl-L-serine and increased curvature. Biochim Biophys Acta. 2004;1667:82–90.
- Richter RP, Him JL, Tessier B, et al. On the kinetics of adsorption and two-dimensional self-assembly of annexin A5 on supported lipid bilayers. Biophys J. 2005;89:3372–3385.
- Andree HA, Stuart MC, Hermens WT, et al. Clustering of lipid-bound annexin V may explain its anticoagulant effect. J Biol Chem. 1992;267:17907–17912.