
ABSTRACT
Airway epithelial cells secrete extracellular vesicles (EVs) under basal conditions and when exposed to cigarette smoke extract (CSE). Getting insights into the composition of these EVs will help unravel their functions in homeostasis and smoking-induced pathology. Here, we characterized the proteomic composition of basal and CSE-induced airway epithelial EVs. BEAS-2B cells were left unexposed or exposed to 1% CSE for 24 h, followed by EV isolation using ultrafiltration and size exclusion chromatography. Isolated EVs were labelled with tandem mass tags and their proteomic composition was determined using nano-LC-MS/MS. Tissue factor (TF) activity was determined by a factor Xa generation assay, phosphatidylserine (PS) content by prothrombinase assay and thrombin generation using calibrated automated thrombogram (CAT). Nano-LC-MS/MS identified 585 EV-associated proteins with high confidence. Of these, 201 were differentially expressed in the CSE-EVs according to the moderated t-test, followed by false discovery rate (FDR) adjustment with the FDR threshold set to 0.1. Functional enrichment analysis revealed that 24 proteins of the pathway haemostasis were significantly up-regulated in CSE-EVs, including TF. Increased TF expression on CSE-EVs was confirmed by bead-based flow cytometry and was associated with increased TF activity. CSE-EVs caused faster and more thrombin generation in normal human plasma than control-EVs, which was partly TF-, but also PS-dependent. In conclusion, proteomic analysis allowed us to predict procoagulant properties of CSE-EVs which were confirmed in vitro. Cigarette smoke-induced EVs may contribute to the increased cardiovascular and respiratory risk observed in smokers.
Introduction
Tobacco consumption forms an important risk factor for several chronic diseases including lung cancer, chronic obstructive pulmonary disease (COPD) and cardiovascular disease [Citation1]. We and others have shown that cigarette smoke extract (CSE) causes increased release of extracellular vesicles (EVs) by different cell types in vitro [Citation2–Citation5]. Moreover, smokers have increased concentrations of circulating EVs in vivo [Citation4,Citation6,Citation7]. These EVs are secreted membrane vesicles, which are either derived from the plasma membrane (microvesicles) or from multivesicular endosomes (exosomes). Both types of EVs carry a versatile cargo of lipids, nucleotides and proteins, and have been ascribed multiple functions in homeostasis as well as pathologies [Citation8].
The functions of EVs released by smoke-exposed monocytes and macrophages are relatively well studied. These EVs have been proposed to promote inflammation [Citation3], proteolysis [Citation9] and coagulation [Citation10]. However, EV functions can differ depending on the EV type, the secreting cell and its physiological state [Citation11,Citation12]. Although the airway epithelium forms the first line of contact with inhaled cigarette smoke, studies on the functions of EVs released by smoke-exposed airway epithelial cells are scarce. Previously, we have shown that airway epithelial cells secrete small EVs (mode size 110 nm) expressing the tetraspanins CD63, CD81 and CD9, at control conditions and when exposed to CSE [Citation5,Citation13]. In this study, we aimed to predict the functions of these EVs. For this purpose, we isolated EVs from conditioned media of unexposed or CSE-exposed airway epithelial cells using a combination of ultrafiltration and size exclusion chromatography (SEC). We then labelled the isolated EVs with tandem mass tags and performed a quantitative proteomic analysis using nanoscale liquid chromatography coupled to tandem mass spectrometry (nano-LC-MS/MS), with the hypothesis that EV functions can be predicted based on their proteomic content.
Materials and methods
We have submitted all relevant data of our experiments to the EV-TRACK knowledgebase (EV-TRACK ID: EV180060) [Citation14].
Cell culture and exposure
BEAS-2B airway epithelial cells (ATCC CRL-9609) were cultured in RPMI 1640 with 10% (v/v) foetal calf serum (FCS, Lonza) and all cell culture flasks or plates were precoated with fibronectin as described previously [Citation5]. For flow cytometric analysis of EVs or cells, 2 × 10⁵ cells per well were seeded on a 12-well plate (Costar) and for EV-isolations, 4 × 10⁶ cells were seeded per T75 (Costar) and allowed to attach overnight. After 2 h incubation in reduction medium (DMEM-F12 without phenol-red (Gibco) supplemented with 0.1% EV-depleted FCS), cells were washed twice with phosphate-buffered saline (PBS) before 1 ml (12-well plate) or 20 ml (T75) of reduction medium and either 1% (v/v) PBS (vehicle control) or 1% (v/v) CSE was added. For EV isolations, three T75 cell culture flasks and a total medium volume of 60 ml were used per condition, except for nano-LC-MS/MS, where six T75 and 120 ml were used.
EV-depleted FCS was obtained by diluting FCS to 30% (v/v) in DMEM-F12 without phenol-red followed by 16 h centrifugation at 40,000 rpm (average RCF = 117,734 × g, k-Factor 133.7), in a fixed-angle Type 70Ti-rotor in an Optima L-90K preparative ultracentrifuge (Beckman-Coulter). The supernatant was collected without disturbing the concentrated layer at the bottom of the tube. This procedure resulted in a 45.5 ± 6.8-fold reduction of particles in the size range of 80–250 nm, from 3.7 ± 0.7 × 10⁹ to 7.8 ± 1.3 × 10⁷ particles/ml, according to tunable resistive pulse sensing (TRPS; n = 2).
CSE was generated using an in-house smoking device with silicone tubing. The mainstream smoke of one cigarette (Reference Cigarette 3R4F, Tobacco-Health Research, University of Kentucky) without filter was drawn through 2 ml PBS in a polypropylene tube using a vacuum-pump at constant speed. The obtained solution was filtered through a 0.22 µm Acrodisk filter (Pall) for sterility and defined as 100% CSE. CSE was only used when the cigarette was completely smoked within 6–8 min and when the delta OD (OD320 nm − OD540 nm) of 100 µl 100% CSE was between 0.9 and 1.2. CSE was prepared freshly for each experiment and used within 15 min.
EV isolation
EV isolation was performed by a combination of 10 kDa ultrafiltration and sepharose CL-4B SEC as described previously [Citation13]. In brief, 60 ml of conditioned media were concentrated to 500 μl on an Amicon Ultra-15 Centrifugal Filter Unit with Ultracel 10 membrane (10 kDa MWCO, Merck Millipore), followed by separation of EVs and free protein by SEC on a 10 ml sepharose CL4B column into 24 fractions of 0.5 ml. The EV-containing SEC fractions (7–10) as well as the protein-containing SEC fractions (13–19) were then pooled and concentrated to 250 μl on an Amicon Ultra-4 Centrifugal Filter Unit with Ultracel 10 membrane (10 kDa MWCO, Merck Millipore) to obtain EV isolates and protein concentrates, respectively. The entire isolation protocol was also applied to unconditioned media in order to obtain unconditioned media isolates, i.e. fractions 7–10 from media that were incubated for 24 h with 1% (v/v) PBS or CSE in the absence of cells.
Characterization of EV size and morphology
The morphology and size of the isolated EVs were visualized by cryo-transmission electron microscopy (cryo-TEM) as described previously [Citation13]. Additionally, the EV size distribution and concentration were determined by TRPS. TRPS was performed using a qNano Gold with Izon Control Suite 3.2 Software and SKP200 calibration beads (Izon, Chirstchurch, New Zealand). EV isolates were analysed after a single freeze-thaw cycle at −80°C. Where possible, at least 500 blockades were detected per sample. To enable comparability between the different recordings, the pore stretch was adjusted to obtain a relative particle size of 0.65 for the SKP200 calibration beads, and the voltage was adjusted to obtain a current between 125 and 130 nA. A size filter from 80 to 250 nm was applied for determining EV concentrations.
Processing of EV-associated protein, nano-LC–MS/MS and database search
Isolated EVs (500 μl, obtained from 120 ml of conditioned media) were acetone-precipitated as described previously [Citation13]. Five microgram of precipitated protein per sample was incubated for 1 h at 55°C with 50 mM triethylammonium bicarbonate (TEAB; Sigma-Aldrich) and 10 mM tris(2-carboxyethyl)phosphine (TCEP; Thermo Fisher Scientific). Next, protein was alkylated by incubation with 17 mM iodoacetic acid (IAA, Sigma-Aldrich) for 30 min in the dark at room temperature. Samples were then incubated with six volumes of ice-cold acetone at −20°C overnight before centrifugation at 8000 × g for 10 min at 4°C. The dried pellet was resuspended in 50 μl of 100 mM TEAB and samples were incubated with 20 ng/μl trypsin/endoproteinase lysC (Promega) for 2 h at 37°C. After addition of 75 μl 100 mM TEAB, samples were incubated for another 18 h at 37°C. Finally, samples were stained using the TMT10plex™ Isobaric Label Reagent Set (Thermo Fisher Scientific) according to manufacturer’s protocol. Twenty microlitres from each of the 10 samples (five control isolates and five CSE isolates) was pooled.
A nanoflow high-performance liquid chromatography (HPLC) instrument (Dionex ultimate 300) was coupled on-line to a Q Exactive (Thermo Scientific) with a nano-electrospray Flex ion source (Proxeon). The final concentration of the TMT-labelled digest/peptide mixture was 0.2 μg/μl and 5 μl of this mixture was loaded onto a C18-reversed phase column (Thermo Fisher Scientific, Acclaim PepMap C18 column, 75 μm inner diameter × 15 cm, 5 μm particle size). The peptides were separated with a 90 min linear gradient of 4–45% buffer B (80% acetonitrile and 0.08% formic acid) at a flow rate of 300 nL/min.
The mass spectrometry data acquisition and the data base search were performed using the Sequest HT Proteome Discoverer 2.1 as described previously [Citation13], except that the resolution for HCD spectra was set to 35,000 and TMT reagent adducts (+229.162932 Da) on lysine and peptide amino termini were set as fixed modifications. Sample abundances were normalized to obtain an equal total peptide amount for all 10 samples. The raw data of the nano-LC-MS/MS analyses have been deposited to the public database ProteomeXchange (Project number: PXD006738). Proteins identified with a false discovery rate (FDR) < 0.01 were considered of high confidence and included for downstream analysis.
EV detection using bead-based flow cytometry
All antibodies were purchased from BD Biosciences. EVs were detected by bead-based flow cytometry as described previously with some adaptations [Citation5]. Beads (3.5 × 10⁸/ml; 4 μm aldehyde/sulphate latex beads; Thermo Fisher Scientific) were coated with 0.125 mg/ml of mouse anti-human CD63 antibody (Clone H5C6), anti-human CD81 (clone JS-81), anti-human CD9 (Clone M-L13), or an equal mixture of all three antibodies by overnight incubation in MES buffer on a shaker at 6500 rpm. Coated beads were stored in PBS-containing 0.1% (m/v) glycine and 0.1% (m/v) sodium azide at 4°C until use. Before use, beads were washed with PBS-containing 2% (w/v) bovine serum albumin (BSA). Then, 1 × 10⁶ beads were incubated overnight with either 200 μl of conditioned cell culture media or 200 μl of isolated EVs suspended in PBS at a concentration of 2 × 10⁸ particles/ml based on TRPS. Detection was performed as described previously [Citation5] with either of the following phycoerythrin (PE)-labelled antibodies: (Clone H5C6), anti-human CD81 (clone JS-81), anti-human CD9 (Clone M-L13) or anti-human tissue factor (TF; clone HTF-1). Alternatively, beads were stained for 15 min at room temperature with 50 μl of Alexa Fluor 488 (AF488) conjugated annexin V (Thermo Fisher Scientific) diluted 50× in annexin binding buffer (ABB) in order to detect phosphatidylserine (PS). Stained beads were suspended in 150 μl PBS (antibody staining) or ABB (annexin V staining) and analysed using a BD FACSCanto II (BD Biosciences) with FACS Diva V8.0.1 software (BD Biosciences). The quantity of EVs in relative fluorescent units (RFU) was calculated by multiplying the percentage of PE or AF488-positive beads with the median fluorescent intensity (MFI) of the positive bead population.
Cell viability and detection of cell surface-exposed TF and PS
BEAS-2B cells (2 × 10⁵) were incubated with 1% (v/v) PBS or CSE on 12-well plates (Costar). After 24 h, cell viability was assessed by methylthiazolyldiphenyl-tetrazolium bromide (MTT) assay as described previously [Citation5]. Alternatively, ethylenediaminetetraacetic acid (EDTA, 250 mM, pH 6.14) was added to the wells to a final concentration of 10 mM and incubated for 10 min at 37°C. Cells were then gently detached by pipetting and sedimented by centrifugation (400 × g, 7 min).
For detection of cell surface-exposed PS, cells were resuspended in 70 μl ABB with 3.6% (v/v) AF488-labelled annexin V (AnxV) and 1 μg/ml propidium iodide (PI). After incubation for 15 min at room temperature, 100 μl of ABB was added, followed by immediate measurement using a BD FACSCanto II (BD Biosciences) with FACS Diva V8.0.1 software (BD Biosciences). The percentages of AnxV−PI− (live, no cell surface-exposed PS), AnxV+PI− (apoptotic, cell surface-exposed PS) and AnxV+PI+ (dead, impaired membrane integrity) were determined.
For TF detection, pelleted cells were resuspended in 100 μl PBS with 2% (w/v) BSA and 2% (v/v) PE-labelled mouse anti-human TF (clone HTF-1, BD Biosciences) or PE-labelled isotype control (clone MPC-21, BD Biosciences). After 45 min incubation at room temperature with gentle shaking, cells were sedimented at 400 × g for 7 min, followed by resuspension in 150 μl PBS and measurement using a BD FACSCanto II (BD Biosciences) with FACS Diva V8.0.1 software (BD Biosciences). The gate was set so that 2% of the isotype-stained cells had a positive PE-signal.
Blood collection and processing for the normal human plasma pool
Blood collection was performed as described previously with some adaptations [Citation15]. Written informed consent was obtained from all participants, and the study was approved by the institutional ethics committee of the Maastricht UMC+. Venous blood was collected from 122 healthy volunteers through antecubital venipuncture using 21-gauge needles, one discarding tube and four consecutive 3.2% (w/v) citrated Vacutainer glass tubes (BD). Blood was centrifuged at 2000 × g for 5 min, followed by a second centrifugation step at 5000 × g for 10 min to obtain platelet poor plasma (PPP). PPP from all donors was pooled and aliquots of the thus obtained normal human plasma pool were snap-frozen in liquid nitrogen and stored at −80°C until use.
Assessing procoagulant effects of EVs
For blocking surface-exposed PS, 2.5 × 10⁹ EVs/ml were incubated for 30 min at 37°C with 10 μg/ml annexin V (Thermo Fisher Scientific) in 50 μl PBS with 10% (v/v) 10× ABB. Controls were mock-treated with 50 μl PBS with 10% (v/v) 10× ABB. EVs were then stored at −80°C.
TF activity was determined using an in house factor Xa generation assay as described previously [Citation16]. The assay is based on the principle that active TF forms a complex with factor VIIa, which activates factor X to Xa in the presence of Ca2+ and phospholipids. In brief, isolated EVs (7.5 × 10⁶) and standards were incubated for 10 min at 37°C in the presence of recombinant factor VIIa (Novo Nordisk, Bagsværd, Denmark), 0.2 mM 20/80 PS/phosphatidylcholine (PC) vesicles (prepared in house using phospholipids from Avanti Polar Lipids Inc.), 1 U/ml Bovine FX (Sigma-Aldrich) and 100 mM Ca2+. The formation of factor Xa was then measured kinetically using the chromogenic substrate 2765 (Chromogenix, final concentration of 0.7 mg/ml diluted in 50 mM Tris-HCl, 175 nM NaCl, 30 mM Na2EDTA, pH 7.4) by measuring the OD at 405 nm each 15 s, for 15 min at 37°C.
PS-dependent thrombin generation was determined using an in-house prothrombinase assay. In the presence of negatively charged phospholipids, such as PS, factor Va and factor Xa assemble to form the active prothrombinase complex, which converts prothrombin into its active form thrombin. A reaction mix of 5 mg/ml BSA, 1.0 nM bovine factor Va, 0.05 nM bovine factor Xa and 5 mM CaCl2 was prepared in HEPES-NaCl (HN) buffer (25 mM HEPES and 175 mM NaCl, pH 7.7 at room temperature). Ten microlitres of phospholipid standard (10% PS, 90% PC; ranging from 10 to 250 nM), mock-treated EVs or annexin V-treated EVs (5 × 10⁸ particles/ml) were added to 190 μl of the reaction mix. After 10 min incubation, human prothrombin (Haematologic Technologies Incorporated) was added to a final concentration of 500 nM and incubated for 1 min. Next, 50 μl was subsampled and transferred to 150 μl cuvette buffer (50 mM Tris, 175 mM NaCl, 20 mM EDTA, 0.5 mg/ml ovalbumin, pH 7.9) and incubated for 7 min 37°C. Thereafter, 50 μl of the thrombin substrate S2238 (Chromogenix) was added and the absorption at 405 and 490 nm was measured every 30 s for 15 min.
Thrombin generation in human plasma was determined by the calibrated automated thrombogram method (CAT, Thrombinoscope BV). Untreated, mock-treated or annexin V-treated control-EVs or CSE-EVs (2 × 10⁸ or 1 × 10⁸) were added to 70 μl of normal pooled PPP in the presence or absence of 30 nM of the TF inhibitor active site inhibited factor VIIa (ASIS). The total reaction volume was 120 μl and measurements were performed as described previously [Citation17].
Data analysis
is a flow chart summarizing the data analysis steps performed on the proteomics data. The method published by Kammers et al. was used to detect significant changes in protein abundance between control-EVs and CSE-induced EVs [Citation18] using the limma packageV3.32.10 in R V3.4.1 with R studio [Citation19]. Abundance values of proteins identified by the Sequest HT Proteome Discoverer 2.1 with an FDR <0.01 were imported into R. The log2 of the abundances was then calculated. Subsequently, the median log2 abundance of each protein was subtracted from each individual abundance value of that protein (n = 5 for control-EVs and n = 5 for CSE-induced EVs) to obtain a normalized protein abundance with a median of 0. A moderated t-test was then performed to test for statistically significant differences in protein abundance between the control-EVs and the CSE-EVs using a slight modification of the code published by Kammers et al [Citation18] (Supplemental file 1). This included calculation of the p-value of the moderated t-test as well as transformation into q-values according to the method of Storey and Tibshirani [Citation20]. Proteins that showed a differential expression with a q-value (i.e. FDR) < 0.1 were included for downstream functional enrichment analysis for gene ontology (GO) terms and biological pathways. Functional enrichment analysis by hypergeometric test was performed using FunRich software version 2.1.2 and the human-specific integrated FunRich background database [Citation21]. For the functional enrichment analysis, the FDR was set to 0.01. Functional enrichment was determined for GO terms from the three GO domains “cellular component”, “molecular function” and “biological process” as well as for biological pathways. The protein dataset was subdivided into three subsets: (1) proteins that were unchanged in CSE-EVs compared to control-EVs, (2) proteins that were significantly up-regulated and (3) proteins that were significantly down-regulated in CSE-EVs. GO terms and biological pathways were selected for display in the results section if they showed a strong enrichment in all three subsets or if they showed strong differences in enrichment between the subsets.
Figure 1. Flow chart of the proteomics data analysis. The chart summarizes the data analysis process starting from the data acquisition and ending at the GO terms and biological pathways that were found to be enriched. Rounded rectangles represent data-handling steps, whereas rhombi represent (intermediate) results. CSE: cigarette smoke extract; EVs: extracellular vesicles; FC: fold-change; GO: gene ontology; LC-MS/MS: liquid chromatography tandem mass spectrometry.
All other data analysis was performed using Graphpad Prism 5.03 for Windows using the Mann–Whitney U test where two groups were compared and the Kruskal–Wallis test with Dunn’s post-hoc test where more than two groups were compared.
Results
Difference in proteomic composition between CSE-induced EVs and control-EVs
To determine functionally relevant differences in the proteomic composition of EVs from unexposed or CSE-exposed BEAS-2B airway epithelial cells, cells were either left untreated or exposed to 1% (v/v) CSE for 24 h. Exposure to CSE resulted in a moderate decrease in cell metabolic activity as determined by MTT assay (). This was associated with an increased release of EVs according to TRPS (). Bead-based flow cytometry using a cocktail of antibodies against the EV marker proteins CD63, CD81 and CD9 confirmed that there was an overall increase in EV concentration in conditioned media of CSE-exposed cells (). Staining for each individual marker protein revealed that the overall increase in EV concentration was driven by CD81+ and CD9+ but not CD63+ EVs (). The differential up-regulation of some, but not all tested marker proteins is suggestive of compositional changes.
Figure 2. CSE-induced changes in BEAS-2B-derived EVs. (a) Metabolic activity of BEAS-2B cells incubated for 24 h under control conditions or with addition of 1% (v/v) CSE, n = 8. (b) Concentration of EV isolates obtained from conditioned media of BEAS-2B cells as measured by TRPS, n = 7. A size filter of 80–250 nm was applied. (c) FC of EVs detected in conditioned media of BEAS-2B cells after 24 h exposure to CSE as measured by bead-based flow cytometry using different combinations of capture beads and detection antibodies, n = 7. *p < 0.05. CSE: cigarette smoke extract; ctrl: control; EVs: extracellular vesicles; FC: fold-change; n.s. : not significant; TRPS: tunable resistive pulse sensing.
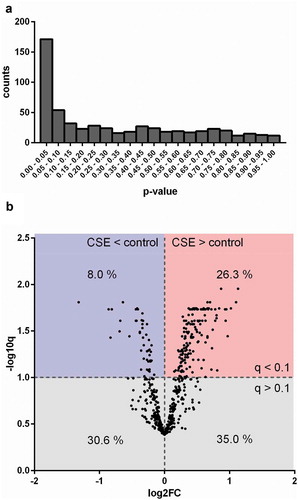
EVs were isolated using a combination of ultrafiltration and SEC as described previously [Citation13]. Size and morphology of isolated control-EVs and CSE-EVs were similar according to cryo-TEM () and TRPS (). Isolated EVs (n = 5) were precipitated, followed by protein digestion, isobaric labelling and quantitative proteomic analysis. By nano-LC-MS/MS, 732 proteins were identified, including 633 with high FDR confidence (q < 0.01), which were tested for differential expression in CSE-EVs (Supplemental file 2). No p-values could be calculated for 48 proteins due to too many missing values, resulting in p-values for 585 proteins. The p-value histogram in a shows that there were true differences in protein abundance between CSE-EVs and control-EVs as illustrated by the clear peak for p-values < 0.05. All 585 p-values were transformed to q-values for FDR adjustment. The volcano plot in shows that 26.3% of proteins were significantly up-regulated and 8.0% significantly down-regulated in the CSE-EVs (q < 0.1).
Figure 3. Size and morphology of EVs released by BEAS-2B cells under control conditions and when exposed to 1% (v/v) CSE for 24 h. (a) Low magnification (scale bar 200 nm) and (b) detail (scale bar 100 nm) cryo-TEM recordings of isolated EVs. (c) Diameter of isolated EV as determined by cryo-TEM. (d) Size distribution histogram of isolated EVs as determined by TRPS. Bars show the mean ± SEM, n = 5. The vertical dotted lines indicate the size filter that was applied to quantify EVs in order to normalize the input for EV characterization (80–250 nm). CSE: cigarette smoke extract.
Figure 4. Differences in protein composition of EVs from unexposed or CSE-exposed BEAS-2B cells. (a) Histogram of p-values obtained by performing a moderated t-test to detect differences between control-EVs and CSE-EVs concerning the expression of proteins identified by nano-LC-MS/MS, n = 5. (b) Volcano plot. The x-axis shows the log2 of the fold change (expression in CSE-EVs/expression in control-EVs) and the y-axis shows the −log10 of the q-value. CSE: cigarette smoke extract.
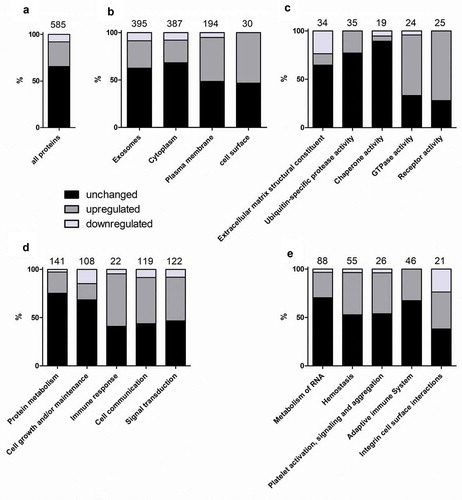
To identify functional changes in the EV composition due to CSE exposure, the 585 proteins were divided into three subsets: proteins that were unchanged (384; 65.6%), up-regulated (154; 26.3%) or down-regulated (47; 8.0%) in CSE-EVs (). For the total dataset, as well as the three subsets, functional enrichment analysis was performed for the three GO domains “cellular component”, “molecular function” and “biological process” as well as for manually curated biological pathways (results in ). To allow graphical representation of the results, it was then calculated what percentage of the proteins representing each enriched GO term or biological pathway was unchanged, significantly up-regulated or significantly down-regulated in the CSE-EVs. Proteins of the cellular component “exosomes” showed a similar percentage of unchanged, up-regulated and down-regulated proteins as the total protein set (, ). Upon CSE exposure there was an up-regulation of proteins associated with the “plasma membrane” and the “cell surface” (, ). Concerning the molecular function, proteins representing “extracellular matrix structural constituent”, “ubiquitin-specific protease activity” and “chaperone activity” were mostly unchanged, whereas there was a clear up-regulation of proteins with GTPase and receptor activity (, ). Finally, biological process (, ) and biological pathway analyses (, ) revealed that proteins involved in maintenance functions such as “protein metabolism”, “cell growth and/or maintenance” and “metabolism of RNA” tended to be unchanged or down-regulated. Yet, there was an up-regulation of proteins related to immunity (“immune response”, “adaptive immune system”) and communication (“cell communication”, “signal transduction”; , ). Most strikingly, there was a clear up-regulation of proteins involved in “haemostasis” and its sub-pathway “platelet activation, signalling and aggregation”. summarizes all identified proteins of these two pathways, including the fold-change, p-value and q-value.
Table 1. Results of the functional enrichment analysis.
Table 2. List of EV-associated proteins of the pathway haemostasis (1) and platelet signalling, activation and aggregation (2).
Figure 5. Results of the functional enrichment analysis. The graphs display how many percent of the proteins related to the analysed GO terms or pathways were unchanged, up-regulated or down-regulated in the CSE-EVs compared to control-EVs. Panel (a) shows a reference bar with the percentages of unchanged, up-regulated and down-regulated proteins for all 585 proteins included in the functional enrichment analysis. (B–E) show the percentages of proteins related to different cellular components (b), molecular functions (c), biological processes (d) or biological pathways (e) that were unchanged, up-regulated or down-regulated in CSE-EVs compared to control-EVs. The numbers above the bars indicate the total number of proteins identified for each GO term or pathway.
Confirmation of the predicted procoagulant phenotype of CSE-EVs
The most strongly enriched biological pathway in CSE-EVs was “haemostasis”. A prominent member of this pathway is TF, which by itself is sufficient to trigger the extrinsic pathway of coagulation. In our proteomic data, TF was 1.4-fold up-regulated in CSE-EVs (p = 0.03, q = 0.05, ). To verify whether TF was indeed associated with the isolated EVs and not a co-isolated contaminant, we determined the presence of TF on tetraspanin-positive EVs using bead-based flow cytometry on conditioned cell culture media, and on a standardized number of isolated EVs (108 particles/ml). For cell culture media, we assessed the presence of TF on EVs captured using beads that were coated with antibodies against either a combination of tetraspanins (CD63, CD81, CD9), or each individual tetraspanin. For all bead types, we confirmed the presence of TF on control-EVs and CSE-EVs. Moreover, there was a statistically significant increase in TF+ EVs using all bead types for the CSE-exposed condition (). This was also the case when TF was measured for a standardized concentration of isolated EVs (108 particles/ml) using CD63/CD81/CD9 beads (). The increased TF expression on EVs was associated with increased TF activity as assessed by a factor Xa generation assay (). The control conditions, namely the protein-rich EV-low SEC fractions (fractions 14–19) and unconditioned media isolates (UCM, corresponding to the EV-rich SEC fractions but obtained from media that have not been in contact with cells) had little and no detectable TF activity, respectively. The EV-secreting cells also showed an up-regulation of cell surface exposed TF when exposed to CSE, similar to the increase observed on CSE-EVs ().
Figure 6. Confirmation of the presence of the pro-coagulant factors TF and phosphatidylserine (PS) on EVs. (a) Detection of TF+-EVs in conditioned cell culture media using bead-based flow cytometry with beads coated for different tetraspanins, n = 7. (b) TF expression on isolated EVs (108 particles/ml) determined by bead-based flow cytometry with anti-CD63/CD81/CD9-coated beads, n = 6. (c) TF activity of EV isolates obtained by UF-SEC (108 particles/ml), volume-matched protein isolates obtained by UF-SEC and volume-matched sham EV isolated from unconditioned cell culture media, n = 5. (d) Percentage of TF+ cells (the gate was set so that 98% of the cells stained with the isotype control were negative), n = 4. (e) Detection of PS+-EVs in conditioned cell culture media using bead-based flow cytometry with beads coated for different tetraspanins, n = 7. (f) PS expression on isolated EVs (108 particles/ml) determined by bead-based flow cytometry with anti-CD63/CD81/CD9-coated beads, n = 9. (g) Thrombin generation as determined by prothrombinase assay in the absence or presence of the PS blocker annexin V; n = 4. (h) PS externalization on control and CSE-exposed BEAS-2B cells as determined by flow cytometry using annexin V and PI staining; n = 6. *p < 0.05; AnxV: annexin V; CSE: cigarette smoke extract; ctrl: control; EVs: extracellular vesicles; FC: fold-change; n.s. : not significant; PI: propidium iodide; PS: phosphatidylserine; RFU: relative fluorescent units; TF: tissue factor; TRPS: tuneable resistive pulse sensing; UCM: unconditioned medium isolate.
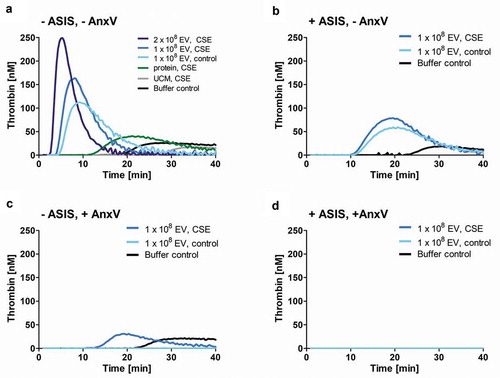
Next, isolated EVs were added to normal human plasma and thrombin generation was assessed over time. As predicted, CSE-EVs induced more thrombin generation than control-EVs for a standardized number of EVs (108 particles, ). When CSE-EVs were used at the double concentration in line with the approximately two-fold EV induction by CSE, this effect was further enhanced (). Neither the protein-rich SEC fractions, nor unconditioned media isolates were able to trigger thrombin generation, suggesting that this effect can be attributed specifically to the EVs (). Finally, thrombin generation was partly inhibited by addition of ASIS, which traps TF in an inactive complex and thereby inhibits the extrinsic pathway (). Thus, TF partly accounts for the procoagulant effect of CSE-EVs, but other factors are likely to contribute as well.
Figure 7. Time-dependent thrombin generation in normal human plasma as determined by calibrated automated thrombogram (CAT). Thrombin generation upon (a) Addition of CSE-EVs, control-EVs, volume-matched free secreted molecules (SEC protein fraction) or sham EVs isolated from unconditioned media. (b) Addition of CSE-EVs or control-EVs in the presence of the TF inhibitor ASIS (30 nM). (c) Addition of CSE-EVs or control-EVs that were pre-treated with 10 µg/ml annexin V. (D) Addition of CSE-EVs and control-EVs that were pre-treated with annexin V in the presence of the TF inhibitor ASIS. The graphs show representative thrombin generation curves for four independent experiments. ASIS: active site inhibited factor VIIa; AnxV: annexin V; CSE: cigarette smoke extract; EV: extracellular vesicles; UCM: unconditioned medium isolate.
Besides TF, the phospholipid PS is known to contribute to the procoagulant effects of EVs [Citation22]. Therefore, we assessed whether the remaining difference in procoagulant potential between CSE-EVs and control-EVs during TF-pathway inhibition could be due to increased surface-exposed PS on CSE-EVs. Bead-based flow cytometry of conditioned media revealed that PS was increased on EVs captured by beads coated with a cocktail of antibodies against CD63, CD81 and CD9 or against each individual protein (). This was not purely due to increased EV release, as there was also increased PS signal for a standardized concentration of isolated CSE-EVs compared to control-EVs (). Additionally, PS-dependent thrombin generation was assessed by prothrombinase assay. For a standardized EV particle number, CSE-EVs resulted in significantly more thrombin generation than control-EVs, confirming their enrichment in PS. The difference between CSE-EVs and control-EVs could be attributed to PS, as PS blockage with annexin V substantially decreased the thrombin generation and equalized the effect of CSE-EVs and control-EVs (). By flow cytometry, we showed that the increased PS exposure of CSE-EVs was not paralleled by PS externalization of the secreting cells, as there was no increase in PS+ cells upon CSE exposure (). Finally, it was assessed to what extent PS accounts for EV-induced thrombin generation in normal human plasma. Annexin V treatment of EVs completely abolished thrombin induction by control-EVs and strongly decreased the thrombin generation by CSE-EVs (). When EVs were treated with Annexin-V and the TF inhibitor ASIS was added, thrombin generation was completely prevented for both control-EVs and CSE-EVs (). Thus, TF and PS together appear to account for a large proportion of thrombin generation in normal human plasma in response to control-EVs and CSE-induced EVs.
Discussion
The airway epithelium is constantly exposed to inhaled air, and airborne exposures modulate the behaviour of airway epithelial cells. We and others have recently shown that exposure to CSE stimulates airway epithelial cells to release EVs [Citation2,Citation5]. Here we extend this finding and present to our knowledge the first study which characterizes the proteomic composition of CSE-induced EVs and its functional implications. Using nano-LC-MS/MS, we demonstrated that CSE-EVs show a notable up-regulation of proteins involved in the pathway “haemostasis”, i.e. in stopping bleeding. One of these proteins was TF, and we confirmed a partly TF-dependent procoagulant effect for the CSE-EVs in vitro.
While no unique proteins were identified in either control-EVs or CSE-EVs, 33% of the proteins were differentially expressed between the two conditions. Functional enrichment analysis of the EV proteome for GO terms of the “cellular component” GO domain showed that the CSE-exposure caused an up-regulation of proteins of the “plasma membrane” and “cell surface”. This might imply that CSE exposure results in a shift from the release of endosomal-derived exosomes to plasma membrane-derived microvesicles. Alternatively, there may have been a specific sorting of cell surface proteins into the EVs rather than a shift in EV type. This is supported by the fact that the size distribution of control-EVs and CSE-EVs was similar, whereas a shift towards microvesicle release would most likely be associated with an increase in the EV diameter. Concerning the GO domain “molecular function”, CSE-EVs were enriched in proteins with “GTPase activity” and “receptor activity”, in line with an involvement in cell signalling. Congruently, there was an up-regulation of the biological processes “immune response”, “cell communication” and “signal transduction”. While we have not performed a functional evaluation of these enriched biological processes, others have previously proposed an involvement of CSE-induced airway epithelial-derived EVs in cell-to-cell communication. In particular, cells that were stimulated with CSE-EVs were shown to undergo pro-inflammatory and pro-fibrotic changes [Citation2,Citation23].
Functional enrichment analysis for manually curated biological pathways revealed that “haemostasis” and “platelet activation, signalling and aggregation” were strikingly up-regulated in the CSE-induced EVs, suggesting an involvement in thrombus formation. When added to human plasma, CSE-EVs caused faster and more thrombin generation than control-EVs, confirming enrichment in procoagulant factors. This effect could be partly attributed to EV-associated TF and to the procoagulant phospholipid PS. Concomitant inhibition of both, TF and PS, completely abolished CSE-EV-induced thrombin generation.
It is well known that smokers have an elevated risk of thrombotic cardiovascular diseases [Citation24] and that circulating EVs can contribute to hypercoagulability and thrombotic disease via expression of TF and PS [Citation25]. Moreover, it has previously been shown that CSE can induce release of TF+ procoagulant EVs from monocytes and macrophages [Citation3,Citation10]. Our study adds that also airway epithelial cells respond to CSE by releasing TF+ procoagulant EVs and that, besides TF+, a number of other EV-associated prothrombotic proteins are up-regulated upon CSE exposure. Moreover, while EV-borne procoagulant activity is classically considered to be associated with microvesicles [Citation25], the procoagulant EVs in this study are small and enriched in tetraspanins, which suggests that they may be exosomes. This would imply that either functions of exosomes and microvesicles overlap or the EV populations as such overlap. A side-by-side evaluation of the exosome (small EV)- and microvesicle (larger EV)-associated TF release of CSE stimulated cells could help elucidate this issue.
One question that remains unanswered here is whether airway epithelial-derived procoagulant EVs actually enter the blood circulation and thus contribute to hypercoagulability in smokers. Although this seems plausible because smoking impairs the function of the epithelial–endothelial barrier in the lungs [Citation26,Citation27], there are still no clear data on the effect smoking on circulating TF+ EVs. While Baek et al. found an increase in TF+ (referred to as CD142) EVs in female smokers compared to non-smokers [Citation28], Badrnya et al. did not detect any significant changes in circulating TF+ EVs between young healthy smokers and non-smokers [Citation29]. Yet, TF+ EVs may also have local effects in the lungs. Intriguingly, elevated concentrations of TF+ EVs have been detected in the lungs of patients with several lung diseases, including asthma, acute respiratory distress syndrome (ARDS) and interstitial lung disease [Citation30–Citation34]. Moreover, TF is secreted by airway and alveolar epithelial cells in an EV-associated form in response to mechanical stress, pro-inflammatory mediators or oxidants [Citation30–Citation32]. Besides its prominent role in coagulation, TF also exerts alternative functions, such as regulating inflammatory responses and promoting angiogenesis and wound repair [Citation35–Citation39]. To date, these alternative functions are relatively poorly explored. It is thus promising to investigate whether TF+ EVs contribute to tissue remodelling in chronic lung diseases. Importantly, there is a high rate of comorbidity of the smoking-associated chronic lung disease COPD and cardiovascular disease [Citation40]. In vivo and clinical studies are warranted to investigate whether this can be explained by an increased production of TF+ EVs in response to cigarette smoking.
In conclusion, CSE-induced EVs from airway epithelial cells are – among others – enriched in proteins that are involved in cell communication, the immune response and haemostasis compared to control-EVs. An enhanced procoagulant effect of CSE-induced EVs was confirmed in vitro and shown to depend largely on EV-associated TF and PS. Increased production of procoagulant EVs in response to airway epithelial cell stress could be a mechanistic explanation for the high degree of comorbidity between chronic lung diseases and cardiovascular diseases.
Disclosure of interest
The authors report no conflicts of interest.
Supplemental Material
Download Zip (472.4 KB)Acknowledgments
The authors would like to thank Stefanie Geleen for the blood sampling and Diane Fens for performing the CAT measurements. They would also like to thank Carmen Lopez Iglesias for performing the cryo-TEM imaging of the EVs.
Supplemental material
Supplemental data for this article can be accessed here.
Additional information
Funding
Related Research Data
References
- GBD 2015 Tobacco Collaborators. Smoking prevalence and attributable disease burden in 195 countries and territories, 1990–2015: a systematic analysis from the global burden of disease study 2015. Lancet. 2017;389(10082): 1885–16.
- Moon HG, Kim S-H, Gao J, et al. CCN1 secretion and cleavage regulate the lung epithelial cell functions after cigarette smoke. Am J Physiol Lung Cell Mol Physiol. 2014;307(4):L326–L337.
- Cordazzo C, Petrini S, Neri T, et al. Rapid shedding of proinflammatory microparticles by human mononuclear cells exposed to cigarette smoke is dependent on Ca2+ mobilization. Inflamm Res. 2014;63(7):539–547.
- Serban KA, Rezania S, Petrusca DN, et al. Structural and functional characterization of endothelial microparticles released by cigarette smoke. Sci Rep. 2016;6:31596.
- Benedikter BJ, Benedikter BJ, Volgers C, et al. Cigarette smoke extract induced exosome release is mediated by depletion of exofacial thiols and can be inhibited by thiol-antioxidants. Free Radic Biol Med. 2017. DOI:10.1016/j.freeradbiomed.2017.03.026
- Gordon C, Gudi K, Krause A, et al. Circulating endothelial microparticles as a measure of early lung destruction in cigarette smokers. Am J Respir Crit Care Med. 2011;184(2):224–232.
- Mobarrez F, Antoniewicz L, Bosson JA, et al. The effects of smoking on levels of endothelial progenitor cells and microparticles in the blood of healthy volunteers. PLoS One. 2014;9(2):e90314.
- Yanez-Mo M, Siljander PR, Andreu Z, et al. Biological properties of extracellular vesicles and their physiological functions. J Extracell Vesicles. 2015;4:27066.
- Li CJ, Liu Y, Chen Y, et al. Novel proteolytic microvesicles released from human macrophages after exposure to tobacco smoke. Am J Pathol. 2013;182(5):1552–1562.
- Li M, Yu D, Williams KJ, et al. Tobacco smoke induces the generation of procoagulant microvesicles from human monocytes/macrophages. Arterioscler Thromb Vasc Biol. 2010;30(9):1818–1824.
- Tripisciano C, Weiss R, Eichhorn T, et al. Different potential of extracellular vesicles to support thrombin generation: contributions of phosphatidylserine, tissue factor, and cellular origin. Sci Rep. 2017;7(1):6522.
- Tkach M, Kowal J, Thery C. Why the need and how to approach the functional diversity of extracellular vesicles. Philos Trans R Soc Lond B Biol Sci. 2018;373:1737.
- Benedikter BJ, Bouwman FG, Vajen T, et al. Ultrafiltration combined with size exclusion chromatography efficiently isolates extracellular vesicles from cell culture media for compositional and functional studies. Sci Rep. 2017;7(1):15297.
- Van Deun J, Mestdagh P, Agostinis P, et al. EV-TRACK: transparent reporting and centralizing knowledge in extracellular vesicle research. Nat Methods. 2017;14(3):228–232.
- Grottke O, Rossaint R, Henskens Y, et al. Thrombin generation capacity of prothrombin complex concentrate in an in vitro dilutional model. PLoS One. 2013;8(5):e64100.
- Borissoff JI, Heeneman S, Kilinç E, et al. Early atherosclerosis exhibits an enhanced procoagulant state. Circulation. 2010;122(8):821–830.
- Dielis AW, Castoldi E, Spronk HMH, et al. Coagulation factors and the protein C system as determinants of thrombin generation in a normal population. J Thromb Haemost. 2008;6(1):125–131.
- Kammers K, Cole RN, Tiengwe C, et al. Detecting significant changes in protein abundance. EuPA Open Proteom. 2015;7:11–19.
- Ritchie ME, Phipson B, Wu D, et al. limma powers differential expression analyses for RNA-sequencing and microarray studies. Nucleic Acids Res. 2015;43(7):e47.
- Storey JD, Tibshirani R. Statistical significance for genomewide studies. Proc Natl Acad Sci U S A. 2003;100(16):9440–9445.
- Pathan M, Keerthikumar S, Ang C-S, et al. FunRich: an open access standalone functional enrichment and interaction network analysis tool. Proteomics. 2015;15(15):2597–2601.
- Wang L, Bi Y, Cao M, et al. Microparticles and blood cells induce procoagulant activity via phosphatidylserine exposure in NSTEMI patients following stent implantation. Int J Cardiol. 2016;223:121–128.
- Fujita Y, Araya J, Ito S, et al. Suppression of autophagy by extracellular vesicles promotes myofibroblast differentiation in COPD pathogenesis. J Extracell Vesicles. 2015;4:28388.
- Ezzati M, Henley SJ, Thun MJ, et al. Role of smoking in global and regional cardiovascular mortality. Circulation. 2005;112(4):489–497.
- Owens AP 3rd, Mackman N. Microparticles in hemostasis and thrombosis. Circ Res. 2011;108(10):1284–1297.
- Lu Q, Sakhatskyy P, Grinnell K, et al. Cigarette smoke causes lung vascular barrier dysfunction via oxidative stress-mediated inhibition of RhoA and focal adhesion kinase. Am J Physiol Lung Cell Mol Physiol. 2011;301(6):L847–57.
- Aghapour M, Raee P, Moghaddam SJ, et al. Airway epithelial barrier dysfunction in COPD: role of cigarette smoke exposure. Am J Respir Cell Mol Biol. 2017. DOI:10.1165/rcmb.2017-0200TR.
- Baek R, Varming K, Jorgensen MM. Does smoking, age or gender affect the protein phenotype of extracellular vesicles in plasma? Transfus Apher Sci. 2016;55(1):44–52.
- Badrnya S, Baumgartner R, Assinger A. Smoking alters circulating plasma microvesicle pattern and microRNA signatures. Thromb Haemost. 2014;112(1):128–136.
- Novelli F, Neri T, Tavanti L, et al. Procoagulant, tissue factor-bearing microparticles in bronchoalveolar lavage of interstitial lung disease patients: an observational study. PLoS One. 2014;9(4):e95013.
- Park JA, Sharif AS, Tschumperlin DJ, et al. Tissue factor-bearing exosome secretion from human mechanically stimulated bronchial epithelial cells in vitro and in vivo. J Allergy Clin Immunol. 2012;130(6):1375–1383.
- Bastarache JA, Fremont RD, Kropski JA, et al. Procoagulant alveolar microparticles in the lungs of patients with acute respiratory distress syndrome. Am J Physiol Lung Cell Mol Physiol. 2009;297(6):L1035–41.
- Gabazza EC, Taguchi O, Tamaki S, et al. Thrombin in the airways of asthmatic patients. Lung. 1999;177(4):253–262.
- Brims FJ, Chauhan AJ, Higgins B, et al. Coagulation factors in the airways in moderate and severe asthma and the effect of inhaled steroids. Thorax. 2009;64(12):1037–1043.
- Ahmad S, Ahmad A, Rancourt RC, et al. Tissue factor signals airway epithelial basal cell survival via coagulation and protease-activated receptor isoforms 1 and 2. Am J Respir Cell Mol Biol. 2013;48(1):94–104.
- Chen J, Kasper M, Heck T, et al. Tissue factor as a link between wounding and tissue repair. Diabetes. 2005;54(7):2143–2154.
- Cimmino G, Ciccarelli G, Golino P. Role of tissue factor in the coagulation network. Semin Thromb Hemost. 2015;41(7):708–717.
- Giannarelli C, Alique M, Rodriguez DT, et al. Alternatively spliced tissue factor promotes plaque angiogenesis through the activation of hypoxia-inducible factor-1alpha and vascular endothelial growth factor signaling. Circulation. 2014;130(15):1274–1286.
- Witkowski M, Landmesser U, Rauch U. Tissue factor as a link between inflammation and coagulation. Trends Cardiovasc Med. 2016;26(4):297–303.
- Chen W, Thomas J, Sadatsafavi M, et al. Risk of cardiovascular comorbidity in patients with chronic obstructive pulmonary disease: a systematic review and meta-analysis. Lancet Respir Med. 2015;3(8):631–639.