
ABSTRACT
Extracellular vesicles (EVs) mediate targeted cellular interactions in normal and pathophysiological conditions and are increasingly recognised as potential biomarkers, therapeutic agents and drug delivery vehicles. Based on their size and biogenesis, EVs are classified as exosomes, microvesicles and apoptotic bodies. Due to overlapping size ranges and the lack of specific markers, these classes cannot yet be distinguished experimentally. Currently, it is a major challenge in the field to define robust and sensitive technological platforms being suitable to resolve EV heterogeneity, especially for small EVs (sEVs) with diameters below 200 nm, i.e. smaller microvesicles and exosomes. Most conventional flow cytometers are not suitable for the detection of particles being smaller than 300 nm, and the poor availability of defined reference materials hampers the validation of sEV analysis protocols. Following initial reports that imaging flow cytometry (IFCM) can be used for the characterisation of larger EVs, we aimed to investigate its usability for the characterisation of sEVs. This study set out to identify optimal sample preparation and instrument settings that would demonstrate the utility of this technology for the detection of single sEVs. By using CD63eGFP-labelled sEVs as a biological reference material, we were able to define and optimise IFCM acquisition and analysis parameters on an Amnis ImageStreamX MkII instrument for the detection of single sEVs. In addition, using antibody-labelling approaches, we show that IFCM facilitates robust detection of different EV and sEV subpopulations in isolated EVs, as well as unprocessed EV-containing samples. Our results indicate that fluorescently labelled sEVs as biological reference material are highly useful for the optimisation of fluorescence-based methods for sEV analysis. Finally, we propose that IFCM will help to significantly increase our ability to assess EV heterogeneity in a rigorous and reproducible manner, and facilitate the identification of specific subsets of sEVs as useful biomarkers in various diseases.
Introduction
During the last decade, the overall interest in extracellular vesicles (EVs) increased tremendously, especially in various biomedical research areas. A proportion of EVs are considered to mediate complex intercellular interactions in a targeted manner. They are released by almost all cell types and control a variety of different physiological and pathophysiological processes. Accordingly, they are increasingly used as biomarkers for various diseases, as drug delivery vehicles or as therapeutic agents [Citation1–Citation3].
However, the EV field is still young, and we have only started to unravel the biology and function of EVs, as well as their complexity. Currently, mainly three major subtypes of EVs are discriminated: Exosomes (~50–150 nm) are derivatives of the endosomal system, microvesicles (~100–1000 nm) bud off from the plasma membrane, and apoptotic bodies are membrane-surrounded vesicles from fragmented apoptotic cells with sizes up to several micrometres [Citation4]. Although EVs can be classified according to their origin, recent studies suggest a high degree of heterogeneity also within given EV classes [Citation5–Citation10]. Currently, it is a major aim of the field to set up and define methods in order to facilitate robust detection of such heterogeneity within given EV samples, especially in EV fractions containing EVs smaller than 200 nm (sEVs), which very likely are highly enriched for exosomes [Citation5,Citation8].
Progress of the EV research field in this context, however, is still hampered by the fact that most methods currently available for the analysis of small EVs (sEVs) are either very time consuming (e.g. electron microscopy), or can only quantify limited parameters (e.g. nanoparticle tracking analysis [NTA]), while other methods have a low accuracy or cannot be used to study single sEVs [Citation2,Citation11–Citation13]. This often leads to either slow or incomplete characterisation of sEV preparations and to a still rather limited understanding of sEV heterogeneity [Citation10,Citation14]. While NTA is probably the most commonly used single sEV analysis method [Citation15–Citation17], several new methods with higher sensitivity being generally suitable to analyse single sEVs have been introduced to the field for single sEV analysis (reviewed in [Citation18]). Several of these methods are based on flow cytometry.
The resolution of older conventional flow cytometers is generally not sufficient to detect particles being smaller than 300 nm; but in recent years few groups have started to optimise the setup of such instruments for the measurement of nano-sized particles and were able to analyse smaller-sized particles [Citation19,Citation20]. In addition, flow cytometric methods based on newer high-sensitivity flow cytometers have demonstrated a higher sensitivity and the conceptual potential of flow cytometry to facilitate multi-parametric single EV analysis [Citation20–Citation25] and sorting [Citation19,Citation26]. Potential pitfalls in EV flow cytometry such as coincidence, swarm detection and antibody- or lipoprotein-mediated background artefacts are frequently reported and discussed in the literature [Citation20,Citation27–Citation35]. However, it currently remains unclear which instrument or method can resolve individual true biological EVs from background or instrument noise (e.g. calcium and/or phosphate nanoparticles, precipitates, dust particles, aggregates) [Citation34,Citation36–Citation38]. Most methods currently being available either lack the sensitivity to robustly detect sEVs, or they lack validation and standardisation, which in turn hampers their widespread application.
To address the performance of flow cytometry instruments in a reliable manner, standard particles with comparable properties to EVs should be used. Currently, polystyrene and silicate beads of defined sizes are often used to set detection thresholds and to standardise flow cytometers for the detection of submicron particles like EVs [Citation39–Citation42]. While such beads as standards have certainly contributed to improvement and standardisation of flow cytometric methods for EV analysis, they still provide certain limitations as their physical properties will not reflect those of sEVs. This is particularly true with regard to the differences in the refractive index between polystyrene beads and sEVs, which translate to the intensity of scattered light. Several reported flow cytometry-based methods use fluorescence-based triggering for submicron particle detection for improved sensitivity and specificity, but most fluorescence calibration materials were produced for a brightness range more suitable for cellular analysis. Thus, there is a general consensus in the field that biological reference materials with more similar properties to sEVs should be developed and validated in order to facilitate robust validation and calibration of EV flow cytometry methods and instruments [Citation17,Citation31,Citation43,Citation44].
Imaging flow cytometry (IFCM) is a method combining flow cytometry with imaging, and all signals using IFCM are collected through microscope objectives and quantified based on images detected by charge coupled device (CCD) cameras. Pixels or areas on those images can in turn be visualised and respective signal intensities can be quantified individually. IFCM was previously reported to be suitable and sensitive enough to detect and enumerate subsets of blood-derived microparticles/microvesicles with diameters above 200 nm [Citation21,Citation45,Citation46]. Here, by using an Amnis ImageStreamX MkII (ISX) instrument, we aimed to explore, define and optimise IFCM for the detection of single EVs. To optimise parameters for single EV analysis, we used enhanced green fluorescent protein (eGFP)-labelled EVs released from the monocytic cell line THP-1 that was engineered to express the fusion protein CD63eGFP. This allowed us to improve various acquisition and analysis parameters on the ISX. Using these improved settings, we demonstrate that IFCM, in comparison to conventional flow cytometry, provides several advantages which facilitate single sEV analysis.
Material and methods
Cells and cell culture
Unless indicated otherwise, cells were cultured in the following conditions: THP-1 cells were cultured at densities of 0.5–2 × 10⁶ cells/mL in RPMI (containing Glutamax-I and sodium pyruvate) supplemented with 10% FBS (Biochrom) and 1× Penicillin/Streptomycin (ThermoFisher Scientific). HEK293T cells were cultured in DMEM (containing Glutamax-I and sodium pyruvate; 4.5 g/L Glucose; Invitrogen) supplemented with 10% FBS (Biochrom) and 1× Penicillin/Streptomycin (ThermoFisher Scientific). Primary human bone marrow–derived mesenchymal stromal cells (MSCs) raised from bone marrow (BM) samples were cultured in DMEM (containing Glutamax-I and sodium pyruvate; 1 g/L Glucose; Invitrogen) supplemented with 10% pooled human platelet lysate (hPL), 1× Penicillin/Streptomycin (ThermoFisher Scientific) and 0.1% Heparin, and were confirmed as bona fide MSCs as described previously [Citation47,Citation48]. All culture media were filtered through 0.22 µm filters before usage. BM samples were obtained from healthy donors at the University Hospital Essen, Germany following informed written consent according to the Declaration of Helsinki, and the experimental usage of BM samples was approved by the local ethics commission. All cells were regularly tested for the presence of mycoplasma.
Generation of stable CD63eGFP expressing cells
The THP-1:CD63eGFP stable cell line was generated by lentiviral-mediated gene transfer of human CD63 cDNA (GenBank accession number CR542096) fused to the N-terminus of eGFP. As described recently, a CD63eGFP encoding lentiviral plasmid (pCL6-CD63eGFP) was generated ()) [Citation49]. Lentiviral supernatants were produced as described previously [Citation50]. Briefly, HEK293T cells were co-transfected with the plasmids pCL6-CD63eGFP, pCD/NL-BH and pcoPE [Citation51–Citation53] using the transfection reagent JetPEI (Polyplus). Sixteen hour post transfection, gene expression from the human cytomegalovirus (CMV) immediate-early gene enhancer/promoter was induced with 10 mM sodium butyrate (Sigma Aldrich) for 6–8 h before fresh medium was added to the cells, and the supernatant was collected 20 h later. Viral particles were pelleted at 25,000 × g for 90 min at 4°C. The supernatant was discarded and the pellet was resuspended in 2 mL of Iscove’s Modified Dulbecco’s Media supplemented with 20% FBS and 1% P/S. Aliquots were stored at −80°C until usage. THP-1 cells were transduced by overnight exposure to virus stocks, passaged at least three times, and subsequently sort-purified based on high eGFP expression on a BD FACSAria IIIu cell sorter. The THP-1:eGFP control cell line was created accordingly for control purposes. The established cell lines were passaged at least 10 times before experiments were performed.
Isolation of sEVs
Prior to conditioned media (CM) harvest, THP-1 cells were seeded in regular FBS-supplemented culture medium as described above at a density of 0.5 × 10⁶ cells/mL and cultured for 48 h. MSCs were cultured in hPL-supplemented medium as described above to a confluency of 50% before fresh culture medium was added, and CM was harvested and replaced with fresh medium every 48 h until a confluency of 90% was reached. To generate MSC-derived CM without hPL components, MSCs were cultured in serum free media (Mesenchymal Stem Cell Basal Medium with Glutamine, without Phenol Red, Lonza) for 48 h. Unless indicated otherwise, CM samples of THP-1 cells (starting volume: 140 mL) were first pre-cleared from cells by centrifugation at 900 × g for 5 min at 10°C. Larger particles and debris were further removed by centrifugation of supernatants at 2,000 × g for 15 min at 4°C. Supernatants were next centrifuged at 10,000 × g for 45 min at 4°C to deplete bigger microvesicles and subsequently filtered through 0.22 µm filters with cellulose acetate membranes (Corning). All centrifugation steps up to this point were performed in an Eppendorf 5810R centrifuge, with an A-4–81 rotor. Filtrates were then subjected to ultracentrifugation in Ultra-Clear centrifuge tubes (Beckman Coulter) using a SW40 swing out rotor (Beckman Coulter) in a Beckman Coulter Optima L7-65 ultracentrifuge at 100,000 × g for 120 min at 4°C. EV pellets were resuspended in PBS, and a washing step was performed by ultracentrifugation at 100,000 × g for another 120 min ()). Pellets were carefully resuspended in a final volume of 1 mL PBS, aliquoted as 50 µL aliquots and either used directly or stored at −80°C until usage. Isolated sEV samples were characterised by western blot (data not shown), NTA and bead-based flow cytometry.
Usage of polystyrene beads for instrument comparison
A mix of commercial fluorescent polystyrene beads was used to cross-compare instruments, i.e. Megamix-Plus FSC and Megamix-Plus SSC beads (BioCytex) were mixed at a 1:1 ratio. This mix contained green fluorescent bead populations with sizes of 100, 300 and 900 nm from the Megamix-Plus FSC bead set, 160, 200 and 240 nm from the Megamix-Plus SSC bead set and 500 nm beads from both, creating a previously described Gigamix bead set with 7 defined and differently sized submicron bead populations [Citation36,Citation40,Citation54,Citation55]. For all instruments, different dilutions of Gigamix beads were tested after basic instrument start-up, and data on conventional flow cytometers was acquired with thresholds on SSC or fluorescence, and at low flow rates. Buffer controls were used to identify background signals for all instruments. Standard sheath fluid without further filtration was used in all measurements. Additional details are provided in .
Table 1. Acquisition parameters for Gigamix bead measurements with conventional flow cytometers.
Calculation of MESF values
Calculation of molecules of equivalent soluble fluorochrome (MESF) was performed as described previously [Citation46]. Briefly, FITC MESF beads (Quantibrite-FITC custom beads, lot MM2307-153, kindly provided by Majid Mehrpouyan, BD Biosciences) and PE MESF beads (BD Quantibrite Beads, PE Fluorescence Quantitation Kit, cat 340,495, lot 60,057) with known absolute FITC/PE fluorescence values for each peak from respective bead populations were measured. A linear regression analysis was performed of MESF units against the median fluorescence intensity (MFI). The resulting regression equation was then used to convert anti-CD63-PE stained CD63eGFP-labelled EV sample measurements into PE and FITC MESF values, respectively. FITC MESF values were converted to eGFP MESF equivalent values, based on a previously reported correction factor of 0.6 (i.e. FITC MESF units were multiplied by 1/correction factor) [Citation56,Citation57]. Scatter plots using MESF unit axes were created with FlowJo v 10.5.3 (FlowJo, LLC).
Multiplex bead-based flow cytometry analysis
To deplete debris and larger EVs, cell culture samples of THP-1:CD63eGFP and THP-1 cells were first pre-cleared from cells by centrifugation at 900 × g for 5 min at 10°C and subsequent centrifugation of supernatants at 2,000 × g for 15 min at 4°C as described above. Conditioned medium (CM) samples were then filtered through 0.22 µm filters and subjected to flow cytometric bead-based multiplex sEV analysis (MACSPlex Exosome Kit, human, Miltenyi Biotec) as described previously [Citation6,Citation8]. Briefly, 120 µL CM samples were loaded onto wells of a pre-wet and drained MACSPlex 96 well 0.22 µm filter plate before 15 µL of MACSPlex Exosome Capture Beads were added to each well. Filter plates were then incubated on an orbital shaker overnight at 450 rpm at room temperature. Beads were washed with 200 µL MACSPlex buffer and the liquid was removed applying vacuum (Sigma-Aldrich, Supelco PlatePrep; −100 mBar). For counterstaining of captured sEVs, a mixture of APC-conjugated anti-CD9, anti-CD63 and anti-CD81 detection antibodies (supplied in the MACSPlex kit, 5 µL each) were added to each well in a total volume of 135 µL and the plate was incubated at 450 rpm for 1 h at room temperature. Next, the samples were washed twice, resuspended in MACSPlex buffer and analysed by flow cytometry with a MACSQuant Analyzer 10 flow cytometer (Miltenyi Biotec). FlowJo software (version 10.5.3, FlowJo, LLC) was used to analyse flow cytometric data. Gates for identification of respective capture bead populations were adjusted where required to account for fluorescence shifts mediated by eGFP fluorescence of sEVs as reported previously [Citation8]. Median fluorescence intensities (MFI) for all 39 capture bead subsets were background-corrected by subtracting respective MFI values from matched non-EV containing media controls that were treated exactly like sEV-containing samples (medium + capture beads + antibodies).
Nanoparticle tracking analysis
Measurement of particle size and concentration in EV-containing samples by NTA was performed on the ZetaView platform (ParticleMetrix) equipped with a 488 nm laser. All samples were analysed at 25°C following daily instrument calibration according to the manufacturer’s recommendation. Samples were diluted in 0.9% NaCl to an appropriate concentration before analysis. Video acquisition was performed with fixed settings for all samples (scatter mode: sensitivity 85, shutter 75; fluorescence mode: sensitivity 95, shutter 32; both: minimum brightness 20, minimum size 5, and maximum size 200). Videos of all 11 positions were recorded for each sample with 5 cycles (1 cycle equals 1 s) at each position, and analysed with the ZetaView analysis software (Version 8.03.08.02).
Imaging flow cytometry
Unless indicated otherwise, all samples were analysed on an ImageStreamX MkII instrument (ISX; Amnis/MilliporeSigma) equipped with 5 lasers (70 mW 375 nm, 100 mW 488 nm, 200mW 561 nm, 150 mW 642 nm, 70 mW 785 nm (SSC), a 96-well autosampler and an EDF option. The ISX was equipped with three objectives, a 20× objective with a numerical aperture (NA) of 0.5 and a depth of field (DOF) of 8 µm, a 40× objective with an NA of 0.75 and a DOF of 4 µm, and a 60× objective with an NA of 0.9 and a DOF of 2.5 µm. Further details are provided in . All lasers were set to maximum powers, and unless indicated otherwise all data was acquired with 60× magnification, a 7 µm core size and low flow rate as described previously [Citation21,Citation45]. eGFP or FITC signals were collected in channel 2 (480–560 nm filter), PE signals in channel 3 (595–650 nm filter), and APC signals in channel 11 (660–745 nm filter). Channels 1 (430–480 nm filter) and 9 (570–595 nm filter) were used as brightfield channels and channel 6 (745–800 nm filter) for SSC detection. Standard sheath fluid (Dulbecco’s PBS pH 7.4, Gibco) without further filtration was used in all measurements. For experiments using fluorescence-conjugated antibodies to stain for sEV surface markers, antibodies were directly added to EV-containing samples as described in the respective Results sections and Figure legends. All antibodies were centrifuged for 10 min at 17,000 × g before they were applied to EV samples. The following antibodies were used: CD9-PE (Exbio, clone MEM-61), CD9-APC (Exbio, clone MEM-61), CD63-PE (Exbio, clone MEM-259), CD81-FITC (BioLegend, clone 5A6), CD81-APC (Beckman Coulter, clone JS64), IgG1-PE Isotype control (BD Biosciences, clone MOPC-21). All samples were diluted in PBS (Dulbecco’s PBS pH 7.4, Gibco) to appropriate dilutions in order to avoid coincidence or swarm detection. Controls included for all analyses of sEVs comprised detergent lysis controls, buffer controls without EVs and unstained samples for antibody stainings. For detergent lysis controls, samples were incubated for 30 min at room temperature after adding the non-ionic detergent Nonidet P-40 to a final concentration of 0.5% as described previously [Citation27,Citation38]. Data analysis was performed using Amnis IDEAS software (version 6.1). The image display mapping was linearly adjusted on representative fluorescent particle/sEV images for each channel and then applied to all files of the respective experiment. Gating strategies used are described in the Results section and Figure legends.
Table 2. Parameter details depending on ISX objective and acquisition speed settings applied.
Following data acquisition, different “masks”, defined as the algorithm which selects pixels within an image based on their intensity and localisation, were evaluated for their accuracy in EV analysis. The “masks combined” (MC) standard setting was used for initial experiments to quantify green fluorescence and SSC intensities for submicron particles (–; intensity feature combined with MC mask; Intensity_MC_Ch02/06). This MC mask setting applied by the IDEAS analysis software by default represents a Boolean OR logic of all 12 channel masks (M01-M12) according to the default masking algorithm. Since we observed that the default channel masking algorithm missed a substantial fraction of EVs due to their low fluorescence and scatter signals, an improved masking setting defined in was used to optimise the SSC resolution and efficacy of the detection of dim fluorescent single sEVs. In brief, the mask was created to circumvent the default MC mask and quantify the intensity of all pixels within an image by using a Boolean OR logic to combine all pixels in the MC mask and all pixels not in the MC mask (NMC), resulting in quantification of the intensity values of all pixels for all images that were triggered as an object (–; intensity feature combined with “NMC Or MC” mask, Intensity_MC Or NMC_Ch02/06). Further details are given in the Results section and . For discrimination of true single sEVs from coincident particles or swarm detection, we additionally combined the spot count feature with an intensity mask (details given in the Results section and legend of ). Further details regarding applied acquisition and analysis settings are described throughout the Results section and Figure legends.
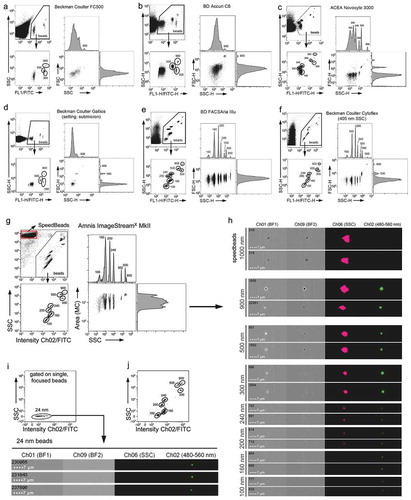
Figure 1. Imaging flow cytometry facilitates robust detection of fluorescent polystyrene beads below 100 nm. (a–f) Comparison of SSC and fluorescence resolution of fluorescent Gigamix beads with sizes between 100 and 900 nm. For all instruments, fluorescent bead identification (beads) is indicated in respective upper left plots showing background/instrument noise events. Data shown (a–f) was acquired with SSC triggering to show respective background/instrument noise. Different acquisition settings were evaluated for detection of fluorescent beads, including fluorescence triggering, which resulted in similar resolution for the fluorescent bead subsets (not shown). Acquisition settings applied are summarised in . All other plots are gated on single beads (gating step not shown). SSC versus fluorescence plots and FSC versus SSC plots with adjunct histograms indicate bead separation capabilities for (a) Beckman coulter FC500, (b) BD Accuri C6, (c) ACEA Novocyte 3000, (d) Beckman Coulter Gallios, (e) BD FACSAriaIIIu, (f) Beckman Coulter Cytoflex and (g) Amnis ImageStreamX MkII (ISX) instruments. Of note, the ISX automatically triggers on all channels simultaneously, and the separation of 500 from 900 nm beads appeared less clear with the ISX (g) because signals from particles with high SSC values get into saturation with laser powers set to maximum. (h) For all bead populations detected by the ISX, two representative examples including brightfield (BF) images of Channels (Ch) 1 and 9, Channel 6 SSC images, and fluorescence images of Channel 2 (480–560 nm bandpass filter) are shown. Internal 1,000 nm calibration SpeedBeads are included for reference. (i) 24 nm yellow-green polystyrene latex beads measured at the Amnis ImageStreamX MkII using the same acquisition settings as in (g). (j) The same data set of Gigamix beads as in (g) was plotted with biexponential axis scaling to allow comparison with the data presented in (i). Instrument parameters are summarised in .
Results
Imaging flow cytometry facilitates robust detection of fluorescent polystyrene beads below 100 nm
Since the Amnis ImageStreamX MkII (ISX) IFCM platform had been previously used to detect and quantify subpopulations of larger EVs [Citation21,Citation45], we wondered whether it would also be suitable for the analysis for sEVs, i.e. smaller microvesicles and exosomes below 200 nm in diameter, at the single vesicle level. As EV analyses at the single vesicle level require instruments that are able to recognise and discriminate fluorescent sub-micron particle subsets, we at first compared the performance of the ISX with that of conventional flow cytometry instruments in resolving a commercially available mixture of fluorescent polystyrene beads of defined sizes (Gigamix; 100, 160, 200, 240, 300, 500 and 900 nm) [Citation55]. In this comparison, we included in a non-representative approach a Beckman Coulter FC500, a BD Accuri C6, an ACEA Novocyte 3000, a Beckman Coulter Gallios, a BD FACSAriaIIIu and a Beckman Coulter Cytoflex (; ). Upon comparing the general capabilities of these instruments to resolve the different bead populations, on almost all instruments, in an expected manner, the scatter resolution was higher with the SSC than with the FSC (). From the six conventional instruments that were included in this comparison only the FACSAriaIIIu ()) and the Cytoflex ()) were able to clearly discriminate all seven fluorescent bead populations via the SSC and also facilitated the separation of 100 from 160 to 200 nm beads.
Next, we measured the same Gigamix beads on the Amnis ISX IFCM instrument, which does not measure conventional FSC; instead, sizes of larger particles are quantified according to detected signals in defined areas of their brightfield image. In the applied setting with all lasers being set to maximum power and the 785 nm laser being used for SSC, we observed a clear separation of all seven fluorescent bead populations between 100 and 900 nm from each other, from the non-fluorescent background, and from the 1 µm-sized SpeedBeads that are constantly running in the instrument flow stream for calibration and speed alignment between both CCD cameras (, ). Notably, brightfield images were only obtained for beads being larger than 240 nm ()). In contrast, SSC signals were still detectable for 240 and 200 nm beads, but were very low for 160 and 100 nm beads ()). Fluorescence signals were clearly visible as single, fluorescent dots in images from all Gigamix bead populations, also for 100 nm beads ()). Thus, from the seven instruments that were compared with the applied settings, the ISX, the FACSAriaIIIu and the Cytoflex allowed discrimination of even very small 100 and 160 nm fluorescent polystyrene beads. To challenge the detectability of even smaller particles in the ISX, we tested whether even smaller beads can be acquired. To this end, we analysed 24 nm yellow-green fluorescent polystyrene latex beads with the same instrument settings next and were able to specifically detect them in the respective fluorescence channel. As expected, they produced very low SSC signal ()). Thus, as long as respective fluorescence signals are bright enough to be detected, the ISX is able to detect polystyrene beads being smaller than the smallest EVs.
eGFP-labelled sEVs can be robustly detected above background signals by imaging flow cytometry
Polystyrene beads and sEVs or exosomes differ in their refractive indices, and fluorescent beads likely are labelled at higher fluorescence intensities compared to sEVs labelled with fluorescent probes like antibodies or fluorescent dyes. Accordingly, while polystyrene beads are a good tool to evaluate instrument sensitivity, they are not an ideal reference material to validate and standardise flow cytometric sEV analysis, and there is general consent in the field about the urgent need for biological calibration or reference materials for EV research [Citation39–Citation41,Citation54,Citation58,Citation59]. Some tetraspanins, CD63 in particular, have been qualified as EV or “exosome” markers [Citation60,Citation61]. Like endogenous CD63, we and others have recovered CD63eGFP fusion proteins in purified EV fractions of genetically engineered cells and used this strategy to fluorescently label sEVs for different experimental setups [Citation8,Citation49,Citation62,Citation63]. Consequently, we used a lentiviral plasmid encoding a CD63eGFP fusion protein ()) to create a stable THP-1 cell line expressing high levels of CD63eGFP ()). sEVs were harvested from supernatants of this cell line and from non-engineered THP-1 cells by a variant of the classical differential centrifugation protocol ()). To evaluate whether the general surface marker presentation of sEVs, derived from THP-1 and THP-1:CD63eGFP cells was changed due to their loading with CD63eGFP fusion proteins, semiquantitative flow cytometric multiplex bead-based assays were performed. Apart from higher CD63 levels being detected on engineered sEVs, which is attributed to the presence/absence of CD63eGFP, these analyses did not reveal any notable difference between EVs derived from THP-1 and THP-1:CD63eGFP cells ()). NTA analysis of the obtained sEVs revealed typical size distributions of around 130 nm in both THP-1 and THP-1:CD63eGFP sEV fractions and no major difference in their final concentration (scatter mode: THP-1: 4.1 × 10⁸/mL; THP-1:CD63eGFP: 3.38 × 10⁸/mL with 16.2% of events being detected as eGFP(+) in fluorescence mode; )). Thus, CD63eGFP expression does not alter the average particle size of obtained sEV fractions or changes sEV secretion notably. Of note, residual bovine EVs potentially derived from FBS in the THP-1 culture media could contribute to total particle counts in these NTA measurements but would not be detected in IFCM measurements shown in this study due to their lack of fluorescence. Considering that eGFP-labelled sEVs might provide a suitable tool for evaluating the sEV analysis performance between different instruments, we analysed THP-1:CD63eGFP derived sEVs with the Cytoflex and the ISX ()). On the Cytoflex, fluorescently labelled events were detected, without clear discrimination of the population from background noises ()). In contrast, the ISX recorded a population of SSC(low)eGFP(+) events that clearly was separated from the background noise ()), which was not detected following detergent lysis ()).
Figure 2. eGFP-labelled sEVs can be robustly detected above background signals by imaging flow cytometry. (a) Map of the pCL6-CD63eGFP plasmid [Citation49] used to generate the THP-1:CD63eGFP cell lines. The plasmid backbone is based on the lentiviral vector pCL6-IEGwo [Citation79] (CMV; CMV promoter; SD, splice donor; LTR, long terminal repeat; SA, splice acceptor; RRE, Rev responsive element; cPPT, central polypurine binding tract; SFFV U3, U3 promoter of the spleen focus forming virus; WPRO, woodchuck hepatitis virus post-transcriptional regulatory element optimised). (b) Flow-cytometric analyses of eGFP expression in THP-1 control and THP-1:CD63eGFP cell lines. (c) Schematic outline of sEV isolation protocol used. (d) Analysis of sEV surface signatures in 0.22 µm filtered conditioned medium from control and THP-1:CD63eGFP cells by multiplex bead-based flow cytometry using a mixture of anti-CD9, anti-CD63 and anti-CD81 detection antibodies. Background-subtracted median fluorescence APC intensity values are shown. Numbers next to the CD63 bar indicate values obtained for CD63 capture bead subsets. (e) Size distribution as measured by NTA of small EVs (sEVs) derived from control and CD63eGFP expressing cell lines. (f) Flow-cytometric analysis of CD63eGFP sEVs with the Cytoflex (triggered on VSSC with the threshold set to 2,000, otherwise the same acquisition parameters as in were applied) and the ISX instruments compared to buffer controls. To improve comparability between both instruments, both datasets are plotted with log and biexponential axis scaling. Indicated eGFP(+) sEV concentrations were determined volumetrically. Representative example image sets derived from ISX analysis are shown below. (g) Dotplots of the same THP-1:CD63eGFP-derived sEV sample before and after detergent lysis (30 min, 0.5% NP-40 buffer). The figure shows one out of at least two individual sets of experiments with comparable outcome.
![Figure 2. eGFP-labelled sEVs can be robustly detected above background signals by imaging flow cytometry. (a) Map of the pCL6-CD63eGFP plasmid [Citation49] used to generate the THP-1:CD63eGFP cell lines. The plasmid backbone is based on the lentiviral vector pCL6-IEGwo [Citation79] (CMV; CMV promoter; SD, splice donor; LTR, long terminal repeat; SA, splice acceptor; RRE, Rev responsive element; cPPT, central polypurine binding tract; SFFV U3, U3 promoter of the spleen focus forming virus; WPRO, woodchuck hepatitis virus post-transcriptional regulatory element optimised). (b) Flow-cytometric analyses of eGFP expression in THP-1 control and THP-1:CD63eGFP cell lines. (c) Schematic outline of sEV isolation protocol used. (d) Analysis of sEV surface signatures in 0.22 µm filtered conditioned medium from control and THP-1:CD63eGFP cells by multiplex bead-based flow cytometry using a mixture of anti-CD9, anti-CD63 and anti-CD81 detection antibodies. Background-subtracted median fluorescence APC intensity values are shown. Numbers next to the CD63 bar indicate values obtained for CD63 capture bead subsets. (e) Size distribution as measured by NTA of small EVs (sEVs) derived from control and CD63eGFP expressing cell lines. (f) Flow-cytometric analysis of CD63eGFP sEVs with the Cytoflex (triggered on VSSC with the threshold set to 2,000, otherwise the same acquisition parameters as in Table 1 were applied) and the ISX instruments compared to buffer controls. To improve comparability between both instruments, both datasets are plotted with log and biexponential axis scaling. Indicated eGFP(+) sEV concentrations were determined volumetrically. Representative example image sets derived from ISX analysis are shown below. (g) Dotplots of the same THP-1:CD63eGFP-derived sEV sample before and after detergent lysis (30 min, 0.5% NP-40 buffer). The figure shows one out of at least two individual sets of experiments with comparable outcome.](/cms/asset/44bf94d4-0572-4679-aa41-5b2b1f667971/zjev_a_1587567_f0002_oc.jpg)
Based on concentrations of events being detected and gated as eGFP(+) with both instruments (Cytoflex: 1.93 × 10⁷/mL; ISX: 3.51 × 10⁷/mL; )), and comparing these values to the concentration of fluorescent particles estimated by NTA (5.4 × 10⁷ mL; )), the calculated detection efficiency for CD63eGFP labelled sEVs would be ~66% for the ISX and ~36% for the Cytoflex. However, we have experienced that due to fluorescence bleaching over time fluorescence-based NTA measurements can lead to highly variable results and thus obtained values are not considered to be very precise. Very likely related to the bleaching issue and to instrument specific peculiarities, calculated detection efficiencies varied among ISX and NTA also in experiments using other fluorescently labelled sEVs (data not shown). In addition, accurate, unbiased comparison of instrument detection efficiencies would require concentration standards, and instrument configuration and acquisition settings for all instruments probably can be further optimised for sEV analyses. Thus, the data presented herein cannot provide final conclusions about the performance or limitations of an instrument model. However, the data presented here demonstrates that CD63eGFP-labelled sEVs can be used for future studies aiming to comprehensively compare performances of different sEV analysis instruments. Here, our results indicate that the ISX has a sufficient sensitivity to detect fluorescently labelled sEVs at the individual particle level.
Evaluation of acquisition parameters in imaging flow cytometry by using CD63eGFP sEVs as biological reference material
To further optimise sEV detection by IFCM, we continued to use THP-1:CD63eGFP-sEVs and compared the impact of different acquisition parameter settings on the analysis results. First, we compared the three different microscopic objectives installed in the ISX and measured the same sample at the three different magnifications ()). While the internal 1 µm SpeedBeads could be detected with all magnifications, the scatter sensitivity and the detection of SSC(low)eGFP(+) events was found to be dependent of the objective used. Compared to the 60× option, which was used in all previous experiments, the usage of the 40× objective resulted in a 6–7 fold reduction of detected SSC(low)eGFP(+) events. Upon using the 20× objective, barely any SSC(low)eGFP(+) events were detected above background ()). Thus, the magnification being applied for sEV analysis is a critical parameter determining the resolution of respective analyses. Consequently, all subsequent measurements were performed with 60× objectives.
Figure 3. Evaluation of acquisition parameters in Imaging Flow Cytometry by using CD63eGFP sEVs as biological reference material. THP-1:CD63eGFP derived sEV preparations isolated via differential ultracentrifugation as described in were used to compare (a) different objectives, (b) activated versus non activated “Remove beads” option, (c) EDF option, and (d) different measurement speeds that can be set during sample acquisition with all samples being measured for the same time. All plots shown derive from the same THP-1:CD63eGFP sEV preparation, quantification shows mean ± SD for three independent experiments (SB: SpeedBeads). Further related details are summarised in .
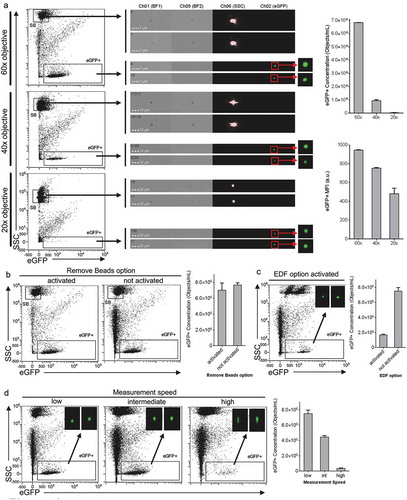
The INSPIRE acquisition software for the ISX has a feature called “remove beads”, which by default is activated to remove most of the internal 1 µm SpeedBeads from acquired data. This has no relevant influence on cellular analysis data, i.e. with settings where the SSC laser is set at much lower power [Citation64]. Beads in the context of this “remove beads” option are defined as small non-fluorescent events, i.e. for an object to be considered a bead, its brightfield area value must be less than 30, and the intensity in all fluorescent channels must be zero. This setting, however, does not result in actual removal of the SpeedBeads with all lasers (including the SSC laser) set to maximum. Thus, it could affect the acquisition of the non-fluorescent SSC(low) events in experiments that are intended to analyse EVs not being fluorescently labelled. When analysing CD63eGFP sEV samples with deactivated “remove beads”, we observed an approximately 2-fold increase in total events and a minor increase in SSC(low)eGFP(+) events being recorded ()). This indicates that a relevant proportion of non-fluorescent SSC(low) particles is not recorded when the “remove beads” option is activated, however most fluorescent SSC(low) particles are still detected with this setting.
In addition, we tested the influence of the extended depth of field (EDF) option that for cellular analyses is used to reduce eliminate out-of-focus fluorescence from other optical layers by projecting fluorescence across the DOF onto the same plane using deconvolution. When using EDF approximately 4-fold less SSC(low)eGFP(+) events were detected and recorded than without using EDF. Thus, using EDF is not recommended ()).
The time required to run samples when using the ISX is generally higher when compared to conventional flow cytometers, and by default the flow rate is set to “low” which results in a volumetric flow rate of ~0.38 µL/min when using the 60× objective (). While the low flow rate contributes to higher sensitivity, in general, measuring at higher flow rates might be indicated especially if high numbers of samples should be analysed. Thus, we compared the default “low” flow rate to the “intermediate” and “high” settings, next. Using the intermediate setting resulted in slightly elongated images of SSC(low)eGFP(+) events and an approx. 2-fold lower event recovery, while the high setting resulted in clearly elongated images and a drastically reduced detection of events ()). Of note, signals are binned on the pixel rows of the camera when using intermediate or high flow rates at 60× magnification, resulting in elongated images. In contrast, pixels are not binned at low flow rates (). More importantly, the reduced dwell time of particles in the laser beam at higher speeds results in less light collection and consequently decreased sensitivity. This shows that if high sensitivity detection and quantification is needed, samples should always be run with the “low flow rate” setting applied. Consequently, all further samples in this study were acquired with the 60× objective, deactivated remove beads and EDF options, and at low flow rate.
Optimisation of event masking improves both SSC resolution and fluorescence detection
There is a major difference between IFCM and conventional flow cytometers; light signals, i.e. photons of a given wavelength, in conventional instruments are collectively recorded at photomultipliers or photodiodes, while in IFCM images are projected to an area of a time delay integration (TDI) CCD camera, which is designed to allow high sensitivity imaging of objects in flow [Citation65]. Upon integrating the pixel intensity, comparable signals are obtained as on conventional instruments. Thus, on IFCMs for each recorded event signals are obtained as in conventional flow cytometry plus images for each recorded channel. When using imaging processing software, IDEAS on the ISX, additional information about the recorded events can be obtained. There are several masking options in IDEAS allowing customised image analysis for quantification of subtle morphological details.
IDEAS software generates default channel masks for all channels to mask pixels, where the signal meets the default mask algorithm chosen. Most simply this is any signal for any fluorescence or scatter channel that is detected above the background threshold. By default this is optimised for the analysis of cells, with the aim to include all pixels of a cell image in the brightfield channel, and corresponding fluorescence signals in respective fluorescence channels in the same image area. The “mask combined”, or MC, is a mask merged from all channel masks for all channels. When using this default setting with THP-1:CD63eGFP sEV samples, however, we observed events that were not masked correctly. Few (<1%) SSC(low)eGFP(−) events showed clear eGFP signals in Channel 2, and more frequently SSC(low)eGFP(−) events showed clearly visible and non-round signals in Channel 6 ()). Thus, several events are classified inaccurately as being eGFP(−) or SSC(low), respectively. In both cases, when the pixels were not masked properly, respective signals were not quantified. This let us conclude that the default MC masking applied from the software to define the image area used for quantifying signal intensities is not optimal for sEV analysis due to the low signal generated by these particles. We therefore tested different other masking options and defined an improved masking setting that resulted in correct quantification of pixel values for all events ()). Subsequently, all SSC(low)eGFP(+) events could be gated properly without any notable decrease in overall resolution or fluorescence intensity of the population. The vast majority of SSC(low)eGFP(−) events showed a huge 2–3 log increase in SSC resolution with the improved settings (–).
Figure 4. Optimisation of event masking improves both SSC resolution and fluorescence detection. (a) Examples for two improperly masked events when gating on SSC(low)eGFP(−) events. Event 41,565 shows no visible signals and is classified properly. Event 41,968 shows an event with non-masked eGFP(+) pixels, 51,533 shows a non-masked, artefact-like SSC signal. Image display mapping was increased compared to other images shown to make the respective signals clearly visible. (b) Comparison of standard/default masking (Intensity_MC) and improved masking (Intensity_MC Or NMC), showing a clearly higher resolution in terms of SSC signals when using the improved masking. Of note, masking strongly affects the appearance of plots. The same events with different masking settings applied are shown in plots 1 and 2, and in plots 3 and 4, respectively. (c) Dotplots with arrows indicating the assignment of the three events from (a) when using standard and improved mask definitions. (d) Comparison of MC versus MC or NMC mask definitions (masks in grey) applied for events 41,968 and 51,533. All measurements were performed with THP-1:CD63eGFP derived sEVs prepared as described in .
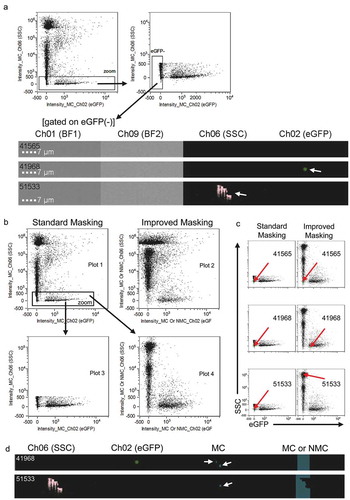
The reason for events not being masked properly by channel masks and subsequent MC might be the low signal to noise ratio between positive pixels and background, which in contrast to cells might be too low for the software to correctly interpret the recorded data. In case of sEV analysis, this could severely influence the masking of slightly unfocused or eGFP(+) events with low fluorescence intensity, and also low-contrast background/artefacts of eGFP negative particles. For the improved masking setup, we here used a combined “MC or NMC” (NMC = “non mask combined”) mask definition. NMC is defined as all pixels not included in the MC, which is normally only useful for background determination. In this setting, however, it forces the software to quantify all pixels on the whole image without even trying to mask any image area for signals from individual particles ()). In the case of the mis-masked SSC images, however, this still did not result in a complete coverage of the whole image in all cases, with unmasked pixels likely to be part of another object ()).
In summary, setting up the analysis software to quantify pixel intensities in the whole image and not in a specifically masked area appears preferential to ensure that all pixels containing signals from all events are quantified properly. Thus, the mask setting combining “MC or NMC”, which basically is a similar type of signal quantification as in conventional flow cytometry, should be applied when EVs are analysed with the ISX. We have applied this mask setting for all further experiments of this study.
Imaging flow cytometry can discriminate between single and coincidence of EVs
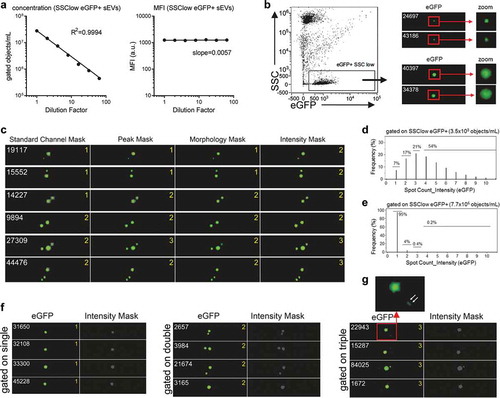
In flow cytometric measurements above a certain particle concentration, it is unavoidable that certain events being recorded are actually derived from the simultaneous detection of two or more particles being in close proximity. In conventional cellular flow cytometric analysis, this coincidence can be easily identified through different scatter parameters, and in cellular IFCM analysis through the quantification of imaging-based parameters. For single EV analyses, however, especially if multi-colour experiments are intended, event coincidence or swarm detection can lead to false-positive detection of events and should be avoided for reliable measurements [Citation29,Citation32,Citation66]. For now, due to their small size, sEV coincidence cannot be identified through scatter-based parameters. This potential pitfall for sEV analysis is generally addressed by the use of low acquisition rates, serial dilution of samples and comparison of detected events with the signal intensity at different dilutions [Citation19,Citation20,Citation27,Citation67]. Here, we aimed to set up analysis settings for reliable detection of any coincidence and first measured THP1:CD63eGFP derived EVs in a serial dilution experiment. Within a range of ~2 × 10⁶ and ~3 × 10⁷ SSC(low)eGFP(+) measured sEVs/mL we observed a linear decrease with higher diluted samples while mean fluorescence intensity values remained stable ()). This suggests that within this concentration range mostly single sEVs were detected. Next, we aimed to explore options and validate settings to detect any coincidence that might occur. For correct coincidence detection proper masking of all events recorded in a single image is required even if some SSC(low)eGFP(+) sEVs appear smaller and/or fainter than others ()). Of note, a larger/brighter appearing fluorescent spot covering more pixels in the image does not necessarily translate to a larger sEV, but could reflect a higher brightness or slight defocus of this specific event due to the narrow focal plane of the objective at 60× magnification ()). In order to test different mask settings that could be suitable for exact detection of fluorescent events in IFCM event images, we applied different masking strategies. We selected visually identified events showing coincidence of SSC(low)eGFP(+) sEV events and combined the IDEAS spot count feature with different masks, i.e. the standard channel mask and the peak, morphology and intensity mask with different settings ()). Even though most mask settings tested resulted in correct SSC(low)eGFP(+) spot quantification for some of the events tested, only the intensity mask setting combined with the spot count feature allowed reliable quantification of the number of coincidentally recorded sEVs in all cases ()). Here, we applied an intensity range just above background pixel intensity values masking all pixels above an intensity of 14 for channel 2 (spot count_intensity 14-4095). To validate this setting, we acquired differently concentrated samples. We observed high frequencies of coincidence (>90%) for SSC(low)eGFP(+) sEV concentrations above 1 × 10⁸/mL ()), while the frequency of events detected with more than one spot at a concentration of 7.7 × 10⁶ SSC(low)eGFP(+) sEVs, i.e. within the linear range, was below 5% ()). Results were cross-validated by gating on events assigned to a certain spot count value, and we visually confirmed the number of respective spots for each event image ()). With the optimised masking strategy applied, even very faint and small fluorescent events being very close to each other were correctly quantified ()).
Figure 5. Imaging Flow Cytometry facilitates discrimination between single and coincident sEVs. (a) Serial dilution experiment showing measured linear concentration values of SSC(low)eGFP(+) sEVs for 2-fold dilutions without notable changes in measured mean fluorescence intensities (MFI) for this population. (b) Visualisation of single, fluorescent spots appearing differently in terms of brightness and size/pixel coverage within the SSC(low)eGFP(+) sEV population. (c) Application of different masking settings combined with the spot count feature on selected events showing sEV coincidence in order to evaluate their suitability for coincidence detection. Yellow digits indicate the number of events as calculated by the spot count feature depending on the masking setting applied. The intensity mask (intensity 14-4095) was the only one correctly masking all fluorescent spots in all images. (d, e) Plotted values using the spot count feature combined with the intensity mask on samples acquired at a concentration of 3.5 × 10⁸ (d) and at 7.7 × 10⁶ SSC(low)eGFP(+) events/mL (e), respectively. (f) Events gated on spots classified as single, double or triple based on spot count values from plots as shown in (d, e). (g) Enlarged image of event 22,943 demonstrating that also faint spots being very close to each other are counted correctly as distinct spots/sEVs. All measurements were performed with THP-1:CD63eGFP derived sEVs prepared as described in .
In conclusion, we have defined an appropriate masking strategy that in combination with the spot count feature facilitates identification and exclusion of coincidence sEV detection. Consequently, all subsequent experiments were acquired at a maximum concentration of 1 × 10⁷ SSC(low)eGFP(+) sEVs per mL and monitored for the occurrence of coincidence or swarm detection.
Imaging flow cytometry allows simultaneous detection of single EVs and cells in unprocessed samples
After having optimised different acquisition and analysis parameters, we explored whether CD63eGFP-labelled sEVs also can be detected in unprocessed samples. Thus, we measured cell culture samples from suspension THP-1:CD63eGFP cells with the ISX directly ()). For control purposes, we performed the same measurements with cell culture samples of eGFP-expressing (THP-1:eGFP) and normal THP-1 cells (–).
Figure 6. Imaging flow cytometry facilitates single EV detection and alongside with cells in unprocessed samples. (a) IFCM analysis with dotplots and example event images gated on respective regions R1-R5 of complete suspension cultures derived from (a) THP-1:CD63eGFP cells. (b) Measured concentrations of gated populations in (a) and ratios expressed as percentages of total events gated within R1-R5. Measurements of unprocessed samples of suspension cultures from (c) THP-1:eGFP cells, and (d) unmanipulated THP-1 cells are shown for comparison. The data presented shows one out of three independently performed experiments with comparable outcome.
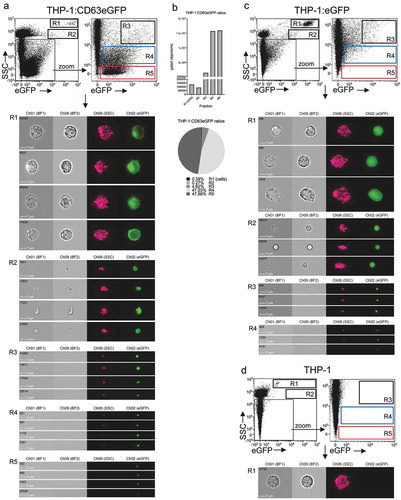
Cells were identified in all cell culture samples (gate R1), with SSC values being higher than those of the 1 µm SpeedBeads (, , ). Relatively large and mostly round, fluorescent events with SSC values similar to the SpeedBeads were recorded as SSC(bright)eGFP(+) events in both THP-1:CD63eGFP and THP-1:eGFP derived samples (, ; R2), probably corresponding to cellular fragments, apoptotic bodies or larger microvesicles.
eGFP(+) events with intermediate to low scatter values were also detected in both THP-1:CD63eGFP and THP-1:eGFP derived samples. Based on their brightfield signals and SSC values they could be distinguished as three subsets: Events with clear brightfield and SSC signals (, ; R3) and events with low/no brightfield and lower but clearly visible SSC signals (, ; R4) were detected in both THP-1:CD63eGFP and THP-1:eGFP derived samples. Events of the SSC(low)eGFP(+) population with no visible brightfield and no/very low SSC signals as described above, however, were exclusively detected in THP-1:CD63eGFP derived samples and were most prevalent when comparing the frequency of gated events to all other fractions (–; R5).
In summary, this data demonstrates that different EV populations can be detected according to their light scattering properties and fluorescence intensities together with cells in the same sample. To study the nature of these identified eGFP(+) EV populations, we decided to study their presence in samples being processed by differential centrifugation, next.
Evaluation and monitoring of sEV isolation protocols
To investigate differences in the ratio of the different EV subpopulations identified above during sEV enrichment, we next fractionated cell culture-derived samples from THP-1:CD63eGFP, THP-1:eGFP and THP-1 cells via differential centrifugation ()). First, unfractionated samples were analysed, exactly as described above (). Next, samples were subjected to a low-speed centrifugation (900 × g) step considered to remove cells (data not shown). Following the subsequent 2,000 × g centrifugation step, SSC(bright)eGFP(+) events and cells were reduced (, ; R1/R2), supporting the assumption that events in gate R2 relate to larger membrane fragments, debris and/or apoptotic bodies. Next, we performed a 10,000 × g centrifugation step, often referred to as a method to remove larger microvesicles. We observed a clear reduction in fluorescent events with intermediate to low SSC values (, ; R3/R4). Following the subsequent 0.22 µm filtration, the samples were devoid of almost all fluorescent events in R3 and R4, indicating that corresponding EVs have indeed a larger diameter. In contrast, in processed samples derived from THP-1:CD63eGFP but not from THP-1:eGFP and THP-1 cells most SSC(low)eGFP(+) events in R5 were recovered (, , ). Following ultracentrifugation with subsequent resuspension of the pellet, fluorescent events derived from processed THP-1:CD63eGFP-derived samples still predominantly were recovered in gate R5. This implies that CD63eGFP expression in producer cells indeed allows labelling of sEVs, such as exosomes, and that sEVs are specifically grouped in gate R5 (, ; R5).
Figure 7. Evaluation and monitoring of an sEV isolation protocol. (a) All fractions of an sEV isolation procedure were analysed via IFCM, starting with total THP-1:CD63eGFP suspension cultures. Dotplots show all events, and a zoom gate was applied to improve visualisation of proposed submicron eGFP(+) EV populations. (b) Respective plots showing the presence of SSC(low)eGFP(+) sEVs after 0.22 µm filtration for THP-1:CD63eGFP derived samples and the absence of such events for THP-1:eGFP and THP-1 control cell line derived samples. (c) Representative images for R6, with image display mapping being adjusted for Ch02 to visualise faint eGFP signals. (d) Quantification of the frequency of eGFP(+) events in R1-R5 relative to all eGFP(+) events as gated in (b). (e, f) Quantification of the recovery (e) and the MFI (F) for SSC(low)eGFP(+) events in R5 throughout the isolation procedure. One out of two individual experiments with comparable outcome is shown.
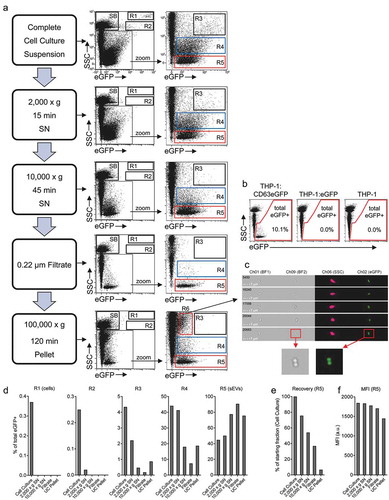
Since the ISX analysis allows quantification of the absolute concentration of respective events per sample volume, ratios of each of the gated groups to all recorded events can be calculated. The experiment being performed demonstrates that with the exception of the final ultracentrifugation step the ratio of sEV events in gate R5 during the differential centrifuge procedure increases, while other fractions are largely depleted during processing ()). Upon comparing the quantity of events in gate R5 between the different purification steps, a gradual loss of events can be observed, remarkably strong in the final ultracentrifugation step ()). A similar observation was made in a recent study using IFCM to compare sEV isolation methods [Citation68]. Notably, this loss in R5 events coincides with an increase of events in gates R3 and R4 ()). While this observation in part might be explained by aggregate formation of incompletely resuspended pellets, the reduction of eGFP fluorescence intensity ()) to our understanding rather implies that a proportion of sEVs were damaged by ultracentrifugation as indicated by previous studies [Citation38,Citation69–Citation72].
In summary, the IFCM platform can provide high-resolution information about obtained EV fractions and should be suitable to critically analyse and optimise sEV isolation procedures in future more comprehensive studies.
IFCM facilitates the detection of antibody-stained sEVs
In order to fully understand how heterogeneous sEV-containing samples are and to identify phenotypic subsets of sEVs, the establishment of multicolour analysis protocols based on the use of different fluorochrome-labelled antibodies against sEV surface markers will be crucial. However, it remains unclear how such staining protocols should be best performed, e.g. in terms of antibody concentration or incubation time, mainly due to limitations in instrument sensitivity and the limited availability of validated antibodies for such analyses. Aiming to evaluate if this IFCM platform generally could be used to evaluate and optimise antibody-staining protocols, we next applied PE-conjugated anti-CD63 or isotype control antibodies at different concentrations to THP-1:CD63eGFP-derived EV-containing samples. Samples were stained for 2 h without any washing step before acquisition. Following pre-gating on total SSC(low) events ()), most eGFP(+) sEVs were labelled with PE when applying PE-labelled anti-CD63 antibodies, but not when PE-labelled IgG isotype control antibodies were used (–). The shift of eGFP(+) EVs towards the PE channel increased with increasing anti-CD63 antibody concentrations and was strong enough to gate the complete eGFP(+) sEV population as positive at the highest antibody concentration ()). While isotype controls and non-EV containing buffer controls overall did not show considerable staining on eGFP(+) EVs, we still observed a dose-dependent relative increase of eGFP(−)PE(+) events for those controls, indicating the clear detection of background deriving from the antibody solution itself ()). Antibody-mediated background such as protein complexes or antibody aggregates was reported previously [Citation27,Citation38]. This indicates the importance of non-EV containing buffer controls for such experiments. Remarkably, upon comparing different antibodies from different vendors, we observed that the degree of background between individual antibodies can vary drastically (data not shown). Thus, we propose that the usage of buffer controls (buffer + antibody) is critical to account for antibody-mediated background, while isotype controls are suitable to demonstrate binding specificity to a particular antigen.
Figure 8. Evaluation of antibody-staining protocols. (a) Gating on total SSC(low) events and dotplot of eGFP (Ch02) vs. PE (Ch03) fluorescence detection channels for an unstained THP-1:CD63eGFP derived pre-cleared (900 × g for 5 min and 2,000 × g for 15 min) and 0.22 µm filtered CM sample (DP = double positive). (b) Dotplots gated on SSC(low), with examples for THP-1:CD63eGFP derived samples prepared as in (a) and PBS buffer controls stained at different concentrations of PE-labelled anti-CD63 or IgG isotype control antibodies. All filtered CM samples were stained without further dilution at RT protected from light for 2 h. Directly afterwards samples were diluted 4-fold in PBS and acquired with the ISX without further washing. All samples were acquired for 5 min. Representative images of eGFP(+)PE(−) [eGFP(+)], eGFP(−)PE(+) [PE(+)] and double positive (DP) events are shown. Arrows indicate eGFP(−)PE(+) events originating from the applied antibody solution. (c) Quantification of DP-gated event concentrations per mL. One out of two individual experiments with comparable outcome is shown.
![Figure 8. Evaluation of antibody-staining protocols. (a) Gating on total SSC(low) events and dotplot of eGFP (Ch02) vs. PE (Ch03) fluorescence detection channels for an unstained THP-1:CD63eGFP derived pre-cleared (900 × g for 5 min and 2,000 × g for 15 min) and 0.22 µm filtered CM sample (DP = double positive). (b) Dotplots gated on SSC(low), with examples for THP-1:CD63eGFP derived samples prepared as in (a) and PBS buffer controls stained at different concentrations of PE-labelled anti-CD63 or IgG isotype control antibodies. All filtered CM samples were stained without further dilution at RT protected from light for 2 h. Directly afterwards samples were diluted 4-fold in PBS and acquired with the ISX without further washing. All samples were acquired for 5 min. Representative images of eGFP(+)PE(−) [eGFP(+)], eGFP(−)PE(+) [PE(+)] and double positive (DP) events are shown. Arrows indicate eGFP(−)PE(+) events originating from the applied antibody solution. (c) Quantification of DP-gated event concentrations per mL. One out of two individual experiments with comparable outcome is shown.](/cms/asset/afc52f32-a699-408d-8440-70ed5a330e03/zjev_a_1587567_f0008_oc.jpg)
In summary, these analyses demonstrate that titration or optimisation of pre-acquisition parameters can clearly improve signal intensities above background. While future tests are required for the evaluation of other staining parameters like temperature and incubation times, these results show that the use of fluorescently tagged sEVs can provide helpful information for parameter optimisation experiments, and that this IFCM platform is sensitive enough to detect single sEVs labelled with fluorophore-conjugated antibodies.
Quantification of absolute numbers of fluorescent molecules per single SSC(low)eGFP(+) sEV
The determination of fluorescence intensity in terms of a standardised unit, so-called MESF, can be used to assess the absolute number of equivalent fluorochromes per single event of interest via flow cytometry. This approach is based on the assumption that a sample labelled with a specific fluorochrome will have the same intensity as an equal number of molecules of the same fluorochrome [Citation46,Citation73]. In the context of EV analysis by flow cytometry, such MESF values allow for the quantification of the number of fluorochrome molecules being detected per EV and for cross-platform and inter-laboratory comparisons [Citation24,Citation33]. Thus, we next measured two sets of MESF beads, one consisting of five bead populations with known equivalents of FITC molecules and one consisting of four bead populations with known equivalents of PE molecules, with the same settings applied as for EV analyses ()), calculated respective logarithmic values ()) and performed a linear regression of MESF values against the MFI ()). In the example of anti-CD63-PE stained THP-1:CD63eGFP sEVs as presented above without fluorescence calibration ()), we next converted measured fluorescence intensity values for eGFP and PE to FITC and PE MESF values, respectively ()). FITC MESF values were then converted to equivalent eGFP MESF values based on previously reported quantum efficiencies (conversion factor 0.6) [Citation57] ()). This MESF conversion resulted in mean calculated MESF values of 980.88 (range ~200–8000) for eGFP and 174.41 (range ~60–600) for PE per single sEV after gating on the double-positive main population ()). Thus, assuming that each antibody is labelled with exactly one PE molecule, and neglecting instrumentation differences between this study and the study calculating the FITC to eGFP correction factor applied, we like to conclude that detected single EVs of this population in average contain ~980 eGFP molecules and are decorated by an average of ~174 anti-CD63-PE antibodies. Potential explanations for the lower number of calculated CD63 surface molecules by anti-CD63 antibodies compared to calculated CD63eGFP molecules per single sEV include spatial limitations for antibody binding on the sEV surface, non-saturated staining of all CD63 epitopes or incomplete labelling of the antibody used. This dataset shows that IFCM generally facilitates the quantification of absolute numbers of fluorescent molecules per single sEV.
Figure 9. Calculation of MESF values for THP-1:CD63eGFP SSC(low)eGFP(+) sEVs stained with anti-CD63-PE antibodies. (a) The median fluorescence intensity (MFI) of each peak of FITC and PE MESF calibration beads was measured with the same instrument/acquisition settings applied as used for sEV-containing samples. (b) Calculation of the log of the MFI and MESF values (provided by bead manufacturer). (c) The log of the MESF values was plotted on the y-axis, and the log of the MFI was plotted on the x-axis. A linear regression analysis was performed, respectively. To estimate MESF values of anti-CD63-PE (33.33 nM) stained sEVs in THP-1:CD63eGFP-derived CM samples (compare (b)), the slope (x) and the intercept (y) were used to convert eGFP/PE fluorescence intensity values (d) to FITC/PE MESF values, and plot the data on axes calibrated for FITC and PE MESF (E). FITC MESF values were then converted to eGFP MESF equivalents (f).
IFCM facilitates the detection of sEV subsets in heterogeneous samples
As THP-1:CD63eGFP derived sEVs potentially contain higher amounts of CD63, which might not be representative for other sEV surface markers, we decided to analyse sEVs from another cell entity which had not been genetically engineered. To this end we analysed MSC sEVs which previously were applied in a number of pre-clinical settings and the treatment of an acute Graft-versus-Host Disease patient [Citation47,Citation74–Citation76] and tested for the feasibility of multi-colour antibody stainings via IFCM.
We used supernatants of MSCs which had been cultured for 48 h in the presence of hPL as an alternative to FBS [Citation77]. CM were harvested, precleared by centrifugation (900 × g; 2,000 × g), filtered (0.22 µm), and subjected to antibody staining. PBS and fresh hPL supplemented media were prepared accordingly and used as controls ()). Upon analysing samples stained with single PE-conjugated anti-CD9 or anti-CD81 antibodies ()), we observed clear and consistent signals with both antibodies at much higher amounts than in the PBS controls. Notably, higher event numbers following CD9 staining were recorded than after CD81 staining. In complete media controls supplemented with hPL, hardly any CD81(+) events were recorded; in contrast, it contained more CD9(+) events than the MSC CM ()). This suggests that hPL contains CD9(+) vesicles, and that MSCs take these vesicles up and in turn release CD81(+) sEVs.
Figure 10. IFCM facilitates the detection of sEV subsets in heterogeneous samples. (a) Experimental outline. MSCs were cultured for 48 h in human pooled platelet lysate (hPL) supplemented media. Pre-cleared (900 × g for 5 min; 2,000 × g for 15 min) and 0.22 µm filtered CM samples were stained with fluorescently labelled antibodies at a final concentration of ~25 nM at RT for 1 h. Directly afterwards samples were diluted 4-fold in PBS and acquired with the ISX without further washing. All samples were acquired for 5 min. (b) Gating strategy to identify SSC(low) events and PE(+) sEVs at the example of anti-CD9-PE stained MSC supernatant (MSC-SN). (c) Quantification of CD9 and CD81 expression (quantified as gated PE+ sEVs/mL) for PBS, hPL supplemented media (complete med.) and MSC-derived CM samples (MSC SN). (d) SSC(low) pre-gated dotplots of samples stained simultaneously with anti-CD9 and anti-CD81 antibodies (as in comparison to unstained and single stained controls. Example images for CD9-PE(+) or CD81-APC(+) events, and for a rare double positive (DP) event. (e) Repetition of the experiment shown in (d) with differently conjugated antibodies also including CM derived from MSCs cultured in serum-free media (SFM). (f) Quantification of the frequency of gated sEV populations from (e), including values after detergent lysis. Data were collected from at least three independent experiments with comparable outcomes. Data was quantified after pre-gating on SSC(low) as shown in (b).
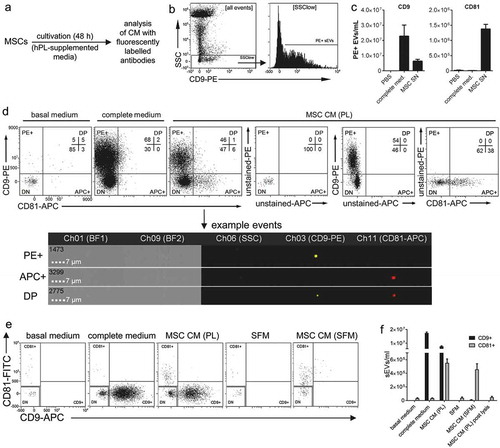
To investigate if CD81(+) EVs also are positive for CD9, we performed double stainings, next. Samples were simultaneously stained with PE-labelled anti-CD9 and APC-labelled anti-CD81 antibodies. Remarkably, we hardly detected any CD9/CD81 double positive events. EVs positive for CD81 were negative for CD9 and vice versa ()). Almost no events were recorded in basal media controls. In contrast, as already implied by the results from single staining before, huge amounts of CD9(+) events, but not CD81(+) events, were recorded in hPL-supplemented complete media controls ()). To validate this observation, we repeated these analyses with CD9-APC and CD81-FITC antibodies. In addition, supernatant from MSCs cultured in formulated, EV-free, serum-free medium (SFM) was included in these measurements to learn whether MSCs release CD9(+) sEVs. Again, comparable results were obtained with hPL vesicles appearing as CD9(+)CD81(−) and proposed MSC-sEVs as CD9(−)CD81(+) events (–). Almost all detected fluorescence-positive events were absent after detergent lysis ()). Since MSC-CM from hPL-supplemented cultures but not from MSC SFM cultures contained a clear CD9(+)CD81(−) population (–), we like to conclude that these sEVs are residual vesicles of the hPL rather than CD9(+)CD81(−) sEVs being released from MSCs in addition to CD9(−)CD81(+) sEVs. Notably, these findings correspond very well to our recent report that MSC-EVs analysed by bead-based flow cytometry appeared positive for CD63 and CD81 but negative for CD9 [Citation8], and further confirms the previous observation that platelet-derived EVs are CD9(+)CD63(+)CD81(−) [Citation6]. Despite the potential relevance of this finding for the MSC-EV field and its future investigation at higher detail with calibrated fluorescence values, further titrated antibodies and optimised staining protocols, the obtained results demonstrate that IFCM facilitates the robust detection and quantification of phenotypically distinct, single sEVs in heterogeneous samples by using different fluorochrome-conjugated antibodies.
Discussion
In summary, this study has qualified the ISX instrument as highly suitable and sensitive IFCM platform for the robust multi-parametric detection and quantification of single sEVs and sEV subsets in heterogeneous samples. We have evaluated several acquisition-related IFCM parameters, and further defined optimised masking settings which result in increased contrast between background and sEV-derived signals and robust identification of coincidence or swarm detection, respectively. This extensive validation and optimisation was facilitated by the use of sEVs being specifically labelled with eGFP through the expression of a CD63eGFP fusion construct in producer cells. By using these eGFP-labelled EVs as biological reference material, we further show that IFCM can be used to analyse sEVs in EV-containing samples without any preparation, even with cells being present. Single sEVs can be labelled with fluorophore-conjugated antibodies, which surely is of high interest for studies aiming at biomarker discovery, as we have further elaborated in our approach to specifically detect glioblastoma derived EVs [Citation78]. Here, at the example of MSC-derived CM we demonstrate that the ISX facilitates robust multicolour analyses of sEVs without the prior need for EV isolation or enrichment.
There are several key features or advantages that contribute to IFCM being a very powerful and sensitive method for EV analysis. The low signal-to-noise ratio and the overall high sensitivity facilitate a clear separation of rather faint signals from background and provide a high fluorescence and scatter resolution. This high sensitivity is probably related to a combination of different technical differences compared to conventional flow cytometers, including the slower flow rate, the CCD-camera based detection enabling higher quantum efficiency compared to conventional photon multiplier tubes, and an integration of detected signals over time using TDI. Another advantage is the automatic triggering on all channels, which should lead to a more reliable detection of single sEVs even if they are exclusively marked by fluorescent probes in one channel and devoid of SSC and brightfield signals, negating the need for a general membrane stain for phenotyping sEVs. In accordance to previous studies we always set all lasers that were run at maximum power throughout this study, including the 785 nm laser used for SSC by default, indicating that more powerful lasers or using a lower laser wavelength for SSC also might contribute to even higher sensitivity and improved SSC resolution [Citation21,Citation45,Citation46].
Overall, we also demonstrate that the usage of fluorescently labelled EVs/sEVs with a fluorescent protein tag like CD63eGFP is a much more suitable reference material than any kind of calibration bead in terms of method validation and optimisation of various acquisition and analysis parameters for sEV detection. Additionally, such biological reference material conceptually can be produced in exactly the same purity with the same isolation procedure as the final samples of interest, making it more suitable for respective biological samples of interest. Similar reference materials with different fluorophores or combined with additionally introduced genetic features surely will be very helpful tools to further improve such kind of sEV analysis methods. Finally, such reference material, especially when combined with highly sensitive and robust sEV analysis methods, such as IFCM, can be used to further define and fine-tune details of various protocols. Importantly, such reference materials should finally be further defined and characterised with different methods, and fluorescence intensity values should be reported as MESF wherever possible. This would allow proper comparison of results between instruments and assessment of other relevant parameters, e.g. day-to-day variability of an instrument and cross-comparison between different IFCM instruments of the same type. Furthermore, this would enable us to quantify the limit of detection of the ISX in terms of absolute fluorescent molecules being required for detecting a single sEV event as positive and to compare detection efficiencies between instruments based on fluorescence in a more objective and comprehensive way.
Since SSC(low)eGFP(+) sEVs were only detected in THP-1:CD63eGFP derived and not in THP-1:eGFP derived samples, this implies that sEVs including exosomes can only be labelled efficiently enough to be detected in such methods when the fluorophore of choice is fused to an exosomal targeting protein, such as CD63, not by expressing the fluorescent protein itself. Our data further indicates that the usage of such tetraspanin fusion constructs not only specifically leads to the labelling of sEVs or exosomes, but also to the labelling of all larger EV populations. Since cytoplasmic eGFP, however, was only found to label EVs with intermediate to high SSC values, this suggests that such kind of labelling might be even a good choice when one is actually aiming to label larger vesicles, such as larger microvesicles or apoptotic bodies, but not sEVs/exosomes.
We observed that antibody-mediated background such as protein complexes or antibody aggregates that was reported previously [Citation27,Citation38] is detected in sEV samples stained with fluorescence-conjugated monoclonal antibodies. Meanwhile, we have compared several other antibodies from different manufacturers in buffer controls, i.e. in controls containing no EVs, and observed huge differences between individual antibodies in terms of antibody-mediated background (data not shown). This underlines not only that every antibody used should be individually validated, and that isotype controls are not suitable to control for false positive events in EV flow cytometry, but also that manufacturers should improve their purification and quality control efforts in order to provide antibodies to the EV field that are validated for EV research with optical, high resolution methods.
In summary, we propose that the comprehensive stepwise validation and optimisation presented in this study will enable many researchers to employ this sensitive and robust technique to detect and quantify single sEVs in various experimental contexts, which will drastically improve our understanding of sEV heterogeneity in terms of phenotype and related functions of sEV subpopulations in the future.
Author contributions
The manuscript was written through contributions of all authors. All authors have given approval to the final version of the manuscript. A.G. and B.G. conceived the idea, designed the experiments and wrote the manuscript. M.B., F.L.R., C.P., U.E., J.L. assisted in manuscript writing. A.G., M.B., R.F., F.M. and J.L. performed the experiments, A.G., M.B., T.T., S.S. and J.L. analysed the data, A.G. designed and assembled all figures, J.A.W., C.P., C.G., S.T., J.J., C.B., H.H., U.E., P.A.H., J.L., S.E.A. and F.L.R. contributed general intellectual input on the experimental design, contributed to data analysis, contributed relevant material/expertise and/or discussed the results. All authors reviewed the manuscript and approved its final version.
Acknowledgments
The authors would like to thank Sherree Friend, Peter Rhein, Bryan Davidson and Owen Hughes (Amnis/Merck Millipore) for their support and discussion throughout the project. The authors would further like to thank all members of the ISEV-ISAC-ISTH EV Flow Cytometry Working Group (http://www.evflowcytometry.org/) for general valuable input and discussions. FITC-MESF beads (custom beads, prepared by Majid Mehrpouyan) and commercially available PE-MESF beads were kindly provided as a gift by BD Biosciences to support ISEV-ISAC-ISTH EV Flow Cytometry Working Group members in ongoing standardisation studies.
Disclosure statement
A.G. received three travel awards (each 1,000 USD) from Merck Millipore/Amnis Corporation. A.G. and S.E.A. are consultants for and have equity interests in Evox Therapeutics Ltd., Oxford, UK. B.G. is SAB member of Evox Therapeutics and Innovex Therapeutics. All other authors declare no potential conflicts of interest.
Additional information
Funding
Related Research Data
References
- Yáñez-Mó M, Siljander PR-M, Andreu Z, et al. Biological properties of extracellular vesicles and their physiological functions [physiology]. J Extracell Vesicles. 2015;4:27066. http://dx.doi.org/10.3402/jev.v4.27066
- Lener T, Gimona M, Aigner L, et al. Applying extracellular vesicles based therapeutics in clinical trials - an ISEV position paper. J Extracell Vesicles. 2015;4:30087. PubMed PMID: 26725829; PubMed Central PMCID: PMCPMC4698466. eng.
- Fais S, O’Driscoll L, Borras FE, et al. Evidence-based clinical use of nanoscale extracellular vesicles in nanomedicine. ACS Nano. 2016 Mar 15. PubMed PMID: 26978483. DOI:10.1021/acsnano.5b08015.
- Raposo G, Stoorvogel W. Extracellular vesicles: exosomes, microvesicles, and friends. J Cell Biol. 2013 Feb 18;200(4):373–25. PubMed PMID: 23420871; PubMed Central PMCID: PMCPMC3575529.
- Koliha N, Heider U, Ozimkowski T, et al. Melanoma affects the composition of blood cell-derived extracellular vesicles [original research]. Front Immunol. 2016 Jul;7(282). English. DOI:10.3389/fimmu.2016.00282
- Koliha N, Wiencek Y, Heider U, et al. A novel multiplex bead-based platform highlights the diversity of extracellular vesicles. J Extracell Vesicles. 2016;5:29975. PubMed PMID: 26901056; PubMed Central PMCID: PMCPMC4762227.
- Wiklander OP, Nordin JZ, O’Loughlin A, et al. Extracellular vesicle in vivo biodistribution is determined by cell source, route of administration and targeting. J Extracell Vesicles. 2015;4:26316. PubMed PMID: 25899407; PubMed Central PMCID: PMCPMC4405624.
- Wiklander OPB, Bostancioglu RB, Welsh JA, et al. Systematic methodological evaluation of a multiplex bead-based flow cytometry assay for detection of extracellular vesicle surface signatures [ Original Research]. Front Immunol. 2018 Jun;9(1326). English. doi: 10.3389/fimmu.2018.01326. .
- Kowal J, Arras G, Colombo M, et al. Proteomic comparison defines novel markers to characterize heterogeneous populations of extracellular vesicle subtypes. Proc Natl Acad Sci U S A. 2016 Feb 8. PubMed PMID: 26858453. DOI:10.1073/pnas.1521230113 .
- Giebel B. On the function and heterogeneity of extracellular vesicles. Ann Transl Med. 2017 Mar;5(6):150. PubMed PMID: 28462230; PubMed Central PMCID: PMCPMC5395490.
- Witwer KW, Buzas EI, Bemis LT, et al. Standardization of sample collection, isolation and analysis methods in extracellular vesicle research. J Extracell Vesicles. 2013;2. PubMed PMID: 24009894; PubMed Central PMCID: PMCPMC3760646. DOI:10.3402/jev.v2i0.20360
- Sharma S, Rasool HI, Palanisamy V, et al. Structural-mechanical characterization of nanoparticle exosomes in human saliva, using correlative AFM, FESEM, and force spectroscopy. ACS Nano. 2010;4(4):1921–1926.
- van der Pol E, Hoekstra AG, Sturk A, et al. Optical and non-optical methods for detection and characterization of microparticles and exosomes. J Thromb Haemost. 2010 Dec;8(12):2596–2607. PubMed PMID: 20880256.
- Willms E, Cabanas C, Mäger I, et al. Extracellular vesicle heterogeneity: subpopulations, isolation techniques and diverse functions in cancer progression. Front Immunol. 2018. English. DOI:10.3389/fimmu.2018.00738.
- Dragovic RA, Gardiner C, Brooks AS, et al. Sizing and phenotyping of cellular vesicles using nanoparticle tracking analysis. Nanomedicine. 2011 Dec;7(6):780–788. PubMed PMID: 21601655; PubMed Central PMCID: PMCPMC3280380.
- Sokolova V, Ludwig AK, Hornung S, et al. Characterisation of exosomes derived from human cells by nanoparticle tracking analysis and scanning electron microscopy. Colloids Surf B Biointerfaces. 2011 Oct 1;87(1):146–150. PubMed PMID: 21640565.
- van der Pol E, Coumans FA, Grootemaat AE, et al. Particle size distribution of exosomes and microvesicles determined by transmission electron microscopy, flow cytometry, nanoparticle tracking analysis, and resistive pulse sensing. J Thromb Haemost. 2014 Jul;12(7):1182–1192. PubMed PMID: 24818656.
- Shao H, Im H, Castro CM, et al. New technologies for analysis of extracellular vesicles. Chem Rev. 2018 Feb 28;118(4):1917–1950. PubMed PMID: 29384376.
- Nolte-’T Hoen EN, van der Vlist EJ, Aalberts M, et al. Quantitative and qualitative flow cytometric analysis of nanosized cell-derived membrane vesicles. Nanomedicine. 2012 Jul;8(5):712–720. PubMed PMID: 22024193.
- Pospichalova V, Svoboda J, Dave Z, et al. Simplified protocol for flow cytometry analysis of fluorescently labeled exosomes and microvesicles using dedicated flow cytometer. J Extracell Vesicles. 2015;4:25530. PubMed PMID: 25833224; PubMed Central PMCID: PMCPMC4382613.
- Erdbrugger U, Rudy CK, Mark EE, et al. Imaging flow cytometry elucidates limitations of microparticle analysis by conventional flow cytometry. Cytometry A. 2014 Sep;85(9):756–770. PubMed PMID: 24903900.
- György B, Szabó TG, Turiák L, et al. Improved flow cytometric assessment reveals distinct microvesicle (cell-derived microparticle) signatures in joint diseases. PLoS One. 2012;7(11):e49726.
- van der Pol E, de Rond L, Coumans FAW, et al. Absolute sizing and label-free identification of extracellular vesicles by flow cytometry. Nanomedicine. 2018 Jan 5;14(3):801–810. PubMed PMID: 29307842; eng.
- Stoner SA, Duggan E, Condello D, et al. High sensitivity flow cytometry of membrane vesicles. Cytometry Part A. 2015;n/a-n/a. DOI:10.1002/cyto.a.22787.
- Morales-Kastresana A, Telford B, Musich TA, et al. Labeling extracellular vesicles for nanoscale flow cytometry. Sci Rep. 2017;7(1):1878.
- Higginbotham JN, Zhang Q, Jeppesen DK, et al. Identification and characterization of EGF receptor in individual exosomes by fluorescence-activated vesicle sorting. J Extracell Vesicles. 2016;5:29254. PubMed PMID: 27345057; PubMed Central PMCID: PMCPMC4921784. eng.
- Inglis HC, Danesh A, Shah A, et al. Techniques to improve detection and analysis of extracellular vesicles using flow cytometry. Cytometry Part A. 2015;87(11):1052–1063.
- Arraud N, Linares R, Tan S, et al. Extracellular vesicles from blood plasma: determination of their morphology, size, phenotype and concentration. J Thromb Haemost. 2014 May;12(5):614–627. PubMed PMID: 24618123.
- Kormelink TG, Arkesteijn GJ, Nauwelaers FA, et al. Prerequisites for the analysis and sorting of extracellular vesicle subpopulations by high-resolution flow cytometry. Cytometry A. 2015 Feb 16. PubMed PMID: 25688721. DOI:10.1002/cyto.a.22644.
- van der Vlist EJ, Nolte-’T Hoen EN, Stoorvogel W, et al. Fluorescent labeling of nano-sized vesicles released by cells and subsequent quantitative and qualitative analysis by high-resolution flow cytometry. Nat Protoc. 2012 Jul;7(7):1311–1326. PubMed PMID: 22722367.
- Coumans FAW, Brisson AR, Buzas EI, et al. Methodological guidelines to study extracellular vesicles. Circ Res. 2017 May 12;120(10):1632–1648. PubMed PMID: 28495994.
- van der Pol E, van Gemert MJ, Sturk A, et al. Single vs. swarm detection of microparticles and exosomes by flow cytometry. J Thromb Haemost. 2012 May;10(5):919–930. PubMed PMID: 22394434.
- Nolan JP. Flow cytometry of extracellular vesicles: potential, pitfalls, and prospects. Curr Protoc Cytom. 2015 Jul 1;73:13 14 1–16.
- Larson MC, Luthi MR, Hogg N, et al. Calcium-phosphate microprecipitates mimic microparticles when examined with flow cytometry. Cytometry A. 2013 Feb;83(2):242–250. PubMed PMID: 23125136; PubMed Central PMCID: PMCPMC3615643.
- Crompot E, Van Damme M, Duvillier H, et al. Avoiding false positive antigen detection by flow cytometry on blood cell derived microparticles: the importance of an appropriate negative control. PLoS One. 2015;10(5):e0127209. . PubMed PMID: PMC4433223.
- Poncelet P, Robert S, Bouriche T, et al. Standardized counting of circulating platelet microparticles using currently available flow cytometers and scatter-based triggering: forward or side scatter? Cytometry Part A. 2015;n/a-n/a. DOI:10.1002/cyto.a.22685.
- Lacroix R, Robert S, Poncelet P, et al. Overcoming limitations of microparticle measurement by flow cytometry. Semin Thromb Hemost. 2010 Nov;36(8):807–818. PubMed PMID: 21049381.
- Gyorgy B, Modos K, Pallinger E, et al. Detection and isolation of cell-derived microparticles are compromised by protein complexes resulting from shared biophysical parameters. Blood. 2011 Jan 27;117(4):e39–48. PubMed PMID: 21041717.
- Chandler WL, Yeung W, Tait JF. A new microparticle size calibration standard for use in measuring smaller microparticles using a new flow cytometer. J Thromb Haemost. 2011 Jun;9(6):1216–1224. . PubMed PMID: 21481178.
- Robert S, Poncelet P, Lacroix R, et al. Standardization of platelet-derived microparticle counting using calibrated beads and a Cytomics FC500 routine flow cytometer: a first step towards multicenter studies? J Thromb Haemost. 2009 Jan;7(1):190–197. PubMed PMID: 18983485.
- Lacroix R, Robert S, Poncelet P, et al. Standardization of platelet-derived microparticle enumeration by flow cytometry with calibrated beads: results of the international society on thrombosis and haemostasis SSC collaborative workshop. J Thromb Haemost. 2010 Nov;8(11):2571–2574. PubMed PMID: 20831623.
- Varga Z, van der Pol E, Palmai M, et al. Hollow organosilica beads as reference particles for optical detection of extracellular vesicles. J Thromb Haemost. 2018 Jun 7. PubMed PMID: 29877049. DOI:10.1111/jth.14193.
- Valkonen S, van der Pol E, Boing A, et al. Biological reference materials for extracellular vesicle studies. Eur J Pharm Sci. 2017 Feb 15;98:4–16. PubMed PMID: 27622921; eng.
- Gardiner C, Ferreira YJ, Dragovic RA, et al. Extracellular vesicle sizing and enumeration by nanoparticle tracking analysis. J Extracell Vesicles. 2013;2. PubMed PMID: 24009893; PubMed Central PMCID: PMCPMC3760643. DOI:10.3402/jev.v2i0.19671
- Headland SE, Jones HR, D’Sa AS, et al. Cutting-edge analysis of extracellular microparticles using ImageStream(X) imaging flow cytometry. Sci Rep. 2014;4:5237. PubMed PMID: 24913598; PubMed Central PMCID: PMCPMC4050385.
- Lannigan J, Erdbruegger U. Imaging flow cytometry for the characterization of extracellular vesicles. Methods. 2017 Jan 1;112:55–67.
- Kordelas L, Rebmann V, Ludwig AK, et al. MSC-derived exosomes: a novel tool to treat therapy-refractory graft-versus-host disease. Leukemia. 2014 Apr;28(4):970–973. PubMed PMID: 24445866.
- Radtke S, Gorgens A, Liu B, et al. Human mesenchymal and murine stromal cells support human lympho-myeloid progenitor expansion but not maintenance of multipotent haematopoietic stem and progenitor cells. Cell Cycle. 2016;15(4):540–545. PubMed PMID: 26818432; PubMed Central PMCID: PMCPMC5056604.
- Ludwig AK, De Miroschedji K, Doeppner TR, et al. Precipitation with polyethylene glycol followed by washing and pelleting by ultracentrifugation enriches extracellular vesicles from tissue culture supernatants in small and large scales. J Extracell Vesicles. 2018;7(1):1528109. PubMed PMID: 30357008; PubMed Central PMCID: PMCPMC6197019. eng.
- Gorgens A, Ludwig AK, Mollmann M, et al. Multipotent hematopoietic progenitors divide asymmetrically to create progenitors of the lymphomyeloid and erythromyeloid lineages. Stem Cell Reports. 2014 Dec 9;3(6):1058–1072. PubMed PMID: 25448068; PubMed Central PMCID: PMCPMC4263999.
- Mochizuki H, Schwartz JP, Tanaka K, et al. High-titer human immunodeficiency virus type 1-based vector systems for gene delivery into nondividing cells. J Virol. 1998 Nov;72(11):8873–8883. PubMed PMID: WOS:000076373700051; English.
- Leurs C, Jansen M, Pollok KE, et al. Comparison of three retroviral vector systems for transduction of nonobese diabetic/severe combined immunodeficiency mice repopulating human CD34+ cord blood cells. Hum Gene Ther. 2003 Apr 10;14(6):509–519. PubMed PMID: 12718762.
- Mullers E, Uhlig T, Stirnnagel K, et al. Novel functions of prototype foamy virus gag glycine-arginine-rich boxes in reverse transcription and particle morphogenesis. J Virol. 2011 Feb;85(4):1452–1463. PubMed PMID: WOS:000286420900004; English.
- Robert S, Poncelet P, Lacroix R, et al. More on: calibration for the measurement of microparticles: value of calibrated polystyrene beads for flow cytometry-based sizing of biological microparticles. J Thromb Haemost. 2011 Aug;9(8):1676–1678; author reply 1681-2. doi: PubMed PMID: 21645234.
- Wisgrill L, Lamm C, Hartmann J, et al. Peripheral blood microvesicles secretion is influenced by storage time, temperature, and anticoagulants. Cytometry A. 2016 Jul;89(7):663–672. PubMed PMID: 27442840; eng.
- Wu Y, Campos SK, Lopez GP, et al. The development of quantum dot calibration beads and quantitative multicolor bioassays in flow cytometry and microscopy. Anal Biochem. 2007 May 15;364(2):180–192. PubMed PMID: 17397793; PubMed Central PMCID: PMCPMC2018651.
- Buranda T, Wu Y, Sklar LA. Quantum dots for quantitative flow cytometry. Methods Mol Biol. 2011;699:67–84. PubMed PMID: 21116979; PubMed Central PMCID: PMCPMC4388555. eng.
- Mullier F, Bailly N, Chatelain C, et al. More on: calibration for the measurement of microparticles: needs, interests, and limitations of calibrated polystyrene beads for flow cytometry-based quantification of biological microparticles. J Thromb Haemost. 2011 Aug;9(8):1679–1681; author reply 1681-2. doi: PubMed PMID: 21645233.
- Sanchez-Lopez V, Vila-Liante V, Arellano-Orden E, et al. High correlation between 2 flow cytometry platforms in the microparticles analysis using a new calibrated beads strategy. Transl Res. 2015 Dec;166(6):733–739. PubMed PMID: 26342453; eng.
- Escola JM, Kleijmeer MJ, Stoorvogel W, et al. Selective enrichment of tetraspan proteins on the internal vesicles of multivesicular endosomes and on exosomes secreted by human B-lymphocytes. J Biol Chem. 1998 Aug 7;273(32):20121–20127. PubMed PMID: 9685355.
- Pols MS, Klumperman J. Trafficking and function of the tetraspanin CD63. Exp Cell Res. 2009 May 15;315(9):1584–1592. PubMed PMID: 18930046; eng.
- Mittelbrunn M, Gutierrez-Vazquez C, Villarroya-Beltri C, et al. Unidirectional transfer of microRNA-loaded exosomes from T cells to antigen-presenting cells [10.1038/ncomms1285]. Nat Commun. 2011;2:282. http://www.nature.com/ncomms/journal/v2/n4/suppinfo/ncomms1285_S1.html
- Corso G, Mäger I, Lee Y, et al. Reproducible and scalable purification of extracellular vesicles using combined bind-elute and size exclusion chromatography. Sci Rep. 2017;7(1):11561.
- Basiji DA, Ortyn WE, Liang L, et al. Cellular image analysis and imaging by flow cytometry. Clin Lab Med. 2007 Sep;27(3):653–70, viii. PubMed PMID: 17658411; PubMed Central PMCID: PMCPMC2034394. eng.
- George TC, Basiji DA, Hall BE, et al. Distinguishing modes of cell death using the ImageStream® multispectral imaging flow cytometer. Cytometry Part A. 2004;59A(2):237–245.
- Nolan JP, Duggan E. Analysis of individual extracellular vesicles by flow cytometry. In: Hawley TS, Hawley RG, editors. Flow cytometry protocols. New York: Springer New York; 2018. p. 79–92.
- Théry C, Witwer KW, Aikawa E, et al. Minimal information for studies of extracellular vesicles 2018 (MISEV2018): a position statement of the international society for extracellular vesicles and update of the MISEV2014 guidelines. J Extracell Vesicles. 2019;8(1):1535750.
- Mastoridis S, Bertolino GM, Whitehouse G, et al. Multiparametric analysis of circulating exosomes and other small extracellular vesicles by advanced imaging flow cytometry. Front Immunol. 2018;9:1583. PubMed PMID: 30034401; PubMed Central PMCID: PMCPMC6043651.
- Linares R, Tan S, Gounou C, et al. High-speed centrifugation induces aggregation of extracellular vesicles. J Extracell Vesicles. 2015;4:29509. PubMed PMID: 26700615.
- Taylor DD, Shah S. Methods of isolating extracellular vesicles impact down-stream analyses of their cargoes. Methods. 2015 Oct 1;87:3–10.
- Muller L, Hong CS, Stolz DB, et al. Isolation of biologically-active exosomes from human plasma. J Immunol Methods. 2014 Sep;411:55–65. PubMed PMID: 24952243; PubMed Central PMCID: PMCPMC4260336. eng.
- Nordin JZ, Lee Y, Vader P, et al. Ultrafiltration with size-exclusion liquid chromatography for high yield isolation of extracellular vesicles preserving intact biophysical and functional properties. Nanomedicine. 2015 May;11(4):879–883. PubMed PMID: 25659648; eng.
- Schwartz A, Gaigalas AK, Wang L, et al. Formalization of the MESF unit of fluorescence intensity. Cytometry B Clin Cytom. 2004 Jan;57(1):1–6. PubMed PMID: 14696057.
- Drommelschmidt K, Serdar M, Bendix I, et al. Mesenchymal stem cell-derived extracellular vesicles ameliorate inflammation-induced preterm brain injury. Brain Behav Immun. 2017 Feb;60:220–232. PubMed PMID: 27847282.
- Doeppner TR, Herz J, Gorgens A, et al. Extracellular vesicles improve post-stroke neuroregeneration and prevent postischemic immunosuppression. Stem Cells Transl Med. 2015 Oct;4(10):1131–1143. PubMed PMID: 26339036; PubMed Central PMCID: PMCPMC4572905.
- Ophelders DRMG, Wolfs TGAM, Jellema RK, et al. Mesenchymal stromal cell-derived extracellular vesicles protect the fetal brain after hypoxia-ischemia. Stem Cells Transl Med. 2016. DOI:10.5966/sctm.2015-0197.
- Hemeda H, Giebel B, Wagner W. Evaluation of human platelet lysate versus fetal bovine serum for culture of mesenchymal stromal cells. Cytotherapy. 2014 Feb;16(2):170–180. PubMed PMID: 24438898.
- Ricklefs FL, Maire CL, Reimer R, et al. Imaging flow cytometry facilitates multiparametric characterization of extracellular vesicles in malignant brain tumours. J Extracell Vesicles. 2019;8(1):1588555.
- Wiek C, Schmidt Eva M, Roellecke K, et al. Identification of amino acid determinants in CYP4B1 for optimal catalytic processing of 4-ipomeanol. Biochem J. 2015;465(1):103–114.