
ABSTRACT
Cells release heterogeneous nano-sized vesicles either as exosomes, being derived from endosomal compartments, or through budding from the plasma membrane as so-called microvesicles, commonly referred to as extracellular vesicles (EVs). EVs are known for their important roles in mammalian physiology and disease pathogenesis and provide a potential biomarker source in cancer patients. EVs are generally often analysed in bulk using Western blotting or by bead-based flow-cytometry or, with limited parameters, through nanoparticle tracking analysis. Due to their small size, single EV analysis is technically highly challenging. Here we demonstrate imaging flow cytometry (IFCM) to be a robust, multiparametric technique that allows analysis of single EVs and the discrimination of distinct EV subpopulations. We used IFCM to analyse the tetraspanin (CD9, CD63, CD81) surface profiles on EVs from human and murine cell cultures as well as plasma samples. The presence of EV subpopulations with specific tetraspanin profiles suggests that EV-mediated cellular responses are tightly regulated and dependent on cell environment. We further demonstrate that EVs with double positive tetraspanin expression (CD63+/CD81+) are enriched in cancer cell lines and patient plasma samples. In addition, we used IFCM to detect tumour-specific GFP-labelled EVs in the blood of mice bearing syngeneic intracerebral gliomas, indicating that this technique allows unprecedented disease modelling. In summary, our study highlights the heterogeneous and adaptable nature of EVs according to their marker profile and demonstrates that IFCM facilitates multiparametric phenotyping of EVs not only in vitro but also in patient plasma at a single EV level, with the potential for future functional studies and clinically relevant applications.
Abbreviation: EDTA = ethylenediamine tetraacetic acid
Introduction
The majority of cancer cells, including malignant glioma cells, shed extracellular vesicles (EVs) into the tumour microenvironment and the blood circulation [Citation1–Citation5]. EVs are nano-sized particles (typically <1000 nm in size) that contain proteins and nucleic acids as well as lipids. Their content reflects the cell of origin, so that EVs can serve as a source of genetic and biologically active cellular material [Citation5,Citation6]. An advantage of EVs is that their molecular cargo is protected from fragmentation and enzymatic degradation by the membranous enclosure, rendering circulating EVs better candidates than free circulating tumour DNA (ctDNA) or RNA as biomarkers to define disease subgroups, stratify patients and monitor therapy outcome by liquid biopsy [Citation7,Citation8]. Beyond their value as biomarkers in cancer [Citation3,Citation9,Citation10], EVs have further been postulated to play an active role in shaping the tumour microenvironment [Citation2,Citation11] and to have therapeutic potential [Citation12–Citation14].
While EVs can readily be isolated from cell culture media and almost all body fluids, their small size has previously required bulk analyses through Western blotting, ELISA, nPLEX, µNMR and bead-based flow cytometry or – with limited parameters – nanoparticle tracking analysis (NTA) [Citation15–Citation19]. However, since EVs are also shed by normal host cells, preparations of circulating EVs from patient plasma or other body fluids are invariably “contaminated” by non tumour-derived EVs and these preparations are not suitable for rare mutation detection, treatment monitoring and precise analyses of single EVs. In glioma patients, EVs from blood and cerebrospinal fluid (CSF) were found to contain transcripts encoding the mutated tumour-specific variant of the epidermal growth factor receptor EGFRvIII as well as the corresponding protein [Citation4,Citation6,Citation20]. In addition, EVs in CSF and plasma can contain mutant IDH1 transcripts and DNA [Citation21,Citation22]. However, all of these molecular analyses were performed on bulk EV preparations, which do unfortunately not permit a more comprehensive assessment of the full range of genetic, epigenetic, transcriptional and proteomic alterations in tumour-derived circulating EVs by methods such as next generation DNA and RNA sequencing, methylation array or mass spectrometry. Such analyses would require more sophisticated techniques that allow identification and enrichment of tumour-derived EVs to reduce signals derived from normal host cells.
IFCM has been utilized to visualize and track EV-uptake inside cells and more recently to monitor the binding capacity of EVs to the cellular outer membrane [Citation23]. However, multiparameter surface protein analysis on single vesicles by IFCM has proven to be far more challenging [Citation24–Citation26]. In this paper, we describe the application of IFCM for multiparameter single EV analysis of glioma EVs, facilitating the detection and quantification of EV subpopulations within different types of samples including clinically relevant patient samples. EVs were stained with a robust immunofluorescence protocol, and unbound excessive antibodies were eliminated through concurrent membrane filtration prior to IFCM analysis. We furthermore validate the suitability of commercially available fluorophore-conjugated antibodies for single EVs detection by correlative light- and electronmicroscopy (CLEM). In summary, we optimized multiparameter IFCM analysis with an AMNIS ImageStreamX Mark II instrument through the integration of distinct software settings for a robust, practical and simple single-EV characterization. This technique allows the detection and precise quantification of EV subpopulations secreted from malignant gliomas as well as other cancer types, presenting a robust assay that defines the basis, for future characterization and isolation of tumour-specific EV populations, which are highly needed for tumour-specific molecular analysis.
Materials and methods
Human specimens
Patient tumour and blood samples were obtained as approved by the medical ethics committee of the Chamber of Physicians in Hamburg. Informed consent was obtained from all patients. Ethylenediamine tetraacetic acid (EDTA) was used as anti-coagulant for all plasma samples. Peripheral blood mononuclear cells (PBMCs) were isolated from heparin anti-coagulated venous blood of healthy donors using Ficoll gradient (Sigma-Aldrich). All experiments were performed in accordance with local guidelines and regulations.
Cell culture
Human glioblastoma stem-like cells (GS-5, GS-8, GS-57, GS-60, GS-74, BT112, NCH644, GSC168, GSC233, GSC407) were cultured as neurospheres in stem cell medium, consisting of Neurobasal Medium (NBM, Invitrogen) supplemented with 1% Glutamine (Invitrogen), 2% B27 (Invitrogen) and 20 ng/mL each of epidermal growth factor and fibroblast growth factor–2 (PeproTech), as described previously [Citation2]. Lung (H441, H579, H1975), prostate (LNaCP), and melanoma (SK-MEL28) cell lines were cultured in RPMI-1640 (PAN Biotech™) with 10% FBS (Invitrogen). Breast cancer lines (MCF7, MDA-MB-468, SKBR3) and the BS153 glioblastoma cell line were cultured in DMEM (Invitrogen) medium with 10% FBS (Invitrogen). Prior to EV isolation, cells requiring serum were washed 3× with PBS and cultured in RPMI-1640 or DMEM supplemented with Exosome-Depleted FBS (Invitrogen #A2720801) for 48 h.
PBMCs were isolated by density gradient centrifugation from buffy coats obtained from the Blood Bank at the University Medical Centre Hamburg-Eppendorf. CD8 and CD4 T-cells were purified from PBMCs using magnetic bead-based negative selection (EasySep Negative Selection Kits, Stemcell Technologies).
Endothelial cells (HUVEC, Clonetics) were cultured in M199 with 20% FBS.
Murine glioma cell lines (GL261 and CT2A) were stably transduced with PalmGFP as described previously [Citation2,Citation3], sorted using fluorescence activated cell sorting (FACS) and cultured in DMEM with 10% FBS (Invitrogen).
Isolation and size analysis of EVs
Conditioned medium and plasma (EDTA) were collected, and EVs were isolated by differential centrifugation as described previously [Citation2,Citation3]. Briefly, conditioned medium was centrifuged at 200 x g for 5 min to eliminate cells, followed by filtration through 0.22 µm filters (Millipore). Plasma were centrifuged at 15,000 × g for 15 min. EVs were pelleted from supernatants by ultracentrifugation (Thermo Fisher Scientific, TW60i) at 100,000 × g for 70 min and washed with PBS. The concentration and size of EVs was determined by NTA, using an LM14 instrument (NanoSight, Malvern) equipped with a 638 nm laser and a Merlin F-033B IRF camera (Adept electronic solution). EV-enriched samples were diluted 1:300 in PBS prior to NTA. Quadruple 1-min movies were recorded on camera level 15, and then analysed with detection threshold 4 in NTA 3.2 Build 16. All NTA EV size data is presented as mode values.
EV labelling and data acquisition
EVs isolated from cell culture supernatants (concentration 1 × 10¹⁰ to 1×10¹¹/ml) were stained in filtered PBS, containing 2% Exosome-depleted FBS supplemented with protease-inhibitor and phosphatase-inhibitor. 100 µl of plasma were used to isolate EVs for the analysis of circulating EVs. Antibodies used to stain human EVs were anti-CD9, clone MZ3 (4 µg/ml); anti-CD63, H5C6 (40 ug/ml); anti-CD81, clone 5A6 (40 µg/ml) and isotype control, MOPC-21 (500 µg/ml); all antibodies were pre-conjugated to either FITC, PE or PacBlue (Biolegend) except for anti-CD9 PacBlue, clone MM2/57 (40 µg/ml). Antibodies for the analyses of murine samples were anti-CD9, clone MZ3 (50 µg/ml, Biolegend); anti-CD63, clone: NVG2 (200 µg/ml, Biolegend); anti-CD81, clone: EAT2 (30 µg/ml, Miltenyi). EVs and antibodies were added in equivalent volumes (total 12 µl) and stained for 45 min at RT in the dark. EVs were then washed using a 300 kDa filter (Nanosep) and re-suspended in washing buffer (0.2 µm-filtered PBS + 2% Exosome-depleted-FBS) for IFCM analysis. For control purposes, EVs were lysed by NP40 (0.5%) for 30 min at RT as described previously [Citation27]. Data were acquired on an AMNIS ImageStreamX Mark II Flow Cytometer (AMNIS/Millipore, Seattle). Laser powers were adjusted so that the fluorophore intensity was well inside the detection range or run at maximum power (405 nm: 175 mW; 488 nm: 145 mW; 561 nm: 90 mW; 642 nm: 145 mW). Fluorescent signals were collected as follows: PacificBlue was measured in channel 7 (435–505 nm filter), FITC was measured in channel 2 (480–560 nm filter), Phycoerythrin (PE) was detected in channel 3 (560–595 nm filter) and Allophycocyanin (APC) was detected in channel 11 (642–745 nm, filter). All readings were acquired at 60x magnification collected at low flow rate. Data analysis was performed using IDEAS software v6.2. A uniform gating strategy was applied: (a) all fluorescent events were plotted against the side scatter (Ch06), (b) all events that showed low SSC (<500) but a fluorescent intensity were used for further analysis (>10,000 events were acquired), (c) inspire masking was used for Ch01 and Ch09 to detect any events that showed a brightfield image, (d) a new feature was created by using the Raw Max Pixel feature on the created inspire mask for Ch01 and Ch09 to exclude any events that had a brightfield image, (e) inspire masking was used to detect any fluorescent image in the recorded channels (Ch02, Ch03, Ch07, and Ch11), (f) swarm detection was excluded by using the spot counting feature on the inspire mask for Ch02, Ch03, Ch07 and Ch11 and by eliminating any events that showed more than 1 spot, and (g) all remaining events were labelled as single EVs and analysed for their multiparameter signals. Positive EV counts were calculated as the fraction of EVs positive for each tetraspanin in relation to all EVs captured by either anti-CD9, -CD63 and -CD81 staining.
Flow cytometry and IFCM on cells
Non-tumorous and tumour cells were permeabilized using Fixation/Permeabilization solution (BD Bioscience, San José) for 20 min at 4°C, washed once with Perm/Wash Buffer (BD Bioscience, San José) and subsequently stained with CD9 (PE, 1:300), CD63 (PacBlue, 1:200) and CD81 (FITC, 1:200) for 45 min at RT in the dark. Data were acquired at a BD Fortessa (BD Biosciences, San Jose) as well as a AMNIS ImageStreamX Mark II Imaging Flow Cytometer (AMNIS/Millipore, Seattle). Isotype controls were used to verify the expression of each tetraspanin. Expression of each tetraspanin is shown as MFI for each epitope alone. For IFCM analyses, calculation of the similarity score (the log-transformed Pearson’s correlation coefficient measuring the spatial linear correlation between the bright regions of two stains within a cell mask) [Citation28] was performed by using the Amnis IDEAS software. Six different non-cancerous cell types and 16 cancerous cells types were analysed for their similarity score, while we gated on 10,000 cells in each cell type.
Correlative light- and electron microscopy
For correlative light-electron microscopy (CLEM) the samples were adsorbed to glow discharged carbon coated nickel grids (EMS 215–412-8400), washed 3× with PBS and fixed with 2.5% Glutaraldehyde in PBS. After 3× washes with PBS 0.2 µm latex beads (ThermoFisher F8807, diluted 1:100) were adsorbed to each grid, followed by 3× washing in PBS and fixation in 2.5% Glutaraldehyde. The grids were placed face down in water in glass bottom dishes (MatTek, 35 mm, No.1.5) and investigated by confocal laser scanning microscopy (CLSM). Fluorescence and DIC images were acquired with a Nikon A1+ confocal microscope with a 60×/1.4 oil immersion objective at Nyquist sampling rate (42 nm/pixel). Thereafter 20 iterations of Richardson-Lucy deconvolution (Nikon NIS-Elements v.4.51) were applied for image restoration. After CLSM the grids were stained with 1% uranyl acetate in water and investigated by transmission electron microscopy (TEM). The central grid area was used for re-localization in TEM. TEM images were acquired either with a SIS Veleta camera mounted on a FEI Tecnai G20 microscope or with a Gatan MSC794 camera mounted on a Philips CM120 microscope operated at 80 kV. Overlays and alignment were done manually in Photoshop CC 2015 (Adobe).
Quantitative PCR
Quantitative PCR (qPCR) was performed as previously described [Citation2,Citation3]. Total RNA was extracted using Trizol (Invitrogen) and treated with RNase-free DNase (Qiagen). mRNA expression analysis was carried out using Power SYBR Green (Applied Biosystems) and a 7500 Fast Real-Time PCR System (Applied Biosystems). See Supplementary Table 1 for primer sequences. Relative amounts of target mRNA were normalized to 18S as internal control (∆CT). Values were calibrated according to the ΔΔCT method, and relative quantity (RQ) values were calculated by normalizing each individual cell line to cells under normoxia.
In vivo studies
All animal work was approved by the authorities for health and consumer protection in Hamburg, Germany. GL261-PalmGFP or CT2A-PalmGFP glioma cells (1x10⁵ cells in 2 µl PBS) were injected into the caudate/putamen of six-week-old female C57BL/6 mice (Jackson Laboratory) to establish mouse brain tumours. To isolate EVs from the blood circulation, mice were injected with 1 ml of PBS in the left heart ventricle and blood was drained from the right ventricle. Blood samples were immediately centrifuged at 500 × g for 7 min and at 15.000 × g for 15 min at 4°C. Plasma samples were stored in the dark and frozen at −80°C.
Animal MRI
Tumour growth of intracerebral glioma-bearing mice was evaluated on a 7T MR imaging system (ClinScan, Bruker). Mice were anesthetized with 1% isoflurane (Baxter) in oxygen (0.5 l/min). Respiratory rates were monitored using a small animal vital sign monitor (SA Instruments Inc.). Axial 2D T2 weighted turbo spin echo images were acquired to assess tumour location and size. Sequence parameter were: TE = 39 ms, TR = 2500 ms, BW = 250 Hz/pixel, turbo factor 7, matrix = 256 × 192, FOV = 20 × 15 mm2, 19 slices, 0.4 mm slice thickness with 0.1 mm gap.
Bioinformatic analysis
Gene expression values and clinical data were downloaded from the TCGA data portal (https://tcga-data.nci.nih.gov/docs/publications/tcga/) [Citation29], and were analysed through the GlioVis portal (gliovis.bioinfo.cnio.es). RNA-Seq data were analysed for CD9, CD63 and CD81 expression using the adult TCGA-GBM dataset for all non-G-CIMP tumours (n = 146). Log-rank tests were conducted for survival analysis with the cut-off set at the mRNA-expression median.
Statistical analysis
Data are expressed as mean ± SD. The unpaired two-tailed Student’s t-test was used for comparisons between two groups. Each group was tested for Gaussian distribution if one-way ANOVA was passed, followed by Bonferroni’s test. If this failed, the Kruskal-Wallis test followed by Dunn’s correction was conducted to test for significance among multiple groups. Statistical analyses were performed using Microsoft Office Excel 2011 or Graph Pad Prism 6 software. p < 0.05 was considered statistically significant.
Results
Quantification of circulating EVs in brain tumour patients
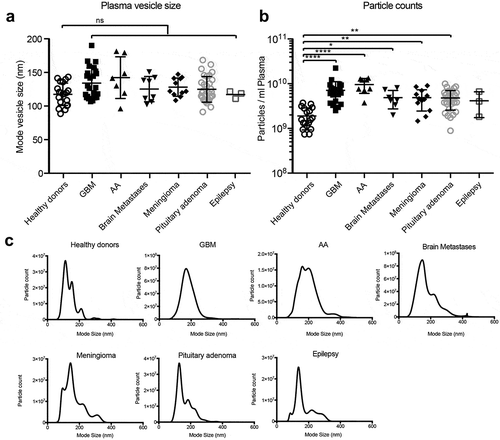
To quantify circulating EVs in brain tumour patients, we isolated vesicles from plasma samples of patients with glioblastoma (WHO malignancy grade IV), anaplastic astrocytoma (WHO grade III), brain metastases, meningioma (WHO grade I) or pituitary adenoma by ultracentrifugation and compared these to vesicles from healthy donors as well as patients with epilepsy. NTA analysis revealed that particle sizes were well within the reported range of circulating EVs (mode particle size of groups 116–141 nm), with no significant differences between groups () Interestingly, patients suffering from glioblastoma, anaplastic astrocytoma, brain metastasis, meningioma or pituitary adenoma displayed elevated circulating particle counts per ml of plasma compared to healthy donors (e.g. 3.7-fold increase in glioblastoma) ().
Figure 1. Cancer patients have elevated circulating nanoparticles. (a) Circulating plasma particles were analysed by NTA. Sizes of plasma particles did not differ significantly between groups. (b) Patients with glioblastoma (GBM), anaplastic astrocytoma (AA), brain metastasis and meningioma display elevated circulating particle counts. (c) Representative NTA graphs are shown. ANOVA, posthoc Bonferroni/Dunn was performed for multiple group comparison (**** = p < 0.001, *** = p < 0.001; ** = p < 0.01; * = p < 0.05) .
Tetraspanin expression in human glioblastoma tissue
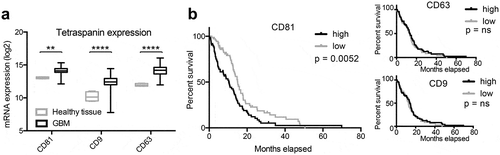
Since NTA analysis does not only detect vesicular particles but can also detect protein complexes, lipoproteins and other small particles [Citation30,Citation31], we aimed to further characterize the particle populations in different groups. The tetraspanins CD9, CD63 and CD81 are considered to be specific EV markers that are ubiquitously present on EVs from most cell types [Citation32–Citation35], even though a fraction of EVs might be devoid of these tetraspanins [Citation35]. Studies in other types of cancer showed that high tetraspanin expression is correlated with a poorer prognosis and worse overall survival [Citation36–Citation38]. To first assess tetraspanin expression in human glioblastomas, we analysed the TCGA database and discovered that also in glioblastoma tissue transcript levels of CD9, CD63 and CD81 are upregulated, however, only CD81 expression is significantly associated with decreased overall survival (). In order to perform a more detailed multiparametric analysis of circulating nanoparticles based on these tetraspanin markers, we decided to employ IFCM using an AMNIS ImageStreamX Mark II Imaging flow cytometer.
Figure 2. Tetraspanin expression is elevated in glioblastoma tissue. (a) The expression of CD81, CD9 and CD63 is elevated in human glioblastoma (GBM) tissue as determined by analysing the TCGA database. (b) Glioblastoma patients with elevated CD81 expression show decreased survival, whereas CD63 and CD9 expression levels do not correlate with survival. mRNA expression levels and clinical data were obtained and analysed through the GlioVis portal (http://gliovis.bioinfo.cnio.es).
Defining detection parameters for single particle analysis
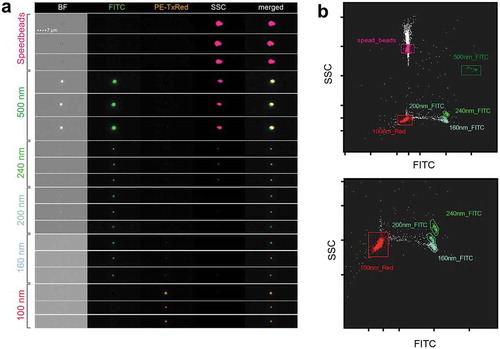
To set up IFCM for EV analysis, we first measured a set of fluorescent beads with defined sizes between 100 and 500 nm. We observed a clear separation between all bead subsets and thereby defined basic settings and gating strategies for submicron particle analysis. Parameters were set mainly based on low SSC signals and the absence of brightfield (BF) signals, while still detecting clear fluorescent dots in respective detection channels (). Our bead results do not allow a direct size comparison with submicron biological particles such as EVs due to their different refractive indexes, but they facilitate an approximation for defining parameters that are suitable for EV analysis.
Figure 3. IFCM detects multi-coloured nano-scaled beads. (a) Heterogeneous fluorescent beads were analysed by IFCM. 500, 240, 200 and 160 nm beads can be discriminated through their characteristics in brightfield (BF), fluorescent intensity (FITC/PE) and sideward scatter (SSC). Note that 500 nm beads are visible in BF, SSC and FITC while at 200 nm beads lose their SSC intensity and the BF image is lost at 160 nm. Fluorescence is still detected on 100 nm beads. (b) According to their SSC and GFP intensity, heterogeneous fluorescent beads can be discriminated by IFCM. Speed beads as well as all types of smaller beads can be separated by their fluorescence intensity and SSC intensity. Top, complete dotplot; bottom, zoom-in for better visibility.
IFCM allows the detection of multiple parameters on single EVs
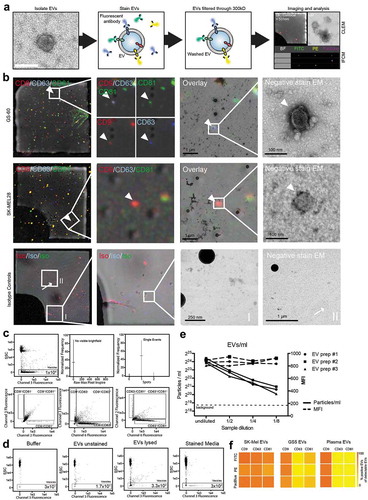
In a second step, we isolated EVs, including exosomes and microvesicles, which are in the size range of the 100–160 nm, from cell culture media and stained these using fluorescent-labelled antibodies against CD9, CD63 and CD81. In order to eliminate excessive antibodies, which could contribute to background in IFCM analysis, we established a protocol to remove unbound antibodies from stained EV samples. Antibody removal is achieved by washing in 0.2 µm filtered PBS + 2% EV-depleted FBS with a subsequent filtration through 300 kD filters which retain EVs (). Correlative light and electron microscopy (CLEM) was used to validate that fluorescent antibodies bind to EVs and are not detected as coincidence events. Latex 200 nm beads were spiked into the sample () before acquisition of confocal laser microscopy images. This allowed us to relocate the fluorescent signal in subsequent electron microscopy imaging and correlate it with single vesicular structures. Indeed, CD9, CD63 and CD81 fluorescent-labelled antibodies stained single EVs in a multiparametric surface protein fashion and allowed the detection of triple positive EVs (upper panel) as well as single positive EVs (middle panel). In contrast, fluorescent isotype control antibodies showed no correlation of detectable fluorescence with single vesicular structures (lower panel ). Fluorescent dots without correlation to any clear structure in electron microscopy images most likely represent antibodies that adhered to the grid, or membrane particles of disrupted EVs (or both). These findings demonstrate through an elaborate innovative technology that small EVs can indeed be labelled by multiple fluorescence-coupled antibodies that are indistinguishable through size based. IFCM clearly allowed the detection of CD9, CD63 and CD81 single positive events, with nanoparticle-characteristic parameters (i.e. absence of detectable brightfield and low SSC detectability), (). To avoid the detection of unspecific events and coincidence of particles we applied an automated workflow through the IDEAS software () that includes mask and feature improvements. To prove specific EV labelling, we performed a series of control experiments illustrated in , including isotype controls and lysis of EVs. We further tested decreasing dilutions of different EV samples to verify that the measured signals depend on the presence of EVs (), with all dilutions still being above background levels of all controls measured. Measurements of serial dilutions demonstrated a linear decrease of EV concentrations while the fluorescence intensities of the events within the vesicle gate were stable. This indicates the absence of coincidence, aggregates or swarm detection and supports that this method provides single vesicle resolution, as also addressed by other groups [Citation24,Citation26,Citation39]. In addition, EVs were stained with antibodies against CD9, CD63 and CD81, coupled with either FITC, PE or PacBlue (). Only minor differences in the detection of tetraspanin-positive EVs were found for the three different fluorescent conjugates, indicating that the detection sensitivities are similar and comparable.
Figure 4. Analysis of single EVs by CLEM and IFCM. (a) Workflow of EV labelling. EVs are isolated from glioblastoma cell culture medium, stained and subsequently washed by using a 300 kDa filter before being analysed by correlative light and electron microscopy (CLEM) and IFCM (representative images). (b) CLEM of CD9 (red), CD63 (blue) and CD81 (green) stained EVs from two different cell lines. 200 nm beads were spiked into the sample for spatial orientation in transmission electron microscopy (TEM). White arrowheads indicate fluorescence positive single EVs and mark an example of a triple positive EV (GS-60) as well as an example of a single positive EV (SK-MEL28). White arrows indicate fluorescence positive events that do not appear as EV-like structures in TEM. (c) IFCM allows the detection of CD9, CD63 and CD81 positive EVs. Gating strategy for EV analysis. (d) Controls for anti-CD81 (FITC) and anti-CD63 (PacBlue) EV staining measured by IFCM include (i) buffer only, (ii) unstained EVs and (iii) EVs lysed with NP40 (0.5% for 30 min) and stained medium, acquired for the same time as stained EVs. Representative IFCM pictures are shown. (e) Three individual EV preparations from plasma of healthy donors were analysed for their EV concentration and mean fluorescence intensity (MFI) of anti-CD9-PE stained EVs by IFCM in serial dilutions. Positive events found in stained media were used as background control. (f) EVs from SK-MEL28, GSC5 and plasma samples were stained with antibodies against CD9, CD63 and CD81 coupled with FITC, PE or PacBlue in concentrations described in the materials and methods.
Analysis of tetraspanin profiles on cells and EVs by IFCM
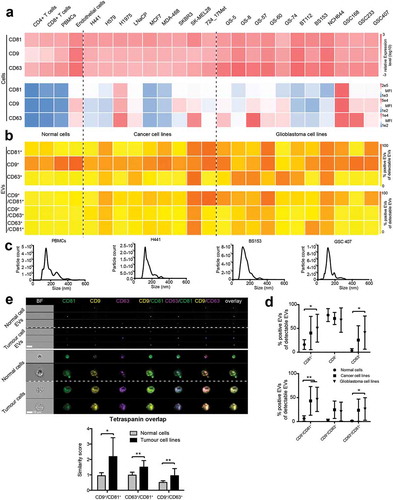
After establishing that IFCM can be used to detect different tetraspanins on single EVs, we analysed EVs derived from human cancer cell lines and non-tumour cells as well as the cells themselves for their cellular and EV tetraspanin expression profiles. First, we performed qPCR and conventional flow cytometry (FCM) analysis on permeabilized cells for CD9, CD63 and CD81 in glioblastoma cell lines, various epithelial cancer cell lines and in non-tumour cells, including PBMCs, T-cells and endothelial cells (). CD9, CD63 and CD81 were found to be expressed in all cell types, and highest levels of all three tetraspanins were detected in cancerous cell lines. Second, we isolated EVs from all cell lines and analysed their tetraspanin profiles by IFCM and their size distribution by NTA (). Tetraspanin protein expression on EVs did not correlate with gene or protein expression levels in the cell of origin, suggesting that EV packaging is driven by a specific machinery and that the loading of tetraspanins into EVs is not random (). While the proportion of CD9+ EVs did only slightly differ between groups, cancer cell lines and even more so glioblastoma cell lines secreted significantly elevated proportions of CD81+ and CD63+ EVs (). Moreover, EVs from cancer cell lines and glioblastoma cell lines, comprised elevated amounts of double positive CD9+/CD81+ and CD63+/CD81+ EVs, whereas EVs from normal cells virtually never displayed any relevant double positivity for tetraspanin markers (). We further analysed the expression and localization of CD9, CD63 and CD81 in our panel of tumour cell lines by IFCM, as conventional FCM are unable to detect spatial distribution patterns, and compared these profiles to normal cells. In tumour cells, tetraspanin expression showed a higher spatial overlap compared to normal cells (), indicating that the tetraspanin co-localization profiles on EVs reflect the parental cells.
Figure 5. Tetraspanin profiles of tumour cell lines and secreted EVs. (a) Non-tumour cells, cancer cell lines and glioblastoma cell lines were analysed for CD9, CD63 and CD81 expression by qPCR (upper panel) and by conventional flow cytometry on permeabilized cells (lower panel). Every cell type expresses all three tetraspanins. Relative amounts of target mRNA were normalized to 18S as internal control. Transcript levels were normalized to CD81 expression in CD4+ T-cells. All experiments were run as triplicates (qPCR) or duplicates (flow cytometry); mean relative expression values and mean fluorescence intensity (MFI), respectively, are shown. (b) EVs secreted from the same cell types were analysed by IFCM for CD9, CD63 and CD81 (top). Double positive EVs (CD81+/CD9+, CD9+/CD63+, CD81+/CD63+) are depicted below. Positive EV counts were calculated as the fraction of EVs positive for a tetraspanin in relation to all EVs captured by either anti-CD9, -CD63 or -CD81. All experiments were performed in duplicate and mean values are shown. (c) Representative NTA analysis of non-tumour cells and tumour cell line-derived EVs. (d) Groupwise comparisons of the data presented for individual samples in B). Values are means ± SD. (e) Representative IFCM for EVs and corresponding permeabllized cells of origin (left). Note that tumour cells display an increased spatial overlap of CD9, CD63 and CD81 expression, as indicated by the similarity score analysis (right). Results are representative of at least three biological repeat experiments. Individual student’s t-test was performed to compare two groups (** = p < 0.01; * = p < 0.05) .
Stimulation-dependent changes of CD81, CD9 and CD63 on glioblastoma EVs
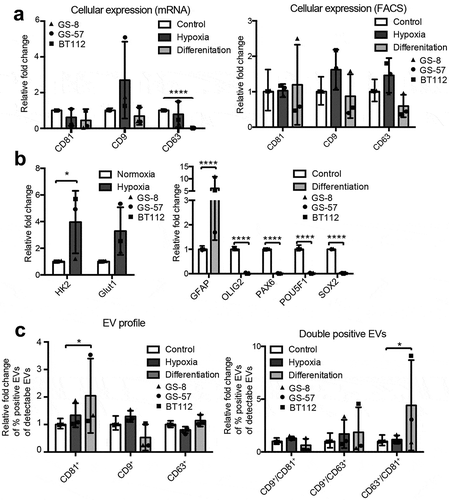
Since glioblastomas are highly hypoxic tumours and the expression of hypoxia markers correlates with a worse prognosis [Citation40–Citation42], we determined whether tetraspanin profiles of glioblastoma cells and corresponding EVs are altered by hypoxia. Three different glioblastoma cell lines (GS-8, GS-57, BT112) were incubated under hypoxic conditions (0.1% O2), and for comparison also under differentiating conditions (medium containing FBS). Under hypoxia, we observed a (non-significant) trend towards increased cellular CD9 mRNA and protein expression as evaluated by FCM, while in differentiating conditions CD63 expression decreased significantly (). Hypoxic cell adaptation was confirmed by the induction of HK2 and GLUT1, and differentiating conditions were confirmed by elevated expression of the astrocytic marker GFAP as well as decreased expression of stem cell markers (OLIG2, PAX6, POU5F1 and SOX2) (). Tetraspanin profiles of EVs secreted from the same cell lines were analysed by IFCM. The secretion of CD81+ EVs as well as of double positive CD63+/CD81+ EVs was significantly increased under differentiating conditions, whereas hypoxia had no significant effect (). These findings demonstrate that tetraspanin profiles on EVs do not necessarily match the cellular response measured by qPCR, indicating that the combination of tetraspanin surface marker on EVs is specifically regulated in a dynamic way based on the cell activity and reaction to the microenvironment.
Figure 6. Cellular and vesicular tetraspanin responses to various cell stimuli. (a) Three glioblastoma cell lines (GS-8 (triangle), GS-57 (circle), BT112 (square)) were cultured under hypoxic conditions (0.1% O2) or differentiating condition (medium containing EV-depleted FBS). Cellular CD81, CD9 and CD63 expression was measured by qPCR, and transcript levels were normalized to 18S. Expression values of pooled GS-8, GS-57 and BT112 cells are shown as means + SD and were normalized to cells under normoxia. (b) Hypoxic cell adaptation was confirmed by induction HK2 and GLUT1, and differentiation was confirmed by elevated expression of GFAP as well as downregulation of OLIG2, PAX6, POU5F1 and SOX2. Expression values of pooled GS-8, GS-57 and BT112 are shown as means + SD. (c) Corresponding EVs were analysed for CD81, CD9 and CD63 by IFCM, and single (left) as well as double (right) positive EVs are shown and calculated as fraction of positive EVs of CD9, CD63 or CD81 positive EVs. EV profiles of GS-8, GS-57 and BT112 were pooled and values are shown as mean + SD normalized to cells under normoxia. Results are representative of at least three biological repeat experiments. ANOVA, posthoc Bonferroni was performed for multiple group comparisons and student’s t-test was performed to compare two individual groups (**** = p < 0.0001, *** = p < 0.001, ** = p < 0.01; * = p < 0.05) .
Multiparametric analysis of patient plasma EVs by IFCM
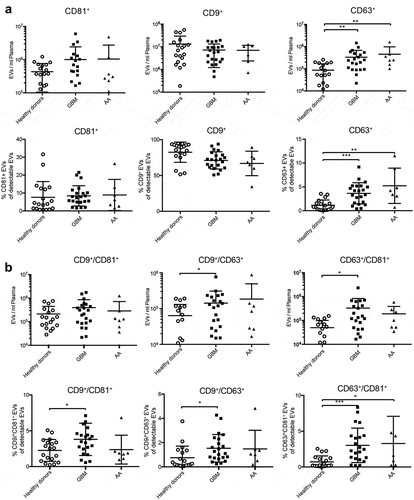
Since we observed that patients suffering from glioblastoma and anaplastic astrocytoma have elevated circulating particle counts () and that glioblastoma cells lines secrete EVs with different tetraspanin profiles than normal cells and other cancer cell lines (), we next asked whether tetraspanin profiles are also altered on circulating EVs from glioblastoma patients. IFCM analysis of EVs expressing CD9, CD63 or CD81 isolated from patient plasma revealed significantly increased levels of CD63+ EVs in patients with glioblastoma and anaplastic astrocytoma compared to healthy donors, with a similar (but non-significant) trend observed for CD81 (). The majority of circulating EVs expressing CD9, CD63 or CD81, were positive for CD9 in patients and in healthy individuals, whereas the proportions of CD81+ and CD63+ EVs were both in a far lower range of 1–20% with our antibody cocktail. The total numbers of double positive CD63+/CD81+ and CD9+/CD63+ EVs were also increased in glioblastoma patients, and the percentage of all three different double positive EV fractions was elevated, with the combination of CD63+/CD81+ being the most significant ().
Figure 7. Tetraspanin profiles of circulating EVs in glioblastoma patients. (a) Plasma EVs from healthy donors and patients with glioblastoma (GBM) or anaplastic astrocytoma (AA) were analysed for CD9, CD81 and CD63 by IFCM. Positive EV counts were calculated as the fraction of EVs positive for a tetraspanin in relation to all EVs captured by anti-CD9, -CD63 or -CD81. Both patient groups display significantly higher numbers of circulating CD63+ EVs (top) as well as an increased proportion of CD63+ EVs among all total plasma EVs (bottom). (b) Double positive CD63+/CD81+ and CD9+/CD63+ plasma EV levels are elevated in glioblastoma patients (top), and the proportion of all possible combinations of double positive EVs is increased compared to healthy donors. ANOVA, posthoc Bonferroni was performed for multiple group comparisons. *** = p < 0.001; ** = p < 0.01; * = p < 0.05.
Detection of glioma-derived EVs in the circulation of mice by IFCM
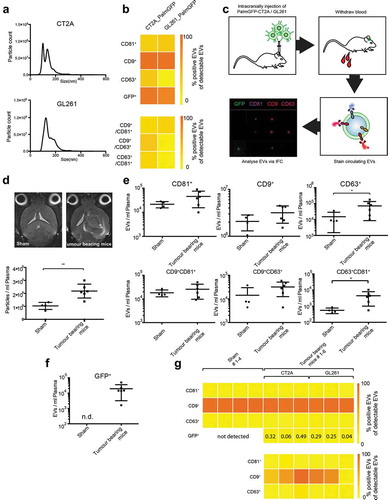
To investigate whether we can detect glioma EVs that are released into the circulation and identify their tetraspanin profiles in a murine model, we injected syngeneic glioma cell lines into the brains of C57BL/6 mice. Murine glioma cell lines GL261 and CT2A were transduced with palmitoylated GFP (palmGFP) [Citation43], enabling the detection of fluorescently labelled GFP+ tumour EVs, and the secreted EVs were first characterized in vitro. The size of EVs secreted from both cell line was in the range of 100–150 nm, as measured by NTA (). IFCM revealed strong co-expression of CD9 and GFP on EVs derived from both cell lines, and CT2A cells secreted higher amounts of double positive CD9+/CD63+ and CD63+/CD81+ EVs compared to GL261 cells (). Following intracranial injection of CT2A-palmGPF and GL261-palmGFP cells, blood was withdrawn after 14 and 21 days, and plasma EVs were isolated and analysed by NTA and IFCM (). Similar to human glioblastoma patients, tumour-bearing mice displayed elevated amounts of circulating particles as seen in (2.1-fold increase). Here again, we found that the majority of plasma EVs with the applied antibody cocktail, were CD9 positive compared to only minor fractions of CD81+ and CD63+ EVs. Notably, levels of CD63+ as well as CD63+/CD81+ double positive plasma EVs were increased in tumour-bearing mice in comparison to sham-operated animals (), mimicking our observations on human glioma plasma EVs shown in . In order to restrict our analysis to tumour-derived EVs only, we quantified the fraction of GFP+ EVs, which turned out to be rather low, ranging between 0.04 to 0.49% of total plasma EVs (). Circulating GFP+ EVs mimicked the expression of their parental cell line EVs in so far as most EVs were strongly positive for CD9 and in mice bearing CT2A tumours also CD63+/GFP+ EVs could be detected ().
Figure 8. IFCM allows tracking of circulating tumour EVs in a mouse glioma model. (a) NTA analysis of EVs secreted from PalmGFP-CT2A and PalmGFP-GL261 cells in vitro. (b) IFCM analysis shows strong expression of CD9 and GFP on the secreted EVs (top). Positive EV counts were calculated as the fraction of EVs positive for a tetraspanin in relation to all EVs captured by anti-CD9, -CD63 or -CD81. Similar amounts of CD81+/CD9+ EVs were detected in both cell lines, while higher percentages of EVs from CT2A cells are double positive for CD9+/CD63+ and CD81+/CD63+ compared to GL261 cells (bottom). (c) Workflow of tumour cell injection and IFCM detection of murine plasma EVs. (d) Tumour-bearing mice display elevated plasma EV counts compared to sham-injected mice, as measured by NTA analysis. Top, MRI images of injected mice; bottom, plasma particle counts. (Tumour-bearing mice consist of pooled GL261 and CT2A injected mice.) (e) Tetraspanin profiles of plasma EVs measured by IFCM. Tumour-bearing mice show elevated CD63+ EVs as well as double positive CD81+/CD63+ EVs. (f) GFP+ positive EVs were detected in plasma of tumour-bearing mice but not detectable (n.d.) in sham-operated animals. (g) Top, percentage expression of tetraspanin markers and of GFP on total plasma EVs. GPF+ EVs constitute between 0.04% and 0.49% in different mice. Bottom, tetraspanin expression on GFP+ glioma-derived EVs. Student’s t-test was performed to compare two groups. ** = p < 0.01; * = p < 0.05.
Collectively, these findings suggest that IFCM can be used to stain and analyse EVs for multiple antigens from both cell culture media and plasma, thus highlighting its potential for the monitoring and classification of plasma EVs in cancer.
Discussion
A major clinical hurdle in cancer lies in the detection of molecular and cellular changes in tumours during treatment for the evaluation of an eventual therapeutic response or resistance. While imaging technologies are emerging with better sensitivity and specificity, they are costly and often not applicable for frequent, short-interval sequential time points. As a result, an intense interest in biological material released by tumours, which can be obtained by liquid biopsy [Citation44], has been developed. Besides circulating tumour cells (CTCs) and circulating tumour DNA (ctDNA), as the most frequent analytes of liquid biopsy assays [Citation45–Citation47], EVs have received increasing attention over the past 5 years, which is also due to the fact that EVs are biomarkers with a biological function in cancer progression [Citation48]. However, current technologies do not yet allow sufficient specificity to characterize individual EVs, so that previous studies of EVs circulating in blood and other body fluids were usually performed on bulk EV preparations which are “contaminated” by normal host cell-derived EVs, resulting in low detection sensitivity of tumour-specific molecular alterations.
Here, we show that (i) brain tumour patients have elevated circulating plasma particle counts that (ii) can be analysed at a single EV level by IFCM; (iii) well know vesicle markers, CD9, CD63 and CD81 show cell type-specific EV profiles with (iv) an increase of double positivity (CD9+/CD81+, CD63+/CD81+) on EVs from cancer cells, which is partially reflected at the cellular level; (v) glioma patients show elevated circulating CD63+ EVs as well as double positive EVs, a finding that relates to the observation seen in our cell lines; (vi) circulating brain tumour-specific EVs are detectable in a syngeneic murine brain tumour model, indicating that glioma EVs can penetrate the blood brain barrier, which is partially disrupted in glioma [Citation49] and thus be detectable in the blood circulation. Together, these findings demonstrate the ability to detect and classify tumour-specific EVs through IFCM and to define individual EV subpopulations, which will be key for clinically oriented liquid biopsy strategies.
EVs are commonly identified by the tetraspanin family members CD9, CD63 and CD81, which are highly abundant on their surface [Citation32–Citation35], however, only few studies tried to understand the heterogeneity between different tetraspanin-positive EV subpopulations [Citation17,Citation35,Citation50,Citation51]. Kowal et al. showed that EVs from dendritic cells, which were immuno-isolated with beads binding to CD9, CD63 or CD81 positive EVs, had distinct protein profiles [Citation35], providing a first comprehensive map of EV subtypes and their biogenesis/secretion machinery. Other studies demonstrated that EVs from different cell types, including cultured cancer cells, can display distinct tetraspanin profiles [Citation50,Citation51], however, these studies also used bulk EV preparations to asses tetraspanin profiles by immunoblotting or Raman spectroscopy and were only performed in vitro. More recently, Lee et al. developed a novel technique to capture EVs on a microfluidic chip, which allows the immunostaining of fixed EVs at a single EV resolution level [Citation17]. While EVs secreted from glioma cell lines could convincingly be stained and quantified by this approach, it was, however, not demonstrated that this method is also applicable in vivo, and in particular to human patient material. We here demonstrate that IFCM is not only a robust method to analyse tetraspanin profiles on EVs secreted from tumour cells in vitro, but we also show that IFCM is capable of detecting and profiling circulating EVs from patient and murine blood in vivo in a multiplex fashion. Compared to conventional FCM which is not suitable for robust detection of submicron coincident events or to distinguish particles with similar size or density from EVs, IFCM can distinguish true single events from aggregates (EVs and antibody) and debris [Citation26,Citation52], minimizing false data interpretation. However, due to the lack of brightfield images and low side scatter values the recording of aggregates of small EVs can never be entirely excluded [Citation53]. In addition, the quality of antibodies and the fluorophore composition may impact the results of single IFCM-based EV analysis. To obtain reliable data with IFCM or methods with similar detection sensitivity, each antibody cocktail used containing labelled antibodies needs to be qualified and validated. For example it needs to be excluded that antibodies contain EVs from hybridoma cells, which have been co-purified with the antibodies. Furthermore, if not all antibody molecules in an antibody product are labelled successfully, non-labelled antibodies act as competitive inhibitors for labelled ones. Therefore it is crucial to stay with a given antibody cocktail for all experiments.
By analysing a large panel of different tumour cell lines, we discovered that the secretion of CD81+ and CD63+ EVs is significantly increased in glioblastoma cell lines and other cancer cell lines compared to non-tumour cells, while the proportion of CD9+ EVs does not differ between these groups. Moreover, glioblastoma cell lines secrete elevated levels of CD9+/CD81+ and CD63+/CD81+ EVs, whereas neither of these combinations is detectable at relevant levels on EVs from normal cells. Tetraspanin profiles on EVs are relatively stable under different microenvironmental conditions, such as hypoxia or differentiating conditions, and CD81+ EVs are even increased when glioblastoma cells are exposed to serum. These findings suggest that double positivity for surface tetraspanin markers can distinguish tumour cell-derived EVs from those of normal cells, at least from T-cells, PBMCs and endothelial cells that were included in our study.
Importantly, we found that not only in vitro but also in patients with glioblastoma and anaplastic astrocytoma the number and proportion of CD63+ circulating plasma EVs is significantly increased, with a similar trend for CD81+ EVs. In addition, the proportion of double positive CD63+/CD81+, CD9+/CD63+ and CD9+/CD81+ EVs is higher in glioblastoma patients than in healthy donors. Although CD63+ and CD81+ EVs represent only a minor fraction of the total plasma EV population while the vast majority is positive for CD9+, the lack of a difference in CD9 positivity in patients versus healthy donors indicates that CD63 and CD81 but not CD9 possess informative value in distinguishing glioma patients from healthy individuals. In particular, the combination of CD63+/CD81+ on circulating EVs turned out to be most significant and could not only discriminate glioblastoma patients from healthy controls but also patients with less-malignant anaplastic astrocytomas, fitting well with the observation that most EVs in plasma are derived from thrombocytes, being CD9+/CD81− [Citation32], as the amount of platelet EVs most likely would not differ between healthy donors and tumour patients.
Similar findings were obtained in our syngeneic mouse model. Again, while the majority of secreted EVs in vitro as well as in vivo were CD9+, the detection of CD63+ and in particular of CD63+/CD81+ double positive EVs was most discriminative in distinguishing tumour-bearing mice from sham-operated animals. We could further detect GFP+ EVs in the blood circulation, which were also mostly CD9+, while only smaller subpopulations were CD63+, in particular in the CT2A model. These findings demonstrate that glioma-derived EVs can cross the blood brain barrier (BBB), which is known to be partially disrupted in experimental orthotropic animal models of glioma [Citation54]. Also in human glioblastoma patients, the BBB is typically disrupted and tumour EVs can exit the brain, so that specific mutations, such as IDH1 R132 or EGFRvIII, are detectable in circulating plasma EVs [Citation4,Citation6,Citation20–Citation22]. However, our mouse model further revealed that tumour-derived GFP+ EVs constitute only a minor fraction (0.04–0.49%) of the total plasma EV population. Since the total number of circulating particles, as determined by NTA analysis, is strikingly elevated by more than 2-fold in tumour-bearing mice and almost 4-fold in human glioblastoma patients, it is highly likely that not only tumour-derived EVs but also EVs that are produced by other cells in reaction to the tumour presence contribute to the total circulating EV pool. It is well known that human glioblastomas are infiltrated by large numbers of reactive macrophages and microglial cells, which can comprise as many as 30%–50% of all total cells in human glioblastomas, and similar findings were reported in mice [Citation55]. Moreover, glioblastomas typically induce profound neoangiogenesis, involving the activation and proliferation of endothelial cells which also produce EVs that may enter the circulation. Further studies are necessary to quantify the exact proportion of bona fide tumour cell-derived EVs in patient blood. To this end, our identification of elevated circulating CD63+, and in particular double positive CD63+/CD81+ EVs circulating in glioblastoma patients, could help to enrich and immuno-isolate glioblastoma-derived EVs from patient plasma.
In conclusion, our study provides proof-of-principle for the feasible to identify distinct EV subpopulations that circulate in the blood of glioma patients by IFCM. A next important step will be to characterize these EV subpopulation in greater depth and also to identify additional EV surface markers that could facilitate a more precise detection and enrichment of tumour-specific EVs. Successful enrichment of circulating glioma-derived EVs can enable a more comprehensive analysis of DNA and RNA contained in circulating EVs by state-of-the-art techniques, such as next generation sequencing and methylation arrays. EVs as carriers of molecular information could thereby become a diagnostic tool to monitor disease status, treatment response, tumour adaptation and progression. Currently, glioma patients are followed by periodic MRI scans, and the detection of suspicious lesions requires invasive biopsy or tumour resection for diagnostic confirmation. EVs, which can easily be obtained by liquid biopsy, could become a non-invasive alternative to provide dynamic information on the tumour state and its molecular profile.
Author contribution
The manuscript was written through contributions of all authors. All authors approved of the final version of the manuscript. F.L.R. and C.L.M. conceived the idea, designed the experiments and wrote the manuscript. F.L.R, C.L.M., K.K. and M.H performed the experiments. R.R. designed and performed CLEM experiments. L.D. performed and interpreted MRI images and helped with the in vivo work, E.S, A.R., C.H. and A.B. performed in vitro cell isolation and culture, D.H.H. provided astrocytes and additional glioblastoma cell lines and assisted in writing the manuscript, J.F., T.M., N.O.S and S.P. acquired patient specimens and assisted in data analysis. K.P, S.G, S.K., M.G., X.O.B., S.L., E.A.C., B.G., A.G., B.F. and M.W. assisted with writing the manuscript, analysis of data and contributed relevant material and/or expertise and discussed the results. F.L.R. designed and assembled all figures. K.L designed the study, analysed data and wrote the paper.
Disclosure
A.G. received three travel awards (each 1000 USD) from Merck Millipore/Amnis Corporation. A.G. is a consultant for and has equity interests in Evox Therapeutics Ltd., Oxford, UK. B.G. is SAB member of Evox Therapeutics and Innovex Therapeutics. All other authors declare that no potential conflict of interest exists.
Supplemental Material
Download MS Excel (8.6 KB)Acknowledgments
The authors thank Keith Ligon for providing the BT112 glioblastoma cell line and Christel Herold-Mende for the NCH644 cell line. We further thank the FACS core facility and the Mouse Pathology Core Facility at the University Medical Center Hamburg-Eppendorf for help with cell sorting and tissue embedding, respectively. This work was funded by the Deutsche Forschungsgemeinschaft (scholarship to FLR RI2616/2-1), by the Anni Hofmann Stiftung (KL) and by ERANET GlioEX (MG).
Supplementary materials
Supplemental data for this article can be accessed here.
Additional information
Funding
Related Research Data
References
- de Vrij J, Maas SL, Kwappenberg KM, et al. Glioblastoma-derived extracellular vesicles modify the phenotype of monocytic cells. Int J Cancer. 2015 Oct 01;137(7):1630–18. PubMed PMID: 25802036.
- Ricklefs F, Mineo M, Rooj AK, et al. Extracellular vesicles from high-grade glioma exchange diverse pro-oncogenic signals that maintain intratumoral heterogeneity. Cancer Res. 2016 May 15;76(10):2876–2881. PubMed PMID: 27013191; PubMed Central PMCID: PMC4873326.
- Ricklefs FL, Alayo Q, Krenzlin H, et al. Immune evasion mediated by PD-L1 on glioblastoma-derived extracellular vesicles. Sci Adv. 2018 Mar;4(3):eaar2766. PubMed PMID: 29532035; PubMed Central PMCID: PMC5842038.
- Skog J, Wurdinger T, van Rijn S, et al. Glioblastoma microvesicles transport RNA and proteins that promote tumour growth and provide diagnostic biomarkers [10.1038/ncb1800]. Nat Cell Biol. 2008;10(12):1470–1476. 12//print. http://www.nature.com/ncb/journal/v10/n12/suppinfo/ncb1800_S1.html
- van Niel G, D’Angelo G, Raposo G. Shedding light on the cell biology of extracellular vesicles. Nat Rev Mol Cell Biol. 2018 Apr;19(4):213–228. PubMed PMID: 29339798.
- Graner MW, Alzate O, Dechkovskaia AM, et al. Proteomic and immunologic analyses of brain tumor exosomes. FASEB J. 2009 May;23(5):1541–1557. PubMed PMID: 19109410; PubMed Central PMCID: PMC2669426.
- Auer M, Heitzer E, Ulz P, et al. Single circulating tumor cell sequencing for monitoring. Oncotarget. 2013 Jun;4(6):812–813. PubMed PMID: 23868872; PubMed Central PMCID: PMC3757238.
- Yanez-Mo M, Siljander PR, Andreu Z, et al. Biological properties of extracellular vesicles and their physiological functions. J Extracell Vesicles. 2015;4:27066. PubMed PMID: 25979354; PubMed Central PMCID: PMC4433489.
- Westphal M, Lamszus K. Circulating biomarkers for gliomas. Nat Rev Neurol. 2015 Oct;11(10):556–566. PubMed PMID: 26369507.
- Fais S, O’Driscoll L, Borras FE, et al. Evidence-based clinical use of nanoscale extracellular vesicles in nanomedicine. ACS Nano. 2016 Apr 26;10(4):3886–3899. PubMed PMID: 26978483.
- Zhang L, Zhang S, Yao J, et al. Microenvironment-induced PTEN loss by exosomal microRNA primes brain metastasis outgrowth. Nature. 2015 Nov 5;527(7576):100–104. PubMed PMID: 26479035; PubMed Central PMCID: PMC4819404.
- Ali IU, Chen X. Penetrating the blood-brain barrier: promise of novel nanoplatforms and delivery vehicles. ACS Nano. 2015 Oct 27;9(10):9470–9474. PubMed PMID: 26406936; PubMed Central PMCID: PMC5226403.
- Borger V, Bremer M, Ferrer-Tur R, et al. Mesenchymal stem/stromal cell-derived extracellular vesicles and their potential as novel immunomodulatory therapeutic agents. Int J Mol Sci. 2017 Jul 6;18(7). PubMed PMID: 28684664; PubMed Central PMCID: PMC5535941.
- Lener T, Gimona M, Aigner L, et al. Applying extracellular vesicles based therapeutics in clinical trials - an ISEV position paper. J Extracell Vesicles. 2015;4:30087. PubMed PMID: 26725829; PubMed Central PMCID: PMC4698466.
- Shao H, Chung J, Balaj L, et al. Protein typing of circulating microvesicles allows real-time monitoring of glioblastoma therapy. Nat Med. 2012 Dec;18(12):1835–1840. PubMed PMID: 23142818; PubMed Central PMCID: PMC3518564.
- Im H, Shao H, Park YI, et al. Label-free detection and molecular profiling of exosomes with a nano-plasmonic sensor. Nat Biotechnol. 2014 May;32(5):490–495. PubMed PMID: 24752081; PubMed Central PMCID: PMC4356947.
- Lee K, Fraser K, Ghaddar B, et al. Multiplexed profiling of single extracellular vesicles. ACS Nano. 2018 Jan 23;12(1):494–503. PubMed PMID: 29286635; PubMed Central PMCID: PMC5898240.
- Wiklander OPB, Bostancioglu RB, Welsh JA, et al. Systematic methodological evaluation of a multiplex bead-based flow cytometry assay for detection of extracellular vesicle surface signatures. Front Immunol. 2018;9:1326. PubMed PMID: 29951064; PubMed Central PMCID: PMC6008374.
- Dragovic RA, Gardiner C, Brooks AS, et al. Sizing and phenotyping of cellular vesicles using nanoparticle tracking analysis. Nanomed. 2011 Dec;7(6):780–788. PubMed PMID: 21601655; PubMed Central PMCID: PMC3280380.
- Figueroa JM, Skog J, Akers J, et al. Detection of wild-type EGFR amplification and EGFRvIII mutation in CSF-derived extracellular vesicles of glioblastoma patients. Neuro Oncol. 2017;19(11):1494–1502.
- Chen WW, Balaj L, Liau LM, et al. BEAMing and droplet digital PCR analysis of mutant IDH1 mRNA in glioma patient serum and cerebrospinal fluid extracellular vesicles. Mol Ther Nucleic Acids. 2013 Jul 23;2:e109. PubMed PMID: 23881452; PubMed Central PMCID: PMC3732870.
- Garcia-Romero N, Carrion-Navarro J, Esteban-Rubio S, et al. DNA sequences within glioma-derived extracellular vesicles can cross the intact blood-brain barrier and be detected in peripheral blood of patients. Oncotarget. 2017 Jan 3;8(1):1416–1428. PubMed PMID: 27902458; PubMed Central PMCID: PMC5352065.
- Muller L, Simms P, Hong CS, et al. Human tumor-derived exosomes (TEX) regulate Treg functions via cell surface signaling rather than uptake mechanisms. Oncoimmunology. 2017;6(8):e1261243. PubMed PMID: 28919985; PubMed Central PMCID: PMC5593709.
- Headland SE, Jones HR, D’Sa AS, et al. Cutting-edge analysis of extracellular microparticles using ImageStream(X) imaging flow cytometry. Sci Rep. 2014 Jun 10;4:5237. PubMed PMID: 24913598; PubMed Central PMCID: PMC4050385.
- Erdbrugger U, Rudy CK, Etter ME, et al. Imaging flow cytometry elucidates limitations of microparticle analysis by conventional flow cytometry. Cytometry A. 2014 Sep;85(9):756–770. PubMed PMID: 24903900.
- Lannigan J, Erdbruegger U. Imaging flow cytometry for the characterization of extracellular vesicles. Methods. 2017 Jan 1;112:55–67.
- Inglis HC, Danesh A, Shah A, et al. Techniques to improve detection and analysis of extracellular vesicles using flow cytometry. Cytometry A. 2015 Nov;87(11):1052–1063. PubMed PMID: 25847910; PubMed Central PMCID: PMC4876854.
- Porichis F, Hart MG, Griesbeck M, et al. High-throughput detection of miRNAs and gene-specific mRNA at the single-cell level by flow cytometry. Nat Commun. 2014 Dec 4;5:5641. PubMed PMID: 25472703; PubMed Central PMCID: PMC4256720.
- Cancer Genome Atlas Research N. Comprehensive genomic characterization defines human glioblastoma genes and core pathways. Nature. 2008 Oct 23;455(7216):1061–1068. PubMed PMID: 18772890; PubMed Central PMCID: PMC2671642.
- Sokolova V, Ludwig AK, Hornung S, et al. Characterisation of exosomes derived from human cells by nanoparticle tracking analysis and scanning electron microscopy. Colloids Surf B Biointerfaces. 2011 Oct 1;87(1):146–150. PubMed PMID: 21640565.
- van der Pol E, Coumans FA, Grootemaat AE, et al. Particle size distribution of exosomes and microvesicles determined by transmission electron microscopy, flow cytometry, nanoparticle tracking analysis, and resistive pulse sensing. J Thromb Haemost. 2014 Jul;12(7):1182–1192. PubMed PMID: 24818656.
- Koliha N, Wiencek Y, Heider U, et al. A novel multiplex bead-based platform highlights the diversity of extracellular vesicles. J Extracell Vesicles. 2016;5:29975. PubMed PMID: 26901056; PubMed Central PMCID: PMCPMC4762227.
- Wiklander OPB, Bostancioglu RB, Welsh JA, et al. Systematic methodological evaluation of a multiplex bead-based flow cytometry assay for detection of extracellular vesicle surface signatures [Original research]. Front Immunol. 2018;9(1326): [2018 Jun 13]. English. DOI:10.3389/fimmu.2018.01326 .
- Kim D-K, Nishida H, An SY, et al. Chromatographically isolated CD63+/CD81+/extracellular vesicles from mesenchymal stromal cells rescue cognitive impairments after TBI. Proc Nat Acad Sci. 2016;113(1):170–175.
- Kowal J, Arras G, Colombo M, et al. Proteomic comparison defines novel markers to characterize heterogeneous populations of extracellular vesicle subtypes. Proc Natl Acad Sci U S A. 2016 Feb 23;113(8):E968–77. PubMed PMID: 26858453; PubMed Central PMCID: PMC4776515.
- Rappa G, Green TM, Karbanova J, et al. Tetraspanin CD9 determines invasiveness and tumorigenicity of human breast cancer cells. Oncotarget. 2015 Apr 10;6(10):7970–7991. PubMed PMID: 25762645; PubMed Central PMCID: PMC4480729.
- Yoo TH, Ryu BK, Lee MG, et al. CD81 is a candidate tumor suppressor gene in human gastric cancer. Cell Oncol. 2013 Apr;36(2):141–153. PubMed PMID: 23264205.
- Logozzi M, De Milito A, Lugini L, et al. High levels of exosomes expressing CD63 and caveolin-1 in plasma of melanoma patients. PloS one. 2009;4(4):e5219. PubMed PMID: 19381331; PubMed Central PMCID: PMC2667632.
- Görgens A, Bremer M, Ferrer-Tur R, et al. Optimisation of imaging flow cytometry for the analysis of single extracellular vesicles by using a biological calibrator. J Extracell Vesicles 2019;8(1):1587567.
- Kathagen A, Schulte A, Balcke G, et al. Hypoxia and oxygenation induce a metabolic switch between pentose phosphate pathway and glycolysis in glioma stem-like cells. Acta Neuropathol. 2013 Nov;126(5):763–780. PubMed PMID: 24005892.
- Cetin B, Gonul II, Gumusay O, et al. Carbonic anhydrase IX is a prognostic biomarker in glioblastoma multiforme. Neuropathology. 2018 Jun 28 PubMed PMID: 29952031. DOI:10.1111/neup.12485.
- Beig N, Patel J, Prasanna P, et al. Radiogenomic analysis of hypoxia pathway is predictive of overall survival in Glioblastoma. Sci Rep. 2018 Jan 8;8(1):7. 10.1038/s41598-017-18310-0. PubMed PMID: 29311558; PubMed Central PMCID: PMC5758516.
- Lai CP, Kim EY, Badr CE, et al. Visualization and tracking of tumour extracellular vesicle delivery and RNA translation using multiplexed reporters. Nat Commun. 2015;6:7029. PubMed PMID: 25967391; PubMed Central PMCID: PMC4435621.
- Pantel K, Alix-Panabieres C. Circulating tumour cells in cancer patients: challenges and perspectives. Trends Mol Med. 2010 Sep;16(9):398–406. PubMed PMID: 20667783.
- Chen YH, Hancock BA, Solzak JP, et al. Next-generation sequencing of circulating tumor DNA to predict recurrence in triple-negative breast cancer patients with residual disease after neoadjuvant chemotherapy. NPJ Breast Cancer. 2017;3:24. PubMed PMID: 28685160; PubMed Central PMCID: PMC5495776.
- De Mattos-Arruda L, Caldas C. Cell-free circulating tumour DNA as a liquid biopsy in breast cancer. Mol Oncol. 2016 Mar;10(3):464–474. PubMed PMID: 26776681; PubMed Central PMCID: PMC5528975.
- Bardelli A, Pantel K. Liquid biopsies, what we do not know (Yet). Cancer Cell. 2017 Feb 13;31(2):172–179. PubMed PMID: 28196593.
- Hoshino A, Costa-Silva B, Shen TL, et al. Tumour exosome integrins determine organotropic metastasis. Nature. 2015 Nov 19;527(7578):329–335. PubMed PMID: 26524530; PubMed Central PMCID: PMC4788391.
- Schneider SW, Ludwig T, Tatenhorst L, et al. Glioblastoma cells release factors that disrupt blood-brain barrier features. Acta Neuropathol. 2004 Mar;107(3):272–276. PubMed PMID: 14730455.
- Smith ZJ, Lee C, Rojalin T, et al. Single exosome study reveals subpopulations distributed among cell lines with variability related to membrane content. J Extracell Vesicles. 2015;4:28533. PubMed PMID: 26649679; PubMed Central PMCID: PMC4673914.
- Yoshioka Y, Konishi Y, Kosaka N, et al. Comparative marker analysis of extracellular vesicles in different human cancer types. J Extracell Vesicles. 2013;2. PubMed PMID: 24009892; PubMed Central PMCID: PMC3760642. DOI:10.3402/jev.v2i0.20424.
- Erdbrugger U, Lannigan J. Analytical challenges of extracellular vesicle detection: A comparison of different techniques. Cytometry A. 2016 Feb;89(2):123–134. PubMed PMID: 26651033.
- Linares R, Tan S, Gounou C, et al. High-speed centrifugation induces aggregation of extracellular vesicles. J Extracell Vesicles. 2015;4:29509. PubMed PMID: 26700615; PubMed Central PMCID: PMC4689953.
- Leten C, Struys T, Dresselaers T, et al. In vivo and ex vivo assessment of the blood brain barrier integrity in different glioblastoma animal models. J Neurooncol. 2014 Sep;119(2):297–306. PubMed PMID: 24990826.
- Chen Z, Feng X, Herting CJ, et al. Cellular and molecular identity of tumor-associated macrophages in glioblastoma. Cancer Res. 2017 May 1;77(9):2266–2278. PubMed PMID: 28235764; PubMed Central PMCID: PMC5741820.