
ABSTRACT
One of the greatest bottlenecks in extracellular vesicle (EV) research is the production of sufficient material in a consistent and effective way using in vitro cell models. Although the production of EVs in bioreactors maximizes EV yield in comparison to conventional cell cultures, the impact of their cell growth conditions on EVs has not yet been established. In this study, we grew two prostate cancer cell lines, PC-3 and VCaP, in conventional cell culture dishes and in two-chamber bioreactors to elucidate how the growth environment affects the EV characteristics. Specifically, we wanted to investigate the growth condition-dependent differences by non-targeted metabolite profiling using liquid chromatography–mass spectrometry (LC–MS) analysis. EVs were also characterized by their morphology, size distribution, and EV protein marker expression, and the EV yields were quantified by NTA. The use of bioreactor increased the EV yield >100 times compared to the conventional cell culture system. Regarding morphology, size distribution and surface markers, only minor differences were observed between the bioreactor-derived EVs (BR-EVs) and the EVs obtained from cells grown in conventional cell cultures (C-EVs). In contrast, metabolomic analysis revealed statistically significant differences in both polar and non-polar metabolites when the BR-EVs were compared to the C-EVs. The results show that the growth conditions markedly affected the EV metabolite profiles and that metabolomics was a sensitive tool to study molecular differences of EVs. We conclude that the cell culture conditions of EV production should be standardized and carefully detailed in publications and care should be taken when EVs from different production platforms are compared with each other for systemic effects.
Introduction
Extracellular vesicles (EVs) are naturally occurring intercellular communicasomes containing proteins and nucleic acids, but also lipids and metabolites, which mediate information between cells and tissues. EV is the recommended umbrella term used to cover the heterogeneity of vesicle populations formed through different pathways [Citation1], including plasma membrane-derived microvesicles and multivesicular body-derived exosomes. Additionally, changes in cell status can produce various vesicle types such as apoptotic bodies from apoptotic cells [Citation1] or very large “oncosomes” from cancerous cells that are also regarded as EVs [Citation2]. More, still unknown EV subtypes are likely to exist which may differ in their composition, ultrastructure, size, stimulus of production, and/or originating pathway, as has been suggested, for example regarding human ejaculate, where several different classes of EVs were identified by their morphology under cryo-transmission electron microscopy [Citation3]. The large variety of EV subtypes also highlights the multifaceted nature of EV-mediated communication, as the EVs vary also in their molecular content [Citation1,Citation4]. For example, EVs from cancerous prostate cells significantly differ in their cargo from those secreted by normal prostate epithelial cells [Citation5], and differences in content and function have also been reported between EVs from prostate cancer cells of varying metastatic potential [Citation6,Citation7]. However, properties and functional effects have mostly been studied with EVs obtained from in vitro cell cultures. As a matter of fact, 95% of the researchers authoring the new MISEV2018 guidelines used in vitro cell models for their EV studies [Citation8], and until recently, not much attention has been given to the effects of cell culture conditions and growth environment in the EV studies beyond the fetal bovine serum (FBS)-derived EVs.
Due to the origin-dependent composition and their role as natural delivery agents, EVs offer significant potential as diagnostic markers [Citation9–Citation11] and carriers of therapeutic cargo [Citation12–Citation14]. The use of EVs for therapeutic applications, product development and research (e.g. omics analyses) requires large amounts of EVs, for which conventional cell culture systems are too inefficient, requiring active maintenance and processing of large volumes of cell conditioned media. Bioreactors, such as two-chamber or hollow-fibre bioreactors, in which cells can be grown in high densities in a 3D-like platform, present an attractive alternative for producing more EVs [Citation15,Citation16]. However, it is currently unknown how well the properties of the bioreactor-derived EVs translate to the current knowledge of EVs, mostly derived from EVs from cells grown in conventional cell cultures.
In this study, we compared EVs (20K and 110K subpopulations isolated by differential ultracentrifugation) from two commonly studied metastatic prostate cancer cell lines, PC-3 and VCaP, which were cultured either in conventional cell culture dishes (C-EVs) or bioreactors (BR-EVs). To obtain the best snap-shot of the versatility of the EV cargo, we focused on EV metabolites by non-targeted metabolomics in addition to the basic characterization of EVs.
Materials and methods
Cell culture
PC-3 and VCaP-prostate cancer cell lines were obtained from the American Type Culture Collection (ATCC). All reagents were purchased from Gibco, Life Technologies. Both cell lines were tested negative for mycoplasma prior to the study. Seeding density for both cell lines and culture conditions was 4.5 × 10⁶ cells/ml. Cells were grown at 37°C and 5% of CO2 either in Celline 1000 AD model bioreactors (Integra-Biosciences) according to the manufacturer’s guidelines (http://wheaton.com/celline-ad-1000-flask-3-cs-strl.html#support-tab, Wheaton Science Products) or in T-175 flasks (Nunc). PC-3 cells (passage 16) were grown in Dulbecco’s modified Eagle medium Nutrient Mixture F-12 (DMEM/F12) and VCaP cells (passage 64) in DMEM supplemented with 10% FBS and 1% of penicillin/streptomycin (100 units/ml penicillin and 100 μg/ml streptomycin). Cells grown in bioreactors were separated from FBS with a cellulose acetate membrane of 10 kDa cut-off. The FBS used in the T-175 flask cultures was centrifuged at 110,000 × g for 16 h to deplete extracellular vesicles according to a previously published protocol [Citation17].
EV isolation using differential ultracentrifugation
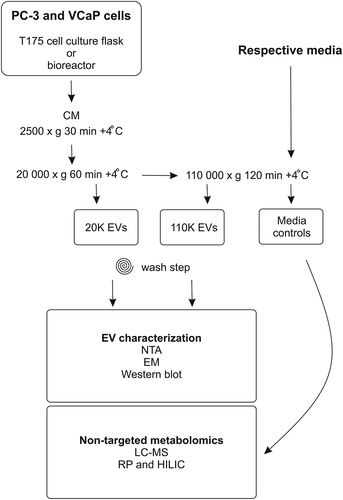
A flow chart of the isolation and analyses is presented in . EVs were isolated from the conditioned media using differential ultracentrifugation as previously described [Citation5] with slight modifications. Cell culture media was collected consecutively every 3 days from conventionally cultured cells at 80% confluence, when they were passaged. Culture medium was collected once a week from bioreactor grown cells (three consequent weeks) and replaced by fresh medium, as instructed by the manufacturer. In brief, the conditioned medium (180 ml from conventional cell cultures and 10 ml from bioreactors) was first centrifuged to remove cell debris and apoptotic bodies at 2500 × g for 30 min. The supernatant was then centrifuged at 20,000 gavg for 60 min for the 20K EV pellet, and the final supernatant was ultracentrifuged at 110,000 gavg for 2 h in +4°C to obtain the 110K EV pellet using Optima LE-80K ultracentrifuge with rotor Ti 50.2, k-factor 143.3 (Beckman Coulter). For the metabolomics analysis, media were incubated in the absence of cells at 37°C, and after 3 days ultracentrifuged at 110,000 × g for 2 h, as a recommended control [Citation18]. The collected EVs were washed with 500 µl of PBS and re-pelleted by ultracentrifugation at 100,000 × g, +4°C for 2 h using Optima MAX-XP (Beckman Coulter) ultracentrifuge with rotor TLA-55, k-factor 81.3 (Beckman Coulter). The 20K, 110K pellets and media controls were then resuspended in 50 μl of Dulbecco’s phosphate buffered saline (DPBS) (Gibco, Life Technologies), and stored at −80°C for further analysis. Data of this study have been submitted to the EV-TRACK knowledgebase (EV-TRACK ID: EV180029) [Citation19].
Figure 1. Schematic overview of the workflow of the study. Conditioned media from PC-3 and VCaP cells grown in cell culture flasks or in bioreactors were harvested for extracellular vesicles (EVs) by differential ultracentrifugation as 20K and 110K subpopulations. The isolated EVs were characterized by nanoparticle tracking analysis (NTA), electron microscopy (EM) and Western blotting, and the EV samples were submitted to non-targeted metabolomics (liquid chromatography mass spectrometry, LC–MS). Respective media controls for metabolomic profiling were incubated without cells at 37°C for 72 h and processed by ultracentrifugation similarly as the 110K EV samples. CM, conditioned media; RP, reverse phase; HILIC, hydrophilic interaction liquid chromatography.
Electron microscopy
Electron microscopy (EM) samples were prepared by negative staining as described earlier [Citation20]. Briefly, EVs were loaded on 200 mesh grids, fixed with 2% PFA, stained with 2% neutral uranyl acetate and embedded in methyl cellulose uranyl acetate mixture. Stained samples were viewed with Tecnai 12 (FEI Company) at 80 kV.
Nanoparticle tracking analysis
Purified EV samples were analysed by nanoparticle tracking analysis (NTA) using Nanosight model LM14 (Nanosight) equipped with blue (404 nm, 70 mW) laser and SCMOS camera. The samples were diluted in 0.1 µm filtered (Millex VV, Millipore) DPBS to obtain 40–100 particles/view, and three 60 s videos were recorded using camera level 14 with automatic temperature setting of 22°C. The data were analysed using NTA software 3.0 with the detection threshold 5 and screen gain at 10 to track as many particles as possible with minimal background.
Western blotting
1.5E10 particles of C-EVs and 5E10 particles of BR-EVs were prepared in Laemmli buffer under non-reducing conditions, and separated by SDS-PAGE and transferred onto PVDF membranes, and probed with antibodies diluted 1:500 against human CD9 (HBD-CD9, HansaBioMed Life Sciences Ltd), CD29 (#610,467, BD Transduction Laboratories), CD81 (HBD-CD81-EM4, HansaBioMed Life Sciences Ltd), TSG101 (BD Biosciences), and 1:1000 Calnexin (Cell Signalling Technology). Proteins of interest were detected with 1:3000 diluted HRP-conjugated IgG antibody (NA931 anti-mouse HRP, or NA934 anti-rabbit HRP, GE Healthcare) and visualized with the Clarity ECL substrate (BioRad).
Non-targeted LC–MS metabolite profile analysis
Metabolites were extracted from the EV samples in triplicates by adding 400 μl acetonitrile to 100 μl each sample and mixed thoroughly by vortexing. The samples were then centrifuged at 16,000 × g for 10 min, and the supernatants were filtered with 0.2 μm Acrodisc® Syringe filters with the PFTE membrane (Pall Corporation, Ann Arbor, MI). For a quality control sample small aliquots from every individual sample were pooled together. The extracted metabolites were then further analysed using LC–MS instrumentation consisting of a 1290 LC system, a Jetstream electrospray ionization (ESI) source, and a 6540 UHD accurate-mass qTOF spectrometer (Agilent Technologies, Wallbronn, Karlsruhe, Germany). The samples were analysed using both reverse phase (RP, Zorbax Eclipse XDB-C 18 column, Agilent Technologies, Palo Alto, CA, USA) and hydrophilic interaction chromatography (HILIC, Acquity UPLC BEH Column, Waters Corporation, Milford, MA) to maximize the coverage. For data acquisition, the mass range was set to 20–1600 amu with acquisition rate 1.67 spectra/s. For automatic MS/MS spectrums from every precursor scan cycles, four ions with the highest intensities were selected for fragmentation. Collision energies used for fragmentation were 10, 20 and 40 eV. Data acquisition was conducted with MassHunter Acquisition B.04.00 (Agilent Technologies).
Metabolomic data collection and statistical analysis
The raw data were collected using the vendor’s software MassHunter Qualitative Analysis B.05.00 (Agilent Technologies). For the statistical analysis, the raw values of fragmentation were used, and normalization to e.g. particle concentration was not performed due to the differences in samples regarding EV numbers obtained from the different cell lines under the different growth environments. To reduce noise and remove insignificant metabolite features, inclusion criteria for the statistical analysis was defined so that the molecular feature of interest was detected in minimum of 60% of the samples in at least one replicate group. The data processing and selection for the most discriminating features between samples were performed in excel. A paired t-test was performed for each feature (cut-off p-value < 0.05). The remaining peaks were manually inspected in the LC–MS chromatograms and spectra with the MassHunter software and ensured that the molecular ion of certain compound was included into the data-dependent MS/MS analysis, or targeted MS/MS analysis was performed. The raw data were deconvoluted, aligned and identified with MS DIAL [Citation21], and the identification of metabolites was verified by screening the mass and MS/MS fragmentation spectra in the Human Metabolome Database HMDB [Citation22] and LIPID MAPS [Citation23]. The fragmentation of the metabolites was compared with that of the standards of the molecules when available, or found in databases and verified with earlier literature. To find the differences between the C- and BR-EVs after controlling for the differences between the media without cells, we excluded metabolites with log2 fold change above +1 or below −1 in the comparison between medium samples in the conventional and bioreactor cultures. We then made comparisons for each cell line (PC-3 and VCaP) and for each type of vesicle (20K and 110K) where log2 fold changes above +1 and below −1 between the conventional and bioreactor-derived EVs were considered biologically significant.
Metabolic pathway analysis
Further pathway analysis was performed on the metabolites with significant changes between respective groups (p-value < 0.05 and fold change > 2). Pathway information for each metabolite was extracted from either Human Metabolome Database (HMDB) [Citation22], or Kyoto Encyclopedia of Genes and Genomes (KEGG) [Citation24]. More detailed analysis of identified metabolites, and interesting pathways and networks was performed by MetaboAnalyst [Citation25]. Venn diagrams were conducted using online tool (http://bioinformatics.psb.ugent.be/webtools/Venn/).
Results and discussion
Characterization of EVs derived from conventional cell culture and bioreactors
In this study, we compared how cell culture conditions influenced the properties of the 20K and 110K EV subpopulations of EVs obtained by differential ultracentrifugation from two prostate cancer cell lines (PC-3 and VCaP) grown either in conventional culture dishes or in bioreactors. The effect of the growth environment on the EV-metabolome was studied in detail. When the concentrations of the C-EVs and BR-EVs were determined by NTA, both the PC-3 and VCaP cell line-derived BR-20K and BR-110K samples showed >100-fold increase in yield (measured as a total of one isolation round), when compared to the respective C-EVs ()). The improved yield is in line with the results from two previous studies, where bioreactors were shown to improve the EV yield 10–12-fold (presented per volume) compared to conventional cell culture seemingly without major effects to the EV populations and properties [Citation16,Citation26]. The main methodological differences of the studies are (i) the cell lines and media composition in the BR cell compartment (containing FBS), (ii) the EV isolation method, and (iii) the analytical methods, and these factors may well explain the differences between studies. In our study, the notably high yield suggests that bioreactors provide a way to obtain large EV batches for analytical and application purposes.
Figure 2. (a) The average particle concentrations (particles/ml in log10 scale) of the 20K and 110K C-EVs and BR-EVs derived from PC-3 and VCaP cell cultures measured with NTA (n = 3). (b) Combined NTA data of size distributions from three isolations of the 20K and 110K C-EVs and BR-EVs derived from PC-3 and VCaP cell cultures. Mean sizes (nm ±SD) of the EVs are indicated in the figure. Statistical analysis of the size distribution data is shown in Supplementary Table 1. Concentration of BR-EVs in primary axis and C-EVs in secondary axis. C-20K is the 20,000 g EV pellet isolated from the conventional flasks, C-110K is the 110,000 g EV pellet from the conventional flasks, BR-20K is the 20,000 g EV pellet from the bioreactor, BR-110K is the 110,000 g EV pellet from the bioreactor.
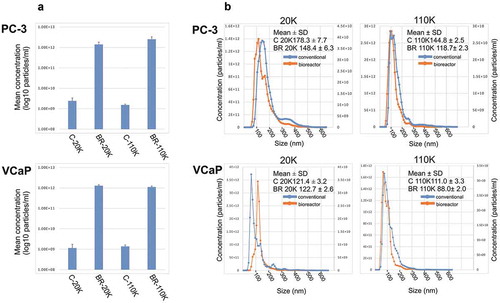
Next, the EVs were compared by size distribution, morphology and protein marker expression. When the size distributions of the EVs were measured by NTA ()), the VCaP C-EVs did not differ from the BR-EVs, but the PC-3-derived BR-EVs were statistically significantly smaller than the C-EVs, when analysed by bins of size classes (Supplementary Table 1). The shift in size ditribution measured with NTA was verified by size measurement of individual PC-3 EVs by manual inspection in EM (data not shown), suggesting a possibility of a different EV population. By EM, BR- and C-EVs had similar morphologies typically attributed to EVs (Supplementary Figure 1A). Next, we compared the EVs for the presence and absence of typical protein markers by Western blotting. The 20K and 110K EVs derived from both culture systems were positive for the markers CD9, CD29, CD81, and TSG101, and negative for calnexin, which was used as a negative marker control (Supplementary Figure 1B, 1C). Regarding CD29, some differences between the marker profiles were seen between the cell culture environments, so that CD29 in the C-EVs was fairly evenly present in the 20K and 110K samples, but in the BR-EVs, CD29 was more prominent in the 20K samples. Regarding CD9 and TSG101, the marker levels were fairly similar in the 20K and 110K samples irrespective of the cell culture conditions. Regarding CD81, differences were more marked between the 20K and 110K EV subpopulations than between the cell lines or the cell culture environments. In conclusion, the most profound effect of the cell culture environment was on the EV yield per isolation, whereas differences in size distribution, morphology and protein marker expression varied depending on the cell type, EV subpopulation or the culture condition.
Non-targeted LC-MS metabolite profile analysis of EVs derived from cells grown in conventional cell culture and bioreactors
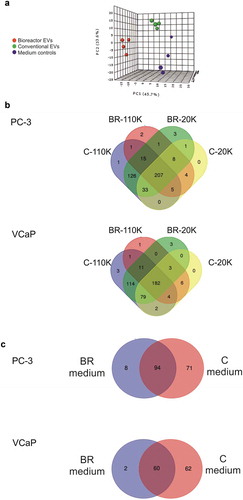
Next, the EV samples were subjected to non-targeted metabolomics to get a temporal snapshot of their molecular content. From the LC–MS measurements of the EVs, 6006 molecular features were extracted with the RP column, and 851 with the HILIC column followed by downstream statistical analysis. Of the total 6857 molecular features, 459 showed statistically significant differences (407 in PC-3 and 409 in VCaP showing considerable overlap) when pairwise comparisons were performed between the C-EVs and BR-EVs. Of these, 246 molecular features were identified by manual inspection and 213 remained unidentified due to insufficient fragmentation data, due to the limited sample amount. Principal component analysis (PCA) of all samples and media controls revealed a clear separation between the (i) culture conditions and (ii) media controls indicating that divergence of cell metabolism is reflected in the EVs depending on the growth environment (). When the overlapping and the sample type-specific differential metabolites were compared by Venn diagram (), one-third of metabolites was found only in the C-EVs (32% i.e. 130 unique metabolites from the combined 20K and 110K C-EV samples of PC-3, and 29% i.e. 120 metabolites from the combined 20K and 110K C-EV samples of VCaP). A closer inspection of the cell lines and culture conditions revealed that the media controls of the conventional cell culture systems contained >50% more molecular features when compared to the bioreactor media controls ()). This indicated that the two-chamber bioreactor allowed only a part of the medium compounds to pass the 10 kDa semi-permeable membrane separating the chambers, which can in part explain the differences in the metabolite content between the bioreactor and the conventional cell cultures. The metabolites that were different (log2 fold change above 1 or below −1) between media samples from conventional and bioreactor systems are shown in Supplementary File 1. In the C-EV samples, most of the identified metabolites were detected in all the sample types i.e. in the 20K and 110K C-EV samples ()) and in the media control samples. The amount of shared metabolites between the medium and the combined C-EVs (20K and 110K) was similar for both cell lines (PC3 83% and VCaP 70%). In contrast in the BR-EVs, the percentages of the shared metabolites with the respective medium control were lower (40% and 30%, respectively). This could be due to an increased consumption of metabolites during the longer culture in bioreactor with increased cell density or alternatively, the carry-over of metabolites from media during isolation by differential ultracentrifugation despite the wash-step.
Figure 3. (a) Principal component analysis (PCA) of the metabolite molecular features according to the experimental conditions analysed with LC-MS. For PCA, the metabolites of the 20K and 110K EVs of both cell culture conditions, as well as all four media controls, were merged. Data points represent the average values of three isolations. (b) VENN diagrams of the identified metabolites from the conditioned media collected from PC-3 and VCaP cell lines. (c) VENN diagrams of the identified metabolites from the media controls. C-20K is the 20,000 g EV pellet from the conventional flasks, C-110K is the 110,000 g EV pellet isolated from the conventional flasks, BR-20K is the 20,000 g EV pellet from bioreactor, BR-110K is the 110,000 g EV pellet from bioreactor. BR-medium and C-medium are the media controls from the bioreactors and conventional cell culture flasks, respectively.
Further metabolite analysis revealed three different clusters of metabolites. A heat map of K-means-clustered metabolites shows prominent differences between the C-EVs and BR-EVs from both cell lines (). Cluster 1 contains hydrophilic metabolites that were downregulated in the BR-EVs compared to C-EVs and media controls, suggesting that the metabolic flux of these molecules was enhanced in the bioreactor grown cells. Clusters 2 and 3 contain hydrophobic metabolites that were upregulated in the C-EVs, but were downregulated in the BR-EVs as well as media controls, suggesting differential packaging of metabolites into EVs or metabolism of cells grown in different culture systems.
Figure 4. Heat map showing the metabolites grouped by the K-means clustering method constructed on the basis of importance for the 20K and 110K EVs of culture conditions and cell lines. The standardized group mean values are shown. Values were standardized by mean of all samples and standard deviation: Standardized Value = [(Value) – Mean(of all samples)]/Standard deviation(of all samples).
![Figure 4. Heat map showing the metabolites grouped by the K-means clustering method constructed on the basis of importance for the 20K and 110K EVs of culture conditions and cell lines. The standardized group mean values are shown. Values were standardized by mean of all samples and standard deviation: Standardized Value = [(Value) – Mean(of all samples)]/Standard deviation(of all samples).](/cms/asset/c6b7272d-454b-4606-80dd-ce60f70079ac/zjev_a_1596669_f0004_oc.jpg)
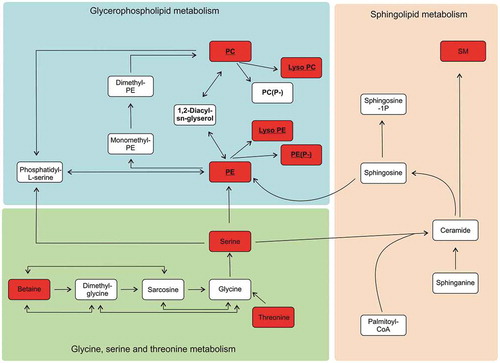
The majority of the metabolites falling into clusters 2 and 3 belong to glycerophospholipids including plasmalogens, phosphatidylcholines and sphingomyelins. Glycerophospholipids are one of the main components in biological membranes, including those of EVs [Citation1,Citation27]. BR-EVs contained significantly less phophatidylcholines (PC) and phosphatidylethanolamines (PE), as well as sphingomyelins (SM) in comparison to the C-EVs (). In general, SM has been found to be an enriched lipid class in exosomes, whereas PC has been considerd to be more prominent in microvesicles [Citation28,Citation29]. de novo formation of PE and PC can occur via several pathways (), Kennedy pathway being the most essential [Citation30,Citation31]. In cell cultures, FBS provides a source for the external building blocks for PE and PC synthesis. In the bioreactor used in this study, the cell compartment medium was separated from the FBS containing medium by a semipermeable membrane which according to the manufacturer allows only nutrients smaller than 10 kDa to pass through. Our results imply that some of the building blocks for the lipid synthesis may have had restricted passage through the membrane, which then affected the glyserophospho- and sphingolipid synthesis (). Alternatively, the metabolite differences in cluster 1 suggest that cells grown in bioreactor may run out of nutrients between sampling intervals altering the cell metabolism and thereby possibly affecting the source and composition of the respective EVs.
Figure 5. Simplified diagram of the downregulated metabolic pathways of phosphatidylethanoloamine (PE), phosphatidylcholine (PC) and sphingomyelin (SM) lipid synthesis in the EVs derived from the bioreactors (BR-EVs). Metabolites that were downregulated in all the BR-EVs from both cell lines in comparison to the metabolites from all the C-EVs, are highlighted in red. The metabolites belonging to the Kennedy pathway are underlined.
Although our metabolomics approach offers a glimpse of the lipid content of the analysed EVs, the data cannot directly be compared with the earlier results from specific EV lipidomic studies [Citation4,Citation29,Citation32–Citation39]. These studies showed that the lipid composition of EVs differed from the parental cells, and that e.g. cholesterol, SM, PC and PE lipid species were specifically enriched in EVs, although also differences were found between EV subtypes. In our study, the majority of the identified lipids belonged to SM, PC and PE species (), which is in line with the results of previous lipidomic studies. Furthermore, as seen in cluster 2 of , lysophosphatidylcholines (LPC) were enriched in the C-EVs compared to the BR-EVs. Lipid compositions have been shown to affect biological functions, homing and uptake of EVs, and functional studies may generate different results depending on how the parent cells were grown. LPCs, which have a large headgroup to acyl chain ratio, have a positive spontaneous curvature favouring bending away from the headgroups [Citation40]. Depending on the recipient cell or organ, LPC-containing vesicles have been shown to facilitate various reactions, for example, circulating IgM immunoglobulins bound to LPC structures exposed on EV surface (and apoptotic cells), and sentenced these EVs to be cleared from the circulation [Citation41]. LPC-rich EVs derived from immunocompetent dendritic cells were shown to have a different fate: they migrated to the lymph nodes and participated in the dendritic cell maturation [Citation42]. Finally, LPC in EVs may play a role in the vesicle budding into MVB by triggering outer membrane leaflet bending at the neck of the vesicle [Citation43].
In addition, SM lipids were downregulated in the BR-EVs compared to the C-EVs ( & ). Exosomes have been shown to contain more SM lipids compared to microvesicles or parental cells [Citation28] – thus our bioreactor cultures may have produced less exosomes. On the other hand, apoptotic cells produce small vesicles that pellet in similar conditions, but have dissimilar cargo compared to exosomes from viable cells [Citation44]. Therefore, the downregulation of LPCs and SM lipids in the BR-EVs () suggests that a poorer nutrient status (based on the media results) could affect the condition of the cells, which in turn may modulate the vesiculation profiles in these cells. Altogether, the metabolomic characterization of EVs showed that both prostate cancer cell lines grown in bioreactor may have had reduced viability, despite being harvested according to the manufacturer’s instructions, but this needs to be confirmed with further studies.
Finally, data in cluster 3 of showed downregulation of Plsm-PE in the BR-EVs implying changes in the de novo lipid formation. Plasmalogens (Plsm) are glycerophospholipids that contain an ether bond in the sn-1-position to an alkenyl group and are enriched with polyunsaturated fatty acids. More than 15% of total phospholipids in mammalian cell membranes are plasmalogens [Citation45]. Previous studies have shown enrichment of Plsm-PE in the EVs compared to the parental cell (colorectal and prostate cancer cells) [Citation29,Citation35]. Plasmalogens also affected the rigidity of the cell membranes [Citation46,Citation47] stabilizing them and promoting vesicle fusion in stop-flow kinetic assay [Citation48,Citation49]. Lipid balance of the parent cells is likely to impact the lipid composition of EVs and thereby the functions that depend on it. More research is clearly needed to establish e.g. how the cell culture conditions modulate the EV properties in functional assays, and this study alone cautions against attributing functional properties solely on e.g. cell type, if the cell culture conditions vary between the EVs to be studied.
Although differential ultracentrifugation does not enable isolation of pure EV subpopulations, it is generally accepted that it provides enriched pools of EV subpopulations with different molecular content [Citation5,Citation50]. Comparison of the metabolites between the C-20K and C-110K EV samples showed that the majority of the metabolites were shared ()). In contrast, the BR-20K and BR-110K samples of both cell lines revealed interesting differences. For example, serotonin was detected only in the BR-110K EVs derived from both PC-3 and VCaP cells and not in the BR-20K EVs (Supplementary Table 2). However, in general, more metabolites were detected in the BR-20K (368 in PC-3/395 in VCaP) than in the BR-110K (348/315) samples. After idenfitication, the 20K samples also had more unique metabolites (18/45) than the 110K samples (10/2) derived from PC-3/VCaP cells grown in the bioreactor, respectively. These included a large proportion of the identified LPCs, and some PCs and SMs. This enrichment could imply that the nutrient deprivation in the bioreactor may affect more the metabolites carried in the 110K-EVs. Comparison of BR-EVs to C-EVs for each cell line and sample type revealed prominent differences in the abundance of metabolites (Supplementary Figure 2). BR-EVs had more downregulated (54 in PC-3 20K/54 in PC-3 110K/74 in VCaP 20K/91 in VCaP 110K) than upregulated metabolites (2/4/9/1).
Pathway analysis
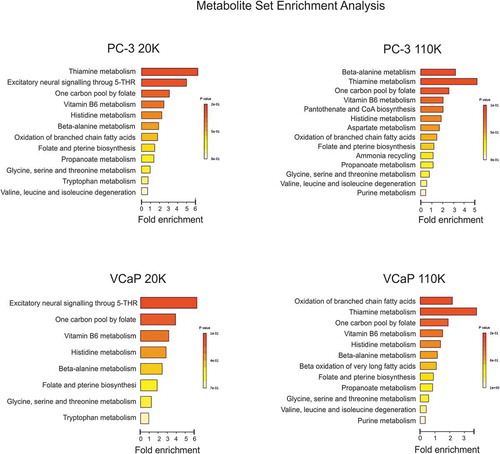
Finally, the metabolites of each EV sample were analysed by metabolite set enrichment analysis (MSEA) to identify and interpret patterns of metabolite concentration changes in a biologically meaningful way [Citation51]. Although the total number of identified metabolites was lower in the BR-EVs, exactly the same metabolic pathways were discovered when compared to those identified by the C-EV -metabolites (data not shown). Next, we wanted to identify the metabolic pathways the differential metabolites from the 20 K and 110 K samples belonged to (present in C-EVs, but absent in BR-EVs) (). Data from both cell lines showed that thiamine – and vitamin B6 – as well as several amino acid metabolic routes were affected by the growth environment resulting into nutrient-poorer EVs from bioreactors. Amino acids transported by the exosomes have been shown to affect the tricarboxylic acid cycle of the recipient cancer cells and thereby improve the nutrient status of the fast growing and proliferating cells by providing material for biosynthesis [Citation52]. In our previous study [Citation14], both 20K and 110K EVs from conventionally cultured prostate cancer cells enhanced the viability of the cells of the respective cell lines, supporting the concept that cancerous cells utilize the EV cargo as building blocks for their growth.
Figure 6. Metabolic pathway analysis of the enrichment of the unique metabolites found in the C-EVs (20K and 110K) which were absent in the BR-EVs. Summary plots of the Metabolite Set Enrichment Analyses (MSEA) of PC-3 C-20K versus BR-20K and C-110K versus BR-110K, and of VCaP C-20K versus BR-20K and C-110K versus BR-110K. Metabolites are ranked according to the p-value.
Based on the results from this study, the means of producing EVs and the cell culture conditions should be carefully considered and reported, when EVs are studied for biological knowledge or utilized for theranostic applications. The effect of various parameters, e.g. cell type, cell confluence and cellular stress in cell culture conditions on EV preparations, has been previously reviewed [Citation53]. One factor for the observed differences in the EV metabolomes in our study may be confluence, as during C-EV production, confluence was maintained below 80%, while in bioreactors, culture is continued without passaging, and the platform has been shown to double the cell numbers and enable spheroid-like development [Citation16], which may affect the metabolic activity of the cells [Citation54,Citation55]. Furthermore, increasing harvesting intervals with concomitant exchange of fresh medium may stabilize culture conditions and increase yields of more conventional cell culture -like EVs minimizing apoptotic or stress conditions. However, for physiologically relevant EV production, 3D cell culture technologies e.g. with spheroids should ultimately be adopted. In the future, the properties of EVs could be manipulated by controlling the cell culture conditions in bioreactors in a similar way that biosimilars are tailored [Citation56,Citation57].
Conclusions
So far, the majority of EVs for basic research, therapeutics, and drug delivery have been isolated from cell culture conditioned media. For most of these applications, conventional cell culture in large flasks is too inefficient and laborious to produce sufficient amounts of EVs in an economical way. Bioreactors can improve the EV yield to > 10-fold or more compared to standard cell culture systems suggesting that bioreactors provide a way to obtain large EV batches for analytical and application purposes. However, we also found cell culture system-dependent differences in the resulting EVs. A few differences were seen in the basic EV properties, but the most striking variation was in the EV metabolomes. Our results warrant further investigation into how EV applicability could be customized by culture conditions. For example, nutrient poor EVs, such as those from bioreactors in this study, could in the future be custom tailored as drug delivery vehicles which would provide minimal external energy or structural building blocks to the cancer cells. The bioreactor conditions regarding the medium composition and the interval of culture maintenance could be optimized for each purpose. Finally, our study shows that metabolomics provides a temporally precise and detailed snap shot of the molecular properties of EVs, and is a useful tool for understanding EV-mediated molecular mechanisms. Although the EV-metabolome is still largely unknown, it shows great promise to be mined for information such as biomarkers of systematic diseases, e.g. cancer, as already suggested by the few pioneering studies [Citation58–Citation61].
Disclosure of interest
The authors report no conflicts of interest.
Supplemental Material
Download Zip (10.5 MB)Acknowledgments
Biocenter Finland is acknowledged for support. Authors thank Professor Juan Falcòn-Pérez and Dr. Sebastiaan Martijn Van Liempd from CICbioGUNE for their valuable comments on statistical analysis. The authors would like to acknowledge networking support by the COST Action BM1202.
Supplementary material
Supplemental data for this article can be accessed here.
Additional information
Funding
Related Research Data
References
- Yáñez-Mó M, Siljander PR, Andreu Z, et al. Biological properties of extracellular vesicles and their physiological functions. J Extracell Vesicles. 2015;4(1):27066.
- Di Vizio D, Kim J, Hager MH, et al. Oncosome formation in prostate cancer: Association with a region of frequent chromosomal deletion in metastatic disease. Cancer Res. 2009;69(13):5601.
- Höög JL, Lötvall J. Diversity of extracellular vesicles in human ejaculates revealed by cryo-electron microscopy. J Extracell Vesicles. 2015;4(1):28680.
- Haraszti RA, Didiot M, Sapp E, et al. High-resolution proteomic and lipidomic analysis of exosomes and microvesicles from different cell sources. J Extracell Vesicles. 2016;5(1):32570.
- Lázaro-Ibáñez E, Lunavat TR, Jang SC, et al. Distinct prostate cancer-related mRNA cargo in extracellular vesicle subsets from prostate cell lines. BMC Cancer. 2017;17(1):92.
- Shephard AP, Yeung V, Clayton A, et al. Prostate cancer exosomes as modulators of the tumor microenvironment. J Cancer Metastasis Treat. 2017;3:289.
- Lázaro-Ibáñez, E., Neuvonen M, Takatalo M, et al. Metastatic state of parent cells influences the uptake and functionality of prostate cancer cell-derived extracellular vesicles. Journal of Extracellular Vesicles 2017;6(1):1354645.
- Théry C, Witwer KW, Aikawa E, et al. Minimal information for studies of extracellular vesicles 2018 (MISEV2018): a position statement of the international society for extracellular vesicles and update of the MISEV2014 guidelines. J Extracell Vesicles. 2018;7(1):1535750.
- Mallat Z, Benamer H, Hugel B, et al. Elevated levels of shed membrane microparticles with procoagulant potential in the peripheral circulating blood of patients with acute coronary syndromes. Circulation. 2000;101(8):841.
- Skog J, Wurdinger T, van Rijn S, et al. Glioblastoma microvesicles transport RNA and proteins that promote tumour growth and provide diagnostic biomarkers. Nat Cell Biol. 2008;10(12):1470.
- Sellam J, Proulle V, Jüngel A, et al. Increased levels of circulating microparticles in primary sjögren’s syndrome, systemic lupus erythematosus and rheumatoid arthritis and relation with disease activity. Arthritis Res Ther. 2009;11(5):R156.
- Bruno S, Grange C, Collino F, et al. Microvesicles derived from mesenchymal stem cells enhance survival in a lethal model of acute kidney injury. PloS one. 2012;7(3):e33115.
- Tian Y, Li S, Song J, et al. A doxorubicin delivery platform using engineered natural membrane vesicle exosomes for targeted tumor therapy. Biomaterials. 2014;35(7):2383.
- Saari H, Lázaro-Ibáñez E, Viitala T, et al. Microvesicle-and exosome-mediated drug delivery enhances the cytotoxicity of paclitaxel in autologous prostate cancer cells. J Control Release. 2015;220:727.
- Watson DC, Bayik D, Srivatsan A, et al. Efficient production and enhanced tumor delivery of engineered extracellular vesicles. Biomaterials. 2016;105:195.
- Guerreiro EM, Vestad B, Steffensen LA, et al. Efficient extracellular vesicle isolation by combining cell media modifications, ultrafiltration, and size-exclusion chromatography. PloS one. 2018;13(9):e0204276.
- Shelke GV, Lässer C, Gho YS, et al. Importance of exosome depletion protocols to eliminate functional and RNA-containing extracellular vesicles from fetal bovine serum. J Extracell Vesicles. 2014;3(1):24783.
- Palomo L, Casal E, Royo F, et al. Considerations for applying metabolomics to the analysis of extracellular vesicles. Front Immunol. 2014;5:651.
- Van Deun J, Mestdagh P, Agostinis P, et al. EV-TRACK: transparent reporting and centralizing knowledge in extracellular vesicle research. Nat Methods. 2017;14(3):228.
- Puhka M, Nordberg M, Valkonen S, et al. KeepEX, a simple dilution protocol for improving extracellular vesicle yields from urine. Eur J Pharm Sci. 2017;98:30.
- Tsugawa H, Cajka T, Kind T, et al. MS-DIAL: data-independent MS/MS deconvolution for comprehensive metabolome analysis. Nat Methods. 2015;12(6):523.
- Wishart DS, Feunang YD, Marcu A, et al. HMDB 4.0: the human metabolome database for 2018. Nucleic Acids Res. 2017;46(D1):D608–D617.
- Fahy E, Subramaniam S, Murphy RC, et al. Update of the LIPID MAPS comprehensive classification system for lipids. J Lipid Res. 2009;50 Suppl:S9–S14.
- Kanehisa M, Furumichi M, Tanabe M, et al. KEGG: new perspectives on genomes, pathways, diseases and drugs. Nucleic Acids Res. 2017;45(D1):D353–D361.
- Xia J, Wishart DS. Using metaboanalyst 3.0 for comprehensive metabolomics data analysis. Curr Protoc Bioinformatics. 2016;55:14.10.1–14.10.91.
- Mitchell JP, Court J, Mason MD, et al. Increased exosome production from tumour cell cultures using the integra CELLine culture system. J Immunol Methods. 2008;335(1):98.
- Van Meer G, Voelker DR, Feigenson GW. Membrane lipids: where they are and how they behave. Nat Rev Mol Cell Biol. 2008;9(2):112.
- Bicalho B, Holovati JL, Acker JP. Phospholipidomics reveals differences in glycerophosphoserine profiles of hypothermically stored red blood cells and microvesicles. Biochimi Biophys Acta (BBA) Biomembr. 2013;1828(2):317.
- Llorente A, Skotland T, Sylvänne T, et al. Molecular lipidomics of exosomes released by PC-3 prostate cancer cells. Biochim Biophys Acta (BBA)-Mol Cell Biol Lipids. 2013;1831(7):1302.
- Gibellini F, Smith TK. The kennedy pathway—de novo synthesis of phosphatidylethanolamine and phosphatidylcholine. IUBMB Life. 2010;62(6):414.
- Kennedy EP, Weiss SB. The function of cytidine coenzymes in the biosynthesis of phospholipides. The. J Biol Chem. 1956;222(1):193.
- Yang JS, Lee JC, Byeon SK, et al. Size dependent lipidomic analysis of urinary exosomes from patients with prostate cancer by flow field-flow fractionation and nanoflow liquid chromatography-tandem mass spectrometry. Anal Chem. 2017;89(4):2488.
- Dang VD, Jella KK, Ragheb RRT, et al. Lipidomic and proteomic analysis of exosomes from mouse cortical collecting duct cells.. FASEB J. 2017;31(12):5399.
- Deshane J, Hough K, Wilson L, et al. Airway exosomes from asthmatics modulate differential T helper responses. J Allergy Clin Immunol. 2017;139(2):AB375.
- Lydic TA, Townsend S, Adda CG, et al. Rapid and comprehensive ‘shotgun’lipidome profiling of colorectal cancer cell derived exosomes. Methods. 2015;87:83.
- Hosseini-Beheshti E, Pham S, Adomat H, et al. Exosomes as biomarker enriched microvesicles: characterization of exosomal proteins derived from a panel of prostate cell lines with distinct AR phenotypes. Mol Cell Proteomics. 2012;11(10):863.
- Phuyal S, Skotland T, Hessvik NP, et al. The ether lipid precursor hexadecylglycerol stimulates the release and changes the composition of exosomes derived from PC-3 cells. J Biol Chem. 2015;290(7):4225.
- Laurén E, Tigistu-Sahle F, Valkonen S, et al. Phospholipid composition of packed red blood cells and that of extracellular vesicles show a high resemblance and stability during storage. Biochim Biophys Acta (BBA)-Mol Cell Biol Lipids. 2018;1863(1):1.
- Brzozowski JS, Jankowski H, Bond DR, et al. Lipidomic profiling of extracellular vesicles derived from prostate and prostate cancer cell lines. Lipids Health Dis. 2018;17(1):211.
- Fuller N, Rand R. The influence of lysolipids on the spontaneous curvature and bending elasticity of phospholipid membranes. Biophys J. 2001;81(1):243.
- Blanc L, Barres C, Bette-Bobillo P, et al. Reticulocyte-secreted exosomes bind natural IgM antibodies: involvement of a ROS-activatable endosomal phospholipase iPLA2. Blood. 2007;110(9):3407.
- Coutant F, Perrin-Cocon L, Agaugue S, et al. Mature dendritic cell generation promoted by lysophosphatidylcholine. J Immunol. 2002;169(4):1688.
- Subra C, Laulagnier K, Perret B, et al. Exosome lipidomics unravels lipid sorting at the level of multivesicular bodies. Biochimie. 2007;89(2):205.
- Thery C, Boussac M, Veron P, et al. Proteomic analysis of dendritic cell-derived exosomes: a secreted subcellular compartment distinct from apoptotic vesicles. J Immunol. 2001;166(12):7309.
- Braverman NE, Moser AB. Functions of plasmalogen lipids in health and disease. Biochim Biophys Acta Mol Basis Dis. 2012;1822(9):1442.
- Paltauf F. Ether lipids in biomembranes. Chem Phys Lipids. 1994;74(2):101.
- Han X, Gross RW. Plasmenylcholine and phosphatidylcholine membrane bilayers possess distinct conformational motifs. Biochem. 1990;29(20):4992.
- Glaser PE, Gross RW. Plasmenylethanolamine facilitates rapid membrane fusion: a stopped-flow kinetic investigation correlating the propensity of a major plasma membrane constituent to adopt an HII phase with its ability to promote membrane fusion. Biochem. 1994;33(19):5805.
- Lohner K, Balgavy P, Hermetter A, et al. Stabilization of non-bilayer structures by the etherlipid ethanolamine plasmalogen. Biochimi Biophys Acta (BBA) Biomembr. 1991;1061(2):132.
- Kowal J, Arras G, Colombo M, et al. Proteomic comparison defines novel markers to characterize heterogeneous populations of extracellular vesicle subtypes. Proc Natl Acad Sci U S A. 2016;113(8):E968.
- Xia J, Wishart DS. MSEA: A web-based tool to identify biologically meaningful patterns in quantitative metabolomic data. Nucleic Acids Res. 2010;38(suppl_2):W71.
- Zhao H, Yang L, Baddour J, et al. Tumor microenvironment derived exosomes pleiotropically modulate cancer cell metabolism. Elife. 2016;5:e10250.
- Gudbergsson JM, Johnsen KB, Skov MN, et al. Systematic review of factors influencing extracellular vesicle yield from cell cultures. Cytotechnology. 2016;68(4):579.
- Gal D, MacDonald PC, Porter JC, et al. Effect of cell density and confluency on cholesterol metabolism in cancer cells in monolayer culture. Cancer Res. 1981;41(2):473.
- Bereiter-Hahn J, Münnich A, Woiteneck P. Dependence of energy metabolism on the density of cells in culture. Cell Struct Funct. 1998;23(2):85.
- Chance K. Design and implementation of successful regulatory strategies in biosimilar development. In: Gutka H., Yang H., Kakar S. (eds). Biosimilars. AAPS Advances in the Pharmaceutical Sciences Series. Cham: Springer; 2018. p. 107.
- Brühlmann D, Sokolov M, Butté A, et al. Parallel experimental design and multivariate analysis provides efficient screening of cell culture media supplements to improve biosimilar product quality. Biotechnol Bioeng. 2017;114(7):1448.
- Puhka M, Takatalo M, Nordberg M, et al. Metabolomic profiling of extracellular vesicles and alternative normalization methods reveal enriched metabolites and strategies to study prostate cancer-related changes. Theranostics. 2017;7:3824.
- Altadill T, Campoy I, Lanau L, et al. Enabling metabolomics based biomarker discovery studies using molecular phenotyping of exosome-like vesicles. PLoS One. 2016;11(3):e0151339.
- Iraci N, Gaude E, Leonardi T, et al. Extracellular vesicles are independent metabolic units with asparaginase activity. Nat Chem Biol. 2017;13(9):951.
- Clos-Garcia M, Loizaga-Iriarte A, Zuñiga-Garcia P, et al. Metabolic alterations in urine extracellular vesicles are associated to prostate cancer pathogenesis and progression. J Extracell Vesicles. 2018;7(1):1470442.