
ABSTRACT
Biological nanoparticles, including viruses and extracellular vesicles (EVs), are of interest to many fields of medicine as biomarkers and mediators of or treatments for disease. However, exosomes and small viruses fall below the detection limits of conventional flow cytometers due to the overlap of particle-associated scattered light signals with the detection of background instrument noise from diffusely scattered light. To identify, sort, and study distinct subsets of EVs and other nanoparticles, as individual particles, we developed nanoscale Fluorescence Analysis and Cytometric Sorting (nanoFACS) methods to maximise information and material that can be obtained with high speed, high resolution flow cytometers. This nanoFACS method requires analysis of the instrument background noise (herein defined as the “reference noise”). With these methods, we demonstrate detection of tumour cell-derived EVs with specific tumour antigens using both fluorescence and scattered light parameters. We further validated the performance of nanoFACS by sorting two distinct HIV strains to >95% purity and confirmed the viability (infectivity) and molecular specificity (specific cell tropism) of biological nanomaterials sorted with nanoFACS. This nanoFACS method provides a unique way to analyse and sort functional EV- and viral-subsets with preservation of vesicular structure, surface protein specificity and RNA cargo activity.
Introduction
Extracellular vesicles (EVs) are derived from a number of origins including: tumour, immune, and other cells, and carry microRNA and protein messages that mediate intercellular communication with other distant cells [Citation4–Citation7]. These EVs are of significant interest as biomarkers and mediators of disease, prognosis, and response to therapy [Citation8,Citation9]. However, prior studies have been limited, largely due to bulk EV preparations that represent complex mixtures of EVs from multiple cell types, making it difficult or impossible to determine the origins and functions of specific EV subsets. To take full advantage of EVs as biomarkers, and to fully decode their roles in biological processes, it is necessary to first sort them into subsets of different origin and cell types, with defined yield and purity.
While sorting cells is commonplace, the majority of EVs are below the minimum detection threshold for even the most sensitive flow cytometers; the smallest overlapping with the system “reference noise”. Many high-sensitivity cell sorters are “jet-in-air” systems, meaning the stream suspending the particles is interrogated by lasers in air, rather than within a flow cell, as with flow cytometer analyzers.
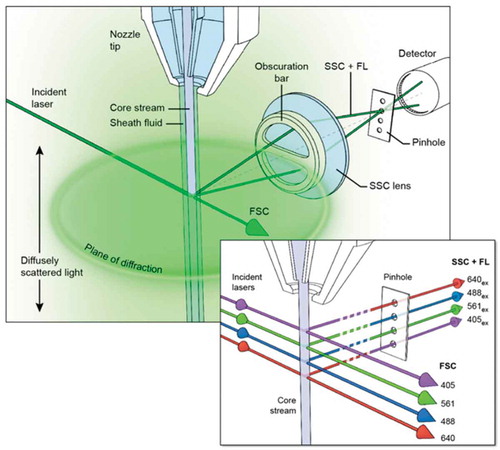
All laser-based optical instruments produce low levels of non-specific scattered light. With jet-in-air flow cytometers, a prominent feature of the non-specific light scattering is from the laser:stream intercept; sometimes referred to as a “ring of diffraction” or “plane of diffraction” [Citation10]. The majority of this plane scattered light along the plane of the laser:stream intercept does not reach a jet-in-air instrument’s detectors due to the presence of a blocker (or “obscuration”) bar between the stream and the collection lens. However, light scattered from the laser:stream intercept also scatters diffusely, beyond the plane of scattered light, and this creates background optical noise that cannot be fully eliminated by the obscuration bar [Citation11] (schematic diagram, ). The role of such scattered light in determining the instrument “noise floor” has previously been described [Citation10,Citation12]. However, the systematic assessment of the background noise in the context of small particle detection has not been reported previously. In contrast to published approaches, which use instrument settings to minimise or eliminate the background noise, here we tested multiple high-sensitivity sorters (Supplementary Table 1) and demonstrate that systematic interrogation and monitoring of this background noise can provide useful information when optimising the instrument to improve the signal to noise ratio, monitor instrument stability, and visualise a partial representation of subthreshold materials when running complex biological samples [Citation11,Citation13]. Thus, we define this background noise population as “reference noise”, due to the reference information that it provides in each sample data set.
Figure 1. NanoFACS configuration.
Diagram showing the Beckman Astrios EQ optics configuration and noise sources at the stream:laser intersect. The characteristic plane of scattered light at the level of the laser intercept is blocked by the obscuration bar, while the diffusely scattered light is not.
The nanoFACS method was developed as a result of our efforts to optimise the ability of high-resolution flow cytometers to detect, analyse, and sort EVs and small viruses by improving the signal to noise ratio. This method, which we refer to as “nanoFACS,” is optimised for use with the MoFlo Astrios-EQ (Beckman Coulter), utilises a threshold on one side scatter (SSC) channel, and acquires SSC data on separate laser channels. Herein, we 1) provide the rationale for the selection of threshold and analysis channels for nanoFACS with the Astrios-EQ, 2) present a basic nanoFACS analysis of tumour and immune cell-derived EVs, and 3) demonstrate the high fidelity of nanoFACS for sorting EVs and HIV, with sufficient yields and preservation of vesicular structure and cargo (protein and RNA) for post-sort functional biological assays, demonstrating preservation of function.
Methods
Documentation and archival of methods and data
All EV-related methods, flow cytometric data, and flow cytometric methods for this manuscript have been recorded in EV-TRACK, deposited at the Flow Repository, and documented in Supplemental Table 2, in the minimum information for EV flow cytometry format of the ISEV-ISAC-ISTH Working Group (evflowcytometry.org). Links to these resources are available at: https://ccr.cancer.gov/node/20394.
Astrios-EQ nanoFACS development, implementation, and validation
All nanoFACS experiments, unless otherwise stated, were performed on a Beckman Coulter MoFlo Astrios-EQ flow cytometer with 5 lasers (355, 405, 488, 561 and 640 nm wavelengths). In addition to high-sensitivity forward scatter detectors (488ex-FSC), the Astrios EQ supports side scatter (SSC) detectors for all lasers, except the 355 nm laser. Furthermore, the Astrios-EQ system has inline sheath canister filters with 40 nm pore size. This filtration removes any particulates that may be present in the sterile sheath fluid as it travels to the nozzle. After instrument equilibration at operational pressures (60 psi for experiments with a 70-micron nozzle), rare background events are observed, which are attributable to cavitation (the formation of nano- and microbubbles), at the point of the abrupt transition of the sheath fluid from 60 psi to ambient pressure [Citation14,Citation15]. Further instrument evaluation methods can be found in Supplementary Information.
Instrument setup
To increase the number of photons reaching the forward scatter detector, the dual-PMT beam splitter and neutral density filter were removed, and a single forward scatter detector with the P1 mask was used. Instruments were aligned with Rainbow QC Beads (Spherotech), with detector settings then adjusted for nanoFACS detection and fine-tuning adjustments of the alignment were made with 100 and 200 nm FluoSpheres (Invitrogen).
Acquisition settings
Unless otherwise stated the triggering threshold was applied to the 561-SSC channel with analysis of the scatter on the 488-SSC channel. Samples were loaded at 1 psi differential pressure and then acquired at 0.3 differential pressure for analysis. For the coincident event detection experiment in Supplementary Figure 1a, loading and acquisition pressures were kept stable at 0.3 psi.
Reference noise setup
Instrument settings were adjusted to detect the non-planar optical noise (ie, the scattered light arising from the laser:stream intercept not blocked by the obscuration bar), referred to as the “reference noise”, at a rate of ~10–20% of the instrument’s expected sample event rate, usually in the region of 10,000–20,000 events s−1. This reference noise for sterile, 40 nm-filtered sheath fluid, represents random noise sampling, and, in some experimental samples it allows for the detection of a proportion of scattered light events associated with material which would otherwise be too dim to be detected. This reference noise event rate was monitored with all samples.
Fluorescence calibration and quantification
Quantum MESF (Molecules of Equivalent Soluble Fluorophore) FITC-5 beads and MESF PE-4 beads (Bangs laboratories) where diluted in PBS and run at ~200 events s−1, with the same instrument configuration as for EVs. Median fluorescence intensities were inputted into MESF Calculator Software (http://www.joshuawelsh.co.uk/fcm-mesf-calculator/). For calculation of regression curves, .fcs files were imported into the software with the regression parameter being written to the “.fcs” files and exported for downstream analysis in FlowJo v10.4.2.
Flow cytometer scatter-diameter modelling
The scatter-diameter relationship curve of particles measured using the Astrios EQ was calculated with the methodology first described by van der Pol et al with a collection half-angle of 30°[Citation2]. However, predictive scattering data of particles in SI units were normalised to flow cytometer arbitrary unit data with a single calibration factor. Modelling of particle scattering was calculated using Mie theory and implemented with scripts built upon the Matzler MATLAB (v2017a, Mathworks) scripts [Citation16].
Nanofacs sort settings
Viral sorting was performed in the NCI Vaccine Branch, with an Astrios EQ in a biosafety cabinet within a dedicated BSL-2 room, with room temperature maintained at 18–21°C. We performed the sorts shown in this manuscript with 70–95 kHz drop drive frequency, plate voltages of 3000–4000 V, and relatively low amplitudes, 8–15 V. The 561-SSC threshold was set to a constant reference noise rate that was equal to 5–20% of the maximum sample event rate. Sorting experiments were configured to sort EVs or virus into two conical tubes. Drop drive settings were checked at the time of instrument alignment, to ensure absence of drop drive noise.
Sorting EVs by nanoFACS
EVs labelled as described before were mixed in 1:1 ratio and sorted by nanoFACS at 75,000 events s−1. 5.7 × 10⁷ Violet+ and 1.7 × 10⁸ CFSE+ EVs were sorted over 15 h in 58 and 198 ml of sheath fluid, respectively. EVs were concentrated 131 and 431-fold with Amicon Ultra-15 ultrafiltration tubes (EMD Millipore) to run the reanalysis. Final EV yield was calculated with spike in beads and nanoFACS. Sort efficiencies ranged from 25 to 45%, and 1 to 10% of sorted particles were recovered after ultrafiltration.
Virus staining and sorting
PKH26 and PKH67 (Sigma) were used to stain 293T-derived HIV pseudovirions. Briefly, virus was diluted 4-fold using the provided diluent. Immediately prior to staining, the PKH dye was diluted 25-fold using the same diluent. The diluted virus was added to the diluted PKH, and immediately mixed by pipetting. After incubating for 5 min, while occasionally inverting the tube to mix, an equal volume of RPMI 1640 with 10% FBS was added to the virus-PKH mixture. The stained virus was then centrifuged at 15,000 g for 20 min and resuspended in 0.1μm filtered RPMI 1640 medium. Transmission electron microscopy was performed by the NCI Frederick Electron Microscopy Core.
Virus titration
2.5 x 10⁴ U373-MAGI cells per well in a 48-well plate were set up the day prior in the medium previously described [Citation17]. Virus was then added to plated cells and allowed to incubate for 48 h. Medium was removed, and cells were washed once with PBS. 0.5ml PBS/0.5% glutaraldehyde was added to each well and incubated at 4°C for 8–10 min. PBS/glutaraldehyde was removed, and cells were washed once with PBS. 200μL of PBS containing 0.5mg ml−1 X-Gal (5-bromo-4-chloro-3-indolyl-beta-D-galacto-pyranoside), 3 mM potassium ferricyanide, 3 mM potassium ferrocyanide, and 1 mM magnesium chloride was added per well. The plate was incubated at room temperature for 4 h, and then the substrate was replaced with PBS/0.1% sodium azide. Foci of infection were quantified by light microscopy.
Concentration determination with spike-in beads
200 nm Yellow-Green or Red FluoSpheres (Invitrogen) at 1.79 × 10⁸ ml−1 or 2.46 × 10⁸ ml−1, respectively (105-fold dilution of original tube for both) were spiked in EV preparations, mixed and run on the Astrios EQ. Bead count was used afterwards to calculate the EV concentration.
Nanoparticle tracking analysis of EVs and polystyrene beads
EV and bead concentrations and size distributions were characterised by Nanoparticle Tracking Analysis v3.1 with a NanoSight LM10 instrument (Malvern), equipped with a 405 nm LM12 module and EM-CCD camera (DL-658-OEM-630, Andor). Beads and EVs were diluted in PBS to capture 3–10 videos per sample, with a camera level of 13–14 for EVs and 10 for beads. Analysis of the videos was performed with threshold 4, automatic blur size and 11.4–12.9 pix maximum jump size.
Cell culture
PC3 and PC3-pip were provided by W. Heston (Cleveland Clinic) [Citation18] and cultured in RPMI supplemented with 10% foetal bovine serum, 1% L-glutamine and antibiotics. DC2.4 (provided by Kenneth Rock, University of Massachusetts) and 4T1 (ATCC) were cultured likewise with 0.1% β-mercaptoethanol. U373-MAGI-CXCR4CEM and U373-MAGI-CCR5E cell lines [Citation19] were obtained from the NIH AIDS Reagent Program, and cultured in DMEM 90%; foetal bovine serum, 10%; 0.2 mg ml−1 G418; 0.1 mg ml−1 hygromycin B; and 1.0 µg ml−1 puromycin. 293T cells were cultured in DMEM with 5% foetal bovine serum. Bone marrow derived dendritic cells were cultured as follows: 2 million marrow cells per plate were incubated for 3 days with 20 ng ml−1 GM-CSF (Peprotech) in 100 mm diameter dishes. Medium was renewed every 2–3 days. On day 8–10, cells were harvested and 4 × 10⁶ per plate were further cultured for 48 h in the presence of 10 ng ml−1 GMCSF and 1 µg ml−1 LPS (Peprotech).
EV production and isolation
Cells were cultured 2–3 days in EV-depleted medium. Briefly, 65 mL of 20% FBS containing phenol red-free RPMI was subjected to ultracentrifugation for 16 h at 4ºC and 100,000g in a 45Ti rotor. The top 50 ml of fluid was collected, and supplements added to culture cells at the same conditions as described before. EVs were isolated by serial ultracentrifugation at 4ºC as follows: supernatants containing EVs were precleared of cells, debris and other larger vesicles by centrifuging at 300 g for 10 min, 2000 g for 10 min, and 10,000 g for 30 min. Then EVs were pelleted at 100,000 g for 70 min in a fixed angle 70 Ti rotor and washed at the same speed and duration in a 120.1 rotor (Beckman Coulter). EVs were finally resuspended in PBS for further analysis. We confirmed that the purified EVs demonstrated expected profiles by electron microscopy and by Western blot. For transmission electron microscopy (TEM), EV suspensions were fixed with 2% glutaraldehyde and adsorbed to formvar/carbon coated TEM copper grids. Samples were evaluated on a JEOL 1011 transmission electron microscope, and digital images were acquired using AMT camera system.
Bulk EV staining with CFSE and Cell-Trace Violet dyes
5 x 10¹⁰ EVs isolated from 4T1 and DC2.4 cell cultures were stained separately with 80 µM CFSE or Cell-Trace Violet, respectively, for 2 h at 37ºC in a final volume of 500 µl of PBS. Unbound dye was removed with PD-10 columns separately, following manufacturer’s instructions (GE Healthcare). After columns were washed with PBS, samples were loaded and fractions 3 to 6 containing the labelled EVs collected.
PSMA and MHC-II staining
109 EVs pre-incubated with 2 µg of Fc Block in 10 µl of PBS, were stained with PE or AlexaFluor488-conjugated anti-PSMA antibody (clone LNI-17, BioLegend) or anti-IAIE (clone M5/114.15.2, BioLegend) for 15 min at room temperature with gentle agitation. Before staining, antibody aggregates were removed by air-driven centrifugation in an A118 rotor (Beckman Coulter). 1.5 µg of antibody in 120 µl of PBS were centrifuged at 22 psi for 5 min and then the top 70 µl were used for EV staining. Free antibody removal was carried out with qEV Original Columns (Izon), following manufacturer’s instructions. Fraction 9, containing the majority of EVs, was used for nanoFACS analysis.
EV capture and staining on beads
10 µm magnetic beads (Millipore) were coupled with 100 µg ml−1 biotinylated anti-PSMA antibody (clone LNI-17, BioLegend) for 1hour at room temperature with gentle agitation. EV capture was performed overnight at room temperature with rotation. For staining, EV-coated beads were blocked with Fc Block in a saline buffer containing 5 mg ml−1 casein, 25 mM Tris and 150 mM NaCl at pH7.4, and then PE-conjugated anti-PSMA was added at 10 µg ml−1 in same buffer for 15 min.
Western blotting
15 µg of material was lysed with buffer and heated to 95°C for 10 min before being cooled on ice. Samples were loaded onto 10–20% Tris Glycine gel (BioRad) and run at 75 V for 2 h. Gels were transferred to polyvinylidene difluoride membranes and blocked with Starting Block T20 (ThermoFisher Scientific). Primary antibodies; anti-tsg101 (ab83, Abcam) and anti-Alix (3A9, Cell Signaling), were diluted 1:1000 in Superblock T20 and incubated on ice with agitation overnight. After washing, secondary alkaline-phosphatase antibodies diluted 1:3000 were incubated for 1 h at room temperature with agitation before being washed and analysed on ChemiDoc Imaging System (BioRad).
Transmission electron microscopy
Transmission electron microscopy was conducted using the following protocol [Citation20]. Briefly, samples were incubated on a formvar carbon coated copper grid for 60 min followed by three washes with PBS. Samples were fixed with 2% glutaraldehyde for 10 min. Grids were then washed five times by PBS. Finally, 2% uranyl acetate negative stain was applied for 15 min to contrast the sample. Samples were imaged on a JEM 2010 transmission electron microscope (Jeol Ltd.) at 120kV.
Results
Development of the nanoFACS configuration on the Astrios EQ
Logically, the best laser channel on which to set the scatter triggering threshold is the one that supports the largest separation of signal from noise. This separation is influenced by the variance, or noisiness of each channel, as well as the scattering physics of the illuminated particle at each wavelength. To determine the best laser channel for setting a triggering threshold, nanobeads and EVs were acquired using different triggering threshold channels.
Determination of the largest separation between 100 nm beads and the reference noise was tested using different scattering and fluorescence trigger channels ()). The signal to reference noise separation for 100 nm polystyrene beads was larger with the 488ex-SSC and 561ex-SSC detectors than with the 488ex-FSC detector, and that optimal separation on 488ex-SSC was achieved using a 561ex-SSC channel threshold, (), with the 488ex-SSC channel used for analysis, since the 488-nm laser on the Astrios EQ provided the largest increase in sample signal (separation index) for nanoparticles (). These data and further testing (see Supplementary Information) therefore demonstrated that experimentally the 561ex-SSC channel is the best instrument trigger channel on this instrument for small particle detection.
Figure 2. Determination of the triggering parameters that enhance the signal to reference noise separation of beads and EVs.
(a) Reference noise, 100, 200 and 500 nm polystyrene bead analysis by nanoFACS, in its optimal configuration with a 561-SSC trigger. (b) Separation index of Noise and 100 nm beads in multiple channels of analysis (x axis) following different triggers (488-SSC dark blue, 561-SSC green and 488-Fluorescence light blue). Triggering channels were not used to analyse the separation index of the same channel (n.e.; not examined). (c) Contour plots of PBS, unstained DC2.4 EVs, and CFSE-stained DC2.4 EVs analysed by nanoFACS. X-axes are calibrated to molecules of equivalent soluble fluorophore (FITC), representative regression for axis conversion can be found in . Gating of noise, histograms of side scatter and FITC MESF, and the reproducibility of staining can be seen in Supplementary Figure 2a, b. (d) DC2.4 EV concentration obtained by spiking counting beads in the sample and using different channel triggers to determine the best trigger for particle enumeration. (e) DC2.4 diameter distribution obtained using nanoparticle tracking analysis. (f) comparison of unstained DC2.4 EV enumeration using nanoparticle tracking analysis and nanoFACS using spike-in beads. Error bars show the full range of obtained concentration with five replicates on Astrios EQ and 3 replicates using nanoparticle tracking analysis. Gating strategy for counting unstained DC2.4 EVs can be seen in Supplementary Figure 2c. Red boxes highlight system noise.
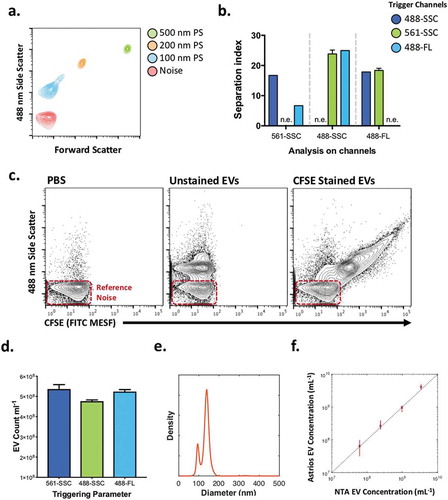
Figure 5. Phenotyping of MHCII+ and PSMA+ EVs.
(a) Comparison of unstained and PSMA-stained PC3pip EVs and unstained and MHC II-stained BMDC EVs using FITC-conjugated fluorophore (top) and PE-conjugated fluorophore (bottom) with axes normalised to molecules of equivalent fluorophore. Red boxes highlight system reference noise. (b) Mean diameter distributions of PC3pip- and BMDC-EVs using nanoparticle-tracking analysis. (c) Regression curves for converting arbitrary unit axes to MESF values for PE (left) and FITC (right).

A unique feature of the nanoFACS configuration is the acquisition and analysis of system reference noise on the trigger channel. This is achievable and reliable on the Astrios EQ/MoFlo-XDP due to its digital processing attributes (see Supplementary Information). Setting the threshold to a reference noise rate of 5–20% of the maximum data acquisition rate (Supplementary Figure 1a) generates a random-strobe-like sampling effect that provides sampling of dim signals that would otherwise fall below the limit of instrument detection (or are selectively removed in other methods [Citation11,Citation21–Citation24]). Our use of the reference noise defines the limits of the instrument’s robust data capabilities and is an essential part of a valid nanoFACS data set (Supplementary Figure 1a). Just as populations of spiked in beads can be used as a reference point in flow cytometry assays, reference noise equally serves as an internal frame of reference in nanoFACS data and is possible due to the high event rate that the Astrios EQ supports (Supplementary Figure 1(a)). The scatter-diameter relationship of the instrument can be seen in Supplementary Figure 1b. A crucial step to consider for all sorters tested (Supplementary Table 1) is the drop-drive settings which control droplet formation. Depending on the drop-drive setting used artefactual populations for both system noise and particles of interest can be created (Supplementary Figure 1c). Other potential sources of background light scattering and consequent background instrument noise include: stream diameter, core stream diameter (sample differential pressure), nozzle height, and sheath fluidics filtration.
Detection of CFSE-labelled EVs using nanoFACS configuration
To test the capability of the developed nanoFACS configuration on biological nanoparticles, CFSE-labelled dendritic cell line-derived (DC2.4) EVs were acquired using the above settings and showed that the majority of EVs were clearly resolved from system reference noise. The distinction between the CFSE-labelled EV population and the reference noise is most evident when applying a two-dimensional analysis with scatter and fluorescence (, Supplementary Figure 2(a)).
The separation of EVs from reference noise allowed us to quantify and compare the fluorescence associated with the labelled EVs and the background fluorescence associated with reference noise (), using units of MESF (Molecules of Equivalent Soluble Fluorophore). By using spike in polystyrene beads as relative counting beads, we confirmed a similar EV count whether we triggered the Astrios EQ with 488-SSC, 561-SSC, or 488ex/513em- fluorescence (488-FL). These results demonstrate the ability of nanoFACS to resolve a large proportion of EVs over the background noise and perform multiparametric fluorescence- and scatter-based assays for the analysis of EVs (). The CFSE staining method along with the use of DC2.4 EVs as reference standards for nanoFACS over several experiments was found to be very reproducible (Supplementary Figure 2a, b). Furthermore, a comparison of unstained DC2.4 EV concentration measurements using nanoparticle tracking analysis () were highly comparable to those obtained using the nanoFACS configuration when using spike-in beads for counting (), indicative of the DC2.4 EV population being detected to the same extend as with nanoparticle tracking analysis (Representative gating strategy in Supplementary Figure 2c), as previously published [Citation25].
Sorting of tumour- and immune-derived EVs using nanoFACS configuration
Utilising CFSE and Cell-Trace violet staining, we next evaluated the ability of nanoFACS to support high-speed EV sorting by using exosome EVs produced by immune (DC2.4, immature mouse dendritic cells) and tumour (4T1, mouse mammary carcinoma) cell lines (). Western blots () confirmed good preparation purity and classical EV cargo. Purified EVs were analysed with nanoparticle tracking analysis to confirm vesicle diameter distribution and concentration (). NanoFACS analysis of DC2.4 EVs and 4T1 mammary tumour-derived EVs showed a well-resolved population above the reference noise ().
Figure 3. Immune and tumour-derived EV sorting of fluorescently labelled EVs.
(a) Representative dot plots of PBS and mixed 4T1 and DC2.4 EVs (b) Presort dot plots of PBS and mixed EVs (top), post-sort reanalysis of DC2.4 EVs and 4T1 EVs (bottom). Red boxes highlight system noise. Sort gating strategy can be found in Supplementary Figure 2d. (c) Summary of gate quadrant events from highlighting sort efficiency, lack of coincidence detection, and percentage purity (d) Western Blot validation of unsorted DC2.4- and 4T1-EVs. (e) Diameter distributions of DC2.4- and 4T1-EVs using nanoparticle-tracking analysis. (f) TEM of unsorted DC2.4 EVs.
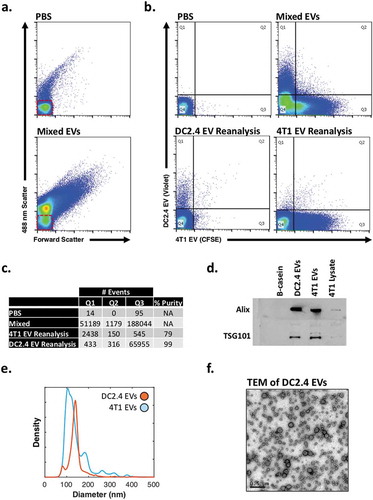
Cell-Trace Violet labelled DC2.4 EVs and CFSE-labelled 4T1 EVs were mixed () and sorted in purity mode (one EV per sorted drop, rejecting drops with events within a one drop envelope), at a sample rate of ~75,000 events s−1. The sorting gating strategy can be seen in Supplementary Figure 2d. Sorted samples were concentrated with centrifugal concentrators (Centricon 10-30K) and reanalysed to assess sorting fidelity. Sort fidelity for DC2.4 EV and 4T1 EV () populations was 78 and 99%, respectively, as shown in reanalyses that demonstrate relative purity of the sorted population, without significant contamination of EVs from outside of the sorted gate. Diameter distributions, western blots and transmission electron microscopy (TEM) were carried out to confirm the presence of EVs in the preparations ().
Sorting intact, functional vesicles using nanofacs configuration
EVs are of biological interest due to the “packets of information” that they carry. As such, it is essential that sorting methods for studying EV subsets are compatible with producing intact “packets”, with functional protein and RNA cargo.
BaL, a CCR5-tropic HIV strain, and NL4.3, a CXCR4-tropic strain, were produced as replication incompetent pseudoviruses in 293T cells [Citation26,Citation27]. We chose to sort these viral strains from one another because they utilise different co-receptors for viral entry and infect only target cells that express the appropriate co-receptors. This provided us with a model method to test the nanoFACS configuration’s ability to sort pure and functional viral particles using a U373-MAGI reporter cell assay. Demonstration of functional activity in the sorted viral vesicles in the post-sort U373-MAGI reporter cell assays requires, intact structure, surface receptors and RNA cargo. Re-analyses of the sorted products were performed to confirm sort purity by flow cytometry.
PKH26 (red) labelled BaL and PKH67 (green) labelled NL4.3 stained viral preparations were combined and diluted for sorting. For BaL, approximately 138 focus-forming units per mL (FFU mL−1) were used, and for NL4.3, 800 FFU mL−1. This titre was determined by titration on U373-MAGI cells expressing the appropriate co-receptor. The two viral populations were mixed in approximately equal parts for sorting (). Labelled BaL and NL4.3 viruses were clearly distinguished on the 561ex/579em channel and 488ex/513em channel, respectively (). Coincidence detection was minimal with a double positive population of particles being < 1%. The viruses were then sorted, and upon re-analysis (), the ratio of viral subtypes demonstrates greater than >94% specificity/purity in both examples, , and illustrates that the viruses remained intact with expected morphology confirmed by electron microscopy, , left panels.
Figure 4. NanoFACS sorting and re-analysis of HIV.
(a) Representative dot plots of PBS and mixed virus scattering. (b) Presort dot plots of PBS and mixed virus (top), post-sort reanalysis of NL4.3 virus and Bal virus (bottom). (c) Summary of gate quadrant events from highlighting sort efficiency, lack of coincidence detection, and percentage purity. Red boxes highlight system noise. (d) Shows electron micrographs with representative pre- (top left) and post- (bottom left) nanoFACS sorted viral material, demonstrating characteristic viral features (immature and mature virus particles are visible, as well as well-defined cone-shaped core structures). Microscopy shows that nanoFACS sorted virus from specifically infects only the cell line expressing the appropriate co-receptor for the respective sorted viral population. HIV-1 Bal (CCR5-tropic) stained with PKH26 and HIV-1 NL4.3 (CXCR4-tropic) stained with PKH67 were sorted apart from one another and titred on reporter U373-MAGI-CCR5 and U373-MAGI-CXCR4 cells, which show β-Gal (blue) staining when infected (arrows). Sorted CCR5-tropic Bal viral particles infect cells expressing CCR5 (top middle), but not cells expressing CXCR4 (bottom middle). Sorted NL4.3 does not infect cells expressing CCR5 (top right) but does infect cells expressing CXCR4 (bottom right).
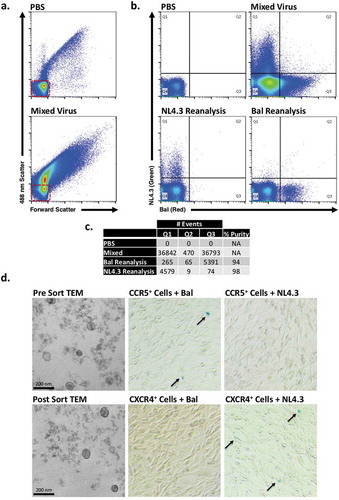
To confirm the infectious nature of the sorted viral populations and to demonstrate the specificity of the sorted subpopulations, we titred pre-sorted and post-sorted samples on U373-MAGI co-receptor cell lines in a transcriptional reporter assay. In this assay, viral infection of cells was demonstrated by blue (X-Gal) staining. shows that sorted BaL and NL4.3 viral particles infected only cells which expressed their specific co-receptor (CCR5 and CXCR4, respectively). The appearance of blue cells, therefore, demonstrates co-receptor-mediated viral entry (functional protein on sorted viral particles) and HIV viral transcription (functional RNA cargo within sorted viral particles). After sorting, BaL was titred at 125 FFU mL−1, and NL4.3 was titred at 175 FFU mL−1. Thus, both viral preparations proved to be infectious, and both strains demonstrated preservation of co-receptor specificity after sorting.
These results demonstrate that high speed sorting with high voltage-based droplet separation, using a flow cytometer configured for nanoFACS, produces intact nanoscale biological material with active RNA and protein, with preservation of pre-sort biological activity and molecular specificity.
Detection of tumour and immune markers on EVs using nanoFACS configuration
While detection of non-specific EV labels is feasible on many platforms to different degrees, detection of specific epitopes with conventional antibodies is a major goal of EV flow cytometry. EVs are heterogeneous populations of secreted exosomes and microvesicles. Single EV phenotyping is a powerful method to better understand EVs from cancer cell models, as well as animal models. We therefore tested the ability of the nanoFACS configuration to detect prostate specific membrane antigen (PSMA), a tumour biomarker commonly associated with androgen insensitivity in prostate cancer; and major histocompatibility complex class II (MHC II) on EVs from PC3pip cell lines and bone marrow-derived dendritic cells (BMDCs), respectively.
The PC3-pip cell line has been engineered to express PSMA, whereas the PC3 cell line is not [Citation18]. PSMA expression on PC3pip EVs was confirmed by phenotyping the cell lines, performing conventional bead-based phenotyping, and comparing single EV analysis of PC3- and PC3pip-EVs using the nanoFACS configuration (Supplementary Figure 3a-d). Both PC3-pip-EV and BMDC EV populations show clear separation from the instrument noise with light scattering (488ex-SSC, ). Both PC3-pip- and BMDC-EVs show a consistent increase in MESF units for both PE- and FITC-conjugated PSMA antibodies (). Diameter distributions of the PC3-pip- and BMDC-EVs along with calibration curves converting PE and FITC arbitrary unit axes to MESF units can be seen in , respectively.
We have also found that in the absence of a size exclusion chromatography (SEC) washing step, there was a shift of the reference noise fluorescence intensity, consistent with detection of the presence of free antibody in the sample preparation (Supplementary Figure 3e). The removal of free antibody by SEC increased the resolution of vesicles positive for MHC class II in bone marrow-derived dendritic cell (BMDC) EVs.
Discussion
In this manuscript, we describe a new method for the analysis of EVs and other nanoparticles by high resolution flow cytometry that relies on the systematic analysis of the background reference noise. This reference noise provides a partial window into the events that fall under the threshold, and it provides useful information that guarantees the correct performance of the nanoFACS analysis.
EVs present important challenges for the field of flow cytometry due to their dim scattering properties and low antigen densities. We found that, with the nanoFACS approach described herein, dual characterisation of EVs by scatter and fluorescence improves identification and the sensitivity of detection of EVs. By these means, we were able to characterise both the MESF units of EV populations and the reference noise, which is a close approximation to the “limit of detection” or sensitivity of the instrument.
Our nanoFACS approach is different from other previously described nanoscale flow cytometry methods in the following key ways:
1) Although fluorescence parameters are integral to the use of nanoFACS, nanoFACS does not require the use of a fluorescence trigger. The use of a high-sensitivity scatter parameter in allows a more complete representation of the population to be seen, analysed, and managed with respect to choices of sort parameters and gates.
2) NanoFACS requires no aggregation of EVs to beads, as is used in other flow cytometry approaches for studying EVs and other nanoparticles [Citation28]. When nanoFACS is performed with appropriate sample dilutions and instrument configurations, particles are visualised as truly single particles. By detecting the particles alone, without binding them to beads, it is expected that the nanoFACS method better preserves particle scatter attributes and biological function. We have previously demonstrated the nanoFACS configuration’s scattering sensitivity with Mie modelling and it’s capability to detect single 40 nm Au and Ag particles [Citation29].
3) NanoFACS provides a high-speed method that can be used for preparative sorting for a wide range of biological or inorganic nanoparticles, with preservation of functional activity. To our knowledge, nanoFACS is the first method for which functional vesicular structure, protein, and RNA have been validated for nanovesicles.
4) The nanoFACS method uses flow cytometers at the limits of their intended detection range. As such, the threshold is set at a level that allows a well-delineated sampling of the system reference noise, which we detect at, and just above, the set triggering threshold. Because this reference noise is somewhat analogous to a random strobe, our nanoFACS triggering method provides a method for evaluating dimly scattered light signals that otherwise would have been too dim to be detected with conventional trigger configurations. Thus, nanoFACS provides a partial representation of the scattered light or fluorescence from particles or molecules that are too dim to be fully resolved, including unbound antibodies or labels. During sorting, it is very helpful to have this means of monitoring what is being “missed” (ie, what material falls below the range of full detection by the instrument), since any relevant material that falls below the threshold will fail to be excluded in sorting protocols. This problem is familiar to flow cytometrists who sort cells from blood samples and may have platelet or RBC contaminants in the sorted cell products if signals for those objects fall below the level of the sorter’s threshold setting. When sorting, “subthreshold” information obtained with nanoFACS informs the sort operator as to what types of subthreshold events would be collected along with the selected sort populations, in order to determine whether alternate staining or separation strategies should be tested.
In summary, we found that this nanoFACS sorting configuration produces preparative quantities of EVs and viral subsets preserving the functional biological cargo for subsequent functional studies or – omics assays [Citation17]. This approach and nanoFACS configuration for the Astrios-EQ instrument detects and sorts biological vesicles, such as EVs and viruses, in a fashion that enables multi-parametric characterisation and sorting of individual EVs for functional studies in a manner that is not feasible by bulk approaches (such as bead-based, centrifugal, or microfluidics [Citation30,Citation31] methods) or by high resolution cytometric analysers [Citation32].
Forty years ago, the development of flow cytometric cell sorting was a critical step towards the evolution of our modern understanding of cellular subsets and functions. Because flow cytometric sorting is an essential tool in the characterisations of subpopulations of particles (cells or EVs), we expect that this nanoFACS method will be a useful tool for future studies that require the analysis and sorting of exosomes, viruses, microvesicles, and other submicron biomaterials [Citation33,Citation34].
Author contributions
JCJ, MB, EJF, CDR, JVD, JT, VT, DRP, KW, SP, KM, RO, IG, and WT designed and performed various instrument tests to improve nanoFACS configurations (improved instrument signal:noise performance and tested technical aspects of assay performance). TAM, AMK, TD, MRG, JAB, and JCJ designed the biological assays to test the nanoFACS method. JCJ, TM, TD, and AMK performed the assays for testing nanoFACS with biological materials. JCSW, SP, and JCJ developed the use of the LED-pulser to facilitate evaluation of instrument background noise. LP, JAB, MT, AMK, and JCJ designed and performed tumour and immune EV staining experiments. JCJ, JAW, AR, AHK, GJF, JBT, PG, AP, SJK, PC, BY, XC, MT, and HK provided input, materials, and assistance with experiments and interpretation of results. All coauthors wrote and/or edited the manuscript.
Supplemental Material
Download Zip (1.6 MB)Acknowledgments
The authors would like to thank Mario Roederer (NIH), Dragan Maric (NIH), Bridget McLaughlin (UC Davis), Giacomo Vacca (Kinetic River Corporation), Tim Knaak (Stanford), Cathy Crumpton (Stanford), Penny Chisholm and Stephen Biller (MIT), John Daly (DFCI), Samuel Strober (Stanford), Ronald and Shoshana Levy (Stanford), Marca Wauben, Ger Arkesteijn and Sten Libgrets (University of Utrecht), and John Nolan (Scintillon Institute, San Diego) for helpful discussions during the development of the nanoFACS methods presented here. We also thank the Beckman Coulter Flow Cytometry and Life Sciences groups for their work with the NCI Vaccine Branch as part of a Collaborative Research and Development Agreement. We also thank Kunio Nagashima and Ulrich Baxa for performing the EM analysis of sorted virus. The following reagents were obtained through the NIH AIDS Reagent Program, Division of AIDS, NIAID, NIH: U373-MAGI-CCR5E and U373-MAGI-CXCR4CEM, from Dr. Michael Emerman. This research was supported in part by the Intramural Research Programs of the National Cancer Institute and National Institute of Biomedical Imaging and Bioengineering, and by the NCI Assistant Clinical Investigator Program (JCJ), an Innovative Partnership Grant from the Beckman Foundation (MB and DP, Stanford FACS Core), a Radiological Society of North America Research & Education Foundation Resident Research Grant (JCJ), a Leukemia Lymphoma Society grant (SJK and JCJ), and NIH grants: 1ZIABC011502 (JCJ); S10RR025518-01 (MB); S10 RR12964 (JVD); S10 RR 026825 (JVD); P01AI054456 (GJF); U01-126497 (IG); U01-OD-019750 (IG); R01 CA218500 (IG and JCJ); R01 HL1266497 (IG); and R01AI089955 (GJF); C06-RR12088 (JVD); P30 CA0933730 (JVD).
Supplementary materials
Supplemental data for this article can be accessed here.
Additional information
Funding
Related Research Data
References
- van der Pol E, Coumans FAW, Grootemaat AE, et al. Particle size distribution of exosomes and microvesicles determined by transmission electron microscopy, flow cytometry, nanoparticle tracking analysis, and resistive pulse sensing. J Thromb Haemost. 2014;12:1182–14.
- van der Pol E, van Gemert MJ, Sturk A, et al. Single vs. swarm detection of microparticles and exosomes by flow cytometry. J Thromb Haemost. 2012;10:919–930.
- Erdbrugger U, Lannigan J. Analytical challenges of extracellular vesicle detection: A comparison of different techniques. Cytometry A. 2016;89:123–134.
- Raposo G, Stoorvogel W. Extracellular vesicles: exosomes, microvesicles, and friends. J Cell Biol. 2013;200:373–383.
- Robbins PD, Morelli AE. Regulation of immune responses by extracellular vesicles. Nat Rev Immunol. 2014;14:195–208.
- Chalmin F, Ladoire S, Mignot G, et al. Membrane-associated Hsp72 from tumor-derived exosomes mediates STAT3-dependent immunosuppressive function of mouse and human myeloid-derived suppressor cells. J Clin Invest. 2010;120:457–471.
- Mathivanan S, Ji H, Simpson RJ. Exosomes: extracellular organelles important in intercellular communication. J Proteomics. 2010;73:1907–1920.
- Zitvogel L, Regnault A, Lozier A, et al. Eradication of established murine tumors using a novel cell-free vaccine: dendritic cell-derived exosomes. Nat Med. 1998;4:594–600.
- Viaud S, Théry C, Ploix S, et al. Dendritic cell-derived exosomes for cancer immunotherapy: what‘s next?. Cancer Res. 2010;70:1281–1285.
- Shapiro HM. Practical Flow Cytometry. John Wiley & Sons; 2005.
- van der Vlist EJ, Nolte-‘T Hoen EN, Stoorvogel W, et al. Fluorescent labeling of nano-sized vesicles released by cells and subsequent quantitative and qualitative analysis by high-resolution flow cytometry. Nat Protoc. 2012;7:1311–1326.
- Nolan JP, Stoner SA. A trigger channel threshold artifact in nanoparticle analysis. Cytometry A. 2013;83:301–305.
- Stoner SA, Duggan E, Condello D, et al. High sensitivity flow cytometry of membrane vesicles. Cytometry A. 2016;89:196–206.
- Arieli R, Marmur A. Dynamics of gas micronuclei formed on a flat hydrophobic surface, the predecessors of decompression bubbles. Resp Physiol Neurobi. 2013;185:647–652.
- Morch KA. Cavitation inception from bubble nuclei. Interface Focus. 2015;5:20150006.
- C., M.. MATLAB functions for Mie scattering and absorption. 2002–11.
- Musich, T., Jones, J.C., Keele, B.F., et al. Flow virometric sorting and analysis of HIV quasispecies from plasma. JCI Insight. 2017;2:e90626.
- Chang SS, Reuter VE, Heston WD, et al. Five different anti-prostate-specific membrane antigen (PSMA) antibodies confirm PSMA expression in tumor-associated neovasculature. Cancer Res. 1999;59:3192–3198.
- Vodicka MA, Goh WC, Wu LI, et al. Indicator cell lines for detection of primary strains of human and simian immunodeficiency viruses. Virology. 1997;233:193–198.
- Lasser C, Eldh M, Lotvall J. Isolation and characterization of RNA-containing exosomes. J Vis Exp. 2012;59:e3037.
- Higginbotham JN, Zhang Q, Jeppesen DK, et al. Identification and characterization of EGF receptor in individual exosomes by fluorescence-activated vesicle sorting. J Extracell Vesicles. 2016;5:29254.
- Cao Z, Li C, Higginbotham JN, et al. Use of fluorescence-activated vesicle sorting for isolation of Naked2-associated, basolaterally targeted exocytic vesicles for proteomics analysis. Mol Cell Proteomics. 2008;7:1651–1667.
- Groot Kormelink T, Arkesteijn GJA, Nauwelaers FA, et al. Prerequisites for the analysis and sorting of extracellular vesicle subpopulations by high-resolution flow cytometry. Cytometry A. 2016;89:135–147.
- Danielson KM, Estanislau J, Tigges J, et al. Diurnal variations of circulating extracellular vesicles measured by nano flow cytometry. PLoS One. 2016;11:e0144678.
- Morales-Kastresana A, Telford B, Musich TA, et al. Labeling extracellular vesicles for nanoscale flow cytometry. Sci Rep. 2017;7:1878.
- Musich T, O’Connell O, Gonzalez-Perez MP, et al. HIV-1 non-macrophage-tropic R5 envelope glycoproteins are not more tropic for entry into primary CD4+ T-cells than envelopes highly adapted for macrophages. Retrovirology. 2015;12:25.
- Musich T, Peters PJ, Duenas-Decamp MJ, et al. A conserved determinant in the V1 loop of HIV-1 modulates the V3 loop to prime low CD4 use and macrophage infection. J Virol. 2011;85:2397–2405.
- Arakelyan A, Fitzgerald W, Margolis L, et al. Nanoparticle-based flow virometry for the analysis of individual virions. J Clin Invest. 2013;123:3716–3727.
- Welsh JA, Kepley J, Rosner A, et al. Prospective use of high-refractive index materials for single molecule detection in flow cytometry. Sensors. (Basel, Switzerland). 2018;18(8):pii: E2461.
- Im H, Shao H, Park YI, et al. Label-free detection and molecular profiling of exosomes with a nano-plasmonic sensor. Nat Biotechnol. 2014;32:490–495.
- Jeong S, Park J, Pathania D, et al. Integrated magneto-electrochemical sensor for exosome analysis. ACS Nano. 2016;10:1802–1809.
- Zhu S, Ma L, Wang S, et al. Light-scattering detection below the level of single fluorescent molecules for high-resolution characterization of functional nanoparticles. Acs Nano. 2014;8:10998–11006.
- Hulett HR, Bonner WA, Barrett J, et al. Cell sorting: automated separation of mammalian cells as a function of intracellular fluorescence. Science. 1969;166:747–749.
- Parks DR, Bryan VM, Oi VT, et al. Antigen-specific identification and cloning of hybridomas with a fluorescence-activated cell sorter. Proc Natl Acad Sci U S A. 1979;76:1962–1966.