
 ?Mathematical formulae have been encoded as MathML and are displayed in this HTML version using MathJax in order to improve their display. Uncheck the box to turn MathJax off. This feature requires Javascript. Click on a formula to zoom.
ABSTRACT
Neuroblastoma accounts for 15% of childhood cancer mortality. Amplification of the oncogene N-Myc is a well-established poor prognostic marker for neuroblastoma. Whilst N-Myc amplification status strongly correlates with higher tumour aggression and resistance to treatment, the role of N-Myc in the aggressiveness of the disease is poorly understood. Exosomes are released by many cell types including cancer cells and are implicated as key mediators in cell-cell communication via the transfer of molecular cargo. Hence, characterising the exosomal protein components from N-Myc amplified and non-amplified neuroblastoma cells will improve our understanding on their role in the progression of neuroblastoma. In this study, a comparative proteomic analysis of exosomes isolated from cells with varying N-Myc amplification status was performed. Label-free quantitative proteomic profiling revealed 968 proteins that are differentially abundant in exosomes released by the neuroblastoma cells. Gene ontology-based analysis highlighted the enrichment of proteins involved in cell communication and signal transduction in N-Myc amplified exosomes. Treatment of SH-SY5Y cells with N-Myc amplified SK-N-BE2 cell-derived exosomes increased the migratory potential, colony forming abilities and conferred resistance to doxorubicin induced apoptosis. Incubation of exosomes from N-Myc knocked down SK-N-BE2 cells abolished the transfer of resistance to doxorubicin induced apoptosis. These findings suggest that exosomes could play a pivotal role in N-Myc-driven aggressive neuroblastoma and transfer of chemoresistance between cells.
Abbreviations: RNA = ribonucleic acid; DNA = deoxyribonucleic acid; FCS = foetal calf serum; NTA = nanoparticle tracking analysis; LC-MS = liquid chromatography–mass spectrometry; KD = knockdown; LTQ = linear trap quadropole; TEM = transmission electron microscopy
Introduction
Neuroblastoma is the most common solid tumour in children that arises from the sympathetic nervous system and accounts for 15% of childhood cancer mortality [Citation1]. Neuroblastoma is mostly present as a mass in pelvis, neck, abdomen and chest [Citation2]. Neuroblastoma patients suffer from loss of weight, fever, anaemia and irritability. Due to its highly variable symptoms, the disease usually has metastasised to secondary locations by the time of diagnosis in most cases. Majority of the neuroblastoma deaths occur within two years of diagnosis due to the aggressiveness of the cancer [Citation3]. About 20–30% of neuroblastoma patients are presented with the amplification of the oncogene N-Myc and is considered high-risk. Whilst N-Myc amplification status strongly correlates with higher tumour aggression and resistance to treatment, the role of N-Myc in the aggressiveness and progression of the disease is poorly understood [Citation4]. As N-Myc is a transcription factor, it can be speculated that the N-Myc can modulate the secretion of key proteins that may play a pivotal role in tumorigenesis [Citation5].
Exosomes are small membranous extracellular vesicles that plays a key role in intercellular communication [Citation6,Citation7]. Exosomes are 30–150 nm in size and are formed by the inward budding of the multivesicular bodies [Citation8]. Exosomes are released by many cell types and can transfer its molecular cargo to the target cells there by modulating the signalling pathways in the recipient cells [Citation9,Citation10]. The secretion of exosomes and its purported role in intercellular communication is significantly different from the classical protein secretory pathway. Most importantly, the lipid bilayer of exosomes protect its cargo of proteins, RNA and DNA from harsh environmental conditions which is not the case with the classical secretory pathway [Citation11]. Though it is well established that exosomes secreted by cancer cells contain a tumour specific signature [Citation12], it is currently unknown whether exosomes from N-Myc amplified neuroblastoma cells can transfer the aggressive phenotype including chemoresistance between cells.
In this study, a comparative proteomic analysis of exosomes isolated from cells with different N-Myc amplification status was performed. Label-free quantitative proteomic profiling revealed 968 proteins that are differentially abundant in exosomes released by the neuroblastoma cells with varying N-Myc amplification status. Gene ontology-based analysis highlighted the enrichment of proteins involved in signal transduction, cell communication and growth in N-Myc amplified cell-derived exosomes. Incubation of N-Myc amplified cell-derived exosomes with non-N-Myc amplified cells induced migration, colony forming abilities and protected the cells against doxorubicin-induced apoptosis. These findings suggest that exosomes could play a pivotal role in N-Myc-driven aggressive neuroblastoma by transferring the aggressive phenotype to the neighbouring cells thereby aiding in cancer progression.
Materials and methods
SK-N-BE2 and SH-SY5Y cell culturing
SK-N-BE2 (ATCC) and SH-SY5Y (kind donation by Dr. Julie Atkins, La Trobe University) were cultured in DMEM (GIBCO, Life Technologies) supplemented with 10% FCS (GIBCO, Life Technologies) and 100 Unit/mL of penicillin-streptomycin (GIBCO, Life Technologies). Cells were incubated at 37°C in 5% CO2.
Isolation of exosomes by ultracentrifugation
When the cells reached 70–80% confluency, the cells were washed with PBS and supplemented with exosomes depleted FCS containing DMEM. After 24 h of incubation, the condition media was collected and subjected to differential centrifugation (500 g for 10 min then 2,000 g for 20 min). The supernatants were then subjected to ultracentrifugation at 100,000 g for 1 h at 4°C to pellet the vesicles. The pellets were washed with 1 mL PBS and subjected to ultracentrifugation at 100,000 g for 1 h at 4°C. The obtained pellets were resuspended in PBS and stored in −80°C.
OptiPrep™ density gradient centrifugation
To isolate exosomes, an iodixanol based OptiPrepTM density gradient separation method was utilized as described previously [Citation12]. Briefly, an iodixanol gradient was set by diluting 60% w/v stock of OptiPrepTM aqueous solution (Sigma Life Sciences®) in 0.25 M sucrose/10 mM Tris (pH 7.5) to achieve a gradient consisting of 40%, 20%, 10% and 5% w/v solutions. Next, the gradient was layered with 3 mL fractions from 40% followed by 20% and 10% w/v iodixanol solution. Lastly, 2.5 mL of 5% w/v iodixanol solution was added in a 12 mL polyallomer tube (Beckman Coulter). Next the exosomes pellets were resuspended in OptiPrep™ solution before over laying on top of the gradient. The tubes containing the gradients were then subjected to 100,000 g ultracentrifugation for 18 h at 4°C. Each fraction (1 mL each) was then collected and subjected to another round of ultracentrifugation at 100,000 g for 1 h at 4°C. Pellets were then washed with 1 mL of PBS and resuspended in 200 µL of PBS before storing in −80°C. As a control, OptiPrepTM gradient was run in parallel to determine the density of each fraction using 0.25 M sucrose/10 mM Tris, pH 7.5.
Transmission electron microscopy
Exosomes samples (0.2 mg/mL) were examined in JEM-2010 transmission electron microscope (JEOL, 80 kV). Preparations were fixed in 400 mesh carbon-layered copper grids for 2 mins. Surplus samples were drained by blotting and then the samples were negatively stained twice with 10 µL of uranyl acetate solution (2% w/v; Electron Microscopy Services).
Western blot analysis
Equal amounts of exosomal proteins and cell lysates (30 µg) were separated using SDS-PAGE at 150V. Next, Invitrogen XCell gel transfer stack system (Life technologies) was employed to transfer the proteins to nitrocellulose membrane. Membranes were blocked with skim milk before overnight probing with primary antibodies (1:1000 dilution) at 4°C overnight. The blots were then washed three times with TTBS. For visualization of protein bands, ODYSSEY CLx (LI-COR) was used after probing with fluorescent conjugated secondary antibodies (1:10,000 dilution) for 1 h at room temperature.
In gel digestion
Equal amount of exosomal protein samples (30 µg) were separated using SDS-PAGE. The separated protein bands were then stained with Coomassie Brilliant Blue stain for visualization. Using scalpel blades, the bands were extracted from the gel lanes and were subjected to reduction (10 mM DTT (Bio-Rad)), alkylation (25 mM iodoacetamide (Sigma)) and tripsinization (150 ng of trypsin (Promega)) as previously described [Citation13]. Acetonitrile (50% (w/v)) and 0.1% (v/v) trifluoroacetic acid were used for extracting digested peptides.
LC-MS/MS
LC-MS/MS was conducted using a LTQ Orbitrap Velos (Thermo Scientific) coupled with a nanoelectrospray interface, the nanoLC system was equipped with an Acclaim Pepmap nano-trap column (Dionex – C18, 100 Å, 75 μm× 2 cm) and an Acclaim Pepmap RSLC analytical column (Dionex – C18, 100 Å, 75 μm × 15 cm). For each sample run, 1 μL of the peptide mix was loaded onto the enrichment (trap) column at an isocratic flow of 3 μL/min of 3% (v/v) acetonitrile containing 0.1% (v/v) formic acid for 4 min before the enrichment column is switched in-line with the analytical column. The eluents used for the liquid chromatography were 0.1% (v/v) formic acid (solvent A) and 100% (v/v) acetonitrile 0.1% (v/v) formic acid (solvent B). A gradient of 3% B to 8% B for 1 min, 8% B to 35% B for 30 min, 35% B to 85% B in 5 min and was maintained at 85% B for the final 15 min. The LTQ Orbitrap Velos mass spectrometer was operated in the data dependent mode with nano ESI spray voltage of +1.6 kv, capillary temperature of 250°C and S-lens RF value of 60%. An m/z change range of 300–2000 Da was accepted in the FT mode using a resolution of 30,000 after amassing to 1.00e6, where all spectra were acquired in positive mode. A maximum accumulation of 500 ms was expected, and the 20 abundant precursor ions above two charged states were segregated at a target value of 1000. Normalised collision energy of 30, activation Q of 0.25 and activation time of 10 ms were all set as standard parameters. Dynamic exclusion settings of two repeat counts over 30 sec and exclusion duration of 70 sec were applied.
Identification of proteins
The following parameters were used when generating the peak lists using Extract-MSn as part of Bioworks 3.3.1 (Thermo Scientific). Minimum mass 300; maximum mass 5,000; intermediate scans 200; minimum group count 1; 10 peaks minimum and total ion current of 100. Next, each peak list obtained by LC-MS/MS runs were merged into a single mascot generic format files to enable MASCOT searches. Due to the high-resolution survey scan (30,000), automatic charge state recognition was used. A target decoy fashion using MASCOT, the LC-MS/MS spectra were then searched against the human RefSeq protein database. Search parameters used includes, fixed modification (carboamidomethylation of cysteine; +57 Da), variable modifications (oxidation of methionine; +16 Da), three missed tryptic cleavages, 20 ppm peptide mass tolerance and 0.6 Da fragment ion mass tolerance. Peptide identifications were deemed significant if the ion score was greater than the identity score. Significant protein identifications contained at least two unique peptide identifications with a false-discovery rate was less than 1%.
Label- free spectral counting
The relative protein abundance between exosomal samples was obtained by estimating the ratio of normalized spectral counts (Rsc) as previously described [Citation14]. When RSc is less than 1, the negative inverse RSc value was used
s = Significant MS/MS spectra for protein A
T = Total number of significant MS/MS spectra in the exosome sample
C = Correction factor set to 1.25
X and Y = Exosome samples
Nanoparticle tracking analysis
To analyse the size distribution of exosomes, NanoSight N300 (Malvern Instruments, Malvern, UK) was used. The samples were monitored with the use of a 640 nm laser. The exosomal sample volume was normalized to equal number (1 × 10⁶) of SK-N-BE2 and SH-SY5Y cells. The exosomal aggregations were separated using needle and syringe and simultaneously injected to the NanoSight sample cubicle. The frame rate used was 30 frames per second and NanoSight NTA3.2 software was used for data analysis.
Colony formation assay
SH-SY5Y cells (200 cells per well) were seeded in 6-well plates and were allowed to form colonies for 14 days. The colonies were stained using crystal violet (0.5% (w/v) crystal violet in 20% (v/v) methanol) and the number of colonies were quantified.
Transwell migration assay
Cell culture inserts (BD, San Diego, CA) with 0.8 μm pore size were used to perform the migration assay according to the manufacturer’s protocol. Upper chambers were inoculated with 1 × 10⁵ SH-SY5Y cells/mL in serum-depleted culture media. FCS (10% (v/v) containing culture media) was added to the bottom chambers and the cells were allowed to invade for 22 h at 37°C. Non-migratory cells were gently removed before fixing the migrated cells with 3% (v/v) paraformaldehyde. The cells were then stained with 0.5% (w/v) crystal violet in 20% (v/v) methanol. The stained cells were analysed by light microscopy.
Establishment of N-Myc shRNA expressing SK-N-BE2 stable cell line
The retroviral shRNA constructs for N-Myc were purchased from Origene. SK-N-BE2 cells (5 × 10⁵ cells per 2 mL of medium) were seeded prior to the transfection and Turbofectin (Origene) was used. After 24 h of transfection with 1 μg of shRNA plasmid, the medium was supplemented with 2 μg/mL puromycin for selection of transfected cells. Healthy colonies were then further transferred in to 6-well plates without puromycin. The efficiency of the knockdown was then monitored using Western blotting.
Wound healing assay
SH-SY5Y cells were seeded in 6-well plates and were allowed to reach monolayer of cells of 100% confluence. The monolayer of cells was then gently scratched with a pipette tip and the detached cells containing media was replaced with fresh media (FCS-depleted exosomes). The cells were then incubated in the presence and absence of exosomes varying in concentration (5 μg/mL, 10 μg/mL and 20 μg/mL) at 37ºC in 5% CO2. The area of wound closure was observed under the microscope at 0 h and 12 h.
FACS apoptosis assay
Equal number of SH-SY5Y cells were seeded in 24-well plates before treating the cells with 5 μg/mL, 10 μg/mL and 20 μg/mL of exosomes derived from SK-N-BE2, SH-SY5Y and N-Myc KD cells. For combinational and doxorubicin only treatments, 1 µM of doxorubicin was used. Then the cells were incubated for 48 h at 37ºC followed by staining with PI (Sigma Aldrich) and Annexin V (Life technologies) and were subjected to FACS apoptosis analysis.
Bioinformatics and statistical analysis
FunRich analysis tool was used to generate the Venn diagrams and heatmaps. Statistical significance of an experiment was analysed by student’s t-test.
Results
Isolation and characterization of exosomes from N-Myc amplified and non-amplified neuroblastoma cells
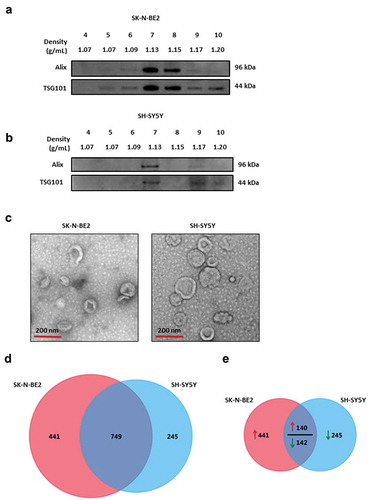
To understand the role of exosomes in neuroblastoma progression, SK-N-BE2 and SH-SY5Y cells were used. SK-N-BE2 cells have N-Myc amplification and are known to be more aggressive than the non-N-Myc amplified SH-SY5Y cells. To isolate exosomes, the conditioned media were collected from these cells and subjected to differential centrifugation followed by ultracentrifugation. The isolated exosomes were separated further by iodixanol density gradient (OptiPrep™) centrifugation. Density based separation produced 12 fractions of increasing density, ranging from 1.04 to 1.45 g/mL. To identify exosome enriched fractions, the samples were subjected to Western blot analysis (fractions 4–10) and then probed with exosomal enriched proteins Alix and TSG101 [Citation15]. As shown in , the exosomal markers were enriched in fractions 7 and 8 for SK-N-BE2 cells (density of 1.13 g/mL and 1.15 g/mL respectively). Similarly, Alix and TSG101 were enriched in fraction 7 corresponding to the density of 1.13 g/mL in SH-SY5Y cells (). In order to further confirm the presence of SH-SY5Y and SK-N-BE2 cell-derived exosomes, the samples were subjected to transmission electron microscopy (TEM). Morphological analysis by TEM revealed a homogenous population of cup-shaped membranous vesicles, with the range of 30–150 nm, confirming the presence of exosomes ().
Figure 1. Characterization of exosomes isolated from N-Myc amplified and non-amplified neuroblastoma cells.
(a) Western blot analysis of exosomal enriched proteins Alix and TSG101 in fractions obtained from OptiPrep density gradient centrifugation (SK-N-BE2 cells). TSG101 and Alix were enriched in fractions 7 and 8 corresponding to the buoyant density of 1.13 and 1.15 g/mL. (b) Western blot analysis representing the presence of Alix and TSG101 that are enriched in exosomes derived from SH-SY5Y cells. Fraction 7 contained a high abundance of Alix and TSG101. (c) TEM images of exosomes isolated by OptiPrep density gradient centrifugation suggested the presence of vesicles. (D) Venn diagram representing proteins present in exosomes derived from N-Myc amplified (SK-N-BE2) and non-amplified (SH-SY5Y) neuroblastoma cells. A total of 749 proteins are found to be common between the exosomes isolated from the two neuroblastoma cell lines. (e) Venn diagram depicting differentially abundant (>2-fold) proteins in SK-N-BE2 and SH-SY5Y cell-derived exosomes. A total of 581 proteins were enriched in exosomes derived from SK-N-BE2 cells compared to the exosomes from SH-SY5Y cells. Similarly, a total of 385 proteins were enriched in exosomes isolated from SH-SY5Y cells. The red arrow represents proteins that are of high abundance in SK-N-BE2 cell-derived exosomes compared SH-SY5Y cell-derived exosomes. Green arrow represents proteins that are of lower abundance in SK-N-BE2 cell-derived exosomes compared SH-SY5Y cell-derived exosomes.
Furthermore, nanoparticle tracking analysis (NTA) revealed that most of the isolated exosomes were 50–150 nm (Supplementary Figure 1A). Agreeing with the literature [Citation16], the more aggressive N-Myc amplified SK-N-BE2 cells secreted significantly higher number of exosomes compared to the less aggressive SH-SY5Y cells (Supplementary Figure 1B). This observation was further confirmed by total exosomal protein quantitation (Supplementary Figure 1C) and Western blotting (Supplementary Figure 1D). Here, exosomes were normalised to equal number of viable SK-N-BE2 and SH-SY5Y cells.
Proteomic analysis of SH-SY5Y and SK-N-BE2 cell-derived exosomes revealed the presence of exosomal markers
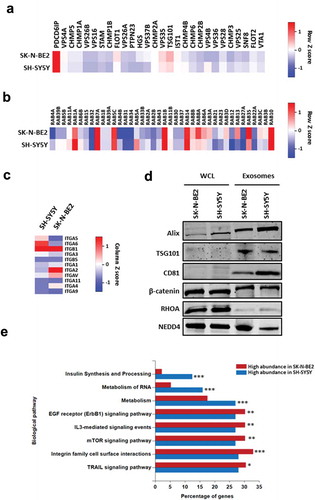
To characterise the exosomes isolated from N-Myc amplified and non-amplified neuroblastoma cells, label-free quantitative proteomics analysis was performed. A total of 1435 proteins were identified with two or more unique peptides with a false discovery rate (FDR) of less than 1%. Among the identified proteins, 749 proteins were common to both the exosomes while 441 proteins were unique in SK-N-BE2 cell-derived exosomes (). When the proteomic profiles were compared quantitatively, there were a total of 581 and 387 proteins that were differentially abundant in SK-N-BE2 and SH-SY5Y cell-derived exosomes, respectively (). Consistent with the Western blotting, proteomic analysis confirmed the presence of exosomal enriched proteins in both the samples (). Alix (PDCD6IP) was enriched in the exosomes isolated from both the neuroblastoma cell lines. Whereas, TSG101, FlOT1 and VPS35 were more enriched in exosomes derived from SK-N-BE2 cells compared to SH-SY5Y cell-derived exosomes. Next the presence of RAB GTPases which are enriched in exosomes were assessed in the proteomics data. RAB proteins usually participate in membrane trafficking, biogenesis and secretion of exosomes. As represented in , RAB13, RAB8A, RAB35, RAB3C and RAB3D were highly abundant in exosomes derived from SK-N-BE2 cells. On the contrary, RAB1A, RAB5A, RAB6B, RAB5B and RAB39B were highly abundant in SH-SY5Y cell-derived exosomes. Similarly, integrins that are implicated in regulating metastatic organotropism were also present in both the neuroblastoma cell-derived exosomes (). The abundance of exosomal proteins and the proteomics data was further validated by Western blotting analysis. As shown in , exosomal enriched proteins TSG101, Alix and CD81 were enriched in exosomes isolated from the neuroblastoma cells. Similarly, the exosomes contained signalling proteins such as NEDD4, β-catenin and RHOA. Interestingly, there was a shift in the molecular weights of Alix, TSG101 and β-catenin in exosomes compared to cell lysates. Although this could be due to a post-translational modification such as ubiquitination, further experiments need to be performed to confirm this phenomenon.
Figure 2. Proteomic analysis of SK-N-BE2 cell-derived exosomes are enriched with exosomal and signalling proteins.
(a) Heatmap of exosomal enriched proteins identified in exosomes isolated from neuroblastoma cells. Alix (PDCD6IP) was highly enriched in both the exosomal samples. (b) RAB proteins were differentially abundant in exosomes isolated from SK-N-BE2 and SH-SY5Y cells. RAB10, RAB14, RAB1B, RAB5C and RAB7A were detected in both the exosomal samples in high abundance. (c) The abundance of integrins in exosomes isolated from SK-N-BE2 and SH-SY5Y cells. (d) Western blotting based validation of proteins found in exosomes secreted from N-Myc amplified and non-amplified neuroblastoma cells. WCL = whole cell lysates. (e) FunRich based enrichment analysis of signalling pathways enriched in proteins differentially abundant in SK-N-BE2 and SH-SY5Y cell-derived exosomes. * denotes p < 0.05, ** denotes p < 0.01 and *** denotes p < 0.001 as determined by hypergeometric test.
Exosomes derived from SK-N-BE2 cells are enriched in proteins implicated in signal transduction and cell communication
In order to understand the biological process that are enriched in exosomal proteins, the proteomic data was analysed using FunRich [Citation17,Citation18]. Proteins that were highly abundant in SK-N-BE2 cell-derived exosomes were enriched in signal transduction, cell communication and transport (Supplementary Figure 2A). On the contrary, proteins highly abundant in SH-SY5Y cell-derived exosomes were enriched in protein metabolism, cell growth and/or maintenance and regulation of nucleic acid metabolism. Consistent with this observation, pathway enrichment analysis highlighted the significant enrichment of proteins implicated in EGFR, IL3, mTOR, integrin and TRAIL signalling in SK-N-BE2 cell-derived exosomes (). The cellular component analysis also revealed the significant enrichment of plasma membrane proteins in SK-N-BE2 cell-derived exosomes (Supplementary Figure 2B). Taken together, these data suggest that SK-N-BE2 cell-derived exosomes are enriched with proteins that could regulate various signalling pathways in the recipient cells.
Exosomes derived from N-Myc amplified cells transferred aggressiveness to non-N-Myc amplified recipient cells
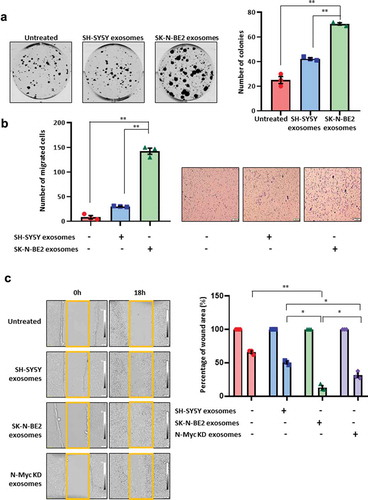
To understand the role of exosomes in the transfer of the aggressive phenotype to the recipient cells, colony forming ability of SH-SY5Y cells were investigated in the presence and absence of exosomes isolated by differential centrifugation coupled with ultracentrifugation (). Interestingly, SK-N-BE2 cell-derived exosomes treated SH-SY5Y cells had the highest number of colonies compared to untreated and SH-SY5Y exosomes treated SH-SY5Y cells (). Next the migratory ability of the SH-SY5Y cells were investigated by transwell migration assay. The N-Myc non-amplified SH-SY5Y cells when incubated with SK-N-BE2 cell-derived exosomes, showed a significant increase in migration compared to untreated and SH-SY5Y exosomes treated cells (). In concordance with the previous results, wound healing assay also revealed that SK-N-BE2 cell-derived exosomes significantly (compared to: untreated – p < 0.004; SH-SY5Y exosomes – p < 0.01) increased the migratory capability of SH-SY5Y cells and the wound closure was the highest among all the conditions (). In order to investigate whether the loss or downregulation of the oncogene N-Myc could regulate the function of SK-N-BE2 cell-derived exosomes, N-Myc knockdown (N-Myc KD) cells were generated using RNA inference in SK-N-BE2 cells (Supplementary Figure 3A). Exosomes were isolated from N-Myc KD cells (Supplementary Figure 3B) and wound healing assay was performed after treatment of SH-SY5Y cells with these exosomes (). Agreeing with our hypothesis, there was a decrease in wound healing ability of the SH-SY5Y cells that were treated with N-Myc KD cells compared to the exosomes derived from the wild type SK-N-BE2 cells. However, the migration capability of the cells treated with exosomes isolated from the N-Myc KD cells were slightly higher than the SH-SY5Y exosomes treated cells. Taken together, these data suggest that exosomes derived from N-Myc amplified neuroblastoma cells can promote recipient cell cancer progression.
Figure 3. Exosomes derived from SK-N-BE2 cells induce migration in SH-SY5Y cells.
(a) Colony forming abilities of SH-SY5Y cells treated with and without exosomes. SH-SY5Y cells (200 cells per well) were incubated with 10 µg/mL of exosomes isolated from SK-N-BE2 and SH-SY5Y cells. The SH-SY5Y cells in the presence of SK-N-BE2 cell-derived exosomes showed a significant increase in colony forming ability (n = 3). (b) Transwell migration assay performed on SH-SY5Y cells after treating with exosomes (10 µg/mL) isolated from SK-N-BE2 and SH-SY5Y cells. There was a significant increase in the migratory ability of SH-SY5Y cells upon SK-N-BE2 cell-derived exosomes treatment (n = 3). (c) Wound healing assay was performed on SH-SY5Y cells (n = 3). The monolayer of cells closed the wound faster when the cells were treated with SK-N-BE2 cell-derived exosomes (10 µg/mL). Error bars represent the standard error of mean, * denotes p < 0.05 and ** denotes p < 0.01 as determined by student’s t-test.
Exosomes derived from N-Myc amplified cells transferred chemoresistance to non-N-Myc amplified recipient cells
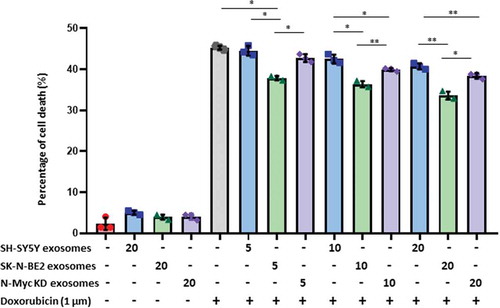
It is well established that N-Myc amplified cells are highly aggressive and resistant to treatment. Hence, we next investigated the role of N-Myc amplified cell-derived exosomes in transferring chemoresistance to the recipient cells. SH-SY5Y cells were incubated with increasing doses of exosomes (5, 10 and 20 μg/mL) isolated by differential centrifugation coupled with ultracentrifugation and subjected to doxorubicin treatment (). After 48 h, SH-SY5Y cells treated with exosomes alone did not exhibit a significant difference in apoptosis. As expected, doxorubicin (1 μM) only treatment induced more than 42% of apoptosis in SH-SY5Y cells. However, combinational treatment of SH-SY5Y cell-derived exosomes and doxorubicin did not alter the percentage of apoptosis. Interestingly, combinational treatment of SK-N-BE2 cell-derived exosomes and doxorubicin exhibited a significant protection from doxorubicin induced cell death in dose-dependant manner (). To confirm the role of N-Myc in transferring this aggressiveness, N-Myc KD cell-derived exosomes were co-treated with doxorubicin. Agreeing with our hypothesis, the transfer of protection against doxorubicin to SH-SY5Y cells was significantly reduced. However, SH-SY5Y cells incubated with N-Myc KD exosomes were marginally protected presumably due to only partial loss of N-Myc in N-Myc KD cells. Taken together, these results suggest that the exosomes derived from N-Myc amplified neuroblastoma cells are enriched with molecular cargo associated with cancer progression, migration and resistance to drugs.
Figure 4. Exosomes derived from SK-N-BE2 cells conferred chemoresistance to SH-SY5Y cells.
FACS apoptosis assay was performed on SH-SY5Y cells after treatment with SK-N-BE2, SH-SY5Y and N-Myc KD cell-derived exosomes (5, 10 and 20 μg/mL), doxorubicin (1 µM) and combinational treatment of exosomes and doxorubicin. As shown in the graph, SH-SY-5Y cells obtained resistance to doxorubicin in the presence of SK-N-BE2 cell-derived exosomes (n = 3). Error bars represent the standard error of mean, * denotes p < 0.05, ** as determined by student’s t-test.
Discussion
It has been established that intercellular communication plays a pivotal role in regulating the morphology and the phenotype of the recipient cells. Cells exchange signals through both direct interactions and via secreted molecules and exosomes. Often, these exosomes reflect the pathophysiological status of the donor cells. Hence, exosomes are known to transport cargo with oncogenic potential that can aid cancer progression. In this study, we show that the proteomic cargo of exosomes varies based on the aggressive nature of the host cell. Whilst, it has been shown that exosomes secreted from breast cancer cells can mediate the transfer of chemoresistance to the recipient sensitive cells via the transfer of miRNA [Citation19–Citation21], it has been unclear whether neuroblastoma cells can also transfer the aggressive phenotype between cells via exosomes.
When the proteomic data obtained from the exosomes derived from the two neuroblastoma cell lines were subjected to gene enrichment analysis, it was evident that the samples were enriched in exosomal and RAB proteins. The presence of high levels of proteins implicated in cell communication and signal transduction in SK-N-BE2 cell-derived exosomes suggested that the exosomes play a critical role in cell-cell commutation and transfer of cargo. Moreover, exosomes secreted by N-Myc amplified SK-N-BE2 cells also contained proteins that are implicated in various signalling pathways such as ErbB1, mTOR and integrin cell surface interaction signalling pathways.
ErbB1 has been implicated in cancer cell invasion [Citation22] while integrin family of proteins are known to promote metastasis and drug resistance in a variety of cancer [Citation23–Citation25]. Moreover, mTOR signalling pathway is involved in angiogenesis, cancer cell mobility and metastasis [Citation26–Citation31]. Consistent with the enrichment of these proteins, upon incubation of SK-N-BE2 cell-derived exosomes with SH-SY5Y cells, the migration, colony forming ability and resistance to chemotherapeutic drug were significantly increased. Overall, this study confirms that the exosomes derived from N-Myc amplified and non-amplified neuroblastoma cells contain a different protein signature and the exosomes can alter the pathophysiological status of the recipient cells.
It is well established that intra-tumour heterogeneity results due to the presence of different subpopulations of cancer cells that have unique genotypes within a single tumour [Citation32–Citation34]. In neuroblastoma, it is possible that the clonal subpopulations with different mutational loads exist within a single tumour mass. Exosomes could be one way by which these different clonal subpopulations potentially interact with each other and with the surrounding normal cells. Hence, the possibility that exosomes could transfer the aggressive and chemoresistant phenotype between cells need to be studied in the context of intra-tumour heterogeneity. Hence, the advantages N-Myc amplified neuroblastoma clonal subpopulations may provide to the entire tumour need to be examined further to identify new therapeutic avenues to treat neuroblastoma.
Conflict of interest
The authors declare no conflict of interest.
Supplemental Material
Download Zip (411.6 KB)Acknowledgments
SM is supported by Australian Research Council (DP130100535), Australian Research Council (DP170102312), Australian Research Council FT (FT180100333) and Ramaciotti Establishment Grant. The funders had no role in study design, data collection and analysis, decision to publish, or preparation of the manuscript.
Supplementary material
Supplemental data for this article can be accessed here.
Additional information
Funding
Related Research Data
References
- Hoehner JC, Gestblom C, Hedborg F, et al. A developmental model of neuroblastoma: differentiating stroma-poor tumors’ progress along an extra-adrenal chromaffin lineage. Lab Invest. 1996;75:659–10.
- Maris JM. Recent advances in neuroblastoma. N Engl J Med. 2010;362:2202–2211.
- Boubaker A, Bischof Delaloye A. Nuclear medicine procedures and neuroblastoma in childhood. Their value in the diagnosis, staging and assessment of response to therapy. Q J Nucl Med Mol Imaging. 2003;47:31–40.
- Huang M, Weiss WA. Neuroblastoma and MYCN. Cold Spring Harb Perspect Med. 2013;3:a014415–a014415.
- Gangoda L, Keerthikumar S, Fonseka P, et al. Inhibition of cathepsin proteases attenuates migration and sensitizes aggressive N-Myc amplified human neuroblastoma cells to doxorubicin. Oncotarget. 2015b;6:11175–11190.
- Thery C, Zitvogel L, Amigorena S. Exosomes: composition, biogenesis and function. Nat Rev Immunol. 2002;2:569–579.
- Thery C, Witwer KW, Aikawa E, et al. Minimal information for studies of extracellular vesicles 2018 (MISEV2018): a position statement of the international society for extracellular vesicles and update of the MISEV2014 guidelines. J Extracell Vesicles. 2018;7:1535750.
- Chitti SV, Fonseka P, Mathivanan S. Emerging role of extracellular vesicles in mediating cancer cachexia. Biochem Soc Trans. 2018;46:1129–1136.
- Liem M, Ang CS, Mathivanan S. Insulin mediated activation of PI3K/Akt signalling pathway modifies the proteomic cargo of extracellular vesicles. Proteomics. 2017;17:1600371.
- Gangoda L, Boukouris S, Liem M, et al. Extracellular vesicles including exosomes are mediators of signal transduction: are they protective or pathogenic? Proteomics. 2015a;15:260–271.
- Samuel M, Chisanga D, Liem M, et al. Bovine milk-derived exosomes from colostrum are enriched with proteins implicated in immune response and growth. Sci Rep-Uk. 2017;7:5933.
- Keerthikumar S, Gangoda L, Liem M, et al. Proteogenomic analysis reveals exosomes are more oncogenic than ectosomes. Oncotarget. 2015;6:15375–15396.
- Mathivanan S, Ji H, Tauro BJ, et al. Identifying mutated proteins secreted by colon cancer cell lines using mass spectrometry. J Proteomics. 2012;76:141–149.
- Anand S, Foot N, Ang CS, et al. Arrestin-domain containing protein 1 (Arrdc1) regulates the protein cargo and release of extracellular vesicles. Proteomics. 2018;18:1800266.
- Lee Y, El Andaloussi S, Wood MJA. Exosomes and microvesicles: extracellular vesicles for genetic information transfer and gene therapy. Hum Mol Genet. 2012;21:R125–R134.
- Gangoda L, Liem M, Ang CS, et al. Proteomic profiling of exosomes secreted by breast cancer cells with varying metastatic potential. Proteomics. 2017;17:1600370.
- Pathan M, Keerthikumar S, Ang CS, et al. FunRich: an open access standalone functional enrichment and interaction network analysis tool. Proteomics. 2015;15:2597–2601.
- Pathan M, Keerthikumar S, Chisanga D, et al. A novel community driven software for functional enrichment analysis of extracellular vesicles data. J Extracell Vesicles. 2017;6:1321455.
- Chen W-X, Liu X-M, Lv -M-M, et al. Exosomes from drug-resistant breast cancer cells transmit chemoresistance by a horizontal transfer of MicroRNAs. PLOS ONE. 2014;9:e95240.
- Santos JC, Lima NDS, Sarian LO, et al. Exosome-mediated breast cancer chemoresistance via miR-155 transfer. Sci Rep. 2018;8:829.
- Yu D-D, Wu Y, Shen H-Y, et al. Exosomes in development, metastasis and drug resistance of breast cancer. Cancer Sci. 2015;106:959–964.
- Kedrin D, Wyckoff J, Boimel PJ, et al. ERBB1 and ERBB2 have distinct functions in tumor cell invasion and intravasation. Clin Cancer Res off J Am Assoc Cancer Res. 2009;15:3733–3739.
- Blandin A-F, Renner G, Lehmann M, et al. β1 integrins as therapeutic targets to disrupt hallmarks of cancer. Front Pharmacol. 2015;6:279.
- Desgrosellier JS, Cheresh DA. Integrins in cancer: biological implications and therapeutic opportunities. Nat Rev Cancer. 2010;10:9–22.
- Seguin L, Desgrosellier JS, Weis SM, et al. Integrins and cancer: regulators of cancer stemness, metastasis, and drug resistance. Trends Cell Biol. 2015;25:234–240.
- Adams J, Carder PJ, Downey S, et al. Vascular Endothelial Growth Factor (VEGF) in breast cancer: comparison of plasma, serum, and tissue VEGF and microvessel density and effects of tamoxifen. Cancer Res. 2000;60:2898.
- Carmeliet P. VEGF as a key mediator of angiogenesis in cancer. Oncology. 2005;69(Suppl 3):4–10.
- Easton JB, Houghton PJ. mTOR and cancer therapy. Oncogene. 2006;25:6436.
- McMahon G. VEGF receptor signaling in tumor angiogenesis. Oncologist. 2000;5:3–10.
- Pópulo H, Lopes JM, Soares P. The mTOR signalling pathway in human cancer. Int J Mol Sci. 2012;13:1886–1918.
- Zhou H, Huang S. mTOR signaling in cancer cell motility and tumor metastasis. Crit Rev Eukaryot Gene Expr. 2010;20:1–16.
- Barranha R, Costa JL, Carneiro F, et al. Genetic heterogeneity in colorectal cancer and its clinical implications. Acta Med Port. 2015;28:370–375.
- Gerlinger M, Rowan AJ, Horswell S, et al. Intratumor heterogeneity and branched evolution revealed by multiregion sequencing. N Engl J Med. 2012;366:883–892.
- Hardiman KM, Ulintz PJ, Kuick RD, et al. Intra-tumor genetic heterogeneity in rectal cancer. Lab Invest. 2016;96:4–15.