
ABSTRACT
Tumour cells release large quantities of extracellular vesicles (EVs) to mediate their interactions with other cells in the tumour microenvironment. To identify host cells that naturally take up EVs from tumour cells, we created breast cancer cell lines secreting fluorescent EVs. These fluorescent EVs are taken up most robustly by fibroblasts within the tumour microenvironment. RNA sequencing indicated that miR-125b is one of the most abundant microRNAs secreted by mouse triple-negative breast cancer 4T1 and 4TO7 cells. Treatment with 4T1 EVs leads to an increase in fibroblast activation in isogenic 4TO7 tumours, which is reversed by blocking miR-125b in 4T1 EVs; hence, miR-125b delivery by EVs is responsible for fibroblast activation in mouse tumour models. miR-125b is also secreted by human breast cancer cells and the uptake of EVs from these cells significantly increases cellular levels of miR-125b and expression of multiple cancer-associated fibroblast markers in resident fibroblasts. Overexpression of miR-125b in both mouse and human fibroblasts leads to an activated phenotype similar to the knockdown of established miR-125b target mRNAs. These data indicate that miR-125b is transferred through EVs from breast cancer cells to normal fibroblasts within the tumour microenvironment and contributes to their development into cancer-associated fibroblasts.
Introduction
Metastasis is the main cause of mortality in breast cancer, which affects 1.7 million women every year [Citation1]. The progression of breast cancer through each stage of metastasis is highly dependent on the ability of cancer cells to adapt and interact with other cell types in the changing microenvironment [Citation2]. Malignant tumour cells can suppress immune surveillance and alter the phenotype of microenvironmental cells including fibroblasts, endothelial cells, macrophages, myeloid cells and regulatory T cells in a way that supports cancer progression [Citation3].
Cancer-associated fibroblasts (CAFs) are a key component of the tumour stroma. CAFs express cytokines, chemokines and extracellular matrix (ECM) proteins that are essential for tumour architecture, growth, invasion and metastasis [Citation3,Citation4]. CAFs resemble myofibroblasts in their morphology and gene expression [Citation4]. Myofibroblasts and CAFs can differentiate from tissue fibroblasts in response to platelet-derived growth factor (PDGF) and transforming growth factor beta (TGF-β) signalling. When normal fibroblasts differentiate into CAFs or myofibroblasts, they gain α smooth muscle actin (αSMA) and caveolin-1 (CAV1) expression and increase secretion of matrix metalloproteinases (MMPs), and diverse growth factors and cytokines, including TGFβ, FGF2, HGF and CXCL12 [Citation5–Citation7]. There is compelling evidence that CAFs contribute to cancer progression; for example, tumour growth and metastasis increase in tumour cells implanted with CAFs relative to tumour cells implanted with normal fibroblasts [Citation8]. Moreover, chemokines and cytokines secreted by CAFs promote invasion of tumour cells at the tumour margin [Citation3]. At sites distal from an initiating tumour, CAFs can form metastatic niches that facilitate the growth of new tumour colonies [Citation3]. Taken together, CAFs play important roles in tumour progression and metastasis.
Although many cytokines and growth factors are well-known mediators of intercellular signalling, recent research has shown important roles for extracellular vesicles (EVs) in cell-to-cell communication during cancer progression [Citation9]. Tumour cells release a large number of EVs, including exosomes, which are vesicles derived from multivesicular bodies, and ectosomes, which are vesicles that bud from the cellular membrane [Citation9]. Tumour EVs deliver proteins and nucleic acids to other cells in their local environment or at distant sites [Citation9]. Blocking EV biogenesis in tumour cells by knocking down nSMase2 or Rab27b reduces tumour growth and metastasis in mouse models [Citation10,Citation11]. Tumour-cell-derived EVs are capable of transforming benign cells, suppressing immune responses, supporting endothelial angiogenesis and helping to establish a pre-metastatic niche [Citation9]. Previous studies have demonstrated that EVs from mesothelioma, prostate, pancreatic and breast cancer cells promote fibroblast-to-CAF differentiation in cell culture models by transferring TGF-β, AHNAK or miR-155 [Citation12–Citation14]. However, no evidence is available to address the potential significance of this phenomenon in vivo.
microRNAs (miRNAs) are found in EVs that circulate in the blood [Citation15]. The levels of many EV miRNAs correlate with the clinical classification and progression of certain cancers and may be useful as non-invasive cancer biomarkers [Citation16]. Circulating miRNAs are not only biomarkers for cancer, but also mediate cancer-specific effects [Citation17]. However, few studies have shown how circulating miRNAs can alter the tumour microenvironment.
Our previous work revealed that tumour EVs can transfer metastatic traits [Citation18]. In a series of isogenic mouse breast cancer cell lines, EVs released by highly metastatic 4T1 cells are enriched in the miR-200 family, compared to EVs from less metastatic isogenic cell lines [Citation18]. We found that miR-200 miRNAs are enriched in the sera of mice bearing highly metastatic 4T1 tumours compared to those with poorly metastatic 4TO7 tumours or those with no tumour [Citation18]. EVs from 4T1 cells are taken up by 4TO7 cells in culture, leading to a significant increase in miR-200 levels and downregulation of miR-200 targets in the recipient cells [Citation18]. Furthermore, EVs containing miR-200 increase metastasis of recipient tumour cells by activating tumour mesenchymal-to-epithelial transition programmes [Citation18]. Inhibiting miR-200 miRNAs reduced but did not completely reverse the increase in metastasis associated with the uptake of metastatic tumour EVs, suggesting that other miRNAs could contribute to the function of tumour EVs in promoting metastasis. Therefore, these data suggest that the association between extracellular miRNAs and disease is complex and that miRNAs are not simply molecular markers. Rather, in their capacity to serve as intercellular signals and potent post-transcriptional modifiers, extracellular miRNAs may play influential, functional roles in disease progression.
In this study, we investigated the mechanistic underpinnings of EV-miRNA-mediated communication of breast cancer cells with their microenvironment. Specifically, to identify recipient cells that naturally take up EVs from tumour cells, we fluorescently labelled tumour EVs, and examined EV internalization by different cell types in the tumour and in metastatic sites in the lung. Using this approach, we identified fibroblasts as the cells that most avidly take up tumour EVs. We next examined the functions of miR-125b, which was abundant in EVs from metastatic breast cancer cells both in vitro and in vivo. Our data establish an important role of EV-derived miR-125b in CAF differentiation in both human and mouse in vivo breast cancer models. We also found that miR-125b acts in large part through its targets TP53 and TP53INP1. This study illustrates the novel contribution of secreted miR-125b to the crosstalk between cancer and stromal cells during cancer progression. Such a mechanism suggests therapeutic approaches targeting miR-125b in tumour vesicles as a potential treatment for breast cancer.
Results
Uptake of cancer-derived EVs by stromal cells in mammary tumours and colonized lungs
CD63 is a common marker for EVs as it is usually localized in multivesicular bodies, which give rise to exosomes [Citation19]. To label EVs from tumour cells, we transduced mouse breast cancer 4TO7 cells with a lentiviral plasmid expressing a CD63-GFP fusion protein () and Supplementary Figure 1A-B). 4TO7-CD63-GFP cells were implanted into the mammary fat pad (MFPs) of BALB/c SCID mice (n = 4). As a control, unlabelled 4TO7 cells were implanted in the contralateral MFPs of the same mice. After 2 weeks, tumours ≥ 15 mm in diameter were harvested and digested, and CD45+ leukocytes, CD31+ endothelial cells, CD140a+ fibroblasts, CD45+CD11b+F4/80+ macrophages and CD45+CD11b+Ly6G+ neutrophils were analysed for the uptake of CD63-GFP using flow cytometry. We were able to detect GFP in 30% of the total population of dissociated cells from the 4TO7-CD63-GFP tumour. FACS analysis revealed that CD140a+ fibroblasts took up GFP-labelled EVs from 4TO7-CD63-GFP cells at the highest frequency () and Supplementary Figure 2). Little GFP was detected in the contralateral MFP and lungs of the same mice, indicating that 4TO7 cells did not metastasize and the transfer of GFP in tumour EVs was more efficient in the local tumour microenvironment than at a distance. We also confirmed the expression of GFP in EPCAM+ tumour cells and uptake of GFP+ EVs by fibroblasts, endothelial cells, leukocytes, macrophages and neutrophils using immunostaining for markers characteristic for each of these cells in 4TO7-CD63-GFP tumours ()).
Figure 1. Uptake of cancer-derived EVs by stromal cells in mouse mammary tumours and lungs. (a) Schema of mouse tumour EV uptake analysis: mouse breast cancer 4TO7 cells expressing CD63-GFP and unlabelled 4TO7 cells were implanted in the MFPs of SCID mice. After 2 weeks, cells were dissociated from the tumours and the lungs and analysed by FACS. (b) Average percentage of GFP+ cells in each indicated cell population isolated from 4TO7-CD63-GFP tumours, unlabelled 4TO7 tumours and lungs (n = 4 mice). Bar graph represents mean ± SEM. **P < 0.01 determined by Student’s t-test. (c) Immunostaining of 4TO7-CD63-GFP tumours. Tumour cryo-sections were stained with DAPI and antibodies for CD45, CD31, CD140a, F4/80, Ly6G and EPCAM to mark leukocytes, endothelial cells, fibroblasts, macrophages, neutrophils and tumour cells, respectively. Arrows indicate colocalization of GFP and the cellular markers (also shown in the inserts). Scale bar, 10 µm.
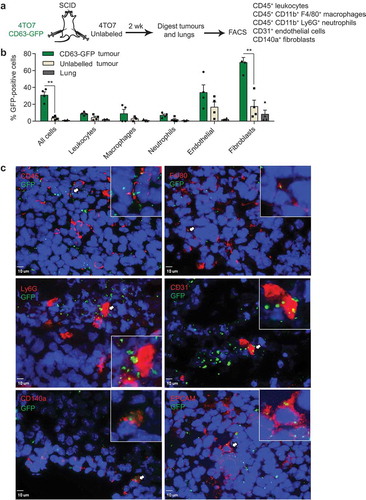
Figure 2. Uptake of cancer-derived EVs by stromal cells in human mammary tumours and lungs. (a) Schema of human tumour EV uptake analysis: implantation of human breast cancer MCF10CA1a (CA1a) cells expressing CD63-GFP or surface mCherry (SmCherry) and unlabelled CA1a cells in the MFPs of NSG mice. When tumours reached 15 mm in diameter (4 weeks), cells were dissociated from the tumours and analysed by FACS. (b) Average percentage of GFP+ cells in each indicated cell population isolated from CA1a-CD63-GFP tumours relative to unlabelled tumours of the same mice (n = 3 mice). (c) Average percentage of mCherry+ cells in each indicated cell population isolated from the CA1a-SmCherry tumours relative to the unlabelled tumours of the same mice (n = 3 mice). (d) Immunostaining of CA1a-SmCherry tumours. Tumour sections were stained with antibodies to αSMA (green) to mark cancer-associated fibroblasts (CAFs) and mCherry (red) fluorescence marked EVs from CA1a-SmCherry cells. Scale bar, 3 µm. (e) 3D view of CAFs showing colocalization of αSMA and mCherry (yellow). (f) Schema of human tumour EV uptake analysis in the lung: CA1a-CD63-GFP cells were injected in the tail vein of NSG mice. After 6 weeks, cells were dissociated from the lung and analysed by FACS. (g) Average percentage of GFP+ cells in each indicated population isolated from the lungs of mice injected with CA1a-CD63-GFP cells relative to those injected with unlabelled CA1a cells (n = 3 mice). All bar graphs represent mean ± SEM.
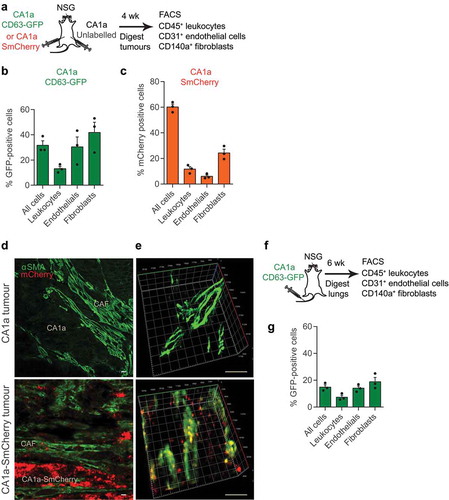
To examine the distribution of EVs derived from human tumour cells, we transduced the human breast cancer cell line MCF10CA1a (CA1a) with a lentivirus carrying the CD63-GFP expression vector () and supplementary Figure 1A-B). CA1a cells are a metastatic derivative of MCF10a cells, which are triple-negative basal-like breast cancer, similar to 4T1 cells [Citation20]. We implanted unlabelled or CD63-GFP labelled CA1a cells in the MFPs of NOD SCID Common Gamma Chain-deficient (NSG) mice and collected the tumours after 4 weeks when they reached 15 mm in diameter. As most immune cells are absent in NSG mice, we analysed only CD45+ leukocytes, CD31+ endothelial cells and CD140a+ fibroblasts in the tumours. Compared to the unlabelled CA1a tumours, ~30% of cells in the CA1a-CD63-GFP tumour were GFP positive ()). As high as 41.8% of the CD140a+ cells were positive for GFP, which was higher than the percentage of GFP+ cells within the endothelial and leukocyte populations () and Supplementary Figure 3).
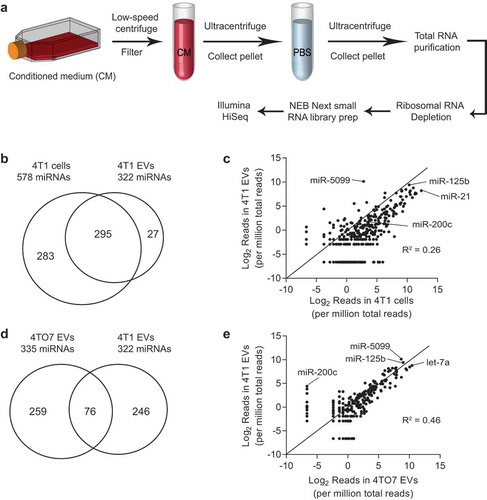
Figure 3. Identification of abundant miRNAs in EVs derived from breast cancer cells. (a) Schema for EV purification and RNA sequencing: conditioned media were collected from 4T1 cells and 4TO7 cells; dead cells and debris were removed using low speed centrifugation and filtration; EVs were pelleted and washed using ultracentrifugation; total RNA were extracted from EVs and cells; ribosomal RNAs were removed; small RNAs were converted to cDNA and sequenced using the Illumina HiSeq platform. (b) Number of miRNAs identified in 4T1 cells and 4T1 EVs. (c) Intracellular versus EV levels of each miRNA from 4T1 cells. (d) Number of miRNAs identified in 4TO7 EVs and 4T1 EVs. (e) 4T1 EV versus 4TO7 EV levels of each miRNA. Data were obtained using Illumina small RNA sequencing.
To confirm the distribution pattern of tumour EVs, we generated a CA1a cell line expressing an mCherry transgene that had a transmembrane domain, so that the cells had mCherry on the plasma membrane and released mCherry in their EVs (Supplementary Figure 1C, D). We observed bright and stable mCherry fluorescent signals in the tumour cells using microscopy. CA1a with surface mCherry (CA1a-SmCherry) cells were implanted in the MFPs of NSG mice and tumours were analysed as described for the experiment with CA1a-CD63-GFP cells ()). On average, 60% of all the cells in the CA1a-SmCherry tumour were positive for mCherry whereas, the average percentage of mCherry+ cells among leukocytes, endothelial cells and fibroblasts was 11.7%, 6% and 24.3%, respectively () and Supplementary Figure 4). Hence, the uptake of mCherry+ EVs by fibroblasts was higher than by leukocytes and endothelial cells. Furthermore, the uptake of mCherry+ EVs by CAFs was confirmed by the colocalization of mCherry and αSMA in sections of CA1a-SmCherry tumours (–)). Some αSMA+ CAFs were surrounded by many mCherry+ EVs from nearby CA1a-SmCherry tumour cells ()). mCherry internalization into CAFs was verified by 3D projections of CAFs ()). Therefore, our data suggest that fibroblasts, including CAFs, are the primary recipients of EVs from tumour cells in both mouse and human origin tumours.
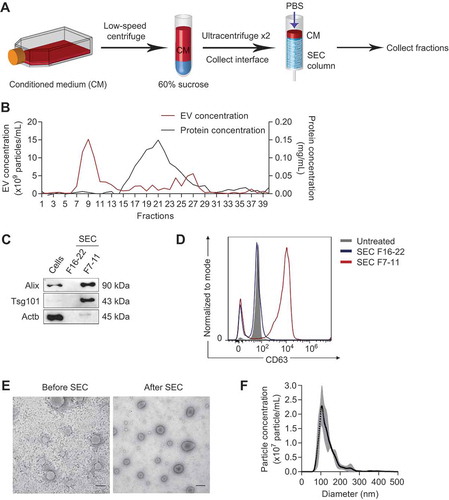
Figure 4. Purification of tumour EVs using density and size selection. (a) Schema for EV purification from conditioned medium (CM) using ultracentrifugation with a 60% sucrose cushion and size exclusion chromatography (SEC). (b) Concentrations of EVs (red) and proteins (black) in each SEC fraction, determined using nanoparticle tracking analysis and BCA assay, respectively. (c) Western blot analysis of EV markers (Alix, Tsg101) and beta-actin (Actb) in 4T1 cells, eluted proteins (SEC fraction 16 to 22), and eluted EVs (SEC fraction 7 to 11). (d) FACS analysis of CD63 on the surface of 4T1 EVs. EV fractions (SEC fraction 7–11) and protein fractions (SEC fraction 16–22) were incubated with CD63-antibody coated magnetic beads and detected with CD63-PE antibody. (e) Representative transmission electron microscopy images of 4T1 EVs before and after SEC. Scale bar: 200 nm. (f) Average concentrations (100× dilution) of 4T1 EVs from 3 batches ± SEM (grey) and their size distribution, determined using nanoparticle tracking analysis.
We also tested whether tumour EVs were taken up by microenvironmental cells in a metastatic niche by injecting CA1a-CD63-GFP cells in the tail vein of NSG mice, and analyzing GFP fluorescence in the lung 6 weeks later ()). Perfusion was performed before the necropsy to remove blood from the lungs. Many metastatic nodules were observed in the lungs. Nearly 15% of all cells in the lung were positive for GFP () and Supplementary Figure 5). Only 7–19% of leukocytes, endothelial cells and fibroblasts were positive for GFP, suggesting that the transfer of GFP to host cells in the lung was less than in the tumours () and Supplementary Figure 5). The uptake of GFP+ EVs by CD140a+ fibroblasts was greater than uptake by either leukocytes or endothelial cells, ~19% compared to 7–14%, although the difference was not significant. Hence, fibroblasts were the dominant but not the exclusive recipient cell type of tumour EVs within the metastatic niche.
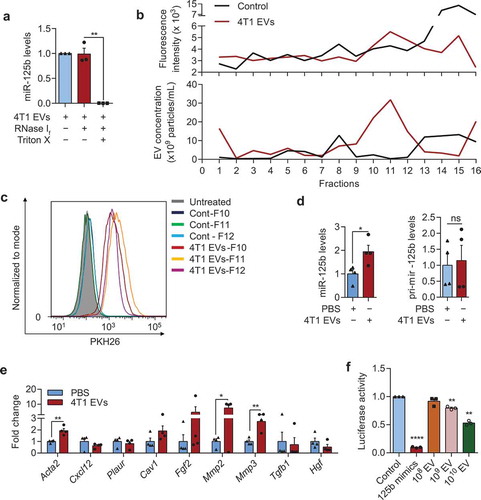
Figure 5. Tumour EVs contain functional miR-125b that are taken up by fibroblasts. (a) Average miR-125b levels in 4T1 EVs after treatments with RNase If and Triton X-100 for 30 min, relative to miR-125b levels in the control untreated group, normalized to spike-in control cel-miR-39a (n = 3 independent repeats). (b) Intensity of PKH26 fluorescence (top) and particle concentration (bottom) in fractions collected from sucrose-gradient-separation of 4T1 EVs that were labelled with PKH26 dye or a control solution in which PBS was mixed with PKH26 dye. Labelled EVs or the control solution were loaded onto a 5–60% sucrose gradients and separated by ultracentrifugation for 18 h. Fractions were collected from the top to bottom. (c) FACS analysis of PKH26 in mouse adult tissue fibroblasts (mATFs) that were incubated with fraction 10 to 12 (F10-12) of the sucrose-gradient-purified EVs or of the control sample (Cont). (d) qPCR analysis of miR-125b and pri-mir-125b levels in mATFs that were incubated with 4T1 EVs or PBS relative to snoRNA234 or Gapdh levels, respectively (n = 4 independent repeats). (e) qPCR analysis of CAF markers relative to Gapdh in mATFs that were incubated with 4T1 EVs or with PBS (n = 4 independent repeats). (f) Average luciferase activity in HEK-293T cells that were transfected with a reporter plasmid (containing 3 binding sites for miR-125b) and incubated with 108 to 1010 EVs from 4T1 cells for 24h (n = 3 independent replicates). All bar graphs represent mean ± SEM. ns – not significant, *P < 0/05, **P < 0.01, and ****P < 0.00001 determined by Student’s t-test.
Identification of mir-125b in EVs secreted by metastatic breast cancer cells
To identify miRNA cargo in tumour-associated EVs, we used next-generation sequencing to profile small RNAs in EVs purified from two isogenic mouse breast cancer cell lines, 4T1 and 4TO7 ()). EVs were purified using a differential centrifugation protocol that involves a two-step ultracentrifugation, which we previously established as a reliable EV purification protocol [Citation18]. To enrich for miRNAs, we depleted ribosomal RNAs from total RNAs, constructed small RNA libraries and sequenced them using an Illumina HiSeq platform ()). We also sequenced small RNAs from 4T1 and 4TO7 cells, using the same protocol. We selected only full-length miRNAs for further analysis. Sequences for 578 and 322 miRNAs were detected in 4T1 cells and EVs, respectively. Two hundred and ninety-five miRNAs overlapped in both ()). Most miRNAs that were abundant in 4T1 cells were secreted in EVs ()). Seventy-six miRNAs in EVs from 4T1 cells were also identified in EVs from 4TO7 cells ()). Consistent with our previous study, the miR-200 family miRNAs were found in 4T1-derived EVs but not in EVs originating from 4TO7 cells ()). miR-5099, miR-125b and let-7a were the most abundant miRNAs found in both 4T1 and 4TO7 EVs ()). miR-5099 is a mouse miRNA that is not conserved in humans, hence it is unlikely to relate to human cancer. let-7a is a well-known tumour-suppressor miRNA in breast cancer and some studies have suggested that tumour cells discard let-7a in EVs to increase their malignancy [Citation21]. Meanwhile, miR-125b has been shown to be an oncogenic miRNA in many types of cancer, including metastatic breast cancer [Citation22]. Several reports have shown that miR-125b is upregulated in metastatic or chemotherapy-resistant breast cancer cells [Citation23–Citation25]. We have shown recently that knockdown of miR-125b suppressed the proliferation of breast cancer CA1a cells in vitro and in vivo [Citation26]. Indeed, miR-125b is enriched in the circulation of patients with drug-resistant breast cancer, suggesting that miR-125b could be used as a non-invasive biomarker for drug resistance [Citation24,Citation25]. However, it is still unclear if and how cancer-secreted miR-125b contributes to the communication between cancer cells and their microenvironment. Therefore, we focused our investigation on miR-125b within EVs to examine a potential role in intercellular communication within the cancer microenvironment.
Verification of mir-125b release in tumour EVs and its uptake by fibroblasts
To obtain tumour EVs with higher purity, we optimized a new protocol that involves two rounds of ultracentrifugation with a 60% sucrose cushion and one round of size exclusion chromatography (SEC) ()). This purification process separated tumour EVs from proteins in the medium into distinct fractions ()). Using Western blot analysis, we found a clear enrichment of EV markers, Alix and Tsg101, in SEC fractions 7 to 11 but not in fractions 16 to 22, which contain EV-free proteins () compared to )). In addition, beta actin (Actb) was almost absent in EV fractions 7 to 11, suggesting that this cytoskeleton protein was not exported in EVs and the fractionated EVs did not contain cellular debris. These data were further confirmed using FACS analysis of CD63, a transmembrane exosomal marker. CD63 was detected on the surface of 4T1 EVs in fractions 7 to 11 but barely detectable in EV-free proteins in fractions 16–22 ()). Hence, we collected SEC fractions 7 to 11 for EV analysis in all subsequent experiments. After SEC purification, EVs collected from SEC fractions 7 to 11 were intact, as judged by their typical cup shape and double membrane under transmission electron microscopy ()). The diameters of purified EVs ranged from 50 to 300 nm, with most ~120 nm, as shown by nanoparticle tracking analysis ()).
We confirmed the presence of miR-125b in the SEC-purified 4T1 EVs using qRT-PCR ()). Treatment of the EVs with RNase did not reduce the level of miR-125b significantly unless the EVs were co-treated with Triton X, which degraded the EV membrane. Hence, miR-125b was protected within the intact EVs from RNase degradation, as expected for a bona fide EV-miRNA.
Because we found that fibroblasts were the primary recipients of tumour EVs in vivo, we sought to test if the purified 4T1 EVs can be taken up by fibroblasts in vitro. We isolated primary adult tissue fibroblasts (mATFs) from mouse ears and incubated them with PKH26-labelled 4T1 EVs for 24 h. To ensure that the increase in PKH26 signal was not an artefact resulting from the uptake of PKH26 micelles, we purified PKH26-labelled EVs using sucrose gradients as previously described [Citation27] and incubated these EVs with mATFs. As a control, we added PKH26 to PBS containing no EV and used the sucrose grandient to fractionate the solution. PKH26 fluorescence was higher in the sucrose gradient fractions 10 to 12, which contained the EVs, than in the control ()). Fraction 15 of the control had higher fluorescence than fraction 15 of the EVs, suggesting that PKH26 micelles separated in this fraction ()). Treatment of mATFs with EVs from fraction 10 to 12 resulted in the uptake of the EVs by 90–99% of the cells with little background uptake from the PBS control fractions ()).
Furthermore, incubation of mATFs with 4.5 × 10¹¹ of 4T1 EVs (containing 16 µg EV protein) significantly increased mature miR-125b ()). Importantly, there was no change in pri-mir-125b expression ()), suggesting that the increase in mature miR-125b was not due to any increase in transcription of endogenous pri-mir-125b, and therefore presumably due to the uptake of mature miR-125b from 4T1 EVs. The uptake of 4T1 EVs also led to upregulation of CAF markers including Acta2 (the gene encoding for αSMA), Mmp2, and Mmp3 in mATFs ()). Taken together, these data indicate that cultured fibroblasts are efficiently targeted by tumour EVs, which deliver miR-125b cargo to the fibroblasts.
To determine whether 4T1 EVs contained funtional miR-125b, we performed a luciferase reporter assay for miR-125b activity in cells incubated with 4T1 EVs using a reporter plasmid with three perfect complementary binding sites for miR-125b in the 3ʹUTR of a Renilla luciferase gene. We transfected this plasmid into HEK-293T cells (selecting HEK-293T cells instead of fibroblasts for the high plasmid transfection efficiency), and treated the cells with 4T1 EVs. Renilla luciferase activity was suppressed by 4T1 EVs in a concentration-dependent manner (using a range of 108 - 1010 EVs), indicating that miR-125b in EVs was functional ()).
Breast cancer EVs promote miR-125b-dependent fibroblast activation in vivo
To examine the effect of tumour EVs in vivo, we co-injected 4TO7 cells with 2.25 × 10¹¹ to 4.5 × 10¹¹ of 4T1-derived EVs into the flanks of wildtype BALB/c mice (). After 3 weeks, CD140a+ fibroblasts significantly increased by flow cytometry analysis in tumours treated with 4.5 × 10¹¹ 4T1 EVs compared to PBS-treated tumours (). Consistent with these data, immunohistochemical analysis showed a significant increase of the CAF marker αSma in tumours treated with 1 dose of 4T1 EVs compared to the PBS-treated control tumours (). Half as many 4T1 EVs (2.25 × 10¹¹) led to a smaller increase in the abundance of CD140a+ cells and αSma expression, albeit not significantly (). Hence, the effect of 4T1 EVs on fibroblast activation is dose-dependent.
Figure 6. miR-125b-containing tumour EVs promote the activation of fibroblasts in the tumours. (a) Schema for 4TO7 tumour treatment: 250,000 4TO7 cells were coinjected with 2.25 × 10¹¹ (half-dose – 0.5D) or 4.5 × 10¹¹ (one dose – 1D) of 4T1 EVs or an equivalent volume of PBS (control) in the flanks of BALB/c mice. After 3 weeks, tumours were collected for FACS analysis of CD140a and immunohistochemical (IHC) staining of αSma. (b) Representative FACS analysis of CD140a vs. side scatter (SSC-A) in 4TO7 tumours treated as in (A). (C) Average percentage of CD140a+ cells in 4TO7 tumours (n = 3 mice) treated as in (A). (d) Representative IHC image of αSma (brown) in 4TO7 tumours treated as in (A). Tumour sections were also stained with haematoxylin (blue) for nuclear DNA. Scale bar: 50 µm. (e) Average normalized integrated optical density (IOD) of αSma signals (n = 3 mice) quantified using ImageJ. (f) Schema for miR-125b inhibition in 4T1 EVs: 4.5 × 10¹¹ 4T1 EVs were electroporated with anti-miR-125b ASO (125b-ASO) or scrambled negative control ASO (NC-ASO) and coinjected with 250,000 4TO7 cells in the flanks of female BALB/c mice. After 3 weeks, tumours were collected for FACS analysis of CD140a and IHC staining of αSma. (g) Average miR-125b levels in 4T1 EVs unelectroporated or electroporated with 125b-ASO or NC-ASO (n = 3 independent repeats). (h) Average miR-125b levels in mATFs incubated with 4T1 EVs unelectroporated or electroporated with 125b-ASO (n = 4 independent repeats). miR-125b levels were normalized to snoRNA234 levels. (i) Representative FACS analysis of CD140a in 4TO7 tumours treated as in (f). (j) Average percentage of CD140a positive cells in 4TO7 tumours (n = 3 mice) treated as in (f). (k) Representative IHC staining of αSma (brown) in 4TO7 tumours treated as in (f). Scale bar: 50 µm. (l) Average IOD of αSma signals (n = 3 mice). All bar graphs represent mean ± SEM. ns – not significant, * P < 0.05 determined by Student’s t-test.
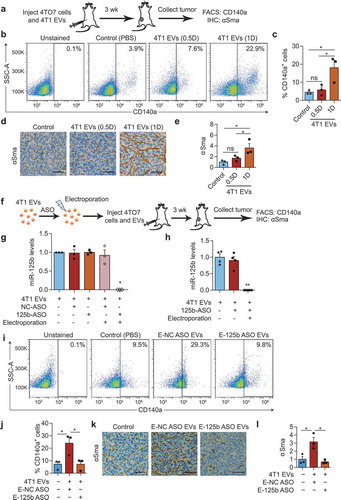
To test the function of miR-125b in 4T1 EVs, we electroporated the EVs with antisense oligonucleotides (ASO) against miR-125b and co-injected 4TO7 cells with these EVs (). We have shown before that ASOs efficiently suppress miR-125b function [Citation26,Citation28]. 4T1 EVs were also electroporated with a scrambled ASO as negative control (NC). Electroporation of anti-miR-125b ASO (125b-ASO) blocked the qRT-PCR detection of miR-125b in the EVs but incubation of EVs with 125b-ASO without electroporation had no effect (). Similarly, treatment of mATFs with 125b-ASO-electroporated EVs significantly reduced of miR-125b in the cells compared to treatments with unelectroporated EVs with or without 125b-ASO (). These experiments indicated that electroporated ASOs were able to block miR-125b in EVs and in cells treated with electroporated EVs, whereas, ASOs that were not electroporated were inactive. The percentage of CD140a+ fibroblasts increased in 4TO7 tumours after treatment with NC-ASO-loaded 4T1 EVs but not after treatment with 125b-ASO-loaded 4T1 EVs (). The effect was more prominent when we analysed αSMA staining: 4T1 EVs electroporated with anti-miR-125b ASO decreased expression of αSma compared to both the PBS control and NC-ASO-EVs, suggesting that the anti-miR-125b ASO suppressed the function of both miR-125b derived from 4T1 EVs and endogenous miR-125b in fibroblasts (). These data suggest that miR-125b activates resident fibroblasts into CAFs, which is mediated by uptake of miR-125b from tumour EVs, in combination with endogenous miR-125b.
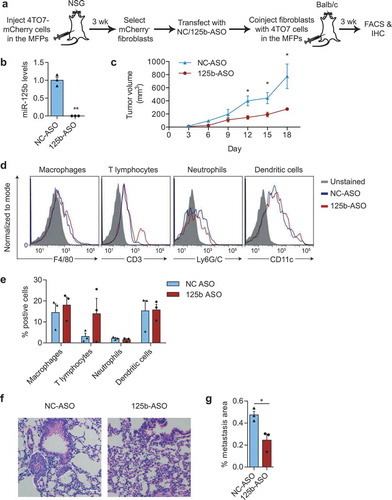
To examine the functional impact of miR-125b-activated fibroblasts on cancer progression, we isolated fibroblasts from 4TO7 tumours, transfected them with 125b-ASO to inhibit miR-125b and coinjected them with 4TO7 cells at a 2:1 ratio into the MFP of BALB/c mice (). As expected, transfection of 125b-ASO suppressed the level of mature miR-125b, including both endogenous miR-125b and EV-delivered miR-125b from 4TO7 tumour cells, in fibroblasts (). Tumour growth was significantly reduced with knockdown of miR-125b in tumour fibroblasts (). There was no consistent significant difference in CD3+ T cells, macrophages, neutrophils and dendritic cells infiltrating the tumours co-injected with miR-125b-knockdown fibroblasts compared to the control fibroblasts with uninhibited miR-125b (). These data suggested that knockdown of miR-125b reduced the tumour-promoting activity of CAFs without much change in the immune cells in the tumour. Although 4TO7 cells are weakly metastatic, we were able to observe some micrometastases in the lungs of mice bearing large 4TO7 tumours using H & E staining (). The metastatic areas in the lungs were significantly reduced in the mice bearing tumours with miR-125b-depleted fibroblasts compared to the controls (). Therefore, miR-125b plays an important role in activating fibroblasts to support tumour growth and metastasis.
Figure 7. miR-125b-activated fibroblasts support tumour growth. (a) Schematic representation of fibroblast isolation from 4TO7-mCherry tumours, followed by miR-125b knockdown in fibroblasts and co-injection of transfected fibroblasts and 4TO7 cells in the MFPs of BALB/c mice. (b) qRT-PCR analysis of miR-125b in fibroblasts transfected with NC or 125b-ASO (n = 3 independent repeats). (c) Volume of 4TO7 tumours generated by coinjection of 4TO7 cells with fibroblasts treated as in (a) (n = 3 mice). (d) Representative FACS analysis of macrophages (CD45+CD11b+F4/80+), T lymphocytes (CD3+), neutrophils (CD45+CD11b+ Ly6G/C+), and dendritic cells (CD45+CD11c+) from 4TO7 tumours treated as in (a). (e) Average percentage of different immune cell types in 4TO7 tumours (n = 3 mice). (f) Representative haematoxylin and eosin (H&E) stained sections of the lungs from mice treated as in (a). Scale bar: 100 µm. White dotted circles indicate metastatic areas. (g) Average percentage of metastatic area in the lungs as shown in (f) (n = 3 mice). All graphs represent mean ± SEM. * P < 0.05, **P < 0.01, determined by Student’s t-test.
miR-125b activates mouse fibroblasts by suppressing Tp53inp1
To understand the mechanism of miR-125b action, we overexpressed miR-125b in mATFs by transfection of miR-125b mimics (). miR-125b transfection led to more than 50 fold overexpression of miR-125b and upregulation of several CAF markers including Acta2, Fgf2, Mmp2 and Mmp3, compared to transfection with NC mimics (). Both immunostaining and Western blot confirmed the upregulation of αSma protein in mATFs upon overexpression of miR-125b (). Overexpression of miR-125b also increased invasion of mATFs dramatically according to a matrigel transwell invasion assay; however, there was no change in the migration rate of mATFs overexpressing miR-125b tested in a wound-healing migration assay ().
Figure 8. miR-125b activates mouse fibroblasts by targeting Tp53inp1. (a) Schema of miRNA mimics or siRNAs transfection in mouse adult tissue fibroblasts (mATFs). (b) qPCR analysis of miR-125b expression in mATFs transfected with NC or miR-125b mimics (n = 3 independent replicates). (c) qPCR analysis of cancer associated fibroblast (CAF) markers in transfected mATFs. (d) Representative immunostaining images of αSma (green) and nuclei (Hoechst, blue) in mATFs treated as in (b). Scale bar: 50 μm. (e) Average percentage of αSMA positive cells as in (d) (n = 5 independent images). (f) Western blot analysis of αSma and Gapdh in miRNA-transfected mATFs. Intensity of each band is indicated below the image. (g) Representative images of miRNA-transfected cells that invaded a matrigel transwell membrane, stained with crystal violet. (h) Average number of invaded cells per field (n = 3 independent replicates). (i) Average cellular impedance (wound-healing migration) of mATFs transfected with NC or miR-125b mimics, and quantified 24h after wounding using an electric cell-substrate impedance sensing (ECIS) chamber. (j) Average qPCR analysis of miR-125b targets in the p53 network in the miRNA-transfected mATFs. (k) qPCR analysis of Tp53inp1 in mATFs treated with EVs from 4T1 cells for 2 days (n = 4 independent replicates). (l) qPCR analysis of Tp53inp1 and CAF markers in mATFs transfected with Tp53inp1 or NC siRNA. (m) Western blot analysis of αSma and Gapdh in mATFs treated as in (l). All graphs represent mean ± SEM (n = 3 to 5 replicates). qPCR results represent fold change relative to NC treatment after normalization to an internal control, which is snoRNA234 (b) or Gapdh (c, j, k, and l). *P < 0.05, **P < 0.01, ***P < 0.001 and ****P < 0.0001 determined using Student’s t-test.
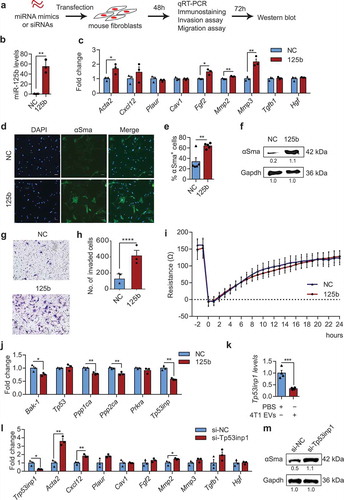
qRT-PCR analysis revealed that miR-125b suppressed several targets in the p53 network, which we identified previously [Citation29], including Bak-1, Ppp1ca, Ppp2ca, Prkra and Tp53inp1 (). Because Tp53inp1 was downregulated the most by miR-125b mimics, we selected it for further investigation. Incubation of mATFs with EVs purified from 4T1 cells significantly downregulated Tp53inp1 (). qRT-PCR analysis confirmed the knockdown of Tp53inp1 and demonstrated significant upregulation of CAF markers including Acta2, Cxcl12 and Mmp2 after transfection of Tp53inp1 targeting siRNAs (). Knockdown of Tp53inp1 also upregulated αSma protein (). These data suggest that Tp53inp1 is a key target that mediates the function of miR-125b in differentiation of fibroblasts in mice.
Human breast cancer cells secrete miR-125b in EVs and transfer it to CAFs
As models of human breast cancer, we implanted CA1a cells or two other human triple-negative breast cancer cell lines, BPLER and MDA-MB-231, in the MFPs of nude mice and let tumours develop for 12 weeks until they reached ~15 mm in diameter (). Using the Firefly circulating miRNA assay, we found that the level of miR-125b in total blood RNA was significantly higher in mice bearing CA1a tumours, BPLER tumours or MB-231 tumours compared to those without any tumour, relative to the level of let-7i, while the level of miR-21 was similar in the two groups (). This is consistent with previous studies that reported upregulation of circulating miR-125b in metastatic and chemoresistant breast cancer patients [Citation24,Citation25]. We also purified EVs from CA1a cells using a sucrose cushion and SEC as described in . qRT-PCR revealed that miR-125b was abundant in the purified CA1a EVs and was protected from RNase degradation ().
Figure 9. Secretion of miR-125b in EVs derived from human breast cancer cells and their uptake by fibroblasts. (a) Schema of MFP injection of human breast cancer cells in nude mice. After 12 weeks, blood samples were collected and circulating miRNA levels were analysed. (b) miRNA levels in the sera of tumour-free mice (n = 5) or mice with CA1a, BPLER or MB-231 tumours (n = 6) 12 weeks after implantation of the cells, relative to let-7i level, determined using Firefly circulating miRNA assay. (c) Average miR-125b levels in CA1a EVs after treatment with RNase If and Triton X-100 for 30 min, relative to miR-125b levels in the untreated group normalized to spike-in control cel-miR-39a (n = 3 replicates). (d) Schema of CA1a-SmCherry or CA1a cell implantation in the MFPs of NSG mice. After 4 weeks, tumours were collected and sorted for CD140a+ mCherry+ and CD140a+ mCherry− fibroblasts. (e) FACS separation of mCherry+ cells (gated) from the CD140+ population of CA1a-SmCherry tumours relative to unlabelled CA1a tumours. (f) qPCR analysis of miR-125b in sorted mCherry-negative and positive fibroblasts relative to snoRNA234 (n = 3 mice). (g) qPCR analysis of CAF markers in mCherry+ fibroblasts as compared to mCherry− fibroblasts (n = 3 mice). All bar graphs represent mean ± SEM. *P < 0.05, **P < 0.01, ***P < 0.001 and ****P < 0.0001 determined by Student’s t-test.
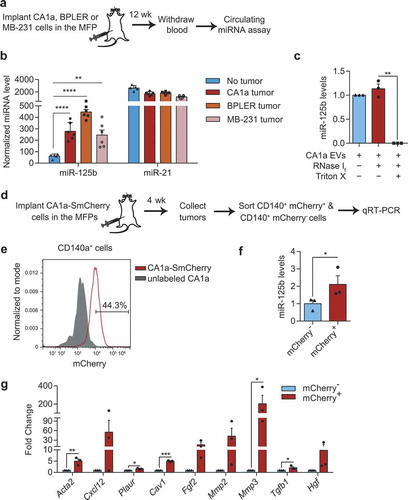
To further test if miR-125b would be transferred to fibroblasts in the tumour microenvironment, we implanted CA1a-mCherry cells in the MFPs of NSG mice and sorted the mCherry-positive and -negative CD140a+ cells from the tumour (). In the CA1a-mCherry tumours, 44% of CD140a+ fibroblasts were positive for mCherry indicating that these cells had taken up EVs from CA1a cells (). qRT-PCR analysis showed a significant upregulation of miR-125b and multiple CAF markers including Acta2, Cxcl12, Plaur, Cav1, Fgf2 and Mmp3 in mCherry+ fibroblasts compared to mCherry− fibroblasts (). These data suggest that uptake of mCherry+ EVs from CA1a tumour by fibroblasts increased intracellular miR-125b, which promoted their differentiation into CAFs.
miR-125b activates human fibroblasts by suppressing TP53INP1 and TP53
To examine further the function of miR-125b in human fibroblasts, we overexpressed miR-125b in human foetal tissue fibroblasts (hFTFs) by transfecting miR-125b mimics (). This approach increased miR-125b ~30 fold, and resulted in upregulation of CAF markers, including ACTA2, FGF2 and TGFB1 relative to cells transfected with NC mimics (). As expected, αSMA protein was also upregulated by overexpression of miR-125b (). We also found that TP53INP1 is a target of miR-125b in humans, given the sequence conservation of both miR-125b and its binding site within the TP53INP1 3ʹUTR between mice and humans, and other mammals (). Knockdown of TP53INP1 in hFTFs upregulated CAF markers ACTA2, TGFB1 and HGF significantly, as judged using qRT-PCR (). αSMA protein also increased after TP53INP1 knockdown in human fibroblasts ().
Figure 10. miR-125b activates human fibroblasts through suppression of TP53INP1 and TP53. (a) Schema of transfection of miRNA mimics or siRNAs in human foetal tissue fibroblasts (hFTFs). (b) qPCR analysis of miR-125b in hFTFs transfected with NC or miR-125b mimics. (c) qPCR analysis of CAF markers in the mimics transfected hFTFs. (d) Western blot analysis of αSMA relative to GAPDH in miRNA-transfected hFTFs. (e) miR-125b binding sites in TP53INP1 mRNA in humans (h), chimpanzees (c) and mice (m). (f) qPCR analysis of CAF markers in hFTFs transfected with NC or TP53INP1 siRNA. (g) Western blot analysis of αSMA relative to GAPDH in hFTFs transfected with TP53INP1 siRNA. (h) miR-125b binding sites in TP53 mRNA in humans (h), chimpanzees (c) and mice (m). In (e) and (h), miR-125b seed sequence is coloured in red. Conserved bases are highlighted in dark blue (3 species) and light blue (2 species). (i) qPCR analysis of CAF markers in hFTFs transfected with NC or TP53 siRNA. (j) Western blot analysis of αSMA and GAPDH in hFTFs transfected with TP53 siRNA. (k) A model of miR-125b transfer from breast cancer cells to fibroblasts for activation of cancer associated fibroblasts via blocking TP53INP1 and TP53 in humans. All bar graphs represent mean ± SEM (n = 3 independent repeats). *P < 0.05, **P < 0.01, ***P < 0.001 and ****P < 0.0001 determined by Student’s t-test.
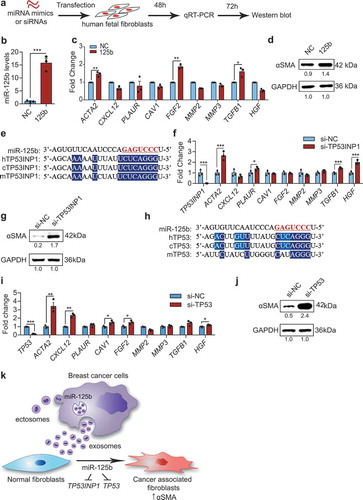
We previously identified TP53 as a target of miR-125b in humans, but not in mice (), and TP53 is known to promote fibroblast differentiation [Citation28–Citation30]. Therefore, we knocked down TP53 in hFTFs and found that it upregulated multiple CAF markers, including ACTA2, CXCL12, CAV1, FGF2, MMP2 and HGF (). TP53 knockdown also resulted in upregulation of αSMA protein (). Taken together, we therefore propose a model of fibroblast differentiation into CAFs, in which EVs from breast cancer cells promote the activation of fibroblasts into CAFs by transferring miR-125b from EVs to fibroblasts. Furthermore, EV-borne miR-125b functions to suppress the expression of both TP53INP1 and TP53 in human fibroblasts (). The same model is proposed in mice except that miR-125b acts through Tp53inp1, but not Tp53.
Discussion
Our previous work on miR-125b uncovered an important role of this miRNA in the survival of human cells and the development of zebrafish embryos [Citation28]. Loss of miR-125b triggers massive neural cell death in zebrafish embryos [Citation28]. miR-125b also suppresses apoptosis in human neuroblastoma cells and human lung fibroblasts [Citation28]. We identified multiple genes in the p53 network that are direct targets of miR-125b [Citation28,Citation29]. By modulating the expression of these genes, miR-125b fine-tunes p53 activity to regulate apoptosis and proliferation of normal and cancer cells [Citation29]. Our findings were supported by additional studies, which also demonstrated the important role of miR-125b in oncogenesis [Citation23,Citation31,Citation32]. Furthermore, miR-125b was also shown to promote tumourigenesis in multiple types of cancer including leukaemia, prostate cancer, metastatic lung cancer, drug resistant glioma, metastatic and drug-resistant breast cancer [Citation26,Citation31,Citation33–Citation35]. Recent studies also showed that miR-125b levels are elevated in the circulation of breast cancer patients with metastasis or chemotherapy resistance [Citation24,Citation25]. However, it was unclear whether the secretion of miR-125b is an important factor in breast cancer and whether healthy cells take up miR-125b to promote disease progression.
In this study, we found that miR-125b is abundant in EVs secreted by mouse and human metastatic breast cancer cells. Furthermore, mice bearing human metastatic tumours have high levels of miR-125b in their serum, in agreement with published findings of elevated miR-125b levels in the circulation of breast cancer patients with metastasis or chemoresistance [Citation24,Citation25]. Our data also revealed that EVs secreted by breast cancer cells are spontaneously taken up by stromal fibroblasts at a high rate. EVs from both mouse and human breast cancer cells deliver miR-125b to fibroblasts and promote their differentiation into CAFs. This is consistent with other reports that have found that the upregulation of miR-125b promotes the differentiation of fibroblasts and endothelial cells to myofibroblasts in cardiac tissues [Citation36,Citation37]. In cancer, resident fibroblasts differentiate into myofibroblast-like cells called CAFs which promote tumour growth, invasion and metastasis [Citation5]. In the present study, we demonstrated that miR-125b enhances CAF expression of αSMA, metalloproteases and some cytokines. The upregulation of αSMA was correlated with changes in fibroblast morphology, promoting conversion from a thin spindle shape to a well-spread myofibroblast-like shape ( and ). Upregulation of Tgfb1, Fgf2 and Hgf suggests an increase in the secretion of growth factors that are important for fibroblast activation and tumour growth. Upregulation of metalloproteases (Mmp2 and Mmp3) leads to degradation of the extracellular matrix during tumour invasion when CAFs act at the leading edge of the tumour to clear the way for tumour cells to invade. This is an important mechanism used by CAFs to promote cancer invasion. Indeed, we found that overexpression of miR-125b promotes invasion of mATFs, likely due to the increase in metalloproteases that digested the matrigel (). We did not observe any change in migration of mATFs with overexpression of miR-125b as judged by a wound-healing assay (). Hence, our study supports previous observations that CAFs promote invasion of tumour cells by secretion of metalloproteases rather than by migrating themselves [Citation38,Citation39].
Although the sequence of miR-125b is highly conserved in mice, humans and many other species, the targets of this miRNA are not always conserved. We have shown previously that within the p53 network, miR-125b binds to different targets in each species to fine-tune the activity of the p53 pathway in regulating apoptosis and proliferation [Citation29]. Thus, although the specific mRNAs targeted are not identical, the role of miR-125b in controlling the p53 pathway itself is conserved. In the present study, we found two genes in the p53 network, TP53INP1 and TP53, which mediate the function of miR-125b in fibroblast activation. miR-125b suppresses TP53INP1 in both mice and humans but targets TP53 only in humans. Loss of these targets promotes fibroblast activation, consistent with other reports on the roles of TP53INP1 and TP53 in CAFs of other cancer types [Citation12,Citation30]. The difference in the downstream targets of miR-125b may explain the differences in which CAF markers were upregulated when we overexpressed miR-125b in mouse and human fibroblasts.
In this study, we used CD140a (PDGFRα) as a surface marker to identify fibroblasts using an established FACS protocol [Citation40]. Our data confirmed that CD140a staining did not overlap with other markers, including CD45 and CD31, used to identify leukocytes and endothelial cells, respectively (Supplementary Figure 6A). Mouse 4TO7 and human CA1a breast cancer cells did not express CD140a (Supplementary Figure 6B). Comparing CD140a+ and CD140a− cells sorted from the same CA1a tumours, we found that the expression of Acta2, encoding αSma, the well-defined intracellular marker for CAFs, was enriched in CD140a+ cells (Supplementary Figure 6C). By contrast, the expression of endothelial markers (Cd31 and Tem8) and leukocyte markers (Cd45 and Cd34) were higher in the CD140a− than the CD140+ population. We cannot exclude the possibility that CD140a+ cells may include some untested cell types such as pericytes, for which there is no specific marker available [Citation41]. However, our data suggest that CD140a+ cells were enriched in the fibroblast population, including CAFs. For the functional assays, we always used both FACS analysis of CD140a and immunohistochemical staining of αSMA to define the CAF population.
We performed all the in vivo uptake assays in immunodeficient mice because we found that fluorescent transgenes including GFP and mCherry in tumour cells triggered immune responses, which inhibited tumour growth in immunocompetent mice. However, in order to show that tumour EVs promote fibroblast activation in immunocompetent animals, we coinjected 4TO7 cells with EVs from 4T1 cells in wildtype BALB/c mice (). The rationale for using 4T1 EVs in this experiment was that 4T1 cells are more aggressive than 4TO7 cells. We therefore hypothesized that metastatic 4T1 cells might transfer miR-125b to cells in the naive 4TO7 tumour to make the microenvironment more conductive to tumour growth and metastasis. We do not exclude the possibility that some 4T1 EVs might be taken up by 4TO7 cells but we expect that most of the injected EVs were dispersed into the subcutaneous tissue upon injection and they were preferentially taken up by resident fibroblasts, as we found in . The uptake of 4T1 EVs activated fibroblasts, which might better support tumour growth and invasion (). Blocking miR-125b in 4T1 EVs suppressed their ability to activate fibroblasts. Importantly, it is possible that the anti-miR-125b ASO also inhibited the function of endogenous miR-125b in the fibroblasts, contributing to the suppression of differentiation into CAFs. The data suggest that miR-125b is a major player in the function of 4T1 EVs, but do not exclude the possibility that other EV components might also contribute to the phenotype. This hypothesis is also suggested by our observation that the uptake of mCherry+ tumour EVs by CD140a+ fibroblasts upregulated CAF markers more than delivery of miR-125b alone (). Profiling mCherry+ and mCherry− fibroblasts in the future may identify other miRNAs, mRNAs or proteins taken up from tumour EVs that contribute to CAF function.
We observed higher uptake of tumour cell EVs by fibroblasts than by macrophages and other cell types. This phenomenon suggests that cancer cells communicate with fibroblasts via EVs to support cancer cell survival and growth. The mechanism for enhanced uptake of tumour EVs by fibroblasts is not known. Although fibroblasts have limited endocytic activity, they might internalize tumour EVs by nonendocytic mechanisms, such as by receptor-mediated fusion of tumour EVs with the cellular membrane of fibroblasts. Indeed, tumour EVs are known to exhibit organotropism depending on the types of integrins displayed on their surface [Citation42]. Lung-tropic exosomes that express integrins α6β4 and α6β1 are preferably taken up by fibroblasts in the lung [Citation42]. Our proteomic data indicates that integrin α6, αV and β1 are abundant in EVs from 4T1 cells. Further investigation is needed to understand the mechanism and the role of integrins in fibroblast uptake of tumour EVs.
Materials and methods
Cell culture
Origin and culture of cell lines
Mouse 4T1 and 4TO7 and human MCF10CA1a (CA1a) breast cancer cell lines were purchased from Karmanos Cancer Institute (Wayne State University, USA). BPLER cells were provided by Tan Ince (University of Miami, USA). MDA-MB231 and HEK-293T cells were obtained from ATCC. Human normal foetal tissue fibroblasts (hFTFs) were provided by Dr. Soh Boon Seng (Institute of Molecular and Cell Biology, Singapore). All cells were cultured in DMEM (Thermo Fisher Scientific, USA) supplemented with 10% foetal bovine serum – FBS (Biosera, France), 1× penicillin-streptomycin (Thermo Fisher Scientific), and 1× PlasmocinTM prophylactic (InvivoGen, USA) in a humidified incubator at 37°C with 5% CO2.
Establishment of fluorescent cell lines
Breast cancer cells were transduced with a lentivirus vector containing CD63 gene fused with copGFP following a CAG promoter (Supplementary Figure 1A), which was modified from pCT-CMV-CD63-GFP plasmid (System Biosciences, USA), as previously described [Citation18]. 4TO7-CD63-GFP, and CA1a-CD63-GFP cells were selected with 3 µg/mL puromycin (Santa Cruz Biotechnology, USA) for 2 weeks before sequential sorting to create stable cell lines. 4TO7 and CA1a cells were also transduced with lentivirus carrying pLV-Fluc-SmCherry-Puro that has a signal sequence inserted in the N terminus and a transmembrane domain sequence inserted at the C terminus of mCherry gene. Transduced cells were selected in 3 µg/mL puromycin and sorted twice to create a stable cell line.
EV purification and RNA sequencing
To remove bovine EVs from the FBS used for EV production, FBS was diluted in DMEM and subsequently ultracentrifuged at 120,000 ×g for 18 h at 4°C using a SW32Ti rotor (Beckman Coulter, USA). The supernatant was filtered through a 0.22 µm membrane. The medium was further diluted with DMEM to create 10% FBS medium with 1× penicillin-streptomycin (EV-free medium). 3 × 10⁶ 4T1 or 4TO7 cells were seeded in 9 T175 flasks, each of which contained 20 mL of EV-free medium, and cultured until the cells reached 80% confluency (2 days). The conditioned medium was collected from all the flasks and subjected to differential centrifugation (1000 rpm, 10 min; 2000 rpm, 15 min; 4500 rpm, 15 min) at 4°C and filtered through a 0.45 µm membrane to remove large debris and dead cells. The conditioned medium was ultracentrifuged at 110,000 ×g for 90 min at 4°C using the SW32Ti rotor. The supernatant was removed and the pellet was resuspended in 25 mL cold PBS and ultracentrifuged again, as above. The PBS was removed and the pellet was resuspended in 500 µl Trizol (Thermo Fisher Scientific). Cell lysate from 0.5 million 4T1 or 4TO7 cells were also obtained in 500 µl Trizol. 0.1 mL of chloroform (Sigma, USA) was added to each Trizol sample with vigorous mixing. The samples were centrifuged at 12,000 ×g for 15 min at 4°C and the upper layer was collected. RNA was precipitated by mixing the upper layer with isopropanol (1:1) in the presence of glycoblue (Life technologies, USA). The sample was centrifuged at 21,000 ×g for 15 min at 4°C. The supernatant was removed, and the pellet was washed twice with 70% ethanol (Sigma, USA) and air dried. The pellet was resuspended in 30 µL of RNase-free water (Thermo Fisher Scientific) and analysed using a Nanodrop spectrophotometer (Thermo Fisher Scientific) and a Bioanalyzer 2100 (Agilent, USA). Ribosomal RNAs were removed using the Ribo-Zero kit (Illumina, USA). The remaining RNAs were separated by denaturing polyacrylamide gel electrophoresis and stained with SYBR-Gold (Invitrogen). miRNA-sized small RNAs were excised from the polyacrylamide gel. Small RNAs were eluted in 0.3 M NaCl from crushed gel pieces. After recovery, precipitation and washing, small RNAs were suspended in nuclease-free water. The RNAs were converted to cDNAs using a NEBNext® small RNA library prep kit (New England Biolabs, USA) according to the manufacturer’s instructions. The library was sequenced using the Illumina HiSeq 2500 system. Sequencing reads were processed by Cutadapt [Citation43] to trim the cloning adaptor sequences using default parameters. The sequences were aligned to mouse miRNA sequences and genome sequence (mm9 genome assembly) using Bowtie [Citation44]. Analysis of the aligned data was performed using BEDTools Multicov [Citation45]. Raw data and processed sequences are available on Gene Expression Omnibus website (GEO www.ncbi.nlm.nih.gov/geo/), record GSE119420.
EV purification using sucrose cushion and SEC
The conditioned medium was collected from mouse or human breast cancer cell lines and filtered after three rounds of differential centrifugation, as described earlier. A total of 25 mL of concentrated medium was then layered on top of a 2 mL sucrose cushion (60% sucrose (Acros Organics, USA) in 10 mM HEPES (Sigma, USA) and 0.85% NaCl (Sigma) pH 7.4) and ultracentrifuged at 100,000 ×g for 90 min at 4°C using a SW32Ti rotor. The interface (~3 mL) between the sucrose cushion and the medium was collected. A total of 10 mL of the sample was layered on top of 0.75 mL sucrose cushion and ultracentrifuged at 110,000 ×g for 12 h at 4°C using a SW41Ti rotor. The interface (~1 mL) was collected from each tube. A total of 0.5 mL of the sample was loaded into a prepacked qEV-original SEC column (Izon Science, New Zealand), equilibrated with PBS and eluted with PBS in 40 fractions (0.5 mL/fraction). Fractions 7 to 11 were combined, 0.22 µm sterile filtered and loaded onto an Amicon Ultra-15 centrifugal filter unit (MilliporeSigma, USA) and centrifuged at 3,260 ×g at 4°C to further concentrate the EVs. We submitted all relevant information to the EV-TRACK knowledgebase (EV-TRACK ID: EV190012) [Citation46].
EV analysis
EV concentration
EV concentration was analysed using a NanoSight Tracking Analysis NS300 system (Malvern, UK). A total of 0.5 mL of EVs was injected into the sample chamber. Three videos were recorded and analysed using similar detection thresholds for each batch. EV concentration was calculated as the average concentration of the three videos.
Protein concentration
Protein concentration was measured using a Pierce BCA assay (Life Technologies, USA) with BSA (NEB, UK) concentrations as standards. A total of 5 µL of samples were loaded into each well of a 96-well plate and 100 µL of BCA solution was added. The plate was incubated at 37°C for 30 min and the absorbance was detected at 562 nm using the Synergy H1 microplate reader (Biotek, USA).
Transmission electron microscopy (TEM)
EVs were fixed with 4% paraformaldehyde (PFA; Alfa Aesar, USA) (1:1) and loaded onto a TEM copper grid and then washed with PBS, 1% glutaraldehyde, and distilled water. EVs were then incubated with 4% uranyl acetate and visualized under a Tecnai 12 BioTWIN transmission electron microscope (FEI/Phillips, USA) at 100 kV.
RNA protection assay
A total of 1.5 × 10¹¹ EVs were incubated with 50 U of RNase If (New England Biolabs) with or without 1% Triton X-100 (Sigma) at 37°C for 30 min and inactivated at 75°C for 5 min. A total of 0.45 mL of Trizol-LS (Life technologies) was added immediately after the inactivation. A total of 2 µL of 2 pM cel-miR-39a was spiked in each sample. RNA was extracted and similar volumes of RNA were reverse transcribed and used for miR-125b and cel-miR-39a qPCR with the miRCURY LNA miRNA PCR kit (Qiagen, USA).
Surface CD63 analysis using FACS
Magnetic beads (Thermo Fisher Scientific) were coated with anti-mouse-CD63 antibody (Miltenyi Biotec, Germany) and incubated with EV-enriched fractions (fraction 7–11) and protein-enriched fractions (fraction 16–22) from the SEC purification of 4T1 EVs. Subsequently, the beads were washed and stained with anti-mouse-CD63-PE antibody (BioLegend, USA). PE signals from the beads were analysed using a CytoflexS flow cytometer (Beckman Coulter, USA).
In vitro uptake assay
Purified 4T1 EVs were concentrated by ultracentrifugation at 100,000 ×g, 4°C for 90 min. The EV pellet was resuspended in 0.2% EV-free BSA solution. A total of 3 µL of PKH26 dye was added to 200 µL of diluent C immediately before labelling. A total of 40 µL of EVs diluted with 160 µL diluent C was added to the dye solution. After 3 min, 200 µL of EV-free medium was added to stop the reaction. Labelled EVs were diluted in PBS and sucrose to create a final 2.5% sucrose solution. Labelled EVs or a control solution (PBS with PKH26 dye only) were loaded on top of sucrose gradients (5–60%) and ultracentrifuged at 160,000 ×g in an SW28.1 rotor at 4°C for 18 h. Sixteen fractions (1 mL/fractions) were collected from top to bottom. PKH26 fluorescent signals were compared in the fractions (Ex: 551 nm, Em: 567 nm) using a Spectramax M2 plate-reader (Molecular Devices, USA). EV concentration in each fraction was measured using a Nanosight. Fractions 10 to 12 that were enriched in EVs and had high fluorescent signal in the labelled EVs but low in the control were ultracentrifuged at 100,000 ×g for 90 min at 4°C. EVs were resuspended in EV-free RPMI complete medium, and incubated with 50,000 mATFs for 24 h before FACS analysis of the cells.
For quantification of miR-125b, 100,000 mATFs were seeded per well in a 24-well plate in EV-free media for 24h and then incubated with 4.5 × 10¹¹ unlabelled 4T1 EVs for 24 h and collected for qRT-PCR analysis.
Luciferase reporter assay for mir-125b functions
HEK-293T cells were transfected with psiCHECK-II plasmids (Promega, USA) containing three perfect complementary binding sites for miR-125b in the 3ʹ-UTR of Renilla luciferase by LipofectamineTM 2000 (Life Technologies) in OptiMEM (Life Technologies) according to the manufacturer’s protocol. 4T1 EVs at different concentrations (108 to 1010 particles) were incubated with the transfected HEK-293T cells. 100 nM miR-125b mimics were transfected in the cells as a positive control using LipofectamineTM 2000. After 24 h, luciferase activity was measured using the Dual Luciferase Assay System (Promega).
Animal experiments
All mouse experiments were performed according to experimental protocols approved by the Animal Ethics Committee of City University of Hong Kong and the Animal Care and Use Committees of Boston Children’s Hospital . BALB/c mice were purchased from Chinese University of Hong Kong. BALB/c SCID mice, nude mice and NSG mice (NOD.Cg-Prkdcscid Il2rg tm1Wjl /SzJ) were purchased from the Jackson Laboratory (USA). All mice were monitored and bred in our facilities.
In vivo EV uptake
Female 8-week-old BALB/c SCID mice were injected with 1.25 × 10⁵ 4TO7 cells in the 4th MFP and 4TO7-CD63-GFP cells in the contralateral MFP. Female 6 weeks old NSG mice were injected with 106 CA1a and CA1a-CD63-GFP (or CA1a-SmCherry) cells in each of the 4th mammary fat pads. Mice were sacrificed when their tumours approached 15 mm in diameter, as measured using digital callipers. The mice were perfused with PBS. Tumours and lungs were excised, washed with PBS and dissociated in DMEM medium containing 10% FBS and 5 mg/ml collagenase IV (Thermo Fisher Scientific) using the GentleMACS dissociator (Miltenyi Biotech, Germany). Cells were filtered through a 70 µm strainer, blocked with anti-mouse CD16/CD32 antibody (BioLegend), and stained with either anti-CD140a-PE or anti-CD140a-APC (fibroblasts), anti-CD45-PE-Cy7 (leukocytes), anti-CD11b-PE (monocytes), anti-F4/80-APC (macrophages), anti-Ly6G/C-PerCP/Cy5.5 or anti-CD31-PE (endothelial) antibodies (BioLegend) for 30 min at 4°C. Dead cells were identified by staining with SYTOXTM blue (Thermo Fisher Scientific) and removed from the analysis. Cells were analysed using a FACS Canto cytometer (BD BioSciences) or CytoFlexS cytometer (Beckman Coulter) or sorted using a SH800Z cell sorter (Sony, Japan). Sorted CD140a+ mCherry+ cells and CD140a+ mCherry− cells were centrifuged and resuspended in 0.5 mL of Trizol (Life Technologies) for RNA extraction and qRT-PCR. Tumours from 4TO7-CD63-GFP or CA1a-Sm-Cherry cells were fixed in 10% buffered formalin (ThermoFisher Scientific) for immunostaining as described later.
EV biological effects
A total of 250,000 4TO7 cells were mixed with PBS (control), 4.5 × 10¹¹ (1 dose) or 2.25 × 10¹¹ (0.5 dose) of 4T1 EVs in a total volume of 100 µL and immediately injected into the flank of 9 week-old female BALB/c mice. Tumours were monitored and collected after 3 weeks. Half of each tumour was dissociated for flow cytometry analysis of CD140a, as described earlier. The other half was fixed in 10% buffered formalin (ThermoFisher Scientific) at room temperature for immunohistochemical staining of mouse smooth muscle actin alpha (SMA-α), as described later.
In rescue experiments, 4T1 EVs were electroporated with antisense oligonucleotides (ASOs) purchased from Shanghai Gene Pharma (China). 4.5 × 10¹¹ 4T1 EVs was electroporated with 400 pmol of anti-miR-125b ASOs (5′-UCACAAGUUAGGGUCUCAGGGA-3′) or negative control (NC) ASOs (5′-CAGUACUUUUGUGUAGUACAA-3′) using a Genepulser Xcell electroporator (Bio-Rad, USA) with “exponential protocol” (250 V, 100 uF, R = ∞, cuvette size = 4 mm). The electroporated EVs were mixed with 250,000 4TO7 cells and immediately injected into the flanks of BALB/c mice. Mice were monitored for 3 weeks and tumours were collected and processed as described earlier. To assess the activity of the ASOs, RNA was extracted from unelectroporated EVs or EVs electroporated with 125b-ASOs or NC-ASOs and miR-125b levels were measured using the TaqMan MicroRNA assay kit (Life Technologies, USA) as described later.
Mouse adult tissue fibroblast isolation
Mouse adult tissue fibroblasts (mATFs) were isolated from female BALB/c mice as previously described [Citation47]. Eight- to ten-week-old mice were euthanized. Mouse ears were removed and chopped into small pieces before incubation with RPMI supplemented with 10% FBS, 1× penicillin-streptomycin, and 1× plasmocin (1:1) and 5 mg/ml collagenase type IV (Thermo Fisher Scientific) at 37°C, and shaken at 200 rpm for 90 min. Detached cells were filtered through a 70 µm strainer, diluted in 10 mL of RPMI complete medium and centrifuged at 500 ×g for 7 min at 4°C. Cell pellets were washed once with RPMI complete medium and seeded in a 10-cm plate. After 3 days, new medium was added and the cells were monitored daily until they reached 80% confluence (passage 1). mATFs were subcultured and used within the 1st to 5th passage.
Functions of mir-125b in fibroblasts during cancer progression
A total of 500,000 4TO7-SmCherry cells were injected into the 4th MFPs of NSG mice. Tumours were collected after 3 weeks. Cells were dissociated as described earlier. mCherry negative cells were sorted using FACS and seeded in a 10-cm plate. Adherent cells were washed extensively and passaged three times. Most of them have spindle or well-spread shapes, the typical fibroblast morphology. At passage 3, tumour fibroblasts were transfected with 100 nM 125b-ASOs or NC-ASOs using LipofectamineTM 3000 (Life technologies). miR-125b levels were measured using qRT-PCR to confirm the knockdown of miR-125b in tumour fibroblasts. A total of 500,000 tumour fibroblasts were co-injected with 250,000 4TO7 cells (2:1 ratio) into the 4th MFPs of BALB/c mice. Tumour size was measured every 3 days using callipers. After 3 weeks, tumours were collected and dissociated. Cells were stained with the following antibodies: anti-CD45-PE-Cy7, anti-CD11b-PE and anti-F4/80-APC for macrophages, anti-CD3-APC for T lymphocytes, anti-CD45-PE-Cy7 and Ly6G-PE for neutrophils, and anti-CD45-PE-Cy7 and CD11c-PE for dendritic cells.
Quantification of miRNAs in the sera of xenografted mice
A total of 3 × 10⁵ CA1a, BPLER or MDA-MB-231 cells were injected in the flanks of 8-week-old female nude mice. When tumours approached 20 mm in diameter (about 12 weeks after implantation), the blood was withdrawn by cardiac puncture. Serum was separated by centrifugation at 4,000 xg for 1 min. Levels of miR-125b, miR-21 and let-7i were quantified in 40 μL serum from each mouse using the FireflyTM circulating miRNA assay (Abcam, USA).
miRNA mimic and siRNA transfection
Human TP53 siRNA was purchased from Santa Cruz Biotechnology (USA). miRNA mimics and other siRNAs (with 2ʹ-O-methylation) were purchased from Shanghai Gene Pharma (China). A total of 20 µM of miRNA mimics or siRNAs was transfected into 100,000 hFTFs or mATFs using LipofectamineTM 3000 (Life Technologies) in OptiMEM (Life Technologies) according to the manufacturer’s protocol. hFTFs were starved in serum free media for 24 h before transfection. After 5 h, OptiMEM was removed and normal medium was added. At day 2, medium was aspirated and 0.5 mL of Trizol was added for RNA extraction and qRT-PCR. At day 3, cells were harvested and lysed in 50 µL of RIPA buffer with protease inhibitor for Western blotting.
miRNA and siRNA sequences
miR-125b mimic: 5ʹ-UCCCUGAGACCCUAACUUGUGA-3ʹ
Negative control: 5ʹ-UUCUCCGAACGUGUCACGUTT-3ʹ
Mouse Trp53inp1 siRNA: 5ʹ-GGCGAGUUGUGGAAAUGAUTT-3ʹ
Human TP53INP1 siRNA: 5ʹ-CGUCAGUACAAUUACUAAUTT-3ʹ
qRT-PCR of cellular RNAs
RNA was diluted to 50 µg/µL for reverse transcription (RT). A total of 100 µg total RNA were used for miRNA RT and 500 µg total RNA was used for mRNA RT, with a high capacity cDNA RT kit (Life Technologies). qPCR was conducted using the TaqMan miRNA qPCR kit (Thermo Fisher Scientific) or Ssofast Green qPCR kit (BioRad) for miRNA and mRNA quantification, respectively, in a CFX-96 qPCR machine (Bio-Rad, USA). Cellular miRNA levels were normalized to snoRNA234 (mouse) or U6B snRNA (human). mRNA levels were normalized to GAPDH (for primer sequences, see Supplementary Table 1).
Western blots
Protein concentration was measured by BCA assay, as described above. Samples were diluted in reducing buffer (5% β-mercaptoethanol, 0.02% bromophenol blue, 30% glycerol, 10% sodium dodecyl sulphate and 250 mM Tris-HCl pH 6.8), and similar amounts of protein were loaded onto a 10% SDS-PAGE gel. Electrophoresis was conducted at 80 V for stacking and 150 V for separation until the sample dye reached the bottom of the gel. The samples were blotted onto a PVDF membrane and blocked with 5% skimmed milk in TBST buffer (20 mM Tris base, 150mM NaCl and 0.1% Tween 20) for 30 min. The membrane was incubated with primary antibodies, anti-SMA-α antibody (BioLegend) and anti-GAPDH antibody (Santa Cruz, USA) in TBST containing 5% skimmed milk overnight at 4°C and washed with TBST before an incubation with peroxidase anti-mouse or anti-rabbit secondary antibody (Vectorlabs, UK) in TBST with milk for 60 min. Membrane was washed and signal was developed in a ChemiDocTM touch imaging system (Bio-Rad). Uncropped images are provided in Supplementary Figures 7 and .
Immunostaining
Immunostaining of cells
Cover slips were coated with gelatin (Thermo Fisher Scientific) for 30 min at 37°C and washed once with sterile PBS. A total of 100,000 mATFs were seeded on the cover slip in each well of a 12-well plate. After 24 h, cells were transfected with miR-125b (125b) mimics or scrambled oligonucleotide (NC) with lipofectamine, as described earlier. After 2 days, cells were washed with PBS and fixed in 4% PFA for 10 min. Cells were blocked with 5% BSA with 0.2% triton for 60 min at room temperature and incubated with anti-SMA-α antibody (BioLegend) overnight at 4°C. Cells were washed 3 times with PBS containing 0.05% Triton before incubation with anti-mouse AF488 antibody (Biolegend, USA) for 60 min at room temperature. Cells were incubated with 5 µg/mL Hoechst 33,342 (Cell Signaling Technology, USA) in PBS for 10 min at room temperature and washed 3 times with PBS. The cover slips were mounted on glass slides with Prolong Diamond Antifade Mountant (Life Technologies). Images were taken at 20X using a Nikon Eclipse Ni-E upright fluorescence microscope. Images were analysed using ImageJ.
Immunohistochemical staining of tumour sections
5 µm formalin-fixed paraffin-embedded tumour sections were prepared, dewaxed, washed in down-graded alcohols and water. Antigen retrieval was conducted by immersing the sections in pre-heated 90–95°C Envision Flex Target Retrieval Solution of high pH (DAKO, USA) and microwaved for a further 15 to 30 min. Sections were allowed to cool down in the retrieval solution for at least 20 min at room temperature. Rabbit anti-αSMA antibody (Abcam, ab5694, dilution 1:500) was then applied to sections and incubated for 30 min at room temperature after blocking endogenous peroxidase. Detection was facilitated by the addition of EnVision FLEX/HRP (DAKO) and DAB chromogenic substrate (DAKO) for 30 min and 2 min, respectively, at room temperature. Haematoxylin was used for nuclear counterstain.
Immunofluorescent staining of tumour sections
4TO7-CD63-GFP tumour cryo-sections were fixed in 4% formaldehyde in HBSS/HEPES buffer at 4°C for 7 min, washed twice with PBS, blocked with 10% goat serum for 20 min at room temperature. The sections were then incubated with primary antibodies including purified rat anti-CD45 antibody (Biolegend Cat #103101, diluted 1:250), rat anti-CD31 antibody (BioLegend Cat # 102401, diluted 1:40), rat anti-Ly6G antibody (BioLegend Cat# 127601) and rat anti-CD140a antibody (eBioSciences Cat # 14-1401-81, diluted 1:100), rat anti-EPCAM antibody (BioLegend Cat #118201, diluted 1:125) for 1 h, washed 3 times with PBS and incubated with goat-anti-rat-Cy5 secondary antibody (Jackson Immuno Research, Cat 112-175-143, diluted 1:250) for 30 min at room temperature. Slides were washed three times with PBS and mounted in Vectashield medium with DAPI (Vector Labs). Images were acquired using an Axiovert 200M microscope (Zeiss).
CA1a-SmCherry tumours were fixed in formalin and embedded in paraffin. Five micrometre tumour sections were prepared, dewaxed in xylene, rehydrated in down-graded alcohols (100%, 95%, 70%) and water. Retrieval of targets was conducted by superheating the sections in a scientific-type microwave oven for 15–30 min until boiling of antigen retrieval solution (DAKO, Envision Flex Target Retrieval Solution of high pH) was attained. Sections were allowed to cool down in the retrieval solution for at least 20 min before proceeding. Rabbit anti-mCherry primary antibody (Abcam, ab167453, dilution 1:400) was applied to sections and incubated for 30 min at room temperature after blocking endogenous peroxidase. Signal detection was facilitated by the addition of goat anti-rabbit secondary antibody conjugated with HRP (Perkin Elmer), followed by OPAL 520 fluorophore (Perkin Elmer), each incubated for 10 min at room temperature. Sections were then microwaved again in another round of antigen retrieval solution for stripping unbound anti-mCherry antibody and unmasking SMA antigens. Blocking reagent was applied again for 10 min at room temperature. After incubating in rabbit anti-SMA antibody (Abcam, ab5694, dilution 1:500) for 30 min at room temperature, goat anti-rabbit secondary antibody conjugated with HRP (Perkin Elmer) was added and then followed by OPAL 650 fluorophore (Perkin Elmer), each incubated for 10 min at room temperature. Images were acquired using a LSM-880 NLO confocal laser scanning microscope (Zeiss, Germany) and presented with pseudo-colors.
Invasion assay
A total of 25,000 mATFs were seeded in serum-free medium in each transwell insert (with 8 μm pores) pre-coated with matrigel in a 24-well plate (Corning, USA). After the cells attached to the matrigel, they were transfected with miRNA mimics using Lipofectamine 3000, as described earlier. Complete medium containing 10% FBS was used as a chemo-attractant in the lower compartment of the well. After 72 h of incubation at 37°C, the cells on the upper compartment were removed using cotton swabs and the membrane surface was stained with crystal violet. The invaded cells were visualized under a microscope and quantified using ImageJ.
Migration assay
mATFs were transfected with miRNA mimics as described earlier. After 24 h, 100,000 cells were seeded into 8WE10+ electric cell-substrate impedance sensing (ECIS) chambers (Applied Biophysics, USA) preconditioned with L-cysteine and RPMI complete medium. The chambers were attached to an ECIS Zθ (Applied Biophysics) for impedance monitoring. After 24 h, wounds were created at 6500 µA, 64,000 Hz for 30 sec. Cellular impedance were recorded for 24 h after wounding.
Statistical analysis
All statistical analysis was performed using Student’s one-tailed t-tests in GraphPad Prism 6. P-values less than 0.05 were considered significant, based on at least 3 independent replicates. Animal experiments were repeated in groups of 3–4 mice. The minimum sample size of 3 was determined using G*Power analysis which compares the mean difference of 2 independent groups with α error prob = 0.05, effect size d = 5 and power = 0.95.
Author contribution
L.T.V. and B.P. performed the experiments, collected and analysed the data and prepare the manuscript with assistance from D.X.Z. (EV purification, EV characterization, imaging and animal experiments), V.M. (histopathology, immunostaining and in situ hybridization), C.A.M. (animal experiments, FACS analysis and immunostaining), C.K.L. (EV purification and characterization, digital drawing), T.K. (EV purification and characterization) and J.J. (sequencing).
M.T.L. conceptualized the project, obtained funding, trained and supervised the students, designed the experiments, analysed the data and wrote the manuscript with help from J.L. (funding, training and supervision), W.C.C. (resources and supervision), L.H. (sequencing data analysis), A.G. (supervision), and L.M. (supervision).
The authors declare no competing interests.
Geolocation
Hong Kong, China; Ithaca, New York, USA; Boston, Massachusetts, USA; and Tübingen, Germany
Supplemental Material
Download PDF (1 MB)Acknowledgments
We sincerely thank Dr. Jiahai Shi, Dr. Leo Chan, Dr. Liang Zhang and Jianbo Yue (City University of Hong Kong), Prof. Randy Schekman (University of California Berkley), Prof. Harvey Lodish (Whitehead Institute), Dr. Ng Shyh Chang, Dr. Wai Leong Tam (Genome Institute of Singapore), Dr. Soh Boon Seng (Institute of Molecular and Cell Biology, Singapore) and Andrew Kung (Columbia University) for providing valuable reagents and advices. We also thank Waqas Muhammad Usman, Chanh Tin Pham, Lawrence Chan, Limin Feng, Dr. Amy Fong (City University of Hong Kong), Zhan Xu, Dr. Natasha Barteneva, Dr. Radiana Trifonova and Kenneth Ketman (Boston Children's Hospital), Hazel Kwok (Queen Elizabeth Hospital, Hong Kong) and Morayma Temoche (University of California Berkley) for technical assistance.
Additional information
Funding
Related Research Data
References
- Bray F, Ren J-S, Masuyer E, et al. Global estimates of cancer prevalence for 27 sites in the adult population in 2008. Int J Cancer. 2013;132(5):1133–24.
- Vanharanta S, Massagué J. Origins of metastatic traits. Cancer Cell. 2013;24(4):410–421.
- Quail DF, Joyce JA. Microenvironmental regulation of tumor progression and metastasis. Nat Med. 2013;19(11):1423–1437.
- Karagiannis GS, Poutahidis T, Erdman SE, et al. Cancer-associated fibroblasts drive the progression of metastasis through both paracrine and mechanical pressure on cancer tissue. Mol Cancer Res. 2012;10(11):1403–1418.
- Cirri P, Chiarugi P. Cancer-associated-fibroblasts and tumour cells: a diabolic liaison driving cancer progression. Cancer Metastasis Rev. 2012;31(1–2):195–208.
- Jung D-W, Yu SX, Borgel S, et al. Tumor-stromal crosstalk in invasion of oral squamous cell carcinoma: a pivotal role of CCL7. Int J Cancer. 2010;127(2):332–344.
- Erez N, Truitt M, Olson P, et al. Cancer-associated fibroblasts are activated in incipient neoplasia to orchestrate tumor-promoting inflammation in an NF-kappaB-dependent manner. Cancer Cell. 2010;17(2):135–147.
- Olumi AF, Grossfeld GD, Hayward SW, et al. Carcinoma-associated fibroblasts direct tumor progression of initiated human prostatic epithelium. Cancer Res. 1999;59(19):5002–5011.
- Martins VR, Dias MS, Hainaut P. Tumor-cell-derived microvesicles as carriers of molecular information in cancer. Curr Opin Oncol. 2013;25(1):66–75.
- Kosaka N, Iguchi H, Hagiwara K, et al. Neutral sphingomyelinase 2 (nSMase2)-dependent exosomal transfer of angiogenic microRNAs regulate cancer cell metastasis. J Biol Chem. 2013;288(15):10849–10859.
- Bobrie A, Krumeich S, Reyal F, et al. Rab27a supports exosome-dependent and -independent mechanisms that modify the tumor microenvironment and can promote tumor progression. Cancer Res. 2012;72(19):4920–4930.
- Pang W, Su J, Wang Y, et al. Pancreatic cancer-secreted miR-155 implicates in the conversion from normal fibroblasts to cancer-associated fibroblasts. Cancer Sci. 2015;106(10):1362–1369.
- Silva TA, Smuczek B, Valadão IC, et al. AHNAK enables mammary carcinoma cells to produce extracellular vesicles that increase neighboring fibroblast cell motility. Oncotarget. 2016;7(31):49998–50016.
- Webber J, Jenkins RH, Meran S, et al. Modulation of TGFbeta1-dependent myofibroblast differentiation by hyaluronan. Am J Pathol. 2009;175(1):148–160.
- Valadi H, Ekström K, Bossios A, et al. Exosome-mediated transfer of mRNAs and microRNAs is a novel mechanism of genetic exchange between cells. Nat Cell Biol. 2007;9(6):654–659.
- Kosaka N, Iguchi H, Ochiya T. Circulating microRNA in body fluid: a new potential biomarker for cancer diagnosis and prognosis. Cancer Sci. 2010;101(10):2087–2092.
- Kosaka N, Yoshioka Y, Hagiwara K, et al. Trash or treasure: extracellular microRNAs and cell-to-cell communication. Front Genet. 2013;4. DOI:10.3389/fgene.2013.00173.
- Le MTN, Hamar P, Guo C, et al. miR-200–containing extracellular vesicles promote breast cancer cell metastasis. J Clin Invest. 2014;124(12):5109–5128.
- Kobayashi T, Vischer UM, Rosnoblet C, et al. The tetraspanin CD63/lamp3 cycles between endocytic and secretory compartments in human endothelial cells. Mol Biol Cell. 2000;11(5):1829–1843.
- Santner SJ, Dawson PJ, Tait L, et al. Malignant MCF10CA1 cell lines derived from premalignant human breast epithelial MCF10AT Cells. Breast Cancer Res Treat. 2001;65(2):101–110.
- Ohshima K, Inoue K, Fujiwara A, et al. Let-7 microRNA family is selectively secreted into the extracellular environment via exosomes in a metastatic gastric cancer cell line. PLOS ONE. 2010;5(10):e13247.
- Yin H, Sun Y, Wang X, et al. Progress on the relationship between miR-125 family and tumorigenesis. Exp Cell Res. 2015;339(2):252–260.
- Zhou M, Liu Z, Zhao Y, et al. MicroRNA-125b confers the resistance of breast cancer cells to paclitaxel through suppression of pro-apoptotic Bcl-2 antagonist killer 1 (Bak1) expression. J Biol Chem. 2010;285(28):21496–21507.
- Zheng Y, Li S, Boohaker RJ, et al. A microRNA expression signature in taxane-anthracycline-based neoadjuvant chemotherapy response. J Cancer. 2015;6(7):671–677.
- Wang H, Tan G, Dong L, et al. Circulating miR-125b as a marker predicting chemoresistance in breast cancer. PloS One. 2012;7(4):e34210.
- Usman WM, Pham TC, Kwok YY, et al. Efficient RNA drug delivery using red blood cell extracellular vesicles. Nat Commun. 2018;9(1):2359.
- van der Vlist EJ, Enm N-TH, Stoorvogel W, et al. Fluorescent labeling of nano-sized vesicles released by cells and subsequent quantitative and qualitative analysis by high-resolution flow cytometry. Nat Protoc. 2012;7(7):1311–1326.
- Le MTN, Teh C, Shyh-Chang N, et al. MicroRNA-125b is a novel negative regulator of p53. Genes Dev. 2009;23(7):862–876.
- Le MTN, Shyh-Chang N, Khaw SL, et al. Conserved regulation of p53 network dosage by microRNA-125b occurs through evolving miRNA-target gene pairs. PLoS Genet. 2011;7(9):e1002242.
- Procopio M-G, Shemesh T, Thiagarajan V, et al. Combined CSL and p53 downregulation promotes cancer-associated fibroblast activation. Nat Cell Biol. 2015;17(9):1193–1204.
- Shi X-B, Xue L, Ma A-H, et al. miR-125b promotes growth of prostate cancer xenograft tumor through targeting pro-apoptotic genes. Prostate. 2011;71(5):538–549.
- Bousquet M, Nguyen D, Chen C, et al. MicroRNA-125b transforms myeloid cell lines by repressing multiple mRNA. Haematologica. 2012;97(11):1713–1721.
- Bousquet M, Harris MH, Zhou B, et al. MicroRNA miR-125b causes leukemia. Proc Natl Acad Sci. 2010;107(50):21558–21563.
- Chaudhuri AA, So AY-L, Mehta A, et al. Oncomir miR-125b regulates hematopoiesis by targeting the gene Lin28A. Proc Natl Acad Sci. 2012;109(11):4233–4238.
- Haemmig S, Baumgartner U, Glück A, et al. miR-125b controls apoptosis and temozolomide resistance by targeting TNFAIP3 and NKIRAS2 in glioblastomas. Cell Death Dis. 2014;5:e1279.
- Nagpal V, Rai R, Place AT, et al. MiR-125b is critical for fibroblast-to-myofibroblast transition and cardiac fibrosis. Circulation. 2016;133(3):291–301.
- Bie Z-D, Sun L-Y, Geng C-L, et al. MiR-125b regulates SFRP5 expression to promote growth and activation of cardiac fibroblasts. Cell Biol Int. 2016;40(11):1224–1234.
- Kessenbrock K, Plaks V, Werb Z. Matrix metalloproteinases: regulators of the tumor microenvironment. Cell. 2010;141(1):52–67.
- Cao H, Eppinga RD, Razidlo GL, et al. Stromal fibroblasts facilitate cancer cell invasion by a novel invadopodia-independent matrix degradation process. Oncogene. 2016;35(9):1099–1110.
- Sharon Y, Alon L, Glanz S, et al. Isolation of normal and cancer-associated fibroblasts from fresh tissues by fluorescence activated cell sorting (FACS). J Vis Exp. 2013;71:e4425.
- Armulik A, Genové G, Betsholtz C. Pericytes: developmental, physiological, and pathological perspectives, problems, and promises. Dev Cell. 2011;21(2):193–215.
- Hoshino A. Tumour exosome integrins determine organotropic metastasis. Nature. 2015. DOI:10.1038/nature15756.
- Martin M. Cutadapt removes adapter sequences from high-throughput sequencing reads. EMBnet.journal. 2011;17(1):10–12.
- Langmead B, Trapnell C, Pop M, et al. Ultrafast and memory-efficient alignment of short DNA sequences to the human genome. Genome Biol. 2009;10(3):R25.
- Quinlan AR, Hall IM. BEDTools: a flexible suite of utilities for comparing genomic features. Bioinforma Oxf Engl. 2010;26(6):841–842.
- EV-TRACK Consortium. EV-TRACK: transparent reporting and centralizing knowledge in extracellular vesicle research. Nat Methods. 2017;14(3):228–232.
- Khan M, Gasser S. Generating primary fibroblast cultures from mouse ear and tail tissues. J Vis Exp. 2016;107. DOI:10.3791/53565.