
ABSTRACT
In Mammals, microglial cells are considered as the resident immune cells in central nervous system (CNS). Many studies demonstrated that, after injury, these cells are activated and recruited at the lesion site. Leech microglia present a similar pattern of microglial activation and migration upon experimental lesion of CNS. This activation is associated with the release of a large amount of extracellular vesicles (EVs). We collected EVs released by microglia primary culture and compared two different protocols of isolation: one with differential ultracentrifugation (UC) and one using an additional Optiprep™ Density Gradient (ODG) ultracentrifugation. Nanoparticles tracking analysis (NTA) and transmission electron microscopy (TEM) were used to assess vesicles size and morphology. The protein content of isolated EVs was assessed by mass spectrometry approaches. Results showed the presence of EV-specific proteins in both procedures. The extensive proteomic analysis of each single ODG fractions confirmed the efficiency of this protocol in limiting the presence of co-isolated proteins aggregates and other membranous particles during vesicles isolation. The present study permitted for the first time the characterisation of microglial EV protein content in an annelid model. Interestingly, an important amount of proteins found in leech vesicles was previously described in EV-specific databases. Finally, purified EVs were assessed for neurotrophic activity and promote neurites outgrowth on primary cultured neurons.
Introduction
Long time considered as waste products released by the cells, in which the unnecessary material can be discarded, extracellular vesicles (EVs) are getting now a worldwide interest [Citation1]. EVs are lipid bilayered membrane vesicles with a diameter range between 30 and 1000 nm, described as critical messengers for cell-to-cell communication [Citation2]. Their capacity to transfer information and thereby to affect the functions of the recipient cell, either in physiological or in pathological ways, are now assessed [Citation3]. EVs are investigated in several disciplines including neurobiology [Citation4,Citation5], neuroimmunology [Citation6,Citation7], oncology [Citation8] and nanotechnology [Citation9]. They also get an arouse interest in clinic for their potential uses as biomarkers [Citation10,Citation11]. Their contents, generally indicated as “cargo”, are multiple and biologically active [Citation12]. Indeed, EVs carry proteins [Citation13,Citation14], lipids [Citation15–Citation17] and nucleic acids including RNA [Citation18,Citation19] and DNA [Citation20,Citation21]. EVs are highly heterogeneous, differing in size but also in cell origin so that, in the past decades, authors tried to classify them using these criteria [Citation22]. Therefore, two main EV populations emerged: exosomes and ectosomes [Citation23]. Exosomes are 30–100 nm in diameter and are generated within the endosomal system as intraluminal vesicles and secreted by fusion of multivesicular bodies with cell membrane [Citation23]. In contrast, ectosomes, also known as microvesicles, are 50 nm to 1000 nm in diameter and result from the outward budding of cell membrane [Citation24]. Despite of their differences in size and origin, these two EV populations share common markers [Citation25,Citation26] and so far it is impossible to completely distinguish them. According to this high heterogeneity and because of the unstandardised nomenclature [Citation27], in the present study, the general acronym EVs will be used for EVs. The central nervous system (CNS) is a complex machinery in which cell-to-cell communication is essential to maintain homeostasis [Citation28]. Glial cells are implicated in a large panel of CNS functions including development and neuron maintenance. Recent reports indicate that EVs play a crucial role in this glia-neuron cross-talk [Citation6,Citation29,Citation30].
Among glial cells, microglia are described as the resident immune cells of the CNS [Citation31]. They are multitasking cells involved in various functions [Citation32] playing neuroprotective as well as neurotoxic roles [Citation33]. The presence of microglia exerting similar functions was described many years ago in different Protostomia like Molluscs, Arthropods [Citation34] and Annelids [Citation35].
Several studies reported the secretion of EVs by microglia cells [Citation36,Citation37]. Their protein content includes enzymes, chaperones, tetraspanins and membrane receptors, as previously described for B lymphocyte- and dendritic cell (DC)-derived exosomes [Citation38]. Upon ATP stimulation, microglia release EVs carrying interleukine (IL)-1ß and the IL-1ß-processing enzyme caspase-1 [Citation39]. EVs secreted by microglial cells were demonstrated to contain MHC-class II antigens following interferon gamma treatment [Citation38]. Taking together these studies showed that, depending on the stimulation, microglia produce EVs differing in content and function.
The leech Hirudo medicinalis is a well-known model in neuroscience due to its ability to naturally regenerate the CNS after injury and a valuable model to study microglia involvement in the regenerative mechanisms [Citation40]. Its CNS presents a large microglial cell population surrounding neurons in ganglia and their axonal extensions in connectives [Citation35,Citation41]. These cells express immune markers similar to the mammal ones [Citation42,Citation43]. Interestingly, this invertebrate model does not possess astrocytes or oligodendrocytes [Citation41].
Previous studies in our group showed that, upon injury, microglia were recruited to the lesion site suggesting a strong implication of these cells in repair mechanisms [Citation40,Citation42,Citation44]. This recruitment is associated with the secretion of an important amount of EVs, recently highlighted by immunohistochemistry [Citation45,Citation46]. In vitro, these vesicles rapidly adhere to the surface of both neuron bodies and growing neurites, suggesting a role in their outgrowth [Citation45].
In the present work, we isolated and characterised the EVs released by a primary culture of leech microglia. The amount and the size of particles were measured by nanoparticles tracking analysis (NTA) approach. Their morphology was investigated using transmission electron microscopy (TEM). EVs were purified by differential ultracentrifugation (UC) followed or not by an additional Optiprep™ Density Gradient (ODG) step. Vesicles purified with these two methods were submitted to liquid chromatography tandem mass spectrometry (LC-MS/MS) to address their proteomic contents. By combining all these approaches, we were able to establish an effective strategy to isolate microglial vesicles from our experimental model. Interestingly, this study constitutes to our knowledge the first proteomic analysis of all fractions issued from ODG protocol, and not only of those expected containing EVs. In addition, this work brings a new insight on microglia-released vesicles from an invertebrate model, confirming the presence of a conserved protein signature with mammalian EVs.
Materials and methods
Animals
The study was performed using the annelid leech Hirudo medicinalis, in accordance with the French legislation, the European Treaty and with the Helsinki Declaration regarding the use of this species in research. Leeches were purchased from Biopharm, (Hendy, UK). Adult leeches were maintained in artificial pond water for one week before use.
CNS dissection, neuron and microglial cell culture
Leeches (20 individuals) were anesthetised in ethanol 10% for 20 min at room temperature (RT). The CNS was dissected following a longitudinal section on the medioventral side. The freshly removed CNS were washed in sterile ringer buffer (115 mM sodium chloride, 1.8 mM calcium chloride, 4 mM potassium chloride and 10 mM TRIS maleate salt pH 7.4) and then bathed in phosphate buffer saline (PBS), supplemented with antibiotics (penicillin/streptomycin 10,000 U/ml and gentamycin 10 mg/ml) (Invitrogen Life Technologies, Carlsbad, USA). CNS were bathed three times in this solution at different dilutions rates 4X, 2X and 1X for 10 min at RT in each bath. In order to release the cellular content of the CNS, mechanic dissociation was performed using a small clamp and micro-scissors. This step was done in a 35 mm petri dish containing complete L-15 medium (Leibovitz’s L-15 medium, Invitrogen Life Technologies, Carlsbad, USA) supplemented with 2 mM L-glutamin, 100 UI/ml penicillin, 100 µg/ml streptomycin, 100 µg/ml gentamycin, 0,6% of glucose, 10 mM Hepes and 10% Exosome depleted Fetal Bovine Serum (Exo-FBS) (Ozyme, Saint-Quentin-en-Yvelines, France) (). Because of the difference in size between neurons (6–70 µm) and microglial cells (3–5 µm), filtration steps through sieving devices of different mesh sizes PluriSelect® (Leipzig, Germany) were done to separate the two cell populations. First, the dissociated tissue was filtered using 100-µm mesh sizes strainer in order to eliminate tissue debris. Then, the eluate was filtered through 20 and 6 µm strainers to recover small size neurons on the 6 µm sieve and the microglial cells in the flow through. In order to eliminate cell debris, complete L15 medium containing neurons and the dissociation medium were centrifuged at 1200 g for 10 min at 15°C. The neuronal pellet was resuspended in complete L-15 medium and placed in 4-wells Lab-Tek® chambered cover glass (Thermo Fisher Scientific, Waltham, MA, USA) coated with poly-D-lysine (Sigma-Aldrich, Saint Louis, MO, USA). The microglial cell pellet was resuspended in 5 ml of fresh complete L-15 medium, split in 500 µl aliquots and plated in 4-wells petri-dishes. Neurons or microglial cells were maintained for 20 or 4 days, respectively, in a humid environment at 15°C, conditions routinely used for leech primary cell cultures.
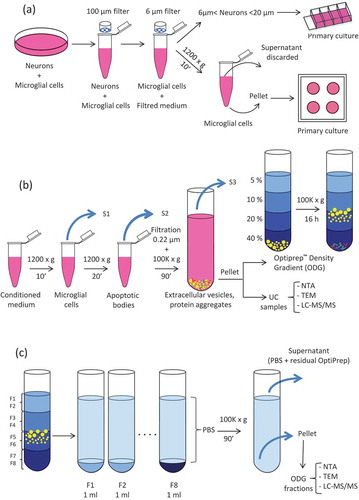
Figure 1. Extracellular Vesicles (EVs) collection and isolation strategies. (a) Leech CNS were dissected and mechanically dissociated. Microglia were separated from neurons by filtration and primary cultured. (b) Microglial cell and apoptotic bodies were removed from the conditioned medium by successive centrifugation steps. EVs were isolated from conditioned medium by differential ultracentrifugation (UC samples) or submitted to further density gradient ultracentrifugation step. (c) EVs were collected in different fractions after OptiprepTM density gradient separation (ODG fractions).
EV isolation
Centrifugation procedures for EVs isolation were performed at 4°C. Importantly, to limit degradation, isolated EVs were freshly processed without any frozen step. The content of each culture well was transferred into Eppendorf® 1.5 ml low binding tubes (Montesson, France) and centrifuged at 1200 g for 10 min to remove microglial cells (). The supernatants (S1) were transferred to fresh tubes and centrifuged at 1200 g for 20 min to eliminate apoptotic bodies. This step was followed by filtration through a 0.22 µm filter to eliminate large vesicles and some apoptotic bodies possibly remaining in the supernatant. In order to pellet the EVs, the supernatants (S2) from all samples were pooled and transferred into 10.4-ml polycarbonate bottle with Cap Assembly tubes (Beckman Coulter). The tubes were filled with PBS to a final volume of 9 ml, and samples were ultracentrifuged at 100,000 g for 90 min, 70.1 Ti rotor, k-factor 36, Beckman Coulter. Supernatants were removed (S3) and the EVs pellets (UC samples) were resuspended in 200 µl of PBS for either direct processing (NTA, TEM and liquid chromatography tandem mass spectrometry analyses) or submitted to a further purification step by Optiprep™ Density Gradient (ODG). Briefly, EVs were loaded at the bottom of a discontinuous gradient prepared by diluting in PBS, a stock solution of Optiprep™ (60% w/v iodixanol; Sigma Aldrich, Saint-Quentin Fallavier, France) as previously described [Citation47]. The gradients were prepared with 2 ml of Optiprep™ solutions 40%, 20%, 10% and 5% carefully layered in 14 ml polyallomer Beckman Coulter tubes. Samples were ultracentrifuged at 100,000 g (SW 40 Ti rotor, k-factor 137, Beckman Coulter) for 16h. ODG fractions of 1 ml each were collected from the top of the gradient and resuspended in 30 ml of PBS () for further 90 min of UC at 100,000 g (70.1 Ti, k-factor 36, Beckman Coulter). After supernatants (S4) removal, the pellets (ODG fractions) were resuspended in 30 µl of PBS and used for further analyses as indicated above for the UC samples.
Nanoparticle Tracking Analysis (NTA)
NTA was performed using a NanoSight NS300 instrument (Malvern Panalytical Ltd, Malvern, UK) with a 488 nm laser and automated syringe pump. The NTA 3.2 software was used to process the recorded movies. The script was adapted as follow: samples diluted 1:100 in PBS were loaded using an automated syringe pump. Speed setting was initially fixed to 1000 for sample loading and chamber filling and then decreased to 25 for videos recording. A delay of 15 s was set to stabilise the flow before acquisition. Video captions of 60 s were done in triplicate for each sample with a camera level setting at 14 and a detection threshold at 3. PBS used for EVs recovery was used for negative controls (UC experiments). As a control for ODG experiments, 200 µl of PBS were loaded at the bottom of the tube that was then processed exactly in the same conditions as the EVs-containing samples.
Transmission Electron Microscopy (TEM)
The observation of EVs by TEM was performed as previously described [Citation48]. Briefly, the isolated EVs were resuspended in 30 µl of 2% paraformaldehyde (PFA) in PBS. 3 × 10 µl of sample were deposited on Formvar-carbon-coated copper grids. The adsorption was performed for 3 × 20 min in a wet environment and then the grids were transferred into a drop of 1% glutaraldehyde in PBS for 5 min at RT. After several rinsing steps with ultrapure water, samples were contrasted for 10 or 15 min on ice with a mixture of 4% uranyl acetate and 2% methylcellulose (1:9, v/v). The excess of mixture was removed using Whatman filter paper. After drying, samples were observed under a JEOL JEM-2100 TEM at 200 kV. The acquisitions were made with Gatan Orius SC200D camera.
Proteomics analysis
Proteins extraction and in gel digestion
All experiments were done following three biological replicates. Purified EVs were resuspended in 30 µl of 50 mM bicarbonate buffer containing 4% SDS. Extracted proteins were loaded onto a 12% polyacrylamide gel for separation using a TGS solution (25 mM Tris, 192 mM Glycine and 0.1% SDS) as running buffer. Electrophoresis was performed at 70V for 15 min and then at 120 V for further 15 min. In order to fix proteins, the gel was stained with InstantBlue™ Coomassie protein stain solution (Expedeon, Cambridgeshire, UK) for 20 min. Each gel lane was excised and cut into small pieces of 1 mm3. Trypsin digestion was performed, as previously described by Lemand and colleagues [Citation49]. Basically, gel pieces were washed successively with 300 µl of the following solutions: Milli-Q® water for 15 min, acetonitrile (ACN) for 15 min, 100 mM NH4HCO3 pH 8 for 15 min, ACN/NH4HCO3 (1:1, v/v) for 15 min and ACN for 5 min. Reduction was performed with 100 µl of 100 mM NH4HCO3 pH 8 containing 10 mM DTT for 1 h at 56°C. The alkylation was performed with 100 µl of 100 mM NH4HCO3 pH 8 containing 50 mM iodoacetamide for 45 min in the dark at RT. Pieces were washed again with 300 µl of the following solutions 100 mM NH4HCO3 pH 8 for 15 min, ACN/NH4HCO3 (1:1, v/v) for 15 min and ACN for 5 min and then dried completely under vacuum. Proteins digestion was conducted overnight at 37°C with trypsin (Promega, Charbonnieres, France) 12.5 µg/ml in enough amount (≈ 50 µl) of 20 mM NH4HCO3 pH 8 to cover pieces. The digested proteins were then extracted from the gel by adding 50 µl of ACN for 20 min with a continuous stirring. The following two-steps extraction procedures were repeated two times: 50 µl of 5% trifluoroacetic acid (TFA) in 20 mM NH4HCO3 pH 8 solution and then 100 µl of ACN 100%. The digested proteins were completely dried under vacuum, reconstituted in 20 µl of a 0.1% TFA solution and finally desalted using C18 ZipTips (Millipore, Saint-Quentin-en-Yvelines, France). Briefly, ZipTips cones were washed by 100% ACN and equilibrated using 0.1% formic acid (FA) solution (Biosolve B.V.,Valkenswaard, The Netherlands). The peptides were linked to the C18 phase tips and washed with 0.1% FA solution. Finally, peptides were eluted in a fresh tube using ACN:FA 0.1% (80:20, v/v), dried completely under vacuum and recovered with 20 µl of ACN:FA 0.1% (2:98, v/v) for LC-MS/MS analysis.
Liquid chromatography tandem mass spectrometry (LC-MS/MS) analysis
For mass spectrometry analysis, samples were separated by online reversed-phase chromatography using a Thermo Scientific Proxeon Easy-nLC1000 system equipped with a Proxeon trap column (75 μm ID x 2 cm, 3 µm Thermo Scientific) and a C18 packed-tip column (Acclaim PepMap, 75 µm ID x 15 cm, Thermo Scientific). The digested peptides were separated using an increasing amount of ACN in 0.1% FA from 2 to 30% for 1 h at a flow rate of 300 nL/min. A voltage of 1.7 kV was applied by the liquid junction in order to electrospray the eluent using the nanospray source. A high resolution mass spectrometer Q-ExactiveTM Thermo ScientificTM was coupled to the chromatography system to acquire in data dependent mode defined to analyse the 10 most intense ions of MS analysis (Top 10). The MS analyses were performed in positive mode at resolving power of 70,000 FWHM (at m/z 400), using an automatic gain control target of 3e6. The default charge state was set at 2 and a maximum injection time at 120 ms. For full scan MS, the scan range was set between m/z 300 and 1600. For ddMS2, the scan range was between m/z 200 and 2000, 1 microscan was acquired at 17,500 FWHM, an AGC was set at 5e4 ions and an isolation window of m/z 4.0 was used.
Hirudo medicinalis database
Because of the lack in data regarding leech model, we built a homemade database of putative Hirudo proteins. This database is composed of 22,010 translated CDSs from a draft Hirudo genome [Citation50] satisfying the following property: each predicted proteins have an orthologue in the Swissprot database and a human orthologue in Uniprot. Swissprot [Citation51] is a manually checked protein database, making it a high-confident resource to annotate translated CDSs. It is a subset of Uniprot, which is more likely to contain erroneous sequences, but has a wider coverage. Orthology in Swissprot (release_2017-01) was established through BlastP alignments (version 2.6.0+, command line with default parameters, E-value threshold 0.1, best match) [Citation52]. We then used the API Rest Uniprot tool [Citation53] to find human orthologues in Uniprot (release_2017-10), a necessary step for the need of DAVID proteomic software (version 6.8), in which it is crucial to choose only one species during analysis.
Raw data analysis
All the MS data were processed with MaxQuant [Citation54] version 1.5.1.2 using the Andromeda [Citation55] search engine. Proteins were identified by searching mass spectrometry data against the H. medicinalis database described above, combined with 262 commonly detected contaminants. Trypsin specificity was used for the digestion, with up to two missed cleavages. N-terminal acetylation and methionine oxidation were selected as the variable modifications. Carbarmidomethylation of cysteines was set as fixed modification. For MS spectra, an initial mass accuracy of 6 ppm was selected, and the MS/MS tolerance was set to 20 ppm for higher energy collisional dissociation data. For identification, the false discovery rate at the peptide spectrum matches and protein level was set to 1%. A minimum of two peptides of which one unique were defined. The label-free quantifications were realised keeping the default parameters of MaxQuant. The identified proteins were processed by Perseus software [Citation56] (version 1.6.0.7). Three filters were applied (potential contaminant, reverse and only identified by site) on the whole protein matrix. Then, sample groups were defined and Venn diagrams were generated. The protein lists obtained were treated using DAVID proteomic to assess gene ontology (GO) analysis by keeping the default parameters provide by the software. FunRich, a software tool used for functional enrichment and interaction network analysis tool, was used to establish the interactome of selected proteins characterised from ODG fractions.
Neurite outgrowth assays
The CNS of 20 individuals leeches of the same stage of development were dissected, microglia and neurons were separately collected as described above. Neurones were pooled in a homogeneous cell preparation to avoid individual polymorphism and in order to carry out a single, statistically relevant experiment. Neurons were evenly plated in 4-well Labtech culture chambers and were primarily cultured. After 6 days of culture, neurons were exposed to 106 EVs/well from ODG EV-rich fractions (F4 to F6) issued from microglia isolated from the same individuals or to complete L-15 medium for negative control. Medium renewal, with or without EVs, was done every 4 days. Image acquisition on living cells was realised with a microscopy station Nikon Eclipse Ti2 (Nikon, Minato, Tokyo, Japan). This station, equipped with a perfect focus system, which automatically rectifies focus control for drift, is adapted for real time analysis. Images acquisitions were realised at days 6 and 20 of culture to quantify neurites outgrowth in EVs-stimulated vs. control neurons. Each well was totally scanned and a mosaic image was created for each condition. Manual measurement of the length of neurites was performed using ImageJ software only for individual neurons presenting neurites at both 6 and 20 days of culture. Measurements were done for each neuron, independently from the others, and are expressed as a percentage of growth compared to the first day of EVs exposure (= T6days), calculated as follow: [Percentage of growth = ((measure at 20 days*100)/measure at 6 days)/100]. They were then analysed with GraphPad software using a statistic “unpaired t test”.
Results
Strategy overview
The aim of the study is to compare the efficiency of simple UC vs. density gradient EV isolation methods. To identify the proteome of EVs isolated from leech microglial cells, we considered different complementary experiments as described in . Microglia were isolated from freshly dissected leech CNS: after nerve tissue mechanical dissociation, neurons and microglia were separated by filtration. Microglial cells were collected, cleaned by centrifugation, resuspended in fresh medium and cultured for four days to leave them recover and release EVs. Conditioned media from these primary cell cultures were collected, and EVs were isolated by differential UC (). The pellet obtained after this first ultracentrifugation step, from now onwards named UC, was either directly analysed for proteomic content, or loaded on a discontinuous (5%, 10%, 20% and 40%) Optiprep™ Density Gradient (). Eight samples were collected from the top of the gradient and will be forward named ODG fractions, numbered from F1 to F8 (). In both UC and ODG samples, the particle number was assessed using nanoparticle tracking analysis (NTA) technology. The morphology of EVs was checked using TEM and the proteomic content was investigated using liquid chromatography-tandem mass spectrometry (LC-MS/MS).
Extracellular Vesicles (EVs) quantification and morphological analysis
The particle number from both UC sample and ODG fractions was established by NTA using Nanosight instrument (). PBS was used as a control for UC samples. For ODG samples, controls were performed loading PBS, instead of EV pellet, at the bottom of the discontinuous OptiprepTM gradient.
Figure 2. Nanoparticle Tracking Analysis (NTA) on microglial EVs. (a) Particles from UC samples (red dots) were quantified. Vehicle PBS (black triangles) was used as negative control. (b) Particles counting in ODG fractions F1 to F8 for each replicates (blue, red, and yellow dots) were compared to OptiprepTM gradient fractions processed in the same way as control (black triangles). Each circle or triangle represents an individual count. Green and grey bars indicate the average for EVs or control fractions, respectively.
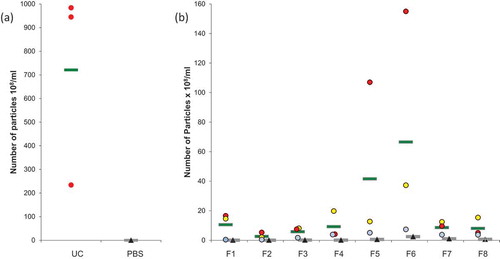
Results showed an average of 7.21 × 10¹⁰ particles per ml in UC samples (), PBS controls revealed a negligible amount of particles (0.05x10⁸/ml). The average of counted particles from single ODG fractions is here reported (). An important amount of particles (10.54x10⁸ particles/ml) was observed in F1. A smaller quantity, 2.61 × 10⁸ particles/ml and 5.79 × 10⁸ particles/ml, were detected in F2 and F3, respectively. The amount of particles increased in the following fractions: F4 and F5 showed 9.27 × 10⁸ and 41.60 × 10⁸ particles/ml, respectively, the highest amount was observed in F6 (66.56x10⁸ particles/ml). A comparable level to F4 and F5 was detected in F7 (8.62x10⁸ particles/ml) and F8 (8.05x10⁸ particles/ml). The amount of particles detected in UC samples was at least 10-fold higher than that measured for ODG fractions. In all the ODG control fractions, the number of particles remained very low in comparison with the corresponding samples. Taken together, these data confirm that particles detected by NTA do not derive from the control solutions (PBS and Optiprep™) but from the microglial conditioned media.
To assess the morphology of leech microglial EVs, TEM analyses were performed and negative staining protocol was applied on vesicles isolated with the two methods, UC and ODG (). Single ODG fractions were assessed for extracellular vesicles presence. EVs were mostly detected in F4, F5 and F6 (). The EVs isolated by UC or Optiprep™ gradient showed very heterogeneous diameters ranking from 50 nm to 200 nm, some of them reaching 500 nm. Interestingly, TEM captures highlight dispersion on ODG samples where some EVs appeared more electron-dense than others (arrow). Morphologically, EVs stay mostly spherical in ODG fractions and appear as flattened spheres in UC samples (). In the UC samples, the presence of small spherical structures in the background was detected (arrow heads). In both protocols, EVs occasionally appeared as aggregates, which make the appreciation of morphology, size and enumeration quite difficult ().
Figure 3. Transmission Electron Microscopy of EVs. (a) Morphology of OptiprepTM density gradient isolated EVs. Some vesicles are more electron-dense (arrow). (b) EVs purified by simple ultracentrifugation appear flattened. A layer of globular lipids was noticed in the background (arrow heads). (c) EVs aggregates were observed independently of the isolation protocols used.
EV proteomic characterisation and gene ontology analysis
To establish the benefit of using an additional ultracentrifugation step with ODG for the EVs isolation, we analysed by LC-MS/MS both UC samples and all ODG fractions. Raw data analysis by MaxQuant software on UC samples permitted the identification of 354 proteins issued from the Hirudo database. The same approach performed on ODG fractions showed an important increase in their number with a total of 776 proteins identified ().
Figure 4. Venn’s diagrams of unique and shared proteins identified in UC and ODG samples. (a) Comparison between UC, ODG EV-rich (F4, F5, F6) and ODG EV-poor (F1, F2, F3, F7, F8) fractions. (b) Number of proteins identified in ODG EV-rich fraction F4, F5 and F6. (c) Unique and shared proteins identified in ODG EV-poor fractions F1, F2, F3, F7 and F8. (d) Proteins overlap between fractions (F3, F7) physically close to the EV-rich ones (F4 and F6).
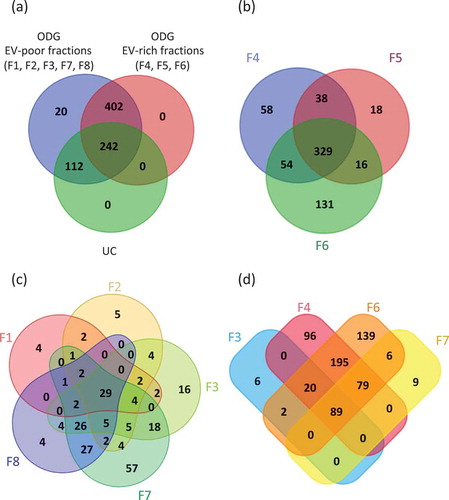
Interestingly, most of proteins belong to F4, F5 and F6 (EV-rich fractions) containing 479, 401 and 530 proteins, respectively, over biological triplicate (). Totally, 329 proteins were common in these three samples while 38, 54 and 16 proteins overlapped between F4-F5, F4-F6 and F5-F6, respectively. In addition, 58, 18 and 131 proteins were specific to fraction F4, F5 and F6, respectively. As expected, the high amount of proteins in these fractions is consistent with the prediction of EVs accumulation at this classically assigned density gradient range [Citation57].
A total number of 513 proteins were identified in fractions 1, 2, 3, 7 and 8 (EV-poor fractions). Among them, 49, 65, 102 proteins were identified in F1, F2 and F8, respectively (). These proteins principally correspond to several cellular components including nucleus, cytosol and cytoplasm (histones family members, apolipoproteins, caspases, actin, tubulin and calcium/calmodulin dependent protein kinase II family members). A higher number of proteins were found in F3 and F7, with 117 and 183 proteins identified, respectively (Supplementary Table S1). Results showed that 89 proteins overlap between F3, F4, F6 and F7 (). Moreover, 109 proteins are common to F3 and F4 and 174 to F6 and F7. Only six are exclusives to F3 and nine to F7. Supplementary Table S1 indicates the number of peptides identified as well as the percentage of coverage for each protein in the different replicates.
The protein identified in leech EVs were compared qualitatively in both ODG fractions and UC to top 100 proteins described in ExoCarta, a web-based compendium of exosomal cargo [Citation58]. From UC samples, 29 proteins were found in this top 100 list (), none of them were exclusive to UC sample but all of them were detected in F4, F5 or F6. Considering all the ODG fractions, 64 proteins were identified among the top 100 list, 62 of which were detected at least one time in F4, F5 or F6. Moreover, 13 were present simultaneously in fractions F4, F5 and F6 (e.g. flotillin 1, filamin A and 14-3-3 protein epsilon) and nine were detected at the same time in two of these fractions (e.g. 14-3-3 protein zeta/delta, moesin and Ras-related protein Rab-7a). Interestingly, five typical EV proteins were exclusively found in F6 (e.g. heat shock 70 kDa protein 1A, myosin 9, tubulin alpha-1C chain, ezrin, 14-3-3 protein gamma). The Alpha-2-macroglobulin and the T-complex protein A subunit epsilon were the only vesicular proteins specifically detected in fraction F1 and F7, respectively. Finally, nine proteins of the top 100 list were identified in all ODG fractions (e.g. Actin, GAPDH, HSPA8 and Annexin A2). These results strongly suggest that an additional step using an ODG ultracentrifugation significantly increase the yield in proteins related to EVs which seems to be mostly present in fractions 4, 5 and 6.
Table 1. EVs proteins recovered from UC samples and ODG fractions (F1 to F8) compared with top 100 proteins from ExoCarta website. Proteins were ranked according to their abundancy of identification in exocarta. Protein IDs and gene names are reported. In bold: proteins found at least one time in EVs issued from leech microglia. Underlined in red: proteins from ODG EV-rich fractions, which are reported in Exocarta as microglial proteins.
The subcellular localisation and GO terms of both UC samples and ODG EV-rich fractions (F4, F5 and F6) were investigated by DAVID software. The percentages of coverage for each term linked to EVs () and the p-value at which it was detected were lower in UC vs. ODG EV-rich fractions (Supplementary Table S2 and S3). For example, looking at “Extracellular exosomes” term, 57.1% of the recorded genes were classified as part of this component for UC samples against 62.4% genes for ODG EV-rich fractions. In addition, the p-value for this term was 3.8e−53 for UC samples, while it was more confident for ODG reaching 4.9e−158. On the other hand, signatures related to contaminants term like mitochondria, Golgi Apparatus (GA) and Reticulum Endoplasmic Lumen (RE-L) were mostly observed in UC samples. In particular, mitochondrial inner membrane term coverage was 15.9% in UC samples while it was only 7.5% in ODG. Concerning GA and RE-L, these GO terms were exclusively detected in UC pellet with 7.3% and 2.9% of coverage, respectively.
Figure 5. Gene Ontology (GO) analysis of EVs. Comparison between UC and ODG samples in term of number of genes identified for different GO terms.
EVs assays on neurites outgrowth
The technique used for nerve cell dissociation entails the mechanical disruption of dissected leech nerve cords and the passage of the tissue through a series of strainers. The different giant glial cells present in the CNS are destroyed during the dissociation step. Since either astrocytes or oligodendrocytes are not present in leech CNS [Citation41], the only remaining cells after the treatment are isolated small neurons and microglia. In addition, these cells are centrifuged at lower speed to discard potential remaining cell debris; it permits to ascertain the purity of obtained microglia and neurons primary cultures.
Leech microglial EVs from ODG EV-rich fractions were added to primary neuron cultures in order to test their ability to promote neurites outgrowth. Negative control was performed using neurons cultured in complete medium alone. Results after 14 days showed a significant difference (p-value of 0.0029) on neurons cultured in presence of EVs (n = 37) where the percentages of outgrowth were higher (average 21,30%) compared to the control (n = 38) (average 5,99%) (). Examples of neurite outgrowth after 6 and 20 days of culture without (Control) or in presence of EVs are shown in and )
Figure 6. In vitro assays for EVs neurotrophic activity assessment of ODG purified EVs. (a) Outgrowth measurements of leech neurons exposed for 14 days to complete medium (Control, n = 38) or to vesicles from ODG EV-rich fractions (n = 37). Each open circle represents the percentage of neurite outgrowth from individual neurons. Bars indicate the average values for each series of measurements. A significant difference was observed between the two conditions with a p-value of 0.0029. (b) and (c) pictures display an example of neurite outrgrowth recorded for the same neurone at 6 and 20 days of culture with L15 medium alone (Control) or containing 106 EVs/well (ODG EV-rich fractions). Scale bars correspond to 20 µm.
Discussion
In the last decade, an exponential growing publication rate in the field of EVs was reported. The International Society for Extracellular Vesicles (ISEV) is working to improve different aspects of the field, including the purification, the nomenclature and the applications of EVs, as recently reported by the ISEV position papers [Citation25,Citation59].
In any case, for functional effects, cargo (proteins, lipids, nucleic acids) characterisation or further downstream experiments, it is crucial to get pure EVs, meaning a minimal co-pelleted contamination such as organelle membranes or protein aggregates [Citation60]. Several studies were done comparing EV isolation methods including UC, density gradient, size exclusion chromatography and immunoaffinity purification [Citation61,Citation62]. Studies on EV protein content are essentially focused on the EV-rich fractions. For the first time, we present here an exhaustive mass spectrometry proteomic study on all EV fractions produced by leech microglial cells. We compared UC and OptiprepTM density gradient (ODG), two commonly used methods for particles yield, morphology and protein content of EVs. All experiments were done on vesicles released by leech microglial cell primary cultures. Results show that both methods lead to EV isolation, as highlighted by TEM (). Nevertheless, by mass spectrometry approaches, we confirmed that ODG permits to obtain the purest EV preparations ( and ). Taking together, these results permitted to establish (i) the presence of EVs in microglia from an annelid model and (ii) their strong similarities to mammalian ones (), according to the comparison against ExoCarta databases [Citation58].
Nanoparticle tracking analysis was performed on EVs purified by differential UC and ODG fractions (). NTA results showed the presence of particles in both UC samples and ODG fractions. As expected, the number of particles was higher in UC samples due to the less stringent purification protocol compared to ODG fractionation. We also noticed variations in particles quantification and standard deviation values for many fractions, caused by the lack in a precise estimation of the microglial cells number used for each replicate, linked to the experimental constraints of the model (). The small size of cultured leech microglia (≤ 5 µm) makes difficult cell counting and the estimation of their viability by conventional trypan blue staining. Therefore, we used the number of dissected nerve chains as a normalisation factor between the three biological replicates instead of the number of viable microglial cells.
To see whether the counted particles were EVs or contaminants, and because the NTA technology does not make any difference between EVs and protein aggregates, all samples were analysed by TEM and by liquid chromatography tandem mass spectrometry (LC-MS/MS). TEM observations confirmed the presence of EVs in UC pellet and mainly in F4, F5 and F6 ODG fractions (). In both cases, due to the 0.22 µm fast filtration step before the 100,000 g ultracentrifugation, large vesicles over 500 nm diameter were not detected. The size range of isolated vesicles appeared quite large (50–500 nm), confirming that the experimental protocols here applied do not permit to separate EVs by size (). Some EVs appeared more electron-dense than others, meaning that the quality and quantity of the cargo are not the same for all EVs, reflecting the heterogeneity of vesicles populations (arrow). We noticed in UC samples the presence of a faint non-specific background noise (arrow heads). These granulations would result by a higher amount of lipids globules like HDL, having a partial overlapping density with the EVs and for this reason partially discarded by ODG ultracentrifugation [Citation63].
TEM analyses revealed either in UC or in ODG fractions, the presence of aggregated vesicles (). The presence of such aggregates in ODG fractions may be simply consequent to the ultracentrifugation steps promoting these accumulations. Indeed, they were also detected by NTA as large particles, inducing an under estimation in vesicles number. These gathers could become problematic for functional assays or for drug delivery approaches, in term of amount EVs normalisation and reproducibility.
LC-MS/MS analyses confirmed the presence of EVs in UC samples and in density gradient fractions. Despite the lower number of particles detected in ODG fractions compared to UC pellet, the quantity of protein identified in these samples was significantly higher. MS analyses were obtained in data-dependent acquisition (DDA) meaning that only the most 10 intense ions were selected and fragmented to obtain MS/MS data and used for protein identification. Proteins like albumin, keratin, and those coming for the Golgi and reticulum are present in higher amount in UC samples and then are preferentially identified. Consequently, only the major proteins in the samples were detected, which could explain the lack of detection of several specific EVs proteins and the identification of a smaller number of proteins in UC samples compared to ODG fractions. Furthermore, the additional purification steps by density gradient allowed the separation of EVs from potential protein contaminants based on their flotation properties. More EV-specific proteins of interest are so selected for fragmentation and then identified by MaxQuant processing. Indeed, fractionation is one of the recommended protocols in mass spectrometry analyses to increase the detection rate in DDA [Citation64].
We identified 354 proteins in UC sample, 242 of which overlapping with the ODG EV-rich fractions F4 to F6. Between the 112 UC-specific proteins, we did not detect well-known molecules associated with the EVs. These proteins belong to several cellular component including nucleus, cytosol and cytoplasm (histones family members, apolipoproteins, caspases, actin, tubulin and calcium/calmodulin dependent protein kinase II family members, NADH subunits, cytochrome C1…). Notably, after the density gradient treatment of the EV pellet these proteins spread in ODG EV-poor fractions F1, F2, F3, F7 and F8 (). However, the presence of few subtypes of EVs outside of F4, F5 or F6 cannot be excluded e.g. in the lightest fraction F1 or alternatively in the densest fraction F8. Our methods to enrich these subtypes should be adapted in order to recover and characterise enough EVs to test their potential activity [Citation65]. These data confirm the interest of the ODG protocol in removing EVs protein contaminants. NTA observations and MS analyses indicated that differential UC did not selectively enrich the sample for EVs proteins but also induced co-isolation of contaminating factors. Some proteins (e.g. actin, GAPDH, HSP family proteins) from the ExoCarta top100 list () were identified in all the ODG fractions (F1 to F8). However, these molecules are not strictly EV-specific but may belong to other cellular components and could be involved in different cellular processes/pathways. This is why to assess strictly the presence of EV markers further studies should be performed to establish their precise cellular topology [Citation26].
Mass spectrometry analysis permitted the identification of 644 proteins in the ODG EV-rich fractions F4, F5 and F6 observed by TEM (). The quantity of protein detected was correlated to the higher number of particles counted by NTA in these fractions (). In addition, we observed a considerable enhancement of EV protein signatures highlighted by the comparison with the top 100 proteins described in ExoCarta [Citation58]. Several EV-specific proteins were detected in fractions F3 an F7, physically close to the EV-rich ones (). EVs are not supposed to be present at the theoretical density of these fractions, 1.078 g/ml and 1.223 g/ml, respectively [Citation57]. The presence of this vesicular signature can be explained by the experimental procedure leading to a partial contamination between gradient layers during fractions collection. Tetraspanins 1, 7 and 11 were also detected in some of the enriched fractions (Supplementary Table S1). In contrast, some markers largely described in EVs like tetraspanins CD9 or CD63 or CD81 were not detected in our proteomic analyses. This can be explained by the fact that the DDA approach permits the detection of the 10 more intense ions, suggesting that these molecules may be present but not detectable regarding their abundance. To assess the presence of these tetraspanins and other markers like Alix or Hsp70 in leech microglia EVs, we performed immunoblot analyses (data not shown). The negative results obtained may be explained either by the low amount of microglial vesicles positive for these markers or by the fact that the leech epitopes are structurally different from their human or rodents homologs and are not recognised by the commercial antibodies tested.
This lack of recognition precludes us from using the commercial purification kits for EVs. This immunoprecipitation approach would not be efficient since leech microglia EVs may harbour specific tetraspanins. Interestingly, local blast for some of these markers in the homemade Hirudo database gave positive results, confirming the presence of these genes in leech (Supplementary Figure S1). In another hand, the proteomic analysis in the present work was sufficiently powerful to allow the characterisation of molecules impossible to detect with other conventional tools currently available.
Results here reported, demonstrate that in leech microglia-released EVs are present many of the markers generally described for mammalian vesicles. The absence of microglia-specific proteins [Citation66] in our data (e.g. Iba1) can be explained by the fact that we focused our attention on EVs content and not on whole cell content. We identified molecules belonging to the conventional EVs cartography [Citation64] like transmembrane (tetraspanins family, integrins), intracellular (Rab proteins), membrane trafficking (flotillin, annexin, Rho), associated to multivesicular bodies (Clathrin, ubiquitin), chaperon (Hsp family members), signalling (Arf1, EGFR, CDC42, ß catenin, 14-3-3 family), enzyme (GAPDH, Enolase, ATPase) and cytoskeletal (actin, moesin, keratins) proteins.
According to ExoCarta, mammalian microglia EVs contain 50 proteins belonging to the Top-100 list. Indeed, an EV microglial specific signature was not so far evidenced in mammals, indicating that microglial EVs appear as “classical” vesicles [Citation7]. In ODG EV-rich fractions, we identified 539 proteins, 13 of which, underlined in , are common with the mammalian microglial EVs reported by ExoCarta. This result confirmed the presence of microglial EVs components in leech but, as observed for mammals, our study did not permit to identify the possible presence of EVs microglia-specific markers. However, we identified in leech EVs gliarin, a glial and microglial-specific intermediate filament protein [Citation67], and neurohemerythrin, a neuroimmune factor [Citation68], demonstrating that these vesicles contain leech neuro-specific markers. In addition, the proteomic analysis revealed the presence in leech EVs of neuronal proteins like BDNF receptor (NTRK2 or TrkB), and NCAM (e.g. fasciclin,), known to be involved in neurite outgrowth. Microglial BDNF, in particular, is considered to mediate neuropathic pain in mammals in contrast with the neuronal one that is required for inflammatory pain [Citation69]. Its receptor TrkB is involved in development and maturation of nervous system through neuron survival, proliferation and homeostasis in general. We did not detect BDNF in leech microglial EVs, but only its receptor NTRK2. It let suppose that also in our experimental model, through EV-release, microglia is involved in BDNF/TrkB signalling pathway and in microglia-neuron crosstalk. This hypothesis is supported by the presence of a gene homologous to human BDNF in a gene bank issued from leech nervous system (Supplementary Figure S1). In addition, the presence of prosaposin in rat [Citation70] and leech microglial EVs indicates the existence of shared neurotrophic functions linked to vesicles release. Recent studies were performed on proteomic characterisation of EVs from mouse [Citation71] and rat [Citation70] microglia primary cultures. Some molecules characterised in these works were also evidenced in leech EVs, nevertheless most of them are associated with cytoskeleton (Actin, Tubulin, Vimentin), immune response or regulation of inflammatory processes (Galectin-3, C3, Lysozyme, GAPDH, alarmins) or other metabolic pathways (ATP synthase, Elongation factor 1-gamma, MVP). The experimental conditions applied to this study (ATP or LPS stimulation of microglia, EVs isolation techniques) make difficult a strict comparison with leech data.
Gene ontology analyses confirmed the presence of EV-related GO term in UC samples and in ODG fractions. Nevertheless, the number of recorded genes and p-values were higher in density gradient purified samples. These data consolidate the higher efficiency of ODG treatment for EVs purification compared to simple UC ().
The analyses of some proteins selected from ODG EV-rich fractions by FunRich software permitted to design a map of the interactome network associated to these proteins (Supplementary Figure S2). Several pathways associated to nervous system were selected and many proteins were identified (), suggesting that leech EVs cargo, similarly to the mammal one, is involved in several metabolic processes like axon guidance, neurite outgrowth, nerve cells homeostasis or neuron-microglia crosstalk.
Table 2. Nerve cell metabolic pathways from the interactome map designed by FunRich software. Genes, names and IDs of proteins identified or not detected from EVs proteomic analyses are reported in black and red, respectively.
Taken together, these data suggest a general conservation of leech EVs in term of protein content and, more specifically, their potential involvement in events associated to nerve repair.
To assess the potential neurotrophic effect of microglial EVs, we performed in vitro assays on leech neurons. The growth level observed for leech neurons in primary culture is consistent with that described by Chiquet and Nicholls (1987) for this model [Citation72]. Results showed that EVs exert a significant neurotrophic effect on neurite outgrowth compared to controls (). These assays were performed with ODG-purified vesicles but not with those obtained from UC samples. This choice is linked to the fact that, as indicated above, UC samples contain a certain number of contaminant proteins that might interfere with neurite outgrowth.
Conclusion
Through two different isolation techniques and an exhaustive proteomic study, we characterised the protein content of leech microglial EVs. Data here presented suggest the conservation of many EVs cargo proteins throughout evolution. We demonstrated that ODG allowed the elimination of contaminants and enhanced the quality of EVs analysis. This strategy, when possible, should be applied for any “omics” analysis methods as EVs are cleared out of major contaminants. This optimisation of EVs isolation and purification is a crucial step for further studies and perform new functional assays to establish their role in neuron-microglia crosstalk during neuroinflammation and neuroregenerative processes [Citation73]. We already demonstrated that the activated microglia sub-populations are recruited to the lesion site in leech CNS [Citation74]. Further studies will be developed to evaluate if, during this recruitment, different EV populations with specific targeting and content are chronologically produced at the lesion.
Author’s contributions
Conceived and designed the experiments: TA, CL, JV and PES. Leech dissection: TA, ARR, QL and CVC. Proteomic sampling and NTA measurement: TA. Leech databases annotation: IG, HT. Proteomic data analyses TA and SA. Electron microscopy: ASL and CS. Funding and mass spectrometry facilities: MS and IF. Manuscript redaction: TA, JV and PES. Manuscript editing: TA, FLM, CL, FD, JV and PES. All authors have given approval to the final version of the manuscript.
Supplemental Material
Download Zip (865.9 KB)Acknowledgments
TA received a PhD grant from the French Research Minister delivered by Lille University for three years. Authors would like to thank specially Dr Morvane Colin, Dr Etienne Audinat and Dr Guillaume van Niel for their precious advices, Loic Brunet for TEM observation. The TEM observations were performed on a device of the BICeL-Campus CS core facility acquired through a funding from the Agence Nationale de la Recherche, ANR (10-EQPX-04-01). The Bilille platform is affiliated to the French Institute for Bioinformatics and France Genomique. BlastP computations were performed on the HPC cloud of Bilille, supported by University of Lille.
Disclosure statement
No potential conflict of interest was reported by the authors.
Supplementary material
Supplemental data for this article can be accessed here
Additional information
Funding
Related Research Data
References
- Rashed MH, Bayraktar E, Helal GK, et al. Exosomes: from garbage bins to promising therapeutic targets. Int J Mol Sci. 2017;18:538.
- Tkach M, Théry C. Leading edge review communication by extracellular vesicles: where we are and where we need to go. Cell. 2016;164:1226–18.
- Yuana Y, Sturk A, Nieuwland R. Extracellular vesicles in physiological and pathological conditions. Blood Rev. 2013;27:31–39.
- Pegtel DM, Peferoen L, Amor S. Extracellular vesicles as modulators of cell-to-cell communication in the healthy and diseased brain. Philos Trans R Soc B Biol Sci. 2014;369.
- Rajendran L, Bali J, Barr MM, et al. Emerging roles of extracellular vesicles in the nervous system. J Neurosci. 2014;34:15482–15489.
- Frühbeis C, Fröhlich D, Kuo WP, et al. Extracellular vesicles as mediators of neuron-glia communication. Front Cell Neurosci. 2013;7:182.
- Paolicelli RC, Bergamini G, Rajendran L. Cell-to-cell Communication by Extracellular Vesicles: focus on Microglia. Neuroscience. 2018; https://doi.org/10.1016/j.neuroscience.2018.04.003. PMID: 29660443.
- Nanou A, Coumans FAW, Van Dalum G, et al. Circulating tumor cells, tumor-derived extracellular vesicles and plasma cytokeratins in castration-resistant prostate cancer patients. Oncotarget. 2018;9:19283–19293.
- Pi F, Binzel DW, Jin Lee T, et al. Nanoparticle orientation to control RNA loading and ligand display on extracellular vesicles for cancer regression. Nat Nanotechnol. 2018;13:82–89.
- Lener T, Gimona M, Aigner L, et al. Applying extracellular vesicles based therapeutics in clinical trials - An ISEV position paper. J Extracell Vesicles. 2015;4:1–31.
- Van der Pol E, El. ANB, Gool RN. Recent developments in the nomenclature, presence, isolation, detection and clinical impact of extracellular vesicles. J Thromb Haemost. 2016;14:48–56.
- Yáñez-Mó M, Siljander PRM, Andreu Z, et al. Biological properties of extracellular vesicles and their physiological functions. J Extracell Vesicles. 2015;4:1–60.
- Kowal J, Arras G, Colombo M, et al. Proteomic comparison defines novel markers to characterize heterogeneous populations of extracellular vesicle subtypes. Proc Natl Acad Sci. 2016;113:E968–77.
- Anderson JD, Johansson HJ, Graham CS, et al. comprehensive proteomic analysis of mesenchymal stem cell exosomes reveals modulation of angiogneesis via NFkB signaling. Stem Cell Technol Epigenetics, Genomics, Proteomics Metabonomics. 2016;601–613.
- Vallejo MC, Nakayasu ES, Longo LVG, et al. Lipidomic analysis of extracellular vesicles from the pathogenic phase of Paracoccidioides brasiliensis. PLoS One. 2012;7:e39463.
- Haraszti RA, Didiot MC, Sapp E, et al. High-resolution proteomic and lipidomic analysis of exosomes and microvesicles from different cell sources. J Extracell Vesicles. 2016;5:32570.
- Kreimer S, Belov AM, Ghiran I, et al. Mass-spectrometry-based molecular characterization of extracellular vesicles: lipidomics and proteomics. J Proteome Res. 2015;14:2367–2384.
- Nolte’T Hoen ENM, Buermans HPJ, Waasdorp M, et al. Deep sequencing of RNA from immune cell-derived vesicles uncovers the selective incorporation of small non-coding RNA biotypes with potential regulatory functions. Nucleic Acids Res. 2012;40:9272–9285.
- Valadi H, Ekström K, Bossios A, et al. Exosome-mediated transfer of mRNAs and microRNAs is a novel mechanism of genetic exchange between cells. Nat Cell Biol. 2007;9:654–659.
- Kumar Thakur B, Zhang H, Becker A, et al. Exosomes carry double-stranded DNA 766 Double-stranded DNA in exosomes: a novel biomarker in cancer detection. Nat Publ Gr. 2014;24:766–769.
- Kahlert C, Melo SA, Protopopov A, et al. Identification of double- stranded genomic dna spanning all chromosomes with mutated KRAS and p53 DNA in the serum exosomes of patients with pancreatic cancer. J Biol Chem. 2014;289:3869–3875.
- van Niel G, D’Angelo G, Raposo G. Shedding light on the cell biology of extracellular vesicles. Nat Rev Mol Cell Biol. 2018;19:213–228.
- Cocucci E, Meldolesi J. Ectosomes and exosomes: shedding the confusion between extracellular vesicles. Trends Cell Biol. 2015;25:364–372.
- Raposo G, Stoorvogel W. Extracellular vesicles: exosomes, microvesicles, and friends. J Cell Biol. 2013;200:373–383.
- Lötvall J, Hill AF, Hochberg F, et al. Minimal experimental requirements for definition of extracellular vesicles and their functions: A position statement from the international society for extracellular vesicles. J Extracell Vesicles. 2014;3:26913.
- Cvjetkovic A, Jang SC, Konečná B, et al. Detailed analysis of protein topology of extracellular vesicles-evidence of unconventional membrane protein orientation. Sci Rep. 2016;6:36338.
- Simpson R J, Mathivanan S. Extracellular microvesicles: the need for internationally recognised nomenclature and stringent purification criteria. J Proteomics Bioinform. 2012;05:ii–ii.
- Domingues HS, Portugal CC, Socodato R, et al. Corrigendum: oligodendrocyte, astrocyte and microglia crosstalk in myelin development, damage, and repair. Front Cell Dev Biol. 2016;4:71.
- Krämer-Albers E-M, Fröhlich D, Kuo WP, et al. Multifaceted effects of oligodendroglial exosomes on neurons: impact on neuronal firing rate, signal transduction and gene regulation. Philos Trans R Soc B-Biological Sci. 2014;369:13.
- Krämer-Albers EM, Bretz N, Tenzer S, et al. Oligodendrocytes secrete exosomes containing major myelin and stress-protective proteins: trophic support for axons? Proteomics - Clin Appl. 2007;1:1446–1461.
- Kierdorf K, Prinz M. Microglia in steady state Katrin. J Clin Invest. 2017;127:3201–3209.
- Casano AM, Peri F. Microglia: multitasking specialists of the brain. Dev Cell. 2015;32:469–477.
- Li L, Lu J, Sam S, et al. The function of microglia, either neuroprotection or neurotoxicity, is determined by the equilibrium among factors released from activated microglia in vitro. Brain Res. 2007;1159:8–17.
- Sonetti D, Ottaviani E, Bianchi F, et al. Microglia in invertebrate ganglia. Neurobiology. 1994;91:9180–9184.
- Jahnsen JKS, Nicholls JG. Regeneration and changes in synaptic connections between individual nerve cells in the central nervous system of the leech. Proc Natl Acad Sci. 1972;69:639.
- Verderio C, Muzio L, Turola E, et al. Myeloid microvesicles are a marker and therapeutic target for neuroinflammation. Ann Neurol. 2012;72:610–624.
- Prada I, Furlan R, Matteoli M, et al. Classical and unconventional pathways of vesicular release in microglia. Glia. 2013;61:1003–1017.
- Potolicchio I, Carven GJ, Xu X, et al. Proteomic analysis of microglia-derived exosomes: metabolic role of the aminopeptidase CD13 in neuropeptide catabolism1. J Immunol. 2005;175:2237–2243.
- Turola E, Furlan R, Bianco F, et al. Microglial microvesicle secretion and intercellular signaling. Front Physiol. 2012;3:20129.
- Le Marrec-Croq F, Drago F, Vizioli J, et al. The leech nervous system: A valuable model to study the microglia involvement in regenerative processes. Clin Dev Immunol. 2013;2013:274019.
- Coggeshall RE, Fawcett DW. The fine structure of the central nervous system of the leech, hirudo medicinalis. J Neurophysiol. 1964;27:229–289.
- Tahtouh M, Croq F, Vizioli J, et al. Evidence for a novel chemotactic C1q domain-containing factor in the leech nerve cord. Mol Immunol. 2009;46:523–531.
- Drago F, Sautière PE, Le Marrec-Croq F, et al. Microglia of medicinal leech (Hirudo medicinalis) express a specific activation marker homologous to vertebrate ionized calcium-binding adapter molecule 1 (Iba1/alias aif-1). Dev Neurobiol. 2014;74:987–1001.
- Croq F, Vizioli J, Tuzova M, et al. A homologous form of human interleukin 16 is implicated in microglia recruitment following nervous system injury in leech Hirudo medicinalis. Glia. 2010;58:1649–1662.
- Kong M, Alvarez A, Valdivia A, et al. GLIA bilbao 2015: abstracts oral presentations, posters, indexes. Glia. 2015;63:E76–E469. (T08–19A, T12–13A).
- The fifth international meeting of ISEV, ISEV2016, Rotterdam, The Netherlands, 4 – 7 May, 2016. J Extracell Vesicles. 2016;5:31552.
- Graham JM. OptiPrep density gradient solutions for mammalian organelles. ScientificWorldJournal. 2002;2:1440–1443.
- Thery C, Clayton A, Amigorena S. Isolation and characterization of exosomes from cell culture supernatants. Curr Protoc Cell Biol. 2006;Chapter 3:Unit 3.22. doi: 10.1002/0471143030.cb0322s30
- Lab L In-gel digestion of proteins separated by SDS-PAGE. Available at: http://www.lamondlab.com/newwebsite/ProtocolsforWebsite/In-geldigestion.pdf. cited 2018 Jul 19.
- Hsu CC, Baker MW, Gaasterland T, et al. Top-down atmospheric ionization mass spectrometry microscopy combined with proteogenomics. Anal Chem. 2017;89:8251–8258.
- Boutet E, Lieberherr D, Tognolli M, et al. UniProtKB/Swiss-Prot. Methods Mol Biol. 2007;406:89–112.
- Altschul SF, Gish W, Miller W, et al. Basic local alignment search tool. J Mol Biol. 1990;215:403–410.
- UniProtKB. Available at: https://www.uniprot.org/uniprot/. cited 2018 Jul 27.
- Cox J, Mann M. MaxQuant enables high peptide identification rates, individualized p.p.b.-range mass accuracies and proteome-wide protein quantification. Nat Biotechnol. 2008;26:1367–1372.
- Urgen Cox J, Neuhauser N, Michalski A, et al. Andromeda: A Peptide Search Engine Integrated into the MaxQuant Environment. J Proteome Res. 2011;10:1794–1805.
- Tyanova S, Temu T, Sinitcyn P, et al. The Perseus computational platform for comprehensive analysis of (prote)omics data. Nat Methods. 2016;13:731–740.
- Colombo M, Raposo G, Théry C. Biogenesis, secretion, and intercellular interactions of exosomes and other extracellular vesicles. Annu Rev Cell Dev Biol. 2014;30:255–289.
- Keerthikumar S, Chisanga D, Ariyaratne D, et al. ExoCarta: A web-based compendium of exosomal cargo. J Mol Biol. 2016;428:688–692.
- Gardiner C, Di Vizio D, Sahoo S, et al. Techniques used for the isolation and characterization of extracellular vesicles: results of a worldwide survey. J Extracell Vesicles. 2016;5:32945.
- Tauro BJ, Greening DW, Mathias RA, et al. Comparison of ultracentrifugation, density gradient separation, and immunoaffinity capture methods for isolating human colon cancer cell line LIM1863-derived exosomes. Methods. 2012;56:293–304.
- Sun Y, Huo C, Qiao Z, et al. Comparative proteomic analysis of exosomes and microvesicles in human saliva for lung cancer. J Proteome Res. 2018;17:1101–1107.
- Rezeli M, Gidlöf O, Evander M, et al. Comparative proteomic analysis of extracellular vesicles isolated by acoustic trapping or differential centrifugation. Anal Chem. 2016;88:8577–8586.
- Witwer KW, Buzás EI, Bemis LT, et al. Standardization of sample collection, isolation and analysis methods in extracellular vesicle research. J Extracell Vesicles. 2013;2:1–25.
- Aebersold R, Mann M. Mass spectrometry-based proteomics. Nature. 2003;422:198–207.
- Théry C, Witwer KW, Aikawa E, et al. Minimal information for studies of extracellular vesicles 2018 (MISEV2018): a position statement of the international society for extracellular vesicles and update of the MISEV2014 guidelines. J Extracell Vesicles. 2019;8:1535750.
- Kannaiyan N, Manrique-Hoyos N, Rossner MJ, et al. Cell type– and brain region–resolved mouse brain proteome. Nat Neurosci. 2015;18:1819–1831.
- Xu Y, Bolton B, Zipser B, et al. Gliarin and macrolin, two novel intermediate filament proteins specifically expressed in sets and subsets of glial cells in leech central nervous system. J Neurobiol. 1999;40:244–253.
- Vergote D, Sautière PE, Vandenbulcke F, et al. Up-regulation of neurohemerythrin expression in the central nervous system of the medicinal leech, Hirudo medicinalis, following septic injury. J Biol Chem. 2004;279:43828–43837.
- Trang T, Beggs S, Salter MW. Brain-derived neurotrophic factor from microglia: a molecular substrate for neuropathic pain. Neuron Glia Biol. 2012;7:99–108.
- Drago F, Lombardi M, Prada I, et al. ATP modifies the proteome of extracellular vesicles released by microglia and influences their action on astrocytes. Front Pharmacol. 2017;8:910.
- Takenouchi T, Tsukimoto M, Iwamaru Y, et al. Extracellular ATP induces unconventional release of glyceraldehyde-3-phosphate dehydrogenase from microglial cells-NC-ND. Immunol Lett. 2015;167:116–124.
- Chiquet M, Nicholls JG. Neurite outgrowth and synapse formation by identified leech neurones in culture. J Exp Biol. 1987;132:191–206.
- Trotta T, Panaro MA, Cianciulli A, et al. Microglia-derived extracellular vesicles in Alzheimer’s Disease: a double-edged sword. Biochem Pharmacol. 2018;148:184–192.
- Lefebvre C. Calreticulin contributes to C1q-dependent recruitment of microglia in the leech Hirudo medicinalis following a CNS injury. Med Sci Monit. 2014;20:644–653.