
ABSTRACT
Physical activity initiates a wide range of multi-systemic adaptations that promote mental and physical health. Recent work demonstrated that exercise triggers the release of extracellular vesicles (EVs) into the circulation, possibly contributing to exercise-associated adaptive systemic signalling. Circulating EVs comprise a heterogeneous collection of different EV-subclasses released from various cell types. So far, a comprehensive picture of the parental and target cell types, EV-subpopulation diversity and functional properties of EVs released during exercise (ExerVs) is lacking. Here, we performed a detailed EV-phenotyping analysis to explore the cellular origin and potential subtypes of ExerVs.
Healthy male athletes were subjected to an incremental cycling test until exhaustion and blood was drawn before, during, and immediately after the test. Analysis of total blood plasma by EV Array suggested endothelial and leukocyte characteristics of ExerVs. We further purified ExerVs from plasma by size exclusion chromatography as well as CD9-, CD63- or CD81-immunobead isolation to examine ExerV-subclass dynamics. EV-marker analysis demonstrated increasing EV-levels during cycling exercise, with highest levels at peak exercise in all EV-subclasses analysed. Phenotyping of ExerVs using a multiplexed flow-cytometry platform revealed a pattern of cell surface markers associated with ExerVs and identified lymphocytes (CD4, CD8), monocytes (CD14), platelets (CD41, CD42, CD62P), endothelial cells (CD105, CD146) and antigen presenting cells (MHC-II) as ExerV-parental cells. We conclude that multiple cell types associated with the circulatory system contribute to a pool of heterogeneous ExerVs, which may be involved in exercise-related signalling mechanisms and tissue crosstalk.
Introduction
Physical exercise is eliciting a multisystemic response, guiding specific adaptation processes known to promote overall health status and to protect from lifestyle disease. In addition to increased cardiovascular and metabolic demands, changes in immune-related factors such as leukocyte distribution as well as hormone and cytokine levels are prevailing in the acute phase. Subsequently, multiple organs and cell populations are engaged in tissue crosstalk maintaining whole body homeostasis [Citation1–Citation3]. Although the role of myokines and adipokines released from skeletal muscle and adipose tissue is well described [Citation4,Citation5], many of the factors mediating systemic adaptation and the long-term beneficial effects of exercise still remain unexplored [Citation3].
Extracellular vesicles (EVs) have evolved as key players in cell-cell communication mediating cross-organ signalling and tissue homeostasis [Citation6,Citation7]. EVs are actively released from cells and deliver bioactive cargo such as enzymes, cytokines and miRNAs to target cells in paracrine fashion or via the circulation. Blood contains a heterogeneous mixture of EVs, comprising apoptotic bodies, microvesicles shedding from the plasma membrane and exosomes released from the lumen of multi-vesicular bodies. In the absence of markers and purification strategies clearly distinguishing these subtypes, EVs of unclear subcellular origin can be grouped according to size into large EVs and small EVs [Citation8,Citation9].
Recent work including our own has demonstrated that during exercise, EVs are released into the circulation in humans as well as rodents [Citation10–Citation13]. Proteomic characterization of a crude EV-fraction derived from exercising humans suggested that these EVs at least partly reflect small EVs and comprise muscle-derived EVs delivering myokines to the liver [Citation14]. Furthermore, a substantial body of literature describes the influence of exercise on the appearance of larger endothelial and platelet-derived EVs (often referred to as microparticles) in the clinical context of cardiovascular and metabolic disease as well as coagulation (reviewed in [Citation15–Citation17]). Together, these studies raise the tempting concept that EVs may mediate signalling processes associated with the exercise adaptive response and furthermore, could evolve as biomarkers or even therapeutic vehicles for sedentary lifestyle-associated diseases.
Most likely, several tissues contribute to EVs released during exercise establishing an intricate signalling network. To fully explore the role of circulating EVs in exercise-mediated tissue crosstalk, it will be essential to elucidate the cell types of origin, the relevant EV-subtypes as well as their molecular phenotype and functional properties. EV-specification is achieved by genuine EV-markers in combination with EV-components defining the cell-type of origin. Among the genuine EV-markers, the tetraspanins CD9 and CD63 are ubiquitously associated with most EV-types, while CD81, Tsg101 and Syntenin are considered to be more prevalent in small EVs and exosomes [Citation9,Citation18]. Immuno-isolation of EVs based on the surface expression of CD9, CD63 or CD81 has the potential power to provide further insight into the presence of distinct EV-subsets defined by individual tetraspanins.
Here, we performed a multiplexed phenotyping of EVs released into the circulation during physical exercise (ExerVs) aiming at a more detailed view on their origin and the contributing EV-subtypes. ExerVs isolated by size exclusion chromatography (SEC) were compared to immuno-isolated EVs defined by tetraspanin expression. The results demonstrate that ExerVs constitute a mixture of CD9, CD63 and CD81-positive EVs. A significant proportion of ExerVs was derived from leukocytes, platelets and endothelial cells, implicating different roles in exercise-associated tissue crosstalk such as tissue regeneration, immune regulation, coagulation or angiogenesis.
Material and methods
Ethical approval
All experimental procedures were approved by the Human Ethics Committee Rhineland-Palatine and conformed to the standards of the Declaration of Helsinki of the World Medical Association. All subjects were informed orally and in writing about the procedures and the aim of the study and gave written consent to participate.
Subjects and exercise setting
Twenty-one healthy male athletes voluntarily participated in this exercise study. Inclusion criteria were non-smoking and no medication. After analysis of three pilot subjects, in favour of standardization, all tests were conducted between 8 and 10 am after a minimum of 8 h of overnight fasting, applying the same exercise protocol. Participants were told to abstain from training at the day before and morning prior to the test, which included to choose a non-exhaustive way to arrive at the place where the exercise tests were carried out. Additionally, participants were kept at rest at least for 30 min prior to the first venous and capillary blood drawing and the subsequent exercise test. One participant was excluded from the statistical analysis of vesicle marker changes due to having eaten a fat-rich meal several hours before the exercise test. However, the data were used to report on the influence of the intake of a high-fat meal on the analysis of ExerVs.
The athletes performed an incremental cycling test starting at 40 Watt, increasing power by 40 Watt every 3 min until exhaustion indicated subjectively by the participant. The level of subjective exhaustion was assessed by the 6 to 20 Borg-Scale after each step [Citation19]. During the test, spiroergometric (respiratory) data as well as heart rate were continuously recorded. At a respiratory exchange ratio of 0.9, determined as the volume of CO2 exhaled divided by volume of O2 taken up in median over the course of 15 breathing cycles, the second venous blood drawing was started (RQ 0.9). The submaximal exercise level at RQ 0.9 reflects a subjective load that is about equivalent to a typical aerobic exercise training at medium intensity for trained as well as untrained persons and independent of their nutritional status [Citation20]. Therefore, analysis of samples received at RQ 0.9 introduces a level of exertion during exercise, which is roughly comparable amongst individuals.
After completion of the test, the third venous blood drawing was performed within 2 min after exhaustion. For venous blood drawing, 33 ml of blood were taken from the median cubital vein with a Safety-Multifly® needle (0.8 × 19 mm) (Sarstedt, Nümbrecht, Germany) and collected in tripotassium-EDTA covered Monovettes® (Sarstedt, Nümbrecht, Germany) and S-Monovettes® (Z-Gel, for serum analysis of non-EV parameters) (Sarstedt, Nümbrecht, Germany), respectively.
Next to venous blood sampling, capillary blood was collected prior to the test, at the end of each 3 min level and immediately after exhaustion. For lactate measurement, 20 μl of capillary blood were collected from the earlobe. For cfDNA samples, 30 µl of capillary blood were collected with a dipotassium-EDTA covered Microvette CB 300 (Sarstedt, Nümbrecht, Germany) from the fingertip.
Determination of analytical parameters
Venous blood in serum-tubes and EDTA-tubes were used to determine metabolic parameters and blood cell counts in routine diagnostics. Blood lactate levels were measured with the lactate analyser Biosen 5130 (EKF Diagnostics, Magdeburg, Germany). Respiratory gas exchange analysis (spiroergometry) was carried out using Bluecherry (Geratherm Respiratory GmbH, Bad Kissingen, Germany), and individual anaerobic threshold (IAT) was determined at a net increase of lactate concentration of 1.0 mmol/l above lactate concentration at lactate threshold [Citation21]. For cfDNA analysis, capillary blood was centrifuged 2 min at 1,600 x g at 4°C, and nucleic acid concentration was measured in diluted plasma (1:10 in H2O) by direct quantitative real-time PCR of the L1PA2-repeat as previously described [Citation22], with slight modifications. The 90 bp L1PA2 fragment was amplified using CFX384 BioRad cycler with 2 min 98°C, followed by 10 s 95°C and 10 s 64°C for 35 cycles. 2 µl of diluted plasma were mixed with 13 µl of Mastermix [final concentrations: Velocity Polymerase 0.6 u, 1.2x Hifi Buffer (Bioline, Luckenwalde, Germany), 0.15x SYBR Green, 0.001x FITC, 0.3 mM dNTPs, 0.15 µM primers] for triplicates in 5 µl final volume.
Venous plasma preparation
Platelet-free venous blood plasma used for EV characterization was prepared considering the guidelines of the international society for thrombosis and haemostasis [Citation23] and further recommendations for pre-analytical parameters on EV analysis [Citation24]. After blood drawing, venous EDTA-blood was kept vertically on room temperature avoiding agitation. First centrifugation of 15 min 2,500 x g at room temperature was performed within 15 min after each blood collection. Plasma was collected and subjected to a second centrifugation of 15 min 2,500 x g at room temperature to obtain platelet-free plasma. Platelet-free plasma was kept on ice until EV preparation or frozen at −80°C. The gap between blood draw and first centrifugation was determined by the longitudinal design including short sample collection intervals between pre, RQ 0.9 and post (below 15 min) and was kept constant between the samples.
EV Array
EV surface marker profile in the plasma of exercising humans was determined using the EV Array, as described by [Citation25]. 10 µl of plasma from 10 of the subjects was used to analyse the presence of the following 41 marker proteins: Alix (clone #3A9, Biolegend, San Diego, USA), Annexin V (polyclonal, AF399, R&D Systems, Minneapolis, USA, Minneapolis, USA), Apo E (#395,004, R&D Systems, Minneapolis, USA), CAIX (#2D3, Abcam, Cambridge, UK), Cathepsin D (polyclonal, AF1014, R&D Systems, Minneapolis, USA), CAXII (#315,602, R&D Systems, Minneapolis, USA), CD14 (#M5E2, BD Biosciences, San Jose, USA), CD142 (#323,514, R&D Systems, Minneapolis, USA), CD146 (#P1H1, Abcam, Cambridge, UK), CD151 (#210,127, R&D Systems, Minneapolis, USA), CD171 (polyclonal, HPA005830, Sigma-Aldrich, St. Louis, USA), CD235a (#R10, R&D Systems, Minneapolis, USA), CD31 (polyclonal, AF806, R&D Systems, Minneapolis, USA), CD4 (#34,930, R&D Systems, Minneapolis, USA), CD42a (polyclonal, LS-C45240, LS Bio, Seattle, USA), CD42b (#486,805, R&D Systems, Minneapolis, USA), CD45 (#2D1, R&D Systems, Minneapolis, USA), CD62E/P (#BBIG-E6, R&D Systems, Minneapolis, USA), CD62E (1.2B6, Thermo Scientific, Carlsbad, USA), CD63 (#MEM-259, Bio-RAD, Hercules, CA, USA), CD81 (#1.3.3.22, Ancell, Bayport, USA), CD82 (#423,524, R&D Systems, Minneapolis, USA), CD8a (#37,006, R&D Systems, Minneapolis, USA), CD9 (#SN4/C3–3A2, Ancell, Bayport, USA), EpCAM (#0.N.277, Santa Cruz, Dallas, USA), Flotillin-1 (polyclonal, ab41927, Abcam, Cambridge, UK), GRP78 (#N-20, Santa Cruz, Dallas, USA), HLA-ABC (#W6/32, Biolegend, San Diego, USA), HLA-DR (#L243, Biolegend, San Diego, USA), HLA-DRDPDQ (#HB-145, Loke Diagnostics, Aarhus, Denmark), Hsp70 (polyclonal, SPA-811, Assay design, Michigan, USA), Hsp90 (polyclonal, ab13494, Abcam, Cambridge, UK), ICAM-1 (#R6.5, eBioscience, San Diego, USA), LAMP-1 (#508,921, R&D Systems, Minneapolis, USA), LFA1 (#HI111, Ab Biotec, San Diego, USA), TGFb1 (#A75–2, BD Pharmingen, San Diego, USA), TLR3 (#TLR3.7, Santa Cruz, Dallas, USA), tPA (polyclonal, AF7449, R&D Systems, Minneapolis, USA), TSG101 (polyclonal, ab117627, Abcam, Cambridge, UK), VE-Cadherin (polyclonal, AF938, R&D Systems, Minneapolis, USA), VEGFR2 (#7D4–6, Biolegend, San Diego, USA).
Log base-2 normalized EV Array raw data analysis was restricted to those candidates that reached an average fluorescence level above the limit of detection (LOD) as defined by a fluorescence higher than 3-times the standard deviation above the fluorescence of both of the controls. As a first control, we used the fluorescence obtained by measuring a blank sample (washing buffer without plasma). As a second more stringent control, we used the fluorescence obtained from each plasma sample in the microarray spots not coated with a capture antibody.
EV isolation
EV-analysis was performed on EDTA-plasma samples. EV isolation by size exclusion chromatography (SEC) was implemented using self-made columns according to Boing [Citation26] with minor modifications. Sepharose CL-2B (Sigma-Aldrich, St. Louis, USA) columns were packed in a 10 ml-syringe placing a 0.22 µm PES-filter membrane at the bottom of the syringe. After washing of the column with PBS, 2 ml of platelet-free plasma were loaded on the column and 1 ml fractions were collected. Single fractions were analysed for particle count using nanoparticle tracking analysis, protein content using the Novagen BCA Protein Assay Kit (Merck Millipore, Darmstadt, Germany) and presence of vesicular and non-vesicular markers by Western blotting. Fractions 4 to 6 were considered EV-rich while plasma protein- and lipoprotein-poor, pooled and 30x concentrated in 30 kDa Amicon Ultra-4 ml filter devices (Merck Millipore, Darmstadt, Germany) to obtain 100 µl of SEC-EVs.
EV preparation by immunobead isolation was performed using the CD9-, CD63- or the CD81-Exosome Isolation Kit according to the manufacturer’s protocol (Miltenyi Biotec, Bergisch-Gladbach, Germany). 2 ml of platelet-free plasma were used as starting material, and the elution volume was 130 µl of CD9+, CD63+ and CD81+EVs, respectively. All isolated EV samples were kept on ice until further treatment.
The sample volume that can be retrieved from one subject within the setting (three time points of blood drawing) is limited to around 6 ml of plasma per time point and allowed a parallel analysis of three different isolation procedures at maximum. Hence, not all subjects are reflected as a data point in each of the analyses.
Nanoparticle tracking analysis (NTA)
SEC-isolated EVs were analysed using the Nanosight LM10 system (camera model Hamamatsu C11440-50B/A11893-02) equipped with a 532 nm laser and a syringe pump as well as the Nanosight 2.3 software (Malvern, Herrenberg, Germany) at 23°C (temperature controlled). The following settings were used: camera control in standard mode (camera level 14), particle detection in standard mode (detection threshold 8 and minimum expected particle size auto), and script control (Repeatstart, Syringeload 500, Delay 5, Syringestop, Delay 15, Capture 30 and Repeat 4). Five videos of 30 s were recorded, particles were tracked (batch process) and average values were formed. EV samples were diluted in particle-free PBS to obtain a particle concentration of 3–10 × 108 particles/ml. Measurements were verified utilizing silica microspheres (Polysciences, Warrington, PA, USA) with a size of 100 nm as described by Gardiner [Citation27].
Western blotting (WB)
SEC fractions or immunobead-isolated EVs normalized in volume to the starting volume of plasma were mixed with sample buffer (200 mM Tris-HCL (pH 6.8); 10% SDS; 0.4% bromophenol blue; 40% glycerol; 400mM DTT; for CD9 and CD63 antibodies under non-reducing conditions) and subjected to SDS-PAGE (8% or 12%) and WB using PVDF-membranes. Membranes were blocked with 4% milk powder and 0.1% Tween in PBS and incubated with primary and HRP-coupled secondary antibodies. Subsequently, chemiluminescent detection and visualization was implemented. If applicable, the membrane was re-stained with a primary antibody for a different marker protein. For semi-quantitative analysis of WB signals, ImageJ software was used. Immuno-stainings showing high background noise were not included in the semi-quantitative analysis (e.g. presented CD9+EVs Syntenin staining, )) and, thus, are not represented as data points in the quantitative data analysis.
The following antibodies were applied: CD9 (1:2000 dilution, clone #MM2/57, Merck Millipore, Darmstadt, Germany), CD63 (1:500 dilution, #CBL553, Merck Millipore, Darmstadt, Germany), CD81 (1:1000 dilution, #B-11, Santa Cruz, Heidelberg, Germany), Syntenin (1:2000 dilution, polyclonal, ab19903, Abcam, Cambridge, UK), TSG101 (1:1000 dilution, #4A10, GeneTex, Irvine, CA, USA), CD41 (1:1000 dilution, #SZ.22, Santa Cruz, Heidelberg, Germany), SGCA (1:500 dilution, #D-7, Santa Cruz, Heidelberg, Germany), ApoA1 (1:200 dilution, #12C8, Santa Cruz, Heidelberg, Germany), goat-anti-mouse-HRP (1:10,000 dilution, polyclonal, 115–035-166, Dianova, Hamburg, Germany), mouse-anti-rabbit-HRP (1:10,000 dilution, #5A6-1D10, Dianova, Hamburg, Germany).
Electron microscopy
SEC-EVs were fixed with 4% PFA and adhered to 100 mesh copper-grids for 5 min and analysed by transmission electron microscopy (EM) after 10 washes with a. dest. and embedding in 2% methylcellulose with 0.4% uranyl acetate.
Multiplex surface marker analysis
MACSPlex analysis was performed using the MACSPlex Exosome, human, Kit (Miltenyi Biotect, Bergisch-Gladbach, Germany) according to the kit specifications. The overnight capture antibody incubation protocol was applied, performing the detection with a combination of CD9-, CD63- and CD81-APC antibodies. Throughout the analysis, same sample volumes for the different time points were used: 120 µl of SEC-EVs and 50 µl of CD9+EVs, CD63+EVs or CD81+EVs. Flow cytometric analysis was carried out on the MACSQuant Analyzer 10 with the corresponding software (Miltenyi Biotec, Bergisch-Gladbach, Germany). For further analysis, background values of the control sample (PBS) of each run were subtracted from the sample values. Surface marker values below the corresponding control antibody included in the kit, considered as measurement threshold, were regarded as negative. For data series, where the RQ 0.9 and/or post-exercise values were clearly above this threshold, pre values were included despite being under the threshold; these cases are explicitly marked in the results section.
Heatmap cluster analysis and statistical analysis of marker changes
The heatmaps were produced using R (Version 3.5.0, RStudio, Inc., Boston, USA) with the ComplexHeatmap package (Version 1.18.1), clustering with Pearson correlation [Citation28].
For statistical analysis of marker changes in EV Array, WB and MACSPlex, log normalized values were compared by ANOVA across all three points in time related to exercise (pre-exercise, RQ 0.9 and post-exercise). A significant global F-test (p < 0.05) across all points in time was followed by post-hoc testing using each pair’s students t-testing. Post hoc p-values were Bonferroni-corrected for two comparison (pre to RQ 0.9 and pre to post), and a value of <0.05 was considered significant (* = p < 0.05, ** = p < 0.01, *** = p < 0.001). For graphical presentation of marker changes, data were transformed back and fold changes are presented as geometric means with individual subject results for WB analysis and 95% confidence intervals for EV Array and MACSPlex analysis.
EV-TRACK
We have submitted all relevant data of our experiments to the EV-TRACK knowledgebase (EV-TRACK ID: EV180071) [Citation29].
Results
Study design: acute exercise and sample collection
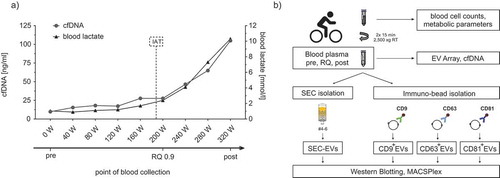
To assess the marker profile and the kinetics of EVs released during physical activity, we performed a comparative exercise study involving 21 active healthy male subjects (age: 28.7 ± 4.2 y, BMI: 22.8 ± 2.0) who, following overnight fasting, underwent an incremental cycling test until exhaustion. Physiological parameters of all subjects, including blood lactate, heart rate, oxygen consumption, Borg values (subjective rate of perceived exertion) and cfDNA kinetics (objective molecular marker for physical exhaustion [Citation30]), were recorded (), ). Venous blood for subsequent EV analysis was drawn prior to the test (pre), during the test (RQ 0.9) and immediately after exhaustion (post). Lactate and cfDNA levels increased from pre (0.9 ± 0.2 mmol/l, 25 ± 11.9 ng/ml) to RQ 0.9 (2.3 ± 1.1 mmol/l, 45.2 ± 25 ng/ml) and finally to post-exercise (9.4 ± 2.8 mmol/l, 163.5 ± 90.2 ng/ml) roughly by 10-fold and sevenfold, respectively. Blood cell counts and blood parameters, which could have influenced EV analysis, were all within the normal range at rest (). Leukocyte counts slightly increased during exercise as previously reported [Citation31]. We further characterized EVs present in plasma and implemented different isolation and characterization strategies ()), including size-exclusion chromatography (SEC) purification and immuno-bead precipitation of different EV-populations followed by WB and multiplexed marker analysis (EV Array, MACSPlex assay). Although sample volume limitations did not permit parallel assessment of all the analysis techniques, the strategy allowed a comprehensive view on the presence and dynamics of EV-populations in the circulation of exercising humans. To designate EVs released during exercise, we use the generic term ExerVs.
Table 1. Test parameters of the study subjects.
Table 2. Lipoproteins and blood cell counts in exercising humans.
Figure 1. Exercise setting and study design. (a) Exemplary illustration of the incremental cycling test and time points of sample collection. Diagram depicts blood lactate (black line) and cell-free DNA levels (cfDNA; grey line), measured every 3 min at each increment. Lactate and cfDNA strongly increase after the individual anaerobic threshold (IAT, dashed vertical line) until exhaustion of the subject. Venous blood was drawn before starting the test (pre), during the test at the respiratory quotient (RQ) 0.9 and immediately at the end of exercise (post). (b) Outline of the combined experimental strategy to characterize EVs released during exercise (ExerVs). Blood cell counts and metabolic parameters were assessed in venous blood samples taken at the three time points indicated in (a). EV Array and cfDNA analysis were performed with unprocessed plasma. For WB and MACSPlex analysis, EVs were purified from plasma by SEC or immuno-bead isolation using CD9-, CD63- or CD81-magnetic beads.
EV Array as initial indicator of ExerV-associated marker dynamics
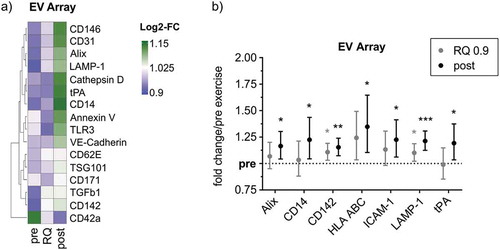
To reveal an indication of the potential changes in the EV-marker profile during cycling exercise, we first employed the EV Array technology, detecting EVs in whole plasma based on antibody-mediated detection of multiple customized cellular markers next to EV-markers [Citation32]. While several markers stayed below the limit of detection (LOD) or remained constant during exercise (not shown), a range of markers was identified that displayed increased or decreased signal intensity during exercise ()). Among these, Alix, CD14, CD142, HLA-ABC (MHC-I), ICAM-1, LAMP-1 and tPA were found to exhibit a significant gradual increase from pre over RQ 0.9 to post-exercise, although the fold changes in signal intensity were marginal ()). Elevation of these markers may provide a first hint that ExerVs exhibit endosomal characteristics and could be derived from leukocytes and endothelial cells. However, the most prominent EV-markers CD9, CD63, CD81 as well as Flot-1, HSP70 and CD41b, which had been shown to increase during cycling exercise before [Citation12], were below the detection threshold of the assay. These results indicate that the EV Array may not be able to fully resolve marker kinetics during the applied exercise setting, possibly due to the high complexity of whole plasma dominated by other components (e.g. albumin, immunoglobulins and lipoproteins). Thus, purification of EVs prior to analysis appears essential to gain deeper insight in the characteristics of ExerVs.
Figure 2. EV Array analysis of plasma EVs from exercising humans. (a) Heatmap of EV Array markers that change in relative intensity during exercise. Markers depicted were higher than the LOD in more than 50% of cases. (b) Fold changes of significantly increasing markers depicted with 95%-confidence intervals (CI). Bonferroni-corrected students t-test, * = p < 0.05, ** = p < 0.01, *** = p < 0.001, n = 10.
SEC-isolated ExerVs increase during exercise
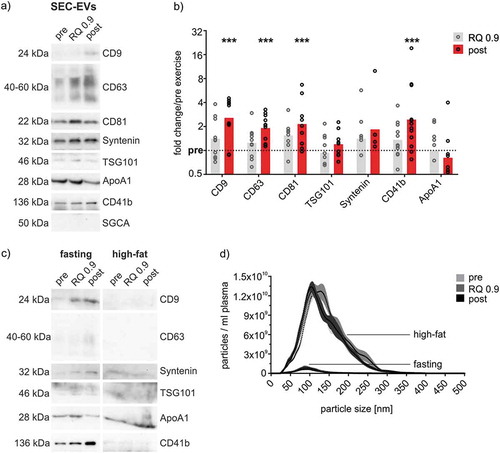
To isolate EVs from the plasma of exercising subjects, we first utilized size exclusion chromatography (SEC) as a size-based purification strategy. SEC was recently established as a method of EV-isolation from plasma allowing separation of EVs from a large fraction of lipoprotein particles and other plasma components [Citation26,Citation33–Citation35]. Consistently, particles with the size of EVs eluted largely in fractions 4–6, while the mass of protein eluted in later fractions ()). Fractions 4–6 indeed contained EV-proteins such as CD9, CD63, CD81 or the platelet EV-marker CD41b ()). Moreover, vesicular structures with the size of small EVs were identified in these fractions by transmission electron microscopy ()). We further pooled the EV-rich fractions 4-6 (SEC-EVs), which were not completely free of lipoproteins as a small fraction of Apolipoprotein A1 (ApoA1) still was detectable in fraction 6 ()). NTA analysis of SEC-EVs revealed a mean particle size of 106.3 ± 4.5 nm and a mode size of 89.6 ± 5.7 nm ()) characteristic of small EVs. The total number of particles varied strongly between individuals and in mean remained constant during exercise between pre-, RQ 0.9 and post-exercise samples ()). It is well established that NTA depicts lipoprotein particles in addition to EVs, not allowing the correct enumeration of plasma EVs [Citation36–Citation38]. Hence, we conclude that NTA is not a suitable technique to depict EV-dynamics during exercise even in fasted subjects, due to a large non-EV related particle background in plasma.
Figure 3. SEC-isolation of EVs. (a,b) NTA (bars) and protein content (line) of SEC fractions as well as WB analysis of SEC fractions using genuine EV-markers (CD9, CD63, CD81), a platelet-specific marker (CD41b) and Apolipoprotein A1 (ApoA1) as lipoprotein marker. Fractions 4 to 6 (= SEC-EVs) are considered EV-rich while plasma protein- and lipoprotein-poor. (c) Transmission electron microscopy image of SEC-EVs. Scale bar refers to 200 nm. (d) Representative NTA size distribution profile of SEC-EVs collected pre, at RQ 0.9 and post-exercise. (e) NTA total particle counts in SEC-EVs collected pre, at RQ 0.9 and post-exercise (SEM, n = 7).
We further examined the exercise-associated kinetics of EV-markers in SEC-EVs. WB analysis of SEC-EVs revealed that, normalized to plasma volume, EV-associated proteins rise from pre to RQ 0.9 and post-exercise (,b)). Significant increases of roughly twofold were observed for the tetraspanins CD9, CD63 and CD81 post-exercise, which was already visible as slight elevation above baseline at submaximal loads at RQ 0.9. Similarly, the more specific markers for late endosome-derived small EVs TSG101 and Syntenin showed a trend to increase in response to exercise. Furthermore, CD41b, specifically depicting platelet-derived EVs, was significantly increased by 2.4-fold post-exercise. Markers representative of EVs derived from exercise-related cell types such as muscle cells [alpha-sarcoglycan, [Citation39], )] or hepatocytes (asialoglycoprotein receptor, not shown) could not be detected. In addition, non-EV-markers such as the ER-membrane protein Calnexin were not detected in SEC-EVs (data not shown). In contrast to EV-markers, ApoA1 indicating co-isolating HDL particles remained unchanged in ExerV samples. Of note, detection of EVs was dependent on limited levels of lipoprotein contamination in SEC fractions, as intake of a meal containing a high amount of fat prior to the exercise interfered with EV characterization methods ()). In postprandial conditions, Western Blot detection of EV-epitopes was hampered ()). In addition, particle counts in SEC-EVs were affected by an order of magnitude ()), again highlighting the fact that NTA particle counts of plasma EVs are largely dominated by lipoprotein particles and are unrelated to EV-dynamics.
Figure 4. Quantitative analysis of SEC-isolated ExerVs. (a) Representative WB analysis of SEC-EVs (pooled fractions 4–6) using EV-markers, muscle marker alpha-sarcoglycan (SGCA) and lipoprotein marker ApoA1. (b) Densitometric quantification of WB signals. Individual (circle) and mean (bar) fold changes of WB markers. RQ 0.9 and post expressed in relation to pre-exercise (dashed line). Bonferroni-corrected students t-test, n = 7–11, *** = p < 0.001. (c, d) WB analysis and NTA of SEC-EVs of one study subject after fasting and a high-fat meal. Number of particles increase by an order of magnitude while WB signals diminish upon high-fat diet.
In summary, Western Blot analysis of SEC-isolated EVs employing several EV-markers indicated an increase of ExerVs in plasma after acute cycling exercise, consistent with our previous study employing ultracentrifugation for EV isolation [Citation12]. However, markers more typical for late endosome-derived small EVs appeared less prominently increased among ExerVs as opposed to the tetraspanins CD9, CD63 and CD81.
Multiplex phenotyping of SEC-isolated ExerVs
To further specify ExerVs and their parental cells, we performed a phenotyping analysis of ExerVs released from pre to post-exercise to reveal cell-type specific marker changes during exercise. To this end, we utilized the MACSPlex platform, which consists of a multiplexed, bead-based assay followed by flow cytometric evaluation [Citation40]. EVs are first captured by colour-coded beads carrying different marker-specific antibodies and then detected by a mixture of antibodies recognizing the EV-proteins CD9, CD63 and CD81 ()). MACSPlex analysis of SEC-isolated EVs revealed surface marker profiles characterized by strong signals for platelet-associated markers (e.g. CD42a and CD62P) and for leukocyte markers such as CD8 and HLA-DRDPDQ (MHC-II) next to the typical EV-proteins CD9, CD63 and CD81 (a representative profile is shown in )).
Figure 5. Phenotyping of SEC-isolated ExerVs by MACSPlex analysis. (a) Principle of the MACSPlex assay: Isolated EVs are captured by colour-coded beads carrying specific antibodies for cell surface markers. Subsequently, detection antibodies for the EV-markers CD9, CD63 and CD81 conjugated to APC bind to the EVs. Read-out is achieved by flow cytometry revealing the surface marker profile of EV-samples. (b) Mean fluorescence intensities (MFI) displayed in MACSPlex analysis of SEC-EVs isolated from plasma of one representative exercising subject. (c) Heatmap visualization of individual MACSPlex marker increases in SEC-EVs including hierarchical clustering for markers as well as subjects. Log2-fold changes of MFI at RQ 0.9 and post in relation to pre-exercise are presented. (d, e) Mean tetraspanin and selected cell surface marker elevations with 95%-CI during exercise. Bonferroni-corrected students t-test, * = p < 0.05, ** = p < 0.01, *** = p < 0.001, n = 8.
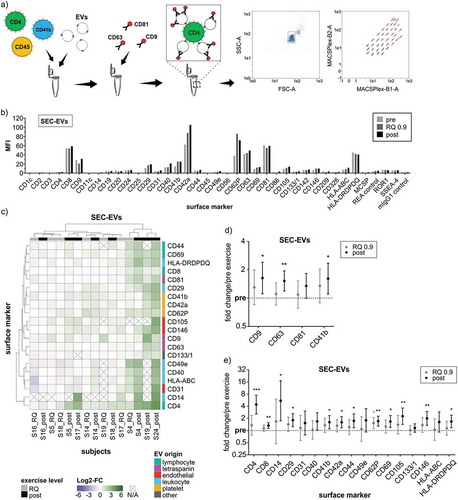
Relative changes in signal intensities of specific markers between pre, RQ 0.9 and post-exercise SEC-EVs provide information on the release kinetics and cellular origin of ExerVs liberated into the circulation. Heatmap visualization of marker dynamics in individuals identified a panel of markers increasing during exercise ()). However, the recorded fold changes are moderate for most of the subjects, although few subjects exhibit robust marker increases (S4, S19, S24). Regarding longitudinal individual changes, increases are consistently stronger post-exercise as compared to the intermediate RQ 0.9 time point (reflected by their position more to the right in the heatmap). While RQ 0.9 and post-exercise samples do not perfectly cluster into two branches, clustering appears to separate high-responders (S4, S19, S24), moderate responders (S14, S17, S18) and non-responders (S5, S16). This finding suggests that ExerVs exhibit different EV release kinetics among individuals.
On the single marker level, EV-markers such as the tetraspanins CD9, CD63 and CD81 or platelet-derived CD41b were significantly elevated post-exercise by 1.3 to 1.6-fold ()). These values appear smaller as compared to the increases in these markers determined by WB in the same samples ()). This may be explained by competition of bead-coupled antibodies and detection antibodies for the same epitopes in case of the tetraspanins [Citation41], or by masking of epitopes by plasma constituents such as lipoproteins possibly resulting in generally weakened signal intensities in bead-based assays as opposed to WB detection. In general, semi-quantitative data achieved by WB were more robust as compared to MACSPlex analysis of SEC-EVs, indicating a potential for further optimization of multiplexed work-flows.
In addition to EV-markers, several cell-type or lineage-specific surface markers showed low but significant increases upon exercise. Platelet markers (e.g. CD42a and CD62P) or leukocyte-associated proteins (e.g. CD29, CD69 and MHC-II) showed average fold changes between 1.3 and 1.8-fold, with CD62P significantly elevated even at RQ 0.9 ()). Endothelial markers CD105 and CD146 were increased to slightly higher levels post-exercise by 2.3- and 2.0-fold, respectively. Intriguingly, the lymphocyte and monocyte markers CD4 and CD14 were repeatedly only detectable after exercise while being under or near detection threshold before exercise (see )). The relatively high mean fold changes and degree of variance ()) may be related to the fact that some pre-exercise samples were below the limit of quantification for these markers. However, the constant observation of CD4- and CD14-EVs after exercise strongly suggests the release of a relevant EV-population likely originating from lymphocytes and monocytes. In summary, phenotyping of SEC-isolated ExerVs reveals surface marker dynamics providing evidence for their origin largely from platelets, leukocytes including lymphocytes and monocytes, and endothelial cells.
ExerVs comprise CD9+, CD63+ and CD81+ EV-populations
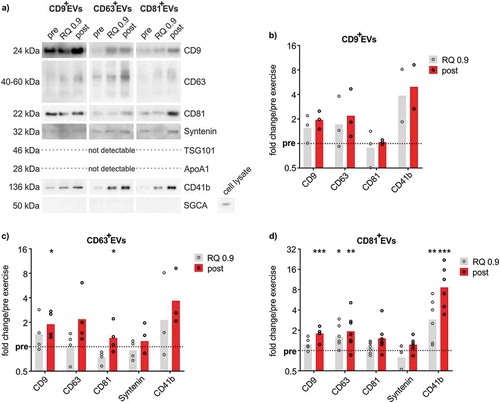
To gain insight in potential ExerV-subclasses, we performed immuno-isolation of EVs from the unprocessed plasma of exercising subjects using CD9-, CD63- or CD81-antibody-coupled magnetic beads resulting in defined populations of CD9+EVs, CD63+EVs or CD81+EVs. However, bead-isolation is incompatible with NTA as intact EVs cannot be eluted from the isolation beads efficiently. Western Blot analysis of bead-isolated CD9+EVs, CD63+EVs and CD81+EVs confirmed the presence of CD9, CD63, CD81 as well as Syntenin in all three EV-populations while TSG101 was not detectable ()). As reported for SEC-EVs, alpha-sarcoglycan representative of muscle-derived EVs and hepatic markers were undetectable in the isolated EVs. Interestingly, ApoA1 was largely absent from bead-isolated EVs, indicating efficient removal of lipoproteins. Consistent with the results obtained with SEC-isolation, bead isolation resulted in increased recovery of EVs during and after exercise ()). Overall, EV-markers were similarly represented in CD9+EVs, CD63+EVs and CD81+EVs. While CD9, CD63 and platelet CD41b showed a clear trend or were significantly increased during exercise, CD81 and Syntenin were not or less affected. Isolation of CD81+EVs resulted in significant gradual increases of EV-markers from pre to RQ 0.9 to post-exercise, with platelet CD41b most prominently affected (), CD9 1.8-fold; CD63 1.9-fold, CD41b 8.6-fold).
Figure 6. Quantitative WB analysis of immunobead-isolated ExerVs. (a) Representative WB analysis of CD9+EVs, CD63+EVs and CD81+EVs using EV-markers and lipoprotein marker ApoA1. (b-d) Densitometric quantification of WB signals. Individual (circle) and mean (bar) fold changes of WB markers in (b) CD9+EVs, (c) CD63+EVs and (d) CD81+EVs. RQ 0.9 and post expressed in relation to pre-exercise (dashed line). Bonferroni-corrected students t-test, n = 2–7, * = p < 0.05, ** = p < 0.01, *** = p < 0.001.
ExerVs originate from platelets, leukocytes and endothelial cells
Immuno-bead isolated CD9+-, CD63+- and CD81+-ExerV populations were further phenotyped by MACSPlex analysis (). Compared to SEC-EVs ()), more markers with robust signal intensities are represented in the profile ()). As already described by others [Citation40,Citation41] CD9, CD63 and CD81 are barely detectable in the respective CD9+-, CD63+- and CD81+ EV-population, although cross-detection is well achieved (e.g. CD63 is not detected in CD63+EVs but very well in CD81+EVs). This is explained by epitope competition, when capture bead and detection bead target the same tetraspanin and hence, does not indicate the absence of the respective tetraspanin. Comparing overall surface marker profiles, CD63+EVs and CD81+EVs exhibit a strikingly similar pattern characterized by high signal intensities for platelet (e.g. CD42a), endothelial (e.g. CD105) and leukocyte markers (e.g. CD40). Signal intensities achieved with CD9+EVs are generally lower. However, the relative representation of CD62P and HLA-DRDPDQ (MHC-II) appears higher among CD9+EVs as compared to CD63+EVs and CD81+EVs, which was also noticeable in SEC-EVs () and )). Heatmap illustration of marker changes across all subjects again confirms incremental marker increases from pre to RQ 0.9 and post-exercise ()). Clustering analysis largely groups RQ 0.9 samples left to respective post samples reflecting stable release kinetics and marker phenotypes of ExerVs among individuals. In addition, low responder (e.g. S3) and high responder subjects are clearly separated (e.g. S14, S15, S23).
Figure 7. MACSPlex phenotyping of CD9+-, CD63+- and CD81+ExerVs. (a) Representative mean fluorescence intensities (MFI) of markers determined in MACSPlex analysis of immunobead-isolated CD9+EVs, CD63+EVs and CD81+EVs. (b) Heatmap visualization of individual surface marker increases in immunobead-isolated ExerVs including hierarchical clustering for markers as well as subjects. Log2-fold changes of MFI at the RQ 0.9 level and post-exercise in relation to pre-exercise are presented.
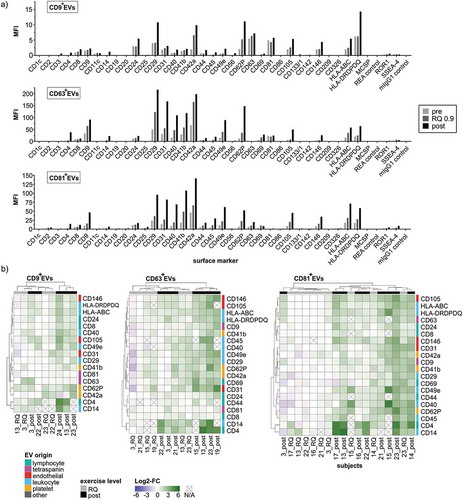
Intriguingly, markers found with significant fold change increases were highly congruent between CD9+-, CD63+- and CD81+ExerVs ()), suggesting that the contributing cells release EVs containing all three tetraspanins (combined in single EVs or in different individual EVs). Overall, markers exhibited a trend to increase at RQ 0.9 (marking the onset of ExerV-release) and significant mean fold increases ranging from 1.4 to 10.4-fold after exercise. Similar to SEC-EVs, CD4 and CD14 were barely present before but reproducibly detected after exercise ()), reflected in large fold change increases ()). CD63+ExerVs as well as CD81+ExerVs were significantly elevated in platelet-specific markers (CD41b, CD42a, CD62P, between 1.8 and 2.9 fold in mean), lymphocyte markers (CD4, 10-fold and CD8 1.5-2 fold), MHC-I (2.5–3 fold) and markers specifying antigen-presenting cells (APC) (MHC-II, CD40, between 2.4- and 3.4 fold in mean). In addition, endothelial markers such as CD31 (2.5–3.7 fold), CD105 (3.2–4.3 fold) and CD146 (3.3-3.5 fold) increased significantly with exercise (,c)). In CD9+ExerVs ()), similar but fewer EV-associated markers reach statistical significance, probably due to the smaller sample size (n = 5). Significant increases were again observed for lymphocyte (CD4 and CD8), endothelial (CD105 and CD146), APC (MHC-II and CD40) and platelet markers (CD62P), although CD41b and CD42a changes were not within statistical significance for CD9+-ExerVs. Taken together, these findings reveal that immunobead isolation results in efficient isolation of ExerVs, which appear to represent a mixture of all three CD9+, CD63+ and CD81+ subtypes exhibiting an overall similar phenotype.
Figure 8. MACSPlex marker kinetics of CD9+-, CD63+- and CD81+ExerVs. (a-d) Mean cell surface marker elevations with 95%-CI at RQ 0.9 and post-normalized to pre-exercise in (a) CD9+EVs (n = 5), (b) CD63+EVs (n = 7) and (c) CD81+EVs (n = 9). Individual values of biological replicates in . Bonferroni-corrected students t-test, * = p < 0.05, ** = p < 0.01, *** = p < 0.001.
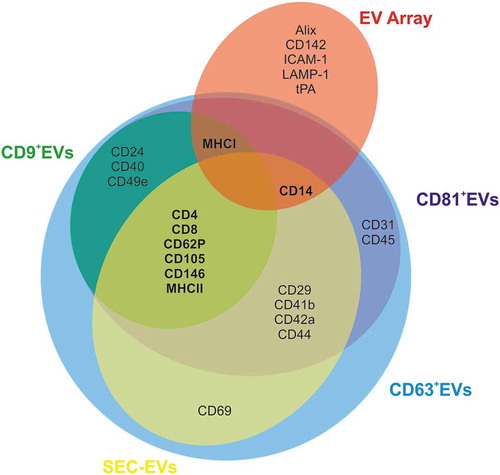
In summary, data collected using different EV-isolation and phenotyping strategies identify a reproducible ExerV marker pattern () providing evidence that ExerVs constitute a mixed population of EVs originating at least partially from leukocytes (including lymphocytes, monocytes and APC), endothelial cells and platelets.
Figure 9. Venn diagram summarizing ExerV-phenotyping. Circles depict unique and shared ExerV-markers that were significantly increased in the different isolation and characterization strategies (EV Array versus SEC-EVs versus bead-isolated EVs). Unique markers are only associated with EV Array performed on total plasma, while the different EV-isolation strategies, including bead-isolated EV-populations, largely share the same markers.
Discussion
Our study provides novel insights regarding the purification, characterization and origin of EVs released during physical exercise (ExerVs). Using stringent methodology for purification of EVs from plasma (SEC and immuno-isolation), we identified by semi-quantitative means an ExerV marker-profile that is highly consistent between different isolation procedures (). The ExerV profile hence appears highly reliable and indicates that endothelial cells, platelets and different subsets of leukocytes, including T-cells and antigen-presenting cells, release EVs upon exercise stimulation. EVs liberated during exercise were hypothesized to be involved in multisystemic signalling mediating regeneration and long-term adaptive responses [Citation11–Citation14,Citation42,Citation43]. Physical exercise produces an elevated level of shear-stress, as well as higher concentrations of reactive oxygen species [Citation44] and release of catecholamines [Citation45]. Furthermore, the activation of the hypothalamus-pituitary-adrenal axis including an increase of cortisol levels in the circulation can be observed upon exercise [Citation46]. These acute physiological alterations are accompanied by pro-thrombic as well as fibrinolytic reactions [Citation47], enhanced endothelial functions [Citation48] and the induction of an acute inflammatory reaction [Citation31,Citation49]. As a consequence, communication between several tissues and cells is required to maintain whole-body homeostasis and to restore or further enhance systemic performance levels. The finding that ExerVs in part originate from cells of the circulatory system is consistent with the notion that ExerVs may play a role in exercise-triggered processes such as improved cardiovascular function, immune-modulation, inflammation-associated tissue regeneration and regulation of coagulation, which were ascribed to EVs previously in other settings [reviewed in 7]. Which signals trigger the release of ExerVs from all these cell types and the target cells still remains to be elucidated.
Intriguingly, exercise leads to the liberation of EVs starting already at sub-maximal workload-levels. Similar to releases of cfDNA by exercise [Citation30,Citation50], increases of EVs can be observed within just a few minutes upon start of exercise in the aerobic–anaerobic transition state around the individual anaerobic threshold (IAT) with an RQ around 0.9. We regard these rapid releases of EVs as a first hint that ExerVs are released from cells that are not separated by the blood-tissue barrier. However, our phenotyping analysis was limited to a restricted marker panel represented in the multiplexed assay. Hence, we possibly could not define all cell populations contributing to the pool of ExerVs. Red blood cells and muscle cells, which are known to release EVs under various conditions [Citation51,Citation52], constitute potential ExerV sources. Yet, we did not find evidence that muscle cells or hepatic cells contribute to the ExerV pool in our exercise setting. In a recent study using acoustic trapping, ExerVs have been studied 1 h after exercise [Citation53]. Similar to us, the group reported the release of protein cargo of the respective ExerVs that mostly reflect proteins known to be released or expressed by either blood cells, or the endothelium. While this and our study points to a significant contribution of circulation-associated cells to the ExerV pool, further studies are required to uncover the full spectrum of ExerV sources and their specific content.
Another exciting aspect revealed by our study is that the level of ExerV-release varies between subjects, discriminating low responders and high responders. Although the factors contributing to this individual variation remain enigmatic, it can be expected that EV-release depends on the physiological background of the subjects and may be influenced by parameters like age, immune status, hormone levels or the metabolic state. It will be interesting to correlate the level of ExerV-release with different blood parameters and the ability of the individuals to respond to long-term training. However, we cannot completely rule out at present that ExerV measurement is influenced by pre-analytical factors. This may include factors present in the exercised blood like stress hormones that may affect cell activation and ExerV release status ex vivo especially in post-exercise samples. Yet, according to the existing literature [Citation23,Citation24], minor delays in plasma processing in presence of the anticoagulant EDTA (as occurred in our study) is not expected to affect the release of EVs from platelets or other cells.
We characterized ExerV presence and dynamics using two multiplexed marker assays and verified specific EV-markers by Western blotting, applying blood plasma (EV-Array) as well as SEC-isolated EVs, CD9+EVs, CD63+EVs and CD81+EVs. We obtained consistent results for EV-dynamics and the origin of ExerVs in all parallel examinations emphasizing the strength of the analysis and reliability of the results. The use of multiplexed assays offered the possibility to analyse a variety of markers in limited sample material to gain more detailed information on the cellular source of ExerVs. Yet, these are semi-quantitative antibody-based workflows that are susceptible to bias introduced by antibody affinity and possible epitope blocking [Citation41]. The longitudinal analysis of plasma samples derived from one individual within less than 1 h allows interpretation of ExerV release kinetics on the level of single markers but may be limited with regard to a direct quantitative comparison of different markers. Furthermore, increase in marker signal intensity can be related to higher vesicle numbers or higher marker density in the vesicles. Since marker increases are observed within minutes during exercise, most likely the level of EV-release is increased in responsive cell populations resulting in a higher number and an altered mix of EVs in the circulation upon stimulation by exercise. Finally, more detailed insight into ExerV dynamics will require further development of high throughput single EV-analysis techniques that allow reliable detection of EVs also in the size range of small EVs around or below 200 nm [Citation54,Citation55].
Intriguingly, we observed only a few differences in the surface signatures and kinetics of the differentially isolated ExerVs. For example, EVs derived from activated platelets appeared more prominent in SEC-EVs and CD9+EVs as compared to CD63+EVs and CD81+EVs. This underscores the reliability of our ExerV isolation workflows and is in contrast to a growing number of studies applying different EV isolation strategies on the same sample material and reporting strikingly diverse downstream analysis results. For example, van Deun et al. demonstrated a bias on the analysis of the EV mRNA profiles comparing differential centrifugation precipitation and density gradient purification of EVs [Citation56], emphasizing the need for more coherent criteria of EV isolation.
In agreement with other studies, our study suggests that NTA analysis of plasma EVs is strongly affected by circulating lipoproteins that co-purify with EVs. NTA was not able to resolve the more than twofold increase in ExerVs detected by other marker-based analyses. Furthermore, we observed strong differences in absolute particle concentrations of SEC-EVs using NTA after intake of a high-fat meal prior to the exercise test compared to fasting conditions. Although this effect was assessed for only one subject by directly comparing pre- and postprandial conditions, it is in line with the general view on the bias introduced by co-isolated chylomicrons and lipoproteins in plasma EV samples [Citation36,Citation38]. Sodar et al. demonstrated that lipoproteins co-purify with and decorate EVs interfering with vesicle analysis. Similarly, for differential centrifugation of blood plasma EVs it was recently demonstrated that 66% of the variation in particle concentration in the postprandial state measured by NTA can be attributed to VLDL co-isolation [Citation37]. We, therefore, caution that current NTA-technology (not involving specific marker detection) is not reliable in determining dynamic alterations of plasma EVs and produces misleading results even on SEC isolated plasma EVs. Variations in EV particle counts have to be validated by EV-marker analysis.
Our data are in accordance with the characteristics of EV-release in response to exercise described in the present literature and provides comprehensive information on the composition of ExerV populations originating from distinct parental cells. A group of studies focused on the role of large microparticles (MP) present in the circulation upon physical activity. In total, these studies report a short-term rise in pro-coagulative MPs originating from activated platelets during and few hours after exercise [Citation57–Citation59] as well as increasing endothelial cell MP-levels 24 h following an acute bout of exercise, which is attributed to apoptotic processes [Citation59, reviewed by Citation15]. Two studies additionally observed the release of MP from monocytes [Citation59] and neutrophils [Citation57]. Changes in MP counts were analysed by conventional flow cytometry focusing on endothelial and platelet characteristics. Since these measurements are restricted to EVs above the size of 500 nm and small EVs will be under-represented, it is unclear to what extend smaller EVs below 500 nm actually contribute to vesicle enumeration in these studies [Citation60,Citation61]. A few studies focus on the presence of small EVs in the circulation after physical activity by applying single particle analysis methods and the examination of the protein content. An increase of EV numbers upon bouts of acute exercise was repeatedly reported despite a lack of consistent isolation strategies. More specific analyses addressed contribution of muscle cell-derived EVs to the pool of plasma EVs and were directed on the possible regenerative functions of small EVs released upon exercise [Citation10–Citation14,Citation39,Citation43,Citation62]. Recently, Whitham et al. postulated a model of exercise-mediated tissue cross-talk, including systemic release of EVs in response to exercise, myokine transport in EVs originating from muscle cells and ExerV-uptake in the liver [Citation14]. The study provides a systematic proteomic characterization of a crude EV preparation retrieved by low-speed centrifugation that was postulated to reflect small EVs but lacks characterization of released EV-types and the contribution of different parental cells.
Our study aimed at a broader phenotyping of ExerVs allowing allocation of ExerV origin and the initial identification of markers that may give further indications of ExerV function. The elevation of CD41b-, CD42a- and CD62P-positive platelet EVs indicates that liberation of EVs by activated platelets is not restricted to large EVs (>500 nm) but also includes smaller EV populations. Furthermore, CD31- (shared by platelets and endothelial cells), CD105- and CD146-positive endothelial EVs, are increasing immediately after exercise demonstrating endothelial ExerV-release that can be clearly discriminated from apoptosis, which would lead to higher EV counts only at later stages. Interestingly, a fraction of ExerVs appears to originate from leukocytes including lymphocytes (CD4+ and CD8+ExerVs), monocytes (CD14+ExerVs) and antigen-presenting cells (MHC-II+ExerVs) which, except for monocytic origin of MPs, has not been described before. Information on ExerV origin and their marker profile are essential to address specific questions also with regard to their function. However, it is important to consider that only a few markers are exclusively found on the surface of only one cell type. While platelet markers and lymphocytic markers are highly specific, e.g. CD105 and CD146, prominently found on endothelial cells and EVs, are also present on mesenchymal stromal cell subtypes and their EVs [Citation63–Citation65]. Likewise, CD14 is mainly associated with monocytes/macrophages, but also present on the surface of neutrophils, though at lower levels [Citation66]. Analyses in a more defined setting using further isolated EV subclasses to avoid expected confounding effects of heterogeneous EV-mixtures [Citation67] will further shed light on the complex composition of ExerVs and their possible functions. Of note, integrins such as CD29 (integrin β-1), CD41b (integrin αIIβ) and CD49e (integrin α-5) are found on the surface of all ExerV subclasses and could play a role for the targeting selectivity of ExerVs. Together, these findings highlight the complexity of EV signalling during exercise and expand the spectrum of conceivable functions of ExerVs.
In conclusion, we provide evidence for ExerV-origin at least in part from various cell types of the circulatory system, verified by different procedures of EV isolation and characterization. This finding suggests a complex EV-signalling network with potential implications in vascular functionality, immune modulation including adaptive immunity, platelet function and regeneration. Future studies are required to unravel potential other ExerV sources, their specific role in tissue crosstalk and mode of action in target cells. Identification of ExerV signalling mechanisms associated with adaptational benefits of exercise may translate into future diagnostic and therapeutic applications of ExerVs.
Author contributions
AB, PS, EMKA conceived and designed experiments. AB, EN, LEH, NH, RB, WM performed experiments. AB, MJ, EMKA, PS, EN collected and analysed data. AB, EMKA wrote the manuscript.
Disclosure of interest
None
Supplemental Material
Download MS Word (8.3 MB)Acknowledgments
We are grateful to the volunteers participating in the study and thank all persons involved in performance diagnostics. We thank Stefan Wild and Ute Heider, from Miltenyi Biotec for technical support. AB received STSM support from COST action BM1202 ME-HAD. WM was supported by the Cluster of Excellence and DFG Research Center Nanoscale Microscopy and Molecular Physiology of the Brain.
Supplementary material
Supplementary material data can be accessed here
Additional information
Funding
Related Research Data
References
- Walsh NP, Gleeson M, Pyne DB, et al. Position statement. Part two: maintaining immune health. Exerc Immunol Rev. 2011;17:64–19.
- Heinonen I, Kalliokoski KK, Hannukainen JC, et al. Organ-specific physiological responses to acute physical exercise and long-term training in humans. Physiology. 2014;29:421–436.
- Zierath JR, Wallberg-Henriksson H. Looking ahead perspective: where will the future of exercise biology take us? Cell Metab. 2015;22:25–30.
- Leal LG, Lopes MA, Batista ML Jr. Physical exercise-induced myokines and muscle-adipose tissue crosstalk: a review of current knowledge and the implications for health and metabolic diseases. Front Physiol. 2018;9:1307.
- Pedersen BK, Febbraio MA. Muscles, exercise and obesity: skeletal muscle as a secretory organ. Nat Rev Endocrinol. 2012;8:457–465.
- van Niel G, D’Angelo G, Raposo G. Shedding light on the cell biology of extracellular vesicles. Nat Rev Mol Cell Biol. 2018;19:213–228.
- Yáñez-Mó M, Siljander PR-M, Andreu Z, et al. Biological properties of extracellular vesicles and their physiological functions. J Extracell Vesicles. 2015;4:27066.
- Lötvall J, Hill AF, Hochberg F, et al. Minimal experimental requirements for definition of extracellular vesicles and their functions: a position statement from the international society for extracellular vesicles. J Extracell Vesicles. 2014;3:26913.
- Kowal J, Arras G, Colombo M, et al. Proteomic comparison defines novel markers to characterize heterogeneous populations of extracellular vesicle subtypes. Proc Natl Acad Sci U S A. 2016;113:E968–977.
- Oliveira GP Jr., Porto WF, Palu CC, et al. Effects of acute aerobic exercise on rats serum extracellular vesicles diameter, concentration and small RNAs content. Front Physiol. 2018;9:532.
- Bei Y, Xu T, Lv D, et al. Exercise-induced circulating extracellular vesicles protect against cardiac ischemia-reperfusion injury. Basic Res Cardiol. 2017;112:38.
- Frühbeis C, Helmig S, Tug S, et al. Physical exercise induces rapid release of small extracellular vesicles into the circulation. J Extracell Vesicles. 2015;4:28239.
- Chaturvedi P, Kalani A, Medina I, et al. Cardiosome mediated regulation of MMP9 in diabetic heart: role of mir29b and mir455 in exercise. J Cell Mol Med. 2015;19:2153–2161.
- Whitham M, Parker BL, Friedrichsen M, et al. Extracellular vesicles provide a means for tissue crosstalk during exercise. Cell Metab. 2018;27:237–251 e234.
- Eichner NZM, Erdbrugger U, Malin SK. Extracellular vesicles: a novel target for exercise-mediated reductions in type 2 diabetes and cardiovascular disease risk. J Diabetes Res. 2018;2018:7807245.
- Wilhelm EN, Mourot L, Rakobowchuk M. Exercise-derived microvesicles: a review of the literature. Sports Med. 2018;48:2025–2039.
- Highton PJ, Martin N, Smith AC, et al. Microparticles and exercise in clinical populations. Exerc Immunol Rev. 2018;24:46–58.
- Baietti MF, Zhang Z, Mortier E, et al. Syndecan-syntenin-ALIX regulates the biogenesis of exosomes. Nat Cell Biol. 2012;14:677–685.
- Borg GA. Psychophysical bases of perceived exertion. Med Sci Sports Exerc. 1982;14:377–381.
- Bergman BC, Brooks GA. Respiratory gas-exchange ratios during graded exercise in fed and fasted trained and untrained men. J Appl Physiol. 1985. 1999;86:479–487.
- Roecker K, Striegel H, Dickhuth HH. Heart-rate recommendations: transfer between running and cycling exercise? Int J Sports Med. 2003;24:173–178.
- Breitbach S, Tug S, Helmig S, et al. Direct quantification of cell-free, circulating DNA from unpurified plasma. PLoS One. 2014;9:e87838.
- Lacroix R, Judicone C, Poncelet P, et al. Impact of pre-analytical parameters on the measurement of circulating microparticles: towards standardization of protocol. J Thromb Haemost. 2012;10:437–446.
- Fendl B, Weiss R, Fischer MB, et al. Characterization of extracellular vesicles in whole blood: influence of pre-analytical parameters and visualization of vesicle-cell interactions using imaging flow cytometry. Biochem Biophys Res Commun. 2016;478:168–173.
- Baek R, Jørgensen MM. Multiplexed Phenotyping of Small Extracellular Vesicles Using Protein Microarray (EV Array). In: Hill AF, editor. Exosomes and Microvesicles: methods and Protocols. New York: Springer New York; 2017. p. 117–127.
- Boing AN, van der Pol E, Grootemaat AE, et al. Single-step isolation of extracellular vesicles by size-exclusion chromatography. J Extracell Vesicles. 2014;3.
- Gardiner C, Ferreira YJ, Dragovic RA, et al. Extracellular vesicle sizing and enumeration by nanoparticle tracking analysis. J Extracell Vesicles. 2013;2.
- Gu Z, Eils R, Schlesner M. Complex heatmaps reveal patterns and correlations in multidimensional genomic data. Bioinformatics. 2016;32:2847–2849.
- EV-Track consortium, Van Deun J, Mestdagh P, et al. EV-TRACK: transparent reporting and centralizing knowledge in extracellular vesicle research. Nat Methods. 2017;14:228–232.
- Beiter T, Fragasso A, Hudemann J, et al. Short-term treadmill running as a model for studying cell-free DNA kinetics in vivo. Clin Chem. 2011;57:633.
- Pedersen BK, Hoffman-Goetz L. Exercise and the immune system: regulation, integration, and adaptation. Physiol Rev. 2000;80:1055–1081.
- Jorgensen M, Baek R, Pedersen S, et al. Extracellular Vesicle (EV) Array: microarray capturing of exosomes and other extracellular vesicles for multiplexed phenotyping. J Extracell Vesicles. 2013;2.
- Takov K, Yellon DM, Davidson SM. Comparison of small extracellular vesicles isolated from plasma by ultracentrifugation or size-exclusion chromatography: yield, purity and functional potential. J Extracell Vesicles. 2019;8:1560809.
- Lobb RJ, Becker M, Wen SW, et al. Optimized exosome isolation protocol for cell culture supernatant and human plasma. J Extracell Vesicles. 2015;4:27031.
- Welton JL, Webber JP, Botos LA, et al. Ready-made chromatography columns for extracellular vesicle isolation from plasma. J Extracell Vesicles. 2015;4:27269.
- Sodar BW, Kittel A, Paloczi K, et al. Low-density lipoprotein mimics blood plasma-derived exosomes and microvesicles during isolation and detection. Sci Rep. 2016;6:24316.
- Jamaly S, Ramberg C, Olsen R, et al. Impact of preanalytical conditions on plasma concentration and size distribution of extracellular vesicles using nanoparticle tracking analysis. Sci Rep. 2018;8:17216.
- Simonsen JB. What are we looking at? Extracellular vesicles, lipoproteins, or both? Circ Res. 2017;121:920–922.
- Guescini M, Canonico B, Lucertini F, et al. Muscle releases alpha-sarcoglycan positive extracellular vesicles carrying miRNAs in the bloodstream. PLoS One. 2015;10:e0125094.
- Koliha N, Wiencek Y, Heider U, et al. A novel multiplex bead-based platform highlights the diversity of extracellular vesicles. J Extracell Vesicles. 2016;5:29975.
- Wiklander OPB, Bostancioglu RB, Welsh JA, et al. Systematic methodological evaluation of a multiplex bead-based flow cytometry assay for detection of extracellular vesicle surface signatures. Front Immunol. 2018;9:1326.
- Safdar A, Tarnopolsky MA. Exosomes as mediators of the systemic adaptations to endurance exercise. Cold Spring Harb Perspect Med. 2018;8.
- Lovett JAC, Durcan PJ, Myburgh KH. Investigation of circulating extracellular vesicle microRNA following two consecutive bouts of muscle-damaging exercise. Front Physiol. 2018;9:1149.
- He F, Li J, Liu Z, et al. Redox mechanism of reactive oxygen species in exercise. Front Physiol. 2016;7:486.
- Weltman A, Wood CM, Womack CJ, et al. Catecholamine and blood lactate responses to incremental rowing and running exercise. J Appl Physiol. (1985). 1994;76: 1144–1149.
- Duclos M, Tabarin A. Exercise and the hypothalamo-pituitary-adrenal axis. Front Horm Res. 2016;47:12–26.
- Womack CJ, Nagelkirk PR, Coughlin AM. Exercise-induced changes in coagulation and fibrinolysis in healthy populations and patients with cardiovascular disease. Sports Med. 2003;33:795–807.
- Vanhoutte PM, Shimokawa H, Feletou M, et al. Endothelial dysfunction and vascular disease - a 30th anniversary update. Acta Physiol (Oxf). 2017;219:22–96.
- Nieman DC, Pedersen BK. Exercise and immune function. Recent developments. Sports Med. 1999;27:73–80.
- Helmig S, Frühbeis C, Krämer-Albers EM, et al. Release of bulk cell free DNA during physical exercise occurs independent of extracellular vesicles. Eur J Appl Physiol. 2015;115:2271–2280.
- Vidal M. Exosomes in erythropoiesis. Transfus Clin Biol. 2010;17:131–137.
- Chaudhary SC, Khalid S, Smethurst V, et al. Proteomic profiling of extracellular vesicles released from vascular smooth muscle cells during initiation of phosphate-induced mineralization. Connect Tissue Res. 2018;59:55–61.
- Bryl-Gorecka P, Sathanoori R, Al-Mashat M, et al. Effect of exercise on the plasma vesicular proteome: a methodological study comparing acoustic trapping and centrifugation. Lab Chip. 2018;18:3101–3111.
- Lannigan J, Erdbruegger U. Imaging flow cytometry for the characterization of extracellular vesicles. Methods. 2017;112:55–67.
- Varga Z, Yuana Y, Grootemaat AE, et al. Towards traceable size determination of extracellular vesicles. J Extracell Vesicles. 2014;3.
- Van Deun J, Mestdagh P, Sormunen R, et al. The impact of disparate isolation methods for extracellular vesicles on downstream RNA profiling. J Extracell Vesicles. 2014;3.
- Chaar V, Romana M, Tripette J, et al. Effect of strenuous physical exercise on circulating cell-derived microparticles. Clin Hemorheol Microcirc. 2011;47:15–25.
- Rakobowchuk M, Ritter O, Wilhelm EN, et al. Divergent endothelial function but similar platelet microvesicle responses following eccentric and concentric cycling at a similar aerobic power output. J Appl Physiol. 2017;122:1031–1039.
- Sossdorf M, Otto GP, Claus RA, et al. Cell-derived microparticles promote coagulation after moderate exercise. Med Sci Sports Exerc. 2011;43:1169–1176.
- Erdbrügger U, Lannigan J. Analytical challenges of extracellular vesicle detection: A comparison of different techniques. Cytometry A. 2016;89:123–134.
- Erdbrügger U, Rudy CK, Etter ME, et al. Imaging flow cytometry elucidates limitations of microparticle analysis by conventional flow cytometry. Cytometry A. 2014;85:756–770.
- Bertoldi K, Cechinel LR, Schallenberger B, et al. Circulating extracellular vesicles in the aging process: impact of aerobic exercise. Mol Cell Biochem. 2018;440:115–125.
- Eirin A, Zhu XY, Puranik AS, et al. Comparative proteomic analysis of extracellular vesicles isolated from porcine adipose tissue-derived mesenchymal stem/stromal cells. Sci Rep. 2016;6:36120.
- Lindoso RS, Collino F, Bruno S, et al. Extracellular vesicles released from mesenchymal stromal cells modulate miRNA in renal tubular cells and inhibit ATP depletion injury. Stem Cells Dev. 2014;23:1809–1819.
- Börger V, Bremer M, Görgens A, et al. Mesenchymal stem/stromal cell-derived extracellular vesicles as a new approach in stem cell therapy. ISBT Sci Ser. 2016;11:228–234.
- Antal-Szalmas P, Strijp JA, Weersink AJ, et al. Quantitation of surface CD14 on human monocytes and neutrophils. J Leukoc Biol. 1997;61:721–728.
- Tkach M, Kowal J, Thery C. Why the need and how to approach the functional diversity of extracellular vesicles. Philos Trans R Soc Lond B Biol Sci. 2018;373.