
ABSTRACT
Acetylcholinesterase (AChE) activity is found in abundance in reticulocytes and neurons and was developed as a marker of reticulocyte EVs in the 1970s. Easily, quickly, and cheaply assayed, AChE activity has more recently been proposed as a generic marker for small extracellular vesicles (sEV) or exosomes, and as a negative marker of HIV-1 virions. To evaluate these proposed uses of AChE activity, we examined data from different EV and virus isolation methods using T-lymphocytic (H9, PM1 and Jurkat) and promonocytic (U937) cell lines grown in culture conditions that differed by serum content. When EVs were isolated by differential ultracentrifugation, no correlation between AChE activity and particle count was observed. AChE activity was detected in non-conditioned medium when serum was added, and most of this activity resided in soluble fractions and could not be pelleted by centrifugation. The serum-derived pelletable AChE protein was not completely eliminated from culture medium by overnight ultracentrifugation; however, a serum “extra-depletion” protocol, in which a portion of the supernatant was left undisturbed during harvesting, achieved near-complete depletion. In conditioned medium also, only small percentages of AChE activity could be pelleted together with particles. Furthermore, no consistent enrichment of AChE activity in sEV fractions was observed. Little if any AChE activity is produced by the cells we examined, and this activity was mainly present in non-vesicular structures, as shown by electron microscopy. Size-exclusion chromatography and iodixanol gradient separation showed that AChE activity overlaps only minimally with EV-enriched fractions. AChE activity likely betrays exposure to blood products and not EV abundance, echoing the MISEV 2014 and 2018 guidelines and other publications. Additional experiments may be merited to validate these results for other cell types and biological fluids other than blood.
Introduction
Extracellular vesicles (EVs) function in intercellular communication and are considered an attractive component of the “liquid biopsy” in part because EV molecular markers may identify parental cells [Citation1–Citation3]. EVs and subset populations are variously defined by biogenesis, size and density, morphology, protein markers, and combinations thereof [Citation4]. A wealth of molecules, especially proteins, have been proposed as markers of EVs or EV subsets, but heterogeneity and technical biases of different isolation protocols present challenges to defining a single generic marker of EVs from multiple sources [Citation5–Citation7]. The MISEV 2014 and 2018 minimal information guidelines of the International Society for Extracellular Vesicles (ISEV) [Citation8,Citation9] recommend characterization of multiple EV markers (i.e. tetraspanins, cytosolic ESCRTs, Rabs) as well as absence of putatively EV-depleted markers (i.e. calnexin, GM130, cytochrome C) before assigning functions to EVs in biological systems. Caution is also urged when using extracellular proteins that have been historically associated with EVs but that may not be universal markers.
One such extracellular protein is acetylcholinesterase (AChE). AChE is produced in abundance by neurons and red blood cells (RBCs). In vertebrates, two cholinesterases (ChEs), AChE and butyrylcholinesterase (BChE), hydrolyse the neurotransmitter acetylcholine (ACh) into acetic acid and choline [Citation10–Citation13]. Different ChE forms arise from alternative splicing events and multimerization (G4, G2 and G1), with different tissue specificity and isoform abundance across species [Citation11,Citation13–Citation15]. G4 AChE-S (S for “synaptic”) is soluble, while G2 AChE-E (E for “erythrocyte”) is anchored in the external leaflet of the erythrocyte membrane by glycosylphosphatidylinositol (GPI). Soluble and anchored forms of AChE as well as relative abundance of AChE and BChE may vary in the serum of different species [Citation10,Citation15–Citation19].
EVs produced by reticulocytes during maturation towards erythrocytes, and by drug-treated erythrocytes, were studied intensively beginning in the 1970s [Citation20–Citation27], and AChE activity was among the regularly studied characteristics of these membranes. EVs were typically characterized by known reticulocyte and erythrocyte phenotype in relation to membrane- and cytosolic enzymes, including the lipid-anchored AChE-E [Citation12,Citation14]; lipid analysis by conventional biochemistry; and morphology, as assessed by electron microscopy [Citation22,Citation24,Citation26,Citation27]. Higher AChE-E enzyme activity (normalized by total protein) was reported for “nanovesicles” pelleted at 100,000 x g compared with microvesicles pelleted at 16,000 x g or bulk plasma membrane [Citation24,Citation26]. In these studies, vesicle release was in some cases induced biochemically; elsewhere, EV release was associated with reticulocyte maturation and erythrocyte aging [Citation22,Citation24], consistent with other reports [Citation12]. Thus, by the late 1970s, AChE was well validated as a marker of RBC EVs, and was used as such in the 1980s [Citation22,Citation24] as well as in later work on reticulocytes and erythroleukemia [Citation28–Citation30]. Interestingly, though, AChE is now sometimes used as a generic marker of EVs or of late endosome-origin “exosomes” [Citation31–Citation34], including in commercial quantitation kits. This, despite the unclear relevance of many of the cells under investigation to neuronal or erythrocyte systems. Furthermore, AChE is presumably found in the serum commonly used in cell cultures and may thus be exogenous.
To evaluate the tenability of AChE activity as a generic EV marker, we tested AChE activity in materials gathered using multiple isolation methods from multiple cell lines and sources, under cell culture conditions varying by the presence of serum, and in two different laboratories. We conclude that, except possibly in systems with high AChE activity such as reticulocytes or neurons, AChE is unlikely to be useful as a generic EV marker, since it is mostly present in structures other than EVs. Furthermore, an apparent association of AChE with EVs can be a technical artefact of serum-containing cell culture or isolation from biological sources.
Results
Reasoning that an extremely robust association between AChE and extracellular particle counts might be noticeable even across experiments and systems, we first searched for an overall correlation between particle counts and AChE activity compiled from numerous experiments (n = 37) involving EVs from culture medium in which both particle counts and AChE activity had been measured. No significant association between AChE activity and particle counts was observed (Supplemental Figure 1). However, numerous factors might obscure a real relationship between AChE and EVs when data from multiple experiments are assessed together. These factors range from different sources of serum and different cell types to time-, setting-, and operator-dependent variability of AChE activity assays or nanoparticle tracking analyses (NTA). Therefore, we examined the correlation of particle count and AChE activity across similar experiments or within the same experiment. For all experiments, no significant correlation of AChE activity and particle counts was observed. To provide a few examples, this was the case for 100,000 x g (100 K) pellets from serum-free culture of H9 cells (,)). Measuring particle count with NTA instruments from different manufacturers did not affect results (,)): particle counts by NanoSight NS500 and Particle Metrix Zeta View, respectively). Fractions from the U937 promonocytic line also showed no association of particle count with AChE activity ()).
Figure 1. Acetylcholinesterase activity and particle counts do not correlate. (a) AChE activity (measured within 4 hr after separation) and particle counts of 100 K pelleted EVs from H9 cells measured by (a) NanoSight NS500 (camera setting 12) or (b) ParticleMetrix ZetaView (JHU settings, see Materials and Methods). (c) AChE activity and particle counts of EVs from U937 cells (ZetaView, JHU settings).
Limited AChE activity is recovered by pelleting unconditioned media
Serum-free media (AIM V and RPMI) and serum-containing medium (10% FBS in RPMI = R10) were processed (180 mL each) by differential centrifugation to determine the presence of AChE activity in differentially centrifuged pellets of non-conditioned medium (NCM) as well as unprocessed (whole) NCM. No AChE activity was detected in either of the two serum-free non-conditioned media or, as would be expected, in centrifuge pellets obtained from NCM at increasing centrifugation speeds ()). In contrast, high levels of AChE activity were found in serum-containing NCM ()). Only a small percentage of this activity (approximately 1% total in these experiments) could be recovered from pellets obtained by successively higher-speed centrifugations ()). Here, slightly more AChE activity was recovered from the 100 K pellet than from the 2,000 x g (2 K) and 10,000 x g (10 K) pellets, although this difference may be serum batch- or experiment-dependent.
Figure 2. Most AChE activity in serum-containing medium is not pelletable. (a) AChE activity was not detected in serum-free media formulations (AIM Vand RPMI-1640 NCM), but was found at high levels in serum-containing medium (R10 = RPMI 10% FBS NCM). Differential ultracentrifugation of AIM Vand RPMI recovered no activity in differentially centrifuged pellets (2 K, 10 K, 100 K). From serum-containing medium, only a very small fraction of total AChE activity could be recovered by differential centrifugation, and values in complete NCM. (b) After conditioning medium with 72 h culture of PM1 lymphocytic cells, similar amounts of AChE activity as in (a) could be pelleted from serum-containing medium. Comparatively smaller amounts were recovered when cells were switched to AIM V medium.
Limited AChE activity is recovered by pelleting from serum-replete or serum-free cell culture conditioned media
To assess the ability of cultured cells to release AChE, culture conditioned media (CCM) were prepared with T-lymphocytic line PM1 grown and maintained in 10% FBS medium (R10) or switched to serum-free medium (AIM V). CCM was fractionated by differential ultracentrifugation as before. A small amount of AChE activity was detected in sequential centrifugation pellets, and more activity was generally but not always recovered in the 100 K pellet than in the lower-speed pellets ()). From cultures switched to serum-free medium, some AChE activity was detected in the pelleted material, although about 10 times less than from cells cultured in serum-replete medium, and AChE activity was on average lower in the 100 K pellet than in others ()).
In comparison with particle counts, AChE activity is relatively unaffected by conditioning and centrifugation
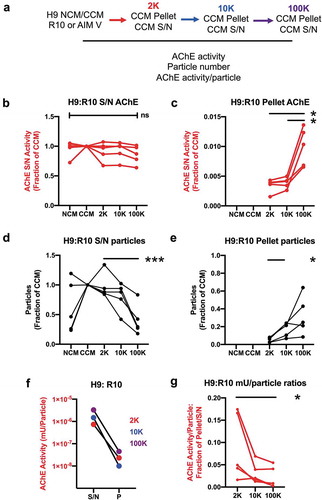
Examining the data in a different way, we reasoned that, if AChE were a generic marker of EVs, AChE activity should be higher on a per-particle basis in EV-enriched compared with supernatant fractions. We thus followed AChE activity and particle counts from NCM to CCM and through successive centrifugation steps in both pellet and supernatant (see experimental scheme in )). H9 cells were used to condition the serum-containing (R10) medium. For serum-containing medium, total AChE units were within the range measured across all experiments reported herein (from approximately 1–4 × 10⁵ mU/180 mL NCM and CCM). Across experiments, total levels of AChE were not strongly affected by conditioning, nor did successive rounds of centrifugation (2 K, 10 K, 100 K) result in substantial depletion of AChE from supernatants ()). Although inconsistent reduction in AChE activity in supernatants was observed in several experiments (up to an apparent 40% in one experiment), examining the pellets, recovered AChE was insufficient to explain these reductions ()). Summing the activity in all pellets for each experiment, total AChE recovery averaged only 1.8% (1.4%-2.3%) of the amount in CCM. In contrast with AChE activity, particle counts were increased by conditioning by 2–5 fold in 3 of 5 experiments (but not in another 2, )). Successive centrifugation resulted in depletion of particles from the supernatant ()), such that 100 K supernatant consistently had particle levels at or below those of NCM. These particles were recovered in pellets ()). Adding together the particle counts from 2 K, 10 K, and 100 K pellets and comparing with the particle count in each CCM, the total percentage of pelleted particles averaged 54.1% (range: 17.6%-93.3%). Thus, AChE activity was neither added by conditioning nor depleted by centrifugation to the same extent as particles. AChE activity normalized per particle was up to 100 times lower in any given pellet as compared with its corresponding supernatant ()). Across experiments, the pellet: supernatant ratio of activity/particle was low, and significantly lower for 100 K than for 2 K samples ()).
Figure 3. Compared with particle counts, AChE activity is relatively unaffected by conditioning and centrifugation. (a) Scheme of experimental workflow. NCM (R10, shown here, or AIM V, See supplement) was conditioned (CCM) by 72 hr culture of H9 lymphocytic cells. 2 K, 10 K, and 100 K supernatant (S/N) and pellet (P) fractions were obtained. AChE activity and particle counts were measured by activity assay and ZetaView NTA (JHU settings), respectively, for all fractions, and adjusted for total activity (AChE, miliUnits) or particle counts in the original culture volume. (b) Conditioning of R10 and successive depletion of CCM by centrifugation resulted in no significant changes in S/N AChE levels (n = 5). (c) Centrifuge pellets corresponding to the depletion steps in (b) contained only a small amount of total AChE and could not explain minor apparent fluctuations in S/N AChE. (d) Particle counts for the same experiments showed that particles could be depleted progressively from S/N by differential centrifugation (2 K, 10 K, 100 K), reaching significant differences with the 100 K step despite substantial variability. (e) Particles depleted from S/N were substantially recovered in the pellets. (f) Per-particle AChE activity is highest in supernatants, not pellets, and is not enriched in presumed sEV-enriched fractions (representative data of n= 5 experiments). (g) Ratio of per-particle activity of pellets vs corresponding supernatants: the ratio is significantly higher after the low-speed step (2 K) rather than after the presumably sEV-enriching high-speed step (100 K). For all panels, data were compared using ANOVA for matched data and with Tukey’s post-test to correct for multiple comparisons; *: p < 0.05; ***: p < 0.0001. However, for panels B and D, the normalizing group was excluded from analysis because values were set equal to one. Data are from five independent experiments with three technical (measurement) replicates each.
In serum-free conditions (AIM V), AChE activity was below the limit of quantitation of our assay in all fractions of supernatant and all pellets except for the 10 K pellet (which was around the limit of quantitation). In contrast, particle addition and depletion by conditioning and ultracentrifugation was consistent with the results above (Supplemental Figure 2). Conditioning increased particle number by approximately fourfold, and centrifugation reduced particles 10-fold. 60.5% of particles were recovered in the centrifuge pellets.
Bovine AChE protein and non-vesicle-associated AChE are co-isolated with cell-derived, mostly AChE-negative EVs
We next used Western blotting (WB) to determine the presence of AChE in EV-containing pellets, regardless of its enzymatic activity. For these experiments, another T lymphocytic cell line (Jurkat) was cultured in serum-free (TexMACS, Miltenyi) or serum-containing (10% FBS) RPMI medium, and the medium was processed by differential ultracentrifugation as above. The full-length protein was readily detected in the 2 K and 100 K pellets recovered from 20 ml of 10% FBS-medium, both non-conditioned (NCM) and conditioned for 48 h by 20 million cells (CCM, )). By contrast, when analysing TexMACS medium, we detected AChE mainly in the 2 K pellets of CCM (occasionally in the 100 K), and not in NCM pellets ()). Since EVs are present in FBS, a recommended practice to isolate EVs released by cultured cells without contamination by FBS-derived EVs is to pre-deplete FBS-containing medium of EVs by overnight ultracentrifugation [Citation35–Citation37]. 2 K pellets from EV-depleted serum-containing NCM still contained AChE, whereas the 100 K pellets did not ()). However, when taking extra care to recover only “extra-depleted medium”– by pipetting supernatant from the top down and leaving 10% of medium over the overnight ultracentrifugation pellet, instead of inverting the tube onto a sterilizing filter [Citation38]– we could no longer pellet substantial AChE activity in the 2 K pellet of NCM (“extra-depleted”, )). In contrast, Jurkat cells incubated with an extra-depleted medium still appeared to release AChE, mainly in the 2 K pellet, but also some in the 100 K pellet. Thus, AChE may be, in part, secreted from human T-cells, but is not enriched in sEVs, and bovine AChE can be a source of AChE detected in exosome- and sEV-containing pellets. Moreover, when we analysed 2 K, 10 K and 100 K pellets obtained from extra-depleted CCM by electron microscopy (–h)), we found that AChE signal was mainly associated with small, slightly electrodense structures that seem to be devoid of the lipid bilayer characteristic of EVs. Some AChE+ vesicles were found in the 2 K pellets, but vesicles in the 100 K pellet seem to be mainly negative for AChE, although sometimes with AChE+ structures sticking to them. In fact, double labelling of 100 K pellets with anti-AChE and anti-CD63 antibodies demonstrated that, in most cases, the two proteins were not on the same structures. Structures positive for CD63 are clearly lipid bilayer vesicles ()).
Figure 4. Detection of AChE by Western blot in pellets from different Jurkat cell-conditioned medium (CCM) and non-conditioned medium (NCM). Left panels = representative WB, right panels, quantification of the AChE signals in 3 to 6 independent Western blots. AU = AChE band intensity in a given pellet/sum (AChE band intensity in all 6 pellets). (a) RPMI with 10% FBS. (b) Serum-free TexMACSTM medium. (c) RPMI-10% FBS depleted from serum EVs by overnight ultracentrifugation. (d) RPMI-10% FBS extra-depleted of serum EVs by overnight ultracentrifugation leaving out 5ml above pellet. 2 K, 10 K100 K = pellets recovered from 20ml of CCM or NCM. AChE is clearly detected in non-conditioned serum-containing medium (a), and is only partially depleted by EV depletion (c). (e-g) Representative images of immunogold labelling for AChE of 2 K, 10 K and 100 K pellets recovered from conditioned medium (RPMI-10% extra-depleted of serum EVs). Close-ups of the areas inside white squares are shown. (h) CD63/AChE double stain of 100 k pellets recovered from Jurkat conditioned medium (extra-depleted from FBS).
Since the non-EV AChE+ structures could be proteins and other contaminants within vesicle preparations, we then used size-exclusion chromatography (SEC) as an additional separation step for 100 K pellets obtained from extra-depleted CCM. SEC allows vesicle elution in early fractions (e.g. 7–10 with the method we used, fractions 1 to 6 corresponding to the void volume of the column), prior to the bulk of non-vesicular proteins in fractions 13 and later [Citation39]. We then performed WB, NTA, and AChE activity measurements for fractions 6 to 14 (). We observed AChE by WB mainly in fractions 13 and 14 ()), coincident with the strongest AChE activity in these fractions ()). However, CD63 and CD81 markers were most enriched in fraction 9 ()), which is also the fractions with the highest particle counts and very low levels of AChE (,)). Moreover, EM confirmed that EV-enriched SEC fractions are almost devoid of AChE labelling ()), and that the small structures positive for AChE observed in CCM before SEC (-h)) are strongly decreased in the EV fractions after SEC. Finally, double labelling with CD63 and AChE antibodies confirms that sEVs containing CD63 (probably genuine endosome-derivedexosomes) are devoid of AChE, which is found in structures with non-vesicular appearance ()).
Figure 5. Separation of EVs from soluble proteins by size-exclusion chromatography. 100 K pellets from (extra-depleted) conditioned medium of Jurkat (a-d), and (commercial EV-depleted FBS) conditioned medium of H9 (e-f) and primary RBCs (g-h) were passed through a SEC column, and 14 fractions of 0.5 mL were collected. Western blot for CD63, CD81 (a, e, g) and AChE (a) of fractions 6–14 are shown. (b, f, h) Particle count (NTA) and AChE activity were measured in fractions 6–14 by ZetaView, with settings and measurement parameters as indicated in Materials and Methods for CT (b) or JHU (f, h) laboratories. (c, d) Representative overview and higher magnification images of immunogold labelling for AChE alone (c) or in combination with CD63 (d) of 100 K pellets recovered from Jurkat conditioned medium (extra-depleted from FBS).
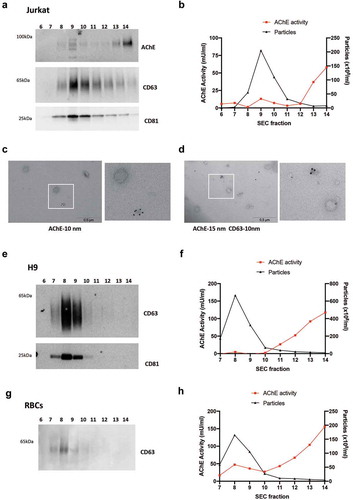
Similar results were obtained by SEC of 100 K pellets obtained from H9 cells cultured in medium supplemented with commercial EV-depleted FBS. Fractions 8 and 9 were most enriched in CD63 and CD81 ()) and had the highest particle counts ()), whereas AChE activity was enriched in fractions 13 and 14 ()). AChE activity was below the limit of detection for the EV fractions. In addition, we used primary human red blood cells (RBCs) since they are likely to express AChE. RBCs cultured in medium supplemented with commercial EV-depleted serum were used to obtain 100 K pellets that were further separated by SEC. In these conditions, RBCs did not release as many EVs as H9 cells (,h)), but did release measurable AChE along with CD63 in fractions 7–9 (,h)). However, the majority of AChE activity was again found in the non-EV-containing fractions ()).
AChE activity appears in the least dense and most particle-depleted velocity gradient fractions
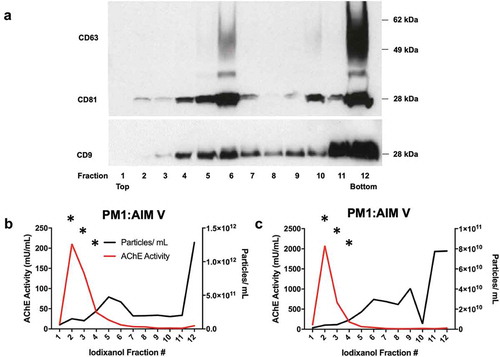
We finally applied iodixanol velocity gradient separation [Citation40] to determine the level of association of AChE and AChE activity with vesicle or viral fractions of 100 K pellets from Jurkat cells infected with pseudotyped HIV-1(NL4-3) and PM1 infected with HIV-1(BaL). For Jurkat, six fractions were obtained. A representative image of a Western blot of CD63 ()) revealed this tetraspanin in middle and bottom fractions, corresponding to host vesicles and virions, respectively. In contrast, AChE protein was detected in the top, lightest fractions ()), and HIV p24 ()) was found in the bottom, heavy fractions. For PM1 CCM, because of availability of different rotors in the different laboratories, we used another variation of the gradient protocol [Citation40], with 12 fractions collected. Tetraspanins CD63, CD81, and CD9 were detected in both middle and bottom fractions ()); presumably sEV-depleted cellular proteins GM130 and calnexin were strongly depleted or not detected across fractions (Supplemental Figure 3(a)). Particle counts by NTA were highest in the bottom, virion-containing fractions, and also detectable in middle fractions, whereas AChE activity was predominantly in the top, light fractions ()). Bottom, heavy fractions contained most HIV-1 p24 protein as measured by ELISA and WB (Supplemental Figure 3B, C).
Figure 6. Detection of AChE, EV- and virus-associated proteins in iodixanol velocity gradients of small EVs released by HIV-infected Jurkat cells. (a) Representative Western Blots showing six fractions recovered from iodixanol gradients of the 100 K pellet of Jurkat infected with HIV(NL4-3) virus (extra-depleted medium). Viral p24 protein is recovered in the bottom fractions, cellular CD63 in the middle and bottom fractions, AChE in the top fractions. (b, c) quantification of the AChE and p24 signals in three independent Western blots. AU = band intensity in agiven pellet/sum (band intensity in all 6 pellets).
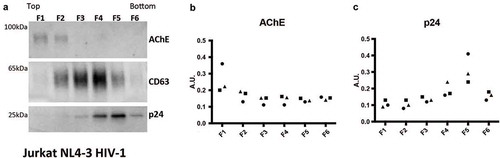
Figure 7. AChE activity and particle counts in iodixanol velocity gradients of small EVs released by HIV-infected PM1 and H9 cells. Twelve fractions were recovered from iodixanol gradients of the 100 K pellet of PM1 cells infected with HIV(BaL) and cultured in commercial EV-depleted FBS medium. (a) Western blot of CD63, CD81, and CD9 in fractions 1–12 (from the experiment also depicted in panel c). (b, c) Particle counts (NTA by ZetaView, with settings and measurement parameters as specified in Materials and Methods for the JHU lab) and AChE activity of two cultures of PM1 cells: values are expressed per mL of final washed and resuspended fraction (1 mL each). Only those points marked by “*” were above the limit of quantitation of the AChE assay (fractions 2–4). Data shown in panels b and c are from 2 independent experiments (with 3 or more technical replicates each).
Discussion
Our results suggest that AChE activity is not a universal marker of mammalian sEVs and cannot be used to quantitate EVs reliably, except perhaps in specific cell systems.
This conclusion is based first on a demonstration that AChE is mainly secreted as a non-vesicle-associated form. According to our data, AChE activity does not correlate with particle count. When ultracentrifuged small EV-enriched pellets are further separated by size-exclusion chromatography and iodixanol gradient alike, AChE activity is found almost exclusively in fractions that are particle-poor and depleted of EV markers. Finally, analysis of EV-enriched pellets by immuno-EM shows AChE mainly on non-vesicular structures.
The second reason for not using AChE as a marker of cell-derived vesicles is the observation that, in cell culture, a vast majority of AChE activity associated with standard EV preparations appears to be derived from serum. With appropriate dilution and ultracentrifugation, serum can be depleted of many but not all EVs [Citation36,Citation37,Citation41], yet AChE activity is inefficiently removed from diluted serum by centrifugation, suggesting that most serum AChE activity resides in a soluble fraction and does not associate tightly if at all with vesicles. Importantly, though, as shown here, most of the pelletable AChE can be removed by following an “extra-depletion” process in which a portion of medium closest to the pellet is left behind during harvesting. This fraction contains AChE associated with loosely pelleted material. The small percentage of activity that is pelleted or retained in the volume just above the pellet could be explained by sedimentation of the large G4 complex of AChE/BChE, which has a molecular mass of 340,000 kDa [Citation18,Citation19]. It remains unclear how much of the activity in any fraction can be attributed to AChE versus BChE, since they both act on the substrate and can be difficult to distinguish even with some antibodies [Citation42].
A relatively minute but highly variable amount of AChE activity could be found in cell-conditioned, serum-free or extra-depleted medium, and a small portion of this activity could be pelleted by differential centrifugation. There was no consistent enrichment of this activity/protein in 100 K pellets, however, and indeed we observed a depletion in the PM1 and Jurkat cell studies, contrary to suggestions that AChE is a marker of small EVs, specifically exosomes. Furthermore, it is unclear if the measured activity/protein was released by the cultured cells or was simply residual activity from serum that had not been adequately washed off when cells were switched to serum-free medium. This sort of carryover has been observed previously in RNA studies, where some serum miRNAs can persist even after washing and passaging of cells in serum-free medium [Citation37,Citation43,Citation44]. It is possible, though, that small amounts of AChE (or BChE) are made by cultured cells. Although most blood cells, including even primary mature erythrocytes and leukocytes, display little AChE activity [Citation22], AChE mRNA was reported in some immune cell lines [Citation45]. Considering the disparity between AChE levels in serum-containing and serum-free conditions, however, production of AChE by cells in culture may need to be re-evaluated in serum-free culture conditions following careful removal of residual serum components.
How did AChE evolve from a marker of RBC EVs, as developed in the 1970s, to a putative general EV marker? More recent literature seems to reference the initial RBC studies, attributing AChE not as an RBC EV marker, but rather as a generic EV or exosome marker [Citation32–Citation34,Citation46–Citation48]. These later investigations do not appear to have involved RBCs or related cells directly, nor was a rationale provided for the use of AChE as an EV/exosome surrogate. Such applications of AChE have included cancer immunology research [Citation31] and HIV studies in immune cells such as primary human mononuclear leukocytes and leukemic B- and T-cell lines [Citation32–Citation34,Citation46,Citation49]. Some of these studies used AChE activity as a negative marker for HIV virions, separated from presumably AChE-harbouring exosomes by density gradient [Citation32,Citation33,Citation48]. This new application of AChE activity may have arisen from an historical misreading of the reticulocyte literature (which we have not pinpointed) followed by uncritical citation. Indeed, our findings confirm that AChE is strongly associated with neither HIV virions nor host EVs in common HIV experimental systems.
Our findings show that AChE is not a universal marker of EVs; however, it is possible that it could be useful for some cell types (such as neurons or reticulocytes) or in some biological fluids. It is worth noting that in the RBC cultures used here, only about 2% of the cells correspond to reticulocytes, which release abundant EVs when maturing to erythrocytes. Therefore, the low level of AChE detected in EVs probably comes from the few reticulocyte-derived EVs, whereas abundant AChE detected predominantly in non-EV fractions may come from the culture medium or residual plasma. For these reasons, researchers who propose AChE as an EV or exosome marker would be well advised to consider experiments in their specific system(s) to establish that AChE/AChE activity is:
highly expressed and membrane-associated in the cell of interest;
released predominantly in physical association with EVs (and with presumed late endosomal markers if exosome-association is claimed), and not (or to a lesser extent) in non-EV fractions; and
not an exogenous artifact (through use of serum-free culture conditions).
Without these steps, the specificity and sensitivity of AChE as an EV or sEV/exosome marker may remain in doubt.
Methods
Cell lines, red blood cells, and HIV-1 strains
Cell lines used in this study included: in KWW lab, U937 (ATCC #CRL-1593.2), H9 (ATCC #HTB-176), PM1 (AIDS Reagent Program, Cat #: 3038); in CT lab, Jurkat cells (identified by short tandem repeat profiling as similar to J77 clone 20). Red blood cells (about 98% erythrocytes and less than 2% reticulocytes) were obtained from blood donated by a healthy, consenting individual per Protocol NA_00093758 approved by the Institutional Review Board of the Johns Hopkins University School of Medicine. Blood was centrifuged within 20 min of collection through Ficoll at 400 x g for 15 min and the bottom fraction corresponding to RBCs was collected (KWW lab). HIV-1 strains were NL4-3 (CT lab), BaL and Rf (KWW lab). To prepare pseudotyped virus (in CT lab), HEK-293T cells were cultured in DMEM-GlutamaxTM supplemented with 10% FBS (Gibco) and Penicillin-Streptomycin (Gibco). VSV-G-pseudotyped viral particles were produced by transfection of HEK-293T with a mixture of pBR-NL43-IRES-eGFP-Nef+ (NL4-3-IRES-eGFP, encoding full-length HIV-1 in the pBR322 backbone under the control of viral long terminal repeat promoter, generated by Dr. F. Kirchhoff [Institute of Molecular Virology, Ulm University Medical Center, Ulm, Germany [Citation50]] and pCMV-VSV-G using TransIT-293 reagent (Mirus Bio), following the manufacturer’s recommendations. Virus-containing cell supernatants were recovered after 72 h, filtered at 0.45 μM, aliquoted and stored at −80°C. Jurkat cells were infected with VSV-G–pseudotyped NL4-3-IRES-EGFP-Nef+ virus (20–50 ng p24/ml) for 2 h before being washed 3 times with PBS and incubated with the different media for EV isolation. In KWW lab, chronically HIV-BaL-infected PM1 cells were cultured in 10% FBS containing RPMI-1640 medium until cell density reached 1.2 – 1.5 × 10⁶ cells/mL. Virus-containing CCM were harvested by pelleting cells at 1,500 rpm for 5 min. The supernatant was pelleted twice to remove cell debris and large vesicles (2,000 x g for 20 min each) and then at 10,000 x g for 40 min. Finally, the supernatant was centrifuged at 100,000 x g for 90 min (as below for EVs). The virus pellet was resuspended in 1xPBS and aliquoted and stored at-80°C until use.
Cell culture
Cells were cultured in RPMI-1640-GlutamaxTM medium (Gibco) with Penicillin-Streptomycin (Gibco) and 10% FBS (Gibco, batch 42F2567K) for Jurkat cells (CT lab), or RPMI-1640 (Gibco) supplemented with 10% FBS (HyClone SH30396.03, Lot AC11258322) for H9 and PM1 cell culture (KWW lab); KWW lab also used commercial depleted FBS in and : GIBCO Exosome-Depleted FBS, A27208-01, Lot 1,838,765. All sera were heat inactivated at 56°C for 30 min. For serum-free culture, KWW lab used AIM V(Gibco), and CT lab used TexMACSTM (Miltenyi Biotec) media, as indicated. Cells were cultured at an initial density of approximately 0.5 to 1 × 10⁶ cells/ml in the indicated medium for 48 to 72 h, as indicated, prior to the harvest of CCM. Equal volumes of medium without cells were used to obtain cell-free EVs.
In-house preparation of EV-depleted and EV-extra-depleted medium
EV-depleted and extra-depleted medium were obtained by overnight ultracentrifugation at 100,000 × g in a Type 45 Ti rotor (Beckman Coulter, k-factor 1042.2) of RPMI-1640 medium (Gibco) supplemented with 20% FBS (Gibco, batch 42F2567K). After centrifugation, EV-depleted medium was defined as the supernatant, whereas EV-extra-depleted medium was defined as the EV-depleted supernatant when carefully pipetted from the top and leaving 5 ml in the bottom of each tube to avoid disturbing bottom layers or the pellet. Supernatants were filtered through a 0.22 μm bottle filter (Millipore), and additional RPMI medium and antibiotics were added to prepare complete medium (10% EV-depleted FBS final).
EV separation from CCM and NCM
EVs were separated by differential ultracentrifugation as previously described [Citation36]. Briefly, conditioned medium was centrifuged at 300 × g for 20 min at 4°C to pellet cells. Supernatant was centrifuged at 2,000 × g for 20 min at 4°C (2 K pellet), transferred to new tubes, and centrifuged in a Type 45 Ti rotor (Beckman) for 35 min at 10,000 × g (9,000 rpm = 10 K pellet, k-factor 3473.6), and finally for 90 min at 100,000 × g (30,000 rpm = 100 K pellet, k-factor 1042.2) (CT lab). Alternatively (KWW lab), an AH-629 rotor (Sorvall) was used for the 10 K(change: 40 min) and 100 K steps. All pellets were washed in 50–60 mL of PBS and recentrifuged at the corresponding speed before being resuspended in sterile PBS. Cells recovered from the 300 × g pellet were counted by Countess (Invitrogen). Viability was assessed by Trypan Blue stain 0.4% (Life Technologies) exclusion.
Size-exclusion chromatography (SEC) separation
500 microliter samples containing 100 K pellets isolated from 180 million cells (Jurkat), or approximately 200 million H9 cells or RBCs were overlaid on 70 nm qEV size-exclusion columns (Izon, SP1) followed by elution with PBS in 500 μl fractions according to the manufacturers’ instructions. Fractions 6 to 14 were collected and analysed directly by WB (12 μl), NTA (10 μl), and for AChE activity (50 μl).
Iodixanol gradient separation
100 K pellets obtained by ultracentrifugation of conditioned medium from approximately 60 million cells (Jurkat NL4-3-IRES-EGFP-Nef+-infected or PM1 BaL-infected) were resuspended in 1 ml of PBS and layered on top of iodixanol (OptiprepTM, Sigma-Aldrich #D1556) gradients. Gradients were prepared in PBS in 4% increments ranging from 6 to 18% (Jurkat) or in 1.2% increments ranging from 6 to 18% (PM1) and centrifuged for 1 h at 4°C at 200,000 × g(35,000 rpm) in a SW 41 Ti rotor (Beckman Coulter), stopping without brake (Jurkat), or for 2 hat 4°C at 210,000 × g in a TH-641 rotor (Sorvall, for PM1). After centrifugation, six fractions of 2 ml (Jurkat) or 12 fractions of 1 ml (PM1) were collected from the top of the tube. The fractions were then diluted to 35 ml with PBS to be washed by ultracentrifugation for 40 min at 100,000 × g (25,000 rpm) in a SW 32 Ti rotor (Beckman, Jurkat cells) or AH-629 rotor (Sorvall, PM1 cells). The fractions were resuspended in 15 μl of PBS and used for WB analysis.
Western blotting
Vesicles recovered from conditioned medium from 20 × 106 cells (2 K, 10 K and 100 K pellets), equivalent volumes of cell-free medium (2 K, 10 K and 100 K pellets) or 15 μl of the iodixanol gradient fractions were loaded on 4–15% or 10% Mini‐Protean® TGX Stain‐Free™ gels (Bio‐Rad), under non‐reducing conditions. Transferred membranes (Immun‐Blot PVDF Bio‐Rad) were developed (e.g. using Clarity western ECL substrate (Bio-Rad) or SuperSignal West Pico Plus Chemiluminescent Substrate (Thermo Fisher) and a ChemiDoc Touch imager (Bio‐Rad) or by standard film exposure). Intensity of the bands was quantified using ImageLab Software (Bio‐Rad). Antibodies for WB were mouse anti‐human CD63 (clone H5C6, BD Bioscience #557305), mouse anti-human CD81 (Santa Cruz sc-23692), goat anti-AChE (ab31276, Abcam) and anti-HIV-1 p24 Monoclonal (183-H12-5C, NIH AIDS reagent program) or Anti-HIV1 p55 + p24 + p17 (ab63917, Abcam). Secondary antibodies included HRP-conjugated goat anti-rabbit IgG (Santa Cruz, sc-2004) and HRP-conjugated m-IgG-k BP (Santa Cruz, sc-516102) (JHU), or (CT lab) HRP-conjugated anti-mouse (Jackson Immunoresearch, 115–035-146) and anti-goat (Jackson, 705–035-147).
HIV p24 ELISA
Anti-HIV p24 ELISA Kit (NEK 050) was purchased from PerkinElmer, Boston, MA, and manufacturer’s protocol was followed.
Acetylcholinesterase activity measurements
AChE activity was determined by colorimetry using the Acetylcholinesterase Assay Kit (Abcam ab138871) including a standard curve. Manufacturer’s protocol was followed throughout. Absorbance was measured with a Bio-Rad iMark Microplate Reader (KWW laboratory) or a Spark-Stack TECAN Microplate reader (CT laboratory).
Nanoparticle tracking analysis
NTA was performed by NanoSight NS300 or NS500 (Malvern Instruments) or ZetaView (Particle Metrix). Dilutions: where possible, for NanoSight, samples were diluted to read in the range of 1–10 E 8 particles/mL, and for ZetaView, from approximately 1.5 – 50 E 7 particles/mL (note that these concentrations mostly represent particles ranging from 90 to 200 nm in diameter). For NanoSight, at least five 20-s videos were recorded for each sample at a camera setting of 11 or 12, as specified in the figure legends. Data were analysed at a detection threshold of 5 using NanoSight software version 3.1. For ZetaView, the ZetaView PMX-120 (Particle Metrix) with software version 8.04.02 was used in both laboratories. At JHU, the instrument was set at 25°C, sensitivity of 80, and shutter at 100, with a frame rate of 30 frames per second. In the CT lab, the instrument was set at 22°C, sensitivity of 70 and shutter of 75. Measurements were done at 11 different positions (5 cycles per position) and frame rate of 30 frames per second. Summary data for all measurements are available upon request.
Electron microscopy
Electron microscopy was performed on pellets stored at −80°C that had never been thawed and re-frozen. EV suspension in PBS was deposited on formvar/carbon–coated copper/palladium grids before uranyl/acetate contrasting and methyl-cellulose embedding for whole-mount analysis as described previously [Citation51]. In case of AChE immunostaining, samples on grids were successively incubated with anti-AchE (ab31276, Abcam, 2.5 µg/ml in PBS-BSA 1% for 30 min), rabbit anti-goat (Sigma SAB3700272, 5 µg/ml in PBS-BSA 1% for 30 min), and 10 nm protein-A-gold (CMC, Utrecht, The Netherlands, 1:50 dilution in PBS-BSA 1% for 20 min) before fixation. Double immunostaining was performed by successively incubating with goat anti-AChE (ab31276, Abcam), rabbit anti-goat (Sigma SAB3700272), and 15 nm protein-A-gold (CMC, Utrecht, The Netherlands), 1% glutaraldehyde (Electron Microscopy Sciences, for 5 min), followed by anti-CD63 (857.770.000 TS63 Diaclone, 20 µg/ml in PBS-BSA 1% for 30 min), anti-mouse IgG-10-nm protein-A-gold (Aurion, diluted 1:10 in PBS-BSA for 30 min), and fixed for 5 min with 1% (w/v) glutaraldehyde in PBS. Subsequently, after a wash on 10 droplets of distilled water, grids were transferred to droplets of 0.4% (w/v) uranyl acetate (UA) staining and 1.8% (w/v) methyl cellulose (MC) embedding solution. After 10 min of incubation, grids were picked up in a wire loop. Most of the excess of the viscous embedding solution was drained away with filter paper after which the grids with sections were air-dried forming a thin layer of embedding solution. Images were acquired with a digital camera Quemesa (EMSIS GmbH, Münster, Germany) mounted on a Tecnai Spirit transmission electron microscope (FEI Company) operated at 80 kV.
Statistical methods and data representation
We generally follow recent recommendations regarding transparency in data representation [Citation52,Citation53] by plotting independent data points for experiments with four or fewer points so that readers may “interpret the data for themselves, rather than showing possibly misleading P values or error bars and drawing statistical inferences” [Citation52]. Where statistical tests have been applied (e.g. , with five independent experiments), ANOVA was done followed by Tukey’s post-test.
EV-TRACK submission
We have submitted relevant data of our experiments to the EV-TRACK knowledgebase (EV-TRACK ID: EV180030) [Citation54].
Authors’ contributions
CT and KWW designed and supervised the study. ZL, LM-J, ES, MJ, DCM, THS, and TS performed the research. NJH, MO, CT, and KWW provided resources. THS, LM-J, CT, and KWW wrote the manuscript. All authors provided feedback and approved the final version.
Supplemental Material
Download Zip (1.2 MB)Acknowledgments
LMJ, CT and MO thank Dr.Kirchhoff (Institute of Molecular Medicine, Ulm, Germany) for providing the pBR-NL43-IRES-eGFP-Nef+ HIV strain.
Disclosure statement
No potential conflict of interest was reported by the authors.
Supplementary material
Supplemental data for this article can be accessed here.
Additional information
Funding
Related Research Data
References
- Colombo M, Raposo G, Théry C. Biogenesis, secretion, and intercellular interactions of exosomes and other extracellular vesicles. Annu Rev Cell Dev Biol [ Internet]. 2014;30(1):255–15. Available from: http://www.ncbi.nlm.nih.gov/pubmed/25288114
- Mathivanan S, Ji H, Simpson RJ. Exosomes: extracellular organelles important in intercellular communication. JProteomics. 2010;73(10):1907–1920. Available from: http://www.ncbi.nlm.nih.gov/pubmed/20601276
- van Niel G, Porto-Carreiro I, Simoes S, et al. Exosomes: acommon pathway for aspecialized function. JBiochem. 2006;140(1):13–21. Available from: http://www.ncbi.nlm.nih.gov/pubmed/16877764
- Gould SJ, Raposo G. As we wait: coping with an imperfect nomenclature for extracellular vesicles. JExtracell Vesicles. 2013 Jan;2. Available from: http://www.ncbi.nlm.nih.gov/pubmed/24009890
- Vergauwen G, Dhondt B, Van Deun J, et al. Confounding factors of ultrafiltration and protein analysis in extracellular vesicle research. Sci Rep.. 2017;7(1):2704. Available from: http://www.nature.com/articles/s41598-017-02599-y
- Van Deun J, Mestdagh P, Sormunen R, et al. The impact of disparate isolation methods for extracellular vesicles on downstream RNA profiling. JExtracell Vesicles. 2014;3(1):24858. Available from: http://www.ncbi.nlm.nih.gov/pubmed/25317274
- Kowal J, Arras G, Colombo M, et al. Proteomic comparison defines novel markers to characterize heterogeneous populations of extracellular vesicle subtypes. Proc Natl Acad Sci U S A. 2016;113(8):E968-77. Available from: http://www.pnas.org/lookup/doi/10.1073/pnas.1521230113
- Lotvall J, Hill AF, Hochberg F, et al. Minimal experimental requirements for definition of extracellular vesicles and their functions: aposition statement from the international society for extracellular vesicles. JExtracell Vesicles. 2014;3:26913. Available from: http://www.ncbi.nlm.nih.gov/pubmed/25536934
- Théry C, Witwer KW, Aikawa E, et al. Minimal information for studies of extracellular vesicles 2018 (MISEV2018): aposition statement of the international society for extracellular vesicles and update of the MISEV2014 guidelines. JExtracell Vesicles. 2018;7(1):1535750. Available from: https://www.tandfonline.com/doi/full/10.1080/20013078.2018.1535750
- Chatonnet A, Lockridge O. Comparison of butyrylcholinesterase and acetylcholinesterase. Biochem J. 1989;260(3):625–634. Available from: http://www.ncbi.nlm.nih.gov/pubmed/2669736
- Massoulié J, Perrier N, Noureddine H, et al. Old and new questions about cholinesterases. Chem Biol Interact. 2008;175(1–3):30–44. Available from: http://www.ncbi.nlm.nih.gov/pubmed/18541228
- Herz F, Kaplan E. A review: human erythrocyte acetylcholinesterase. Pediatr Res. 1973;7(4):204–214. Available from: http://www.ncbi.nlm.nih.gov/pubmed/4581727
- Pope CN, Brimijoin S. Cholinesterases and the fine line between poison and remedy. Biochem Pharmacol. 2018;153:205–216. Available from: http://www.ncbi.nlm.nih.gov/pubmed/29409903
- Meshorer E, Soreq H. Virtues and woes of AChE alternative splicing in stress-related neuropathologies. Trends Neurosci. 2006;29(4):216–224. Available from: http://www.ncbi.nlm.nih.gov/pubmed/16516310
- Lockridge O. Review of human butyrylcholinesterase structure, function, genetic variants, history of use in the clinic, and potential therapeutic uses. Pharmacol Ther. 2015;148:34–46. Available from: http://www.ncbi.nlm.nih.gov/pubmed/25448037
- Brimijoin S, Hammond P. Butyrylcholinesterase in human brain and acetylcholinesterase in human plasma: trace enzymes measured by two-site immunoassay. J Neurochem. 1988;51(4):1227–1231. Available from: http://www.ncbi.nlm.nih.gov/pubmed/2901462
- Sorensen K, Brodbeck U, Rasmussen AG, et al. Normal human serum contains two forms of acetylcholinesterase. Clin Chim Acta. 1986;158(1):1–6. Available from: http://www.ncbi.nlm.nih.gov/pubmed/3527487
- Ralston JS, Rush RS, Doctor BP, et al. Acetylcholinesterase from fet al bovine serum. Purification and characterization of soluble G4 enzyme. J Biol Chem. 1985;260(7):4312–4318. Available from: http://www.ncbi.nlm.nih.gov/pubmed/3980478
- Dafferner AJ, Lushchekina S, Masson P, et al. Characterization of butyrylcholinesterase in bovine serum. Chem Biol Interact. 2017;266:17–27. Available from: http://linkinghub.elsevier.com/retrieve/pii/S0009279716306615
- Johnstone RM, Adam M, Pan BT. The fate of the transferrin receptor during maturation of sheep reticulocytes in vitro. Can JBiochem Cell Biol. 1984;62(11):1246–1254. Available from: http://www.ncbi.nlm.nih.gov/pubmed/6098362
- Johnstone RM, Mathew A, Mason AB, et al. Exosome formation during maturation of mammalian and avian reticulocytes: evidence that exosome release is amajor route for externalization of obsolete membrane proteins. J Cell Physiol. 1991;147(1):27–36. Available from: http://www.ncbi.nlm.nih.gov/pubmed/2037622
- Johnstone RM, Adam M, Hammond JR, et al. Vesicle formation during reticulocyte maturation. Association of plasma membrane activities with released vesicles (exosomes). J Biol Chem. 1987;262(19):9412–9420. Available from: http://www.ncbi.nlm.nih.gov/pubmed/3597417
- Pan BT, Blostein R, Johnstone RM. Loss of the transferrin receptor during the maturation of sheep reticulocytes invitro. An immunological approach. Biochem J. 1983;210(1):37–47. Available from: http://www.ncbi.nlm.nih.gov/pubmed/6303315
- Allan D, Thomas P, Limbrick AR. The isolation and characterization of 60 nm vesicles (‘nanovesicles’) produced during ionophore A23187-induced budding of human erythrocytes. Biochem J. 1980;188(3):881–887. Available from: http://www.ncbi.nlm.nih.gov/pubmed/6781476
- Lutz HU. Vesicles isolated from ATP-depleted erythrocytes and out of thrombocyte-rich plasma. J Supramol Struct. 1978;8(3):375–389. Available from: http://www.ncbi.nlm.nih.gov/pubmed/723272
- Lutz HU, Liu SC, Palek J. Release of spectrin-free vesicles from human erythrocytes during ATP depletion. I.Characterization of spectrin-free vesicles. J Cell Biol. 1977;73(3):548–560. Available from: http://www.ncbi.nlm.nih.gov/pubmed/873988
- Shukla SD, Berriman J, Coleman R, et al. Membrane protein segregation during release of microvesicles from human erythrocytes. FEBS Lett. 1978;90(2):289–292. Available from: http://www.ncbi.nlm.nih.gov/pubmed/352723
- Rieu S, Géminard C, Rabesandratana H, et al. Exosomes released during reticulocyte maturation bind to fibronectin via integrin α4β1. Eur J Biochem. 2000;267(2):583–590.
- Savina A, Furlán M, Vidal M, et al. Exosome release is regulated by a calcium-dependent mechanism in K562 cells. J Biol Chem. 2003;278(22):20083–20090. Available from: http://www.jbc.org/lookup/doi/10.1074/jbc.M301642200
- Savina A, Vidal M, Colombo MI. The exosome pathway in K562 cells is regulated by Rab11. J Cell Sci. 2002;115(Pt 12):2505–2515. Available from: http://www.ncbi.nlm.nih.gov/pubmed/12045221
- Gastpar R, Gehrmann M, Bausero MA, et al. Heat shock protein 70 surface-positive tumor exosomes stimulate migratory and cytolytic activity of natural killer cells. Cancer Res. 2005;65(12):5238–5247. Available from: http://www.ncbi.nlm.nih.gov/pubmed/15958569
- Cantin R, Diou J, Belanger D, et al. Discrimination between exosomes and HIV-1: purification of both vesicles from cell-free supernatants. J Immunol Methods [ Internet]. [Cited 2008 Aug 5]: 2008;338(1–2):21–30. Available from: http://www.ncbi.nlm.nih.gov/pubmed/18675270
- Park I-W, He J J. HIV-1 is budded from CD4+ Tlymphocytes independently of exosomes. Virol J. 2010;7(1):234. Available from: http://www.ncbi.nlm.nih.gov/pubmed/20846372
- Barclay RA, Schwab A, DeMarino C, et al. Exosomes from uninfected cells activate transcription of latent HIV-1. J Biol Chem. 2017;292(36):14764. Available from: http://www.ncbi.nlm.nih.gov/pubmed/28887434
- Thery C, Regnault A, Garin J, et al. Molecular characterization of dendritic cell-derived exosomes. Selective accumulation of the heat shock protein hsc73. J Cell Biol. 1999;147(3):599–610. Available from: http://www.ncbi.nlm.nih.gov/pubmed/10545503
- Thery C, Amigorena S, Raposo G, et al. Isolation and characterization of exosomes from cell culture supernatants and biological fluids. Curr Protoc Cell Biol.. 2006; Chapter 3: Unit 3.22. Available from: http://www.ncbi.nlm.nih.gov/pubmed/18228490
- Shelke GV, Lässer C, Gho YS, et al. Importance of exosome depletion protocols to eliminate functional and RNA-containing extracellular vesicles from fetal bovine serum. JExtracell Vesicles. 2014;3:24783. Available from: http://www.ncbi.nlm.nih.gov/pubmed/25317276
- Driedonks TAP, Nijen Twilhaar MK, Nolte-‘T Hoen ENM Technical approaches to reduce interference of fetal calf serum derived RNA in the analysis of extracellular vesicle RNA from cultured cells. J Extracell Vesicles. 2019;8(1):1552059. Available from: https://www.tandfonline.com/doi/full/10.1080/20013078.2018.1552059
- Boing AN, van der Pol E, Grootemaat AE, et al. Single-step isolation of extracellular vesicles by size-exclusion chromatography. J Extracell Vesicles. 2014;3. Available from: http://www.ncbi.nlm.nih.gov/pubmed/25279113
- Dettenhofer M, Yu XF. Highly purified human immunodeficiency virus type 1 reveals avirtual absence of Vif in virions. J Virol.. 1999;73(2):1460–1467. Available from: http://www.ncbi.nlm.nih.gov/pubmed/9882352
- Liao Z, Muth DC, Eitan E, et al. Serum extracellular vesicle depletion processes affect release and infectivity of HIV-1 in culture. Sci Rep. 2017;7(1):2558.
- George KM, Montgomery MA, Sandoval LE, et al. Examination of cross-antigenicity of acetylcholinesterase and butyrylcholinesterase using anti-acetylcholinesterase antibodies. Toxicol Lett. 2002;126(2):99–105. Available from: http://www.ncbi.nlm.nih.gov/pubmed/11751014
- Tosar JP, Cayota A, Eitan E, et al. Ribonucleic artefacts: are some extracellular RNA discoveries driven by cell culture medium components? J Extracell Vesicles. 2017;6(1):1272832. Available from: http://www.ncbi.nlm.nih.gov/pubmed/28326168
- Wei Z, Batagov AO, Carter DRF, et al. Fetal bovine serum RNA interferes with the cell culture derived extracellular RNA. Sci Rep. 2016;6:31175. Available from: http://www.ncbi.nlm.nih.gov/pubmed/27503761
- Kawashima K, Fujii T. The lymphocytic cholinergic system and its biological function. Life Sci. 2003;72(18–19):2101–2109. Available from: http://www.ncbi.nlm.nih.gov/pubmed/12628464
- Arenaccio C, Anticoli S, Manfredi F, et al. Latent HIV-1 is activated by exosomes from cells infected with either replication-competent or defective HIV-1. Retrovirology. 2015;12:87.
- Arenaccio C, Chiozzini C, Columba-Cabezas S, et al. Exosomes from human immunodeficiency virus type 1 (HIV-1)-infected cells license quiescent CD4+ Tlymphocytes to replicate HIV-1 through a Nef- and ADAM17-dependent mechanism. J Virol. 2014;88(19):11529–11539.
- Konadu KA, Chu J, Huang MB, et al. Association of cytokines with exosomes in the plasma of HIV-1-seropositive individuals. J Infect Dis. 2015;211(11):1712–1716. Available from: http://www.ncbi.nlm.nih.gov/pubmed/25512626
- Narayanan A, Iordanskiy S, Das R, et al. Exosomes derived from HIV-1-infected cells contain trans-activation response element RNA. J Biol Chem. 2013;288(27):20014–20033. Available from: http://www.ncbi.nlm.nih.gov/pubmed/23661700
- Schindler M, Münch J, Kirchhoff F. Human immunodeficiency virus type 1 inhibits DNA damage-triggered apoptosis by a Nef-independent mechanism. J Virol. 2005;79(9):5489–5498. Available from: http://jvi.asm.org/cgi/doi/10.1128/JVI.79.9.5489-5498.2005
- Théry C, Amigorena S, Raposo G, et al. Isolation and characterization of exosomes from cell culture supernatants and biological fluids. In: Current protocols in cell biology. Hoboken, NJ, USA: John Wiley & Sons, Inc.; 2006. p. Unit 3.22.
- Vaux DL. Research methods: know when your numbers are significant. Nature. 2012;492(7428):180–181. Available from: http://www.ncbi.nlm.nih.gov/pubmed/23235861
- Weissgerber TL, Milic NM, Winham SJ, et al. Beyond bar and line graphs: time for a new data presentation paradigm. PLoS Biol. 2015;13(4):e1002128. Available from: https://dx.plos.org/10.1371/journal.pbio.1002128
- Van Deun J, Mestdagh P, Agostinis P, et al. EV-TRACK: transparent reporting and centralizing knowledge in extracellular vesicle research. Nat Methods. 2017;14(3):228–232. Available from: http://www.ncbi.nlm.nih.gov/pubmed/28245209