
ABSTRACT
Although anti-angiogenic therapies (AATs) have some effects against multiple malignancies, they are limited by subsequent tumor vasculogenesis and progression. To investigate the mechanisms by which tumor vasculogenesis and progression following AATs, we transfected microRNA (miR)-9 into human umbilical vein endothelial cells (HUVECs) to mimic the tumor-associated endothelial cells in hepatocellular carcinoma and simulated the AATs in vitro and in vivo. We found that administration of the angiogenesis inhibitor vandetanib completely abolished miR-9-induced angiogenesis and promoted autophagy in HUVECs, but induced the release of vascular endothelial growth factor (VEGF)-enriched exosomes. These VEGF-enriched exosomes significantly promoted the formation of endothelial vessels and vasculogenic mimicry in hepatocellular carcinoma and its progression in mice. Anti-autophagic therapy is proposed to improve the efficacy of AATs. However, similar effects by AATs were observed with the application of anti-autophagy by 3-methyladenine. Our results revealed that tumor vasculogenesis and progression after AATs and anti-autophagic therapies were due to the cross-talk between endothelial and tumor cells via VEGF-enriched exosomes.
Introduction
Anti-angiogenic therapies (AATs) which aim at starving tumors by suppressing tumor vascularization and destroying pre-existing tumor-associated blood vessels have been less successful than initially expected [Citation1,Citation2]. The benefits of AATs are transient, and the treated tumors have been shown to relapse faster through different forms of vasculogenesis, including vascular co-option, endothelial angiogenesis, and vasculogenic mimicry (VM) [Citation3–Citation7]. In addition, the tumor vasculature induced by the AAT has a leakier barrier, which makes it prone to tumor cell invasion and metastasis and drives acquired resistance to AATs in cancers such as hepatocellular carcinoma (HCC) [Citation6,Citation7], a leading cause of cancer-related death worldwide [Citation8]. However, how the AATs result in tumor vasculogenesis remains a mystery [Citation9].
MicroRNAs (miRNAs) have recently been shown to regulate gene expression associated with tumorigenesis and angiogenesis [Citation10,Citation11]. Oncogenic miR-9 is significantly elevated in HCC tissues and tumor-associated endothelial cells (ECs). High-level expression of miR-9 is closely related to the poor prognosis of HCC patients [Citation10,Citation12,Citation13]. MiR-9 has been reported to increase vascular endothelial growth factor (VEGF) expression in tumor cells [Citation14] and to promote tumor angiogenesis and progression in the lung and colorectal carcinoma. But these carcinomas were only moderately responsive to miR-9 antagomirs or anti-VEGF treatment [Citation10,Citation15]. Besides, the role of tumor-associated ECs overexpressing miR-9 in AATs is unknown.
MiR-9 has also been reported to promote autophagy [Citation16], a cellular pathway involved in the clearance of protein aggregates, turnover of organelles, as well as recycling the by-products of autophagic degradation [Citation17]. In particular, the induction of autophagy promotes angiogenesis including VEGF-induced angiogenesis, independent of nutritional or hypoxic stress [Citation18,Citation19]. However, whether miR-9 induces angiogenesis and whether miR-9-induced angiogenesis is affected by anti-autophagy treatment have not been fully explored.
In the past decade, extracellular vesicles (EVs) including apoptotic bodies, microvesicles (MVs) and exosomes have emerged as important players in cell-to-cell communication in health and in disease [Citation20]. Delivery of tumor-secreted miR-9 by MVs promotes EC migration [Citation10]. Exosomes having a lipid-bilayer membrane and in the 30–150 nm size range [Citation21,Citation22] that allow genetic or molecular exchanges between cells through the transfer of angiogenic proteins, such as VEGF [Citation23], and functional RNA molecules including mRNAs and miRNAs [Citation21], have also been found to contribute to tumor progression and metastasis [Citation22,Citation24], although the role of exosomes in mediating tumor vasculogenesis, especially following AATs, is unclear.
To elucidate the mechanisms by which tumor vasculogenesis and progression following AATs and to address the above pertinent issues, we first transfected human umbilical vein endothelial cells (HUVECs) with miR-9 to mimic the tumor-associated ECs. We then examined the role of miR-9 in endothelial angiogenesis and in endothelial autophagy. Following that, we investigated the anti-angiogenic effects by a VEGFR2 (Flk1) inhibitor, vandetanib, and by an autophagy inhibitor, 3-methyladenine (3-MA). Finally, we discovered that the enhanced vasculogenesis and progression of HCC were due to the VEGF-enriched exosomes released by ECs overexpressing miR-9 in response to anti-angiogenic and anti-autophagic treatments.
Results
Mir-9 induces angiogenesis in vivo
To simulate the upregulation of miR-9 in tumor-associated ECs, we transfected miR-9-expressing lentivirus into HUVECs ()). Murine Matrigel plugs mixed with HUVECs were previously used to evaluate angiogenesis in vivo based on the response of active angiogenesis to angiogenic factors in the Matrigel plug [Citation25]. Platelet endothelial cell adhesion molecule 1 (PECAM1, or CD31) is a marker of endothelial cells [Citation26]. The human progenitor cell antigen cluster of differentiation (CD)34 is also expressed on HUVECs and acts as an endothelial marker for angiogenesis [Citation27]. Through these specific EC makers, we located the microvessels formed in the Matrigel plug mixed with HUVECs overexpressing miR-9 in the absence of additional angiogenic factors (, , ). The amount of angiogenic microvessels was significantly increased by miR-9 (33.8 ± 1.5/mm2) compared with NC (20.7 ± 0.2/mm2; , P < 0.001) in 4 observed regions (each region is ~1326 μm × 998 μm large, see Supplementary Figure 1) in each animal and 4 animals for each group. The diameter of angiogenic vessels induced by miR-9 was 5–96 μm, with 31.4 μm the average. In contrast, only small angiogenic vessels were found in the NC group (2.5–13 μm, with 5.2 μm the average; P < 0.001; , , ). CD31 was also highly expressed on newly formed vessels (). Human CD31 positive ECs formed vessels were only observed in HUVECs overexpressing miR-9, while murine CD31 positive ECs formed vessel-like structures (without apparent lumen) were found in both NC and miR-9 groups, suggesting that miR-9 should promote the angiogenesis of HUVECs (, ). The vessel-like structures were most likely due to the recruitment of host endothelial cells in mice. Compared with the NC, miR-9 inhibited cell apoptosis (), enhanced phosphorylation of Flk1 (), and increased the level of the autophagic marker LC3B (). It was reported that CD34 expression in isolated ECs is inversely associated with apoptosis and positively associated with angiogenesis in vitro [Citation28]. Consistent with the in vitro findings, we demonstrated that CD34 positivity in ECs was lost with the increase in apoptosis and autophagy in NC group.
Figure 1. MiR-9 induces angiogenesis.
(a). HUVECs overexpressing miR-9 after transfection with LV3-miR-9 (miR-9) and LV3-NC (NC). Mean ± standard deviation (SD), n = 4. ***P < 0.001. Student’s t-test was performed. (b). Investigation of angiogenesis by confocal microscopy in the mouse ventral subcutaneous region following transfer of a murine Matrigel plug mixed with lentivirus-infected HUVECs (GFP, green), CD34 (red), and nuclei (DAPI, blue) in cryosections. Vessel (yellow arrowhead), vascular content (blue arrow). The vascular structures were circled by the white dotted line. (c–f). Evaluation of vessel density (c) and diameter (d) and immunohistochemistry (IHC) for CD31 (e) and CD34 (f). Both human CD31 (hCD31) and murine CD31 (mCD31) were stained (e). The vessel density (c) and diameter (d) were calculated using CD34 images (f). Mean ± standard error of mean (SEM). The density was the number of vessels per unit area (c), averaged over four view fields (larger views in Supplementary Figure 1) per murine Matrigel plug, four animals per group, n = 4. Student’s t-test was performed for vessel density. Frequency distribution curve of diameter (interval 10 and range 0–100) was performed by ImageJ. Chi-squared test was performed for vessels distribution. *** P < 0.001 vs. NC. The green line enclosed area is the vessel lumen (f). Diameter (Φ) = (lumen area/π)(1/2)×2. Small endothelial sprouts without apparent lumen were not calculated. At the upper left corner of (f), the enlarged views of the vessels are shown with the diameters for those indicated by the rectangular boxes. (g–i). IHC for TUNEL assay (g), p-Flk1 (h), and LC3B (i) in the mouse ventral subcutaneous region following transfer of a murine Matrigel plug mixed with lentivirus-infected HUVECs. Results shown are representatives of four experiments. (j–l). Quantitative reverse transcription polymerase chain reaction (j and k) and immunoblot results (l, 30 μg proteins) for VEGF and Flk1 in HUVECs overexpressing miR-9. Densitometric quantification (K, right). Mean ± SEM, n = 4. *P < 0.05; **P < 0.01; ***P < 0.001. Student’s t-test was performed.
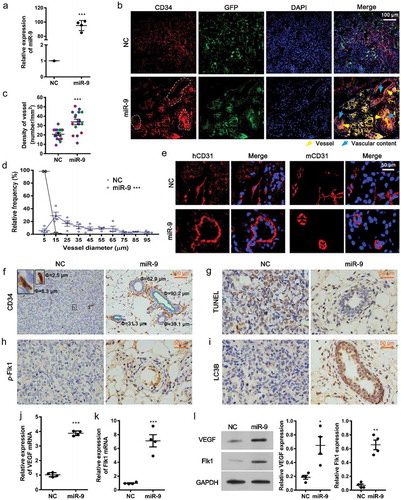
We then analyzed the role of miR-9 in VEGF and Flk1 expression in HUVECs. Consistent with the angiogenic induction, miR-9 increased both mRNA and protein levels of VEGF and Flk1 in HUVECs (–), as well as eliciting the release of VEGFA (), suggesting that miR-9 promote autocrine effects associated with VEGF signaling to induce angiogenesis.
Mir-9 and anti-angiogenic vandetanib induce autophagy
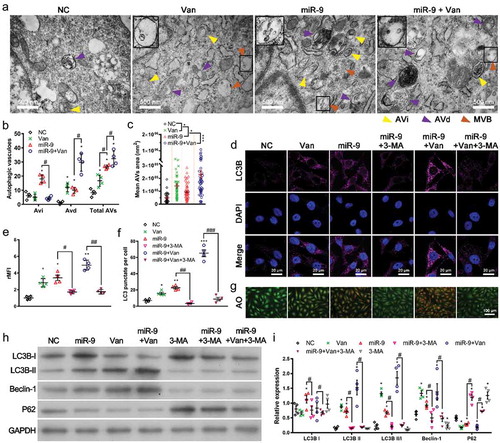
Treatment of ECs with angiogenesis inhibitors has been shown to induce autophagy [Citation29]. To investigate if miR-9 induces autophagy and if anti-VEGFR2 (Flk1) treatment by vandetanib also induces autophagy, we evaluated changes in autophagy in HUVECs overexpressing miR-9 with and without vandetanib treatments (). We observed numerous morphologically intact early/initial autophagic vacuoles (AVis) and late/degradative autophagic vacuoles (AVds) containing degraded cytoplasmic materials and lysosome-fusion components in HUVECs upon miR-9 transfection (). Vandetanib treatment significantly increased the AVds in HUVECs and further enhanced the increased AVds by miR-9, but abolished the increased AVis by miR-9 (). It also increased the size of AVs () in HUVECs with and without overexpressing miR-9, as well as induced fusion of multivesicular bodies (MVBs) with the vacuoles (). Vandetanib treatment induced autophagic proteins LC3B and Beclin-1 expression (, , , ), conversion of LC3BI to LC3BII (, ), consumption of p62 (, ) and autophagic vacuoles () in both NC and miR-9 groups, indicating vandetanib treatment induced autophagy and also enhanced the autophagy by miR-9. We also evaluated the reverse effect of an autophagy inhibitor 3-methyladenine (3-MA, 5 mM) on miR-9 and vandetanib induced autophagy (–). Administration of 3-MA significantly abolished the miR-9 and vandetanib-induced autophagy by inhibiting LC3B and Beclin-1 expression (, , , ), conversion of LC3BI to LC3BII (, ) as well as consumption of p62 (). 3-MA also reduced the numbers of LC3B punctate dots (–) and autophagic vacuoles ().
Figure 2. Vandetanib promotes miR-9-induced autophagy.
(a-c). Transmission electron microscopic views of AVi (yellow arrowhead), AVd (purple arrowhead) and MVB (brown arrowhead) in HUVECs overexpressing miR-9 and treated with vandetanib (a), and the number of AVis, AVds, and AVs (= AVis + AVds) in a single cell (b). Mean ± SEM, n = 4. *P < 0.05 vs. NC; #P < 0.05. Mean area of autophagic vacuoles (AVs) (c). Mean ± SEM, n = 4. *P < 0.05, ***P < 0.001. At the upper left corner of each image, there is a 2-fold enlarged view of the MVB indicated by the rectangular box. (d-f). Confocal microscopic views of LC3B (d), relative mean fluorescence intensity (rMFI) to that of NC (e), and the number of LC3 puncta per cell (f). Mean ± SEM, n = 4. *P < 0.05, **P < 0.01, ***P < 0.001 vs. NC; #P < 0.05, ##P < 0.01, ###P < 0.001. (g). Acridine orange (AO) staining of autophagosomes in HUVECs overexpressing miR-9 and treated with 3-MA or/and vandetanib. (h, i). Immunoblot for LC3B, Beclin-1 and p62 in HUVECs overexpressing miR-9 and treated with 3-MA or/and vandetanib (h, 20 μg proteins). Densitometric quantification (i). Mean ± SEM, n = 4. *P < 0.05; #P < 0.05.
Vandetanib and 3-MA inhibit angiogenesis
demonstrates that miR-9-induced Flk1 expression and Flk1 phosphorylation were significantly suppressed in a concentration-dependent manner following administration of vandetanib for 60 min (P < 0.05 at 2 µM; P < 0.01 at 4 and 8 µM). We also found that administration of 4 μM vandetanib or 5 mM 3-MA for 60 min almost completely inhibited Flk1 phosphorylation or abrogated its relocalization in the cell membrane induced by miR-9 (, ). Although vandetanib did not change the VEGF mRNA expression in HUVECs, it reduced the miR-9-increased VEGF mRNA expression (). Differently, 3-MA reduced VEGF mRNA expression in HUVECs and completely abolished miR-9-increased VEGF mRNA expression (). Correspondingly, the miR-9-increased secretion of VEGFA was also abolished by 3-MA and vandetanib (). In contrast, vandetanib and 3-MA did not significantly alter the miR-9 levels in HUVECs with and without overexpressing miR-9 ().
Figure 3. Autophagy acts as an adjuvant to Flk1-dependent angiogenesis.
(a). Concentration-dependent inhibition of p-Flk1 levels by vandetanib on HUVECs overexpressing miR-9. Immunoblot for p-Flk1 (top). Densitometric quantification (bottom). Mean ± SEM, n = 4. *P < 0.05, **P < 0.01 vs. HUVECs; #P < 0.05, ##P < 0.01 vs. miR-9. (b, c). Confocal microscopic view of p-Flk1 in HUVECs overexpressing miR-9 in the presence or absence of vandetanib and/or 3-MA treatment (b). Relative mean fluorescence intensity (rMFI) to that of NC (c). Mean ± SEM, n = 4. *P < 0.05; **P < 0.01 vs. NC. ##P < 0.01 vs. miR-9. (d, e). VEGF mRNA (d) and enzyme-linked immunosorbent assay of VEGF secretion in the culture supernatant (e) by HUVECs overexpressing miR-9 in response to vandetanib and/or 3-MA treatment. Mean ± SEM, n = 4. *P < 0.05, **P < 0.01, and ***P < 0.001 vs. NC; #P < 0.05, ##P < 0.01, ###P < 0.001 vs. miR-9; $ P < 0.05 vs. Van; @ P < 0.05, @@ P < 0.01, @@@ P < 0.001 vs. miR-9 + Van + 3-MA. (f). The miR-9 expression levels after Van and 3-MA treatments. ***P < 0.001 vs. NC. (g–i). Transwell assays (g) of migration (top) and invasion (bottom) of HUVECs overexpressing miR-9 in response to vandetanib and/or 3-MA treatment. hVEGF (50 ng/ml) was used as a positive control. Mean ± SEM, n = 4. *P < 0.05, **P < 0.01 vs. NC. ##P < 0.01 vs. miR-9. (j–l). Tube formation (j), normalized tube length (k), and number of junctions (l) formed by HUVECs overexpressing miR-9 in response to vandetanib and/or 3-MA treatment. hVEGF was used as positive control. Mean ± SEM, n = 4. *P < 0.05, ***P < 0.001 vs. NC; ##P < 0.01, ###P < 0.001 vs. miR-9. (m). Schematic representation of inhibition of angiogenesis by the Flk1 inhibitor vandetanib via inhibition of VEGF secretion and activation of autophagy (the results shown in ), and adjuvant anti-autophagy treatment for anti-angiogenic vandetanib treatment.
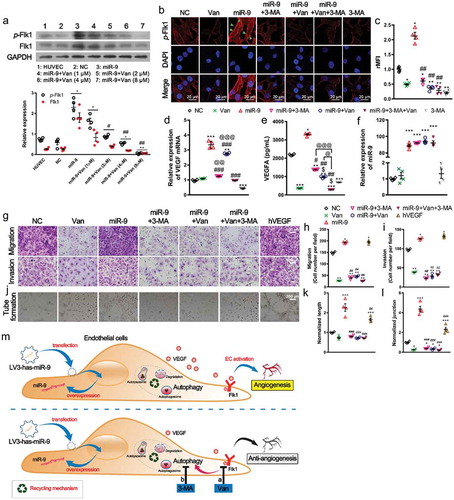
We then investigated the roles of vandetanib and 3-MA in miR-9-induced angiogenesis. Treatments with either vandetanib or 3-MA significantly suppressed EC migration and invasion induced by miR-9 (). As a consequence, treatments with either vandetanib or 3-MA or both significantly decreased the tube formation, tube length and number of junctions in the network induced by miR-9 (). These results suggest that miR-9 promote angiogenesis not only by activation of Flk1 signaling but also by autophagy in HUVECs. Anti-angiogenesis and/or anti-autophagy abolished miR-9-induced angiogenesis (). Recombinant human VEGF 165 protein (50 ng/ml [Citation30]; hVEGF) was used as a positive control. Similar to miR-9, inductions in EC migration and invasion, as well as angiogenesis by hVEGF were observed ().
VEGF-enriched exosomes are released from HUVECs following administration of either vandetanib or 3-MA
The disruption of intercellular communication networks associated with cell-cell junctions and exosomes is a prerequisite for angiogenesis [Citation20,Citation31]. show that miR-9 significantly enlarged the intercellular gaps from 147.0 ± 29.9 nm (NC) to 716.1 ± 44.8 nm although it did not change the number and size distribution of extracellular vesicles (EVs), which include exosomes and microvesicles (MVs) (). Surprisingly, vandetanib treatment (anti-VEGFR2) and 3-MA (autophagy inhibitor), which suppressed angiogenesis (), not only further enlarged the intercellular gaps to 896.2 ± 94.3 nm and 1284.0 ± 357.2 nm, respectively (), but also increased the number of EVs and changed their size distribution (). Significantly more EVs with size of 30–150 nm were induced by either vandetanib or 3-MA treatment. HUVECs overexpressing miR-9 also have a larger cell body area (112.3 ± 5.8 μm, n = 4) compared to NC cells (85.9 ± 4.9 μm, n = 4, P < 0.05), vandetanib further increased the area to 136.9 ± 6.0 μm (n = 4, P < 0.01), whereas 3-MA reduced the area to 91.8 ± 5.3 μm (n = 4, P < 0.05).
Figure 4. Inhibition of VEGFR (Flk1) or autophagy releases VEGF-enriched exosomes from HUVECs.
(a). Transmission electron microscopic view of control HUVEC and those overexpressing miR-9 and treated with vandetanib or 3-MA. Released extracellular vesicles (EVs) (red arrowhead) and intercellular junctions (blue arrowhead). At the upper left corner of each image, there is an enlarged view of likely EVs/EV-like structures indicated by the rectangular box. Their diameter values are shown in red. (b). Comparison of the intercellular gap distance under each case. Mean ± SEM, n = 10 gaps for each case. ***P < 0.001 vs. NC; #P < 0.05, ##P < 0.01 vs. miR-9; @P < 0.05 vs. miR-9 + Van. (c). Comparison of the amount of extracellular vesicles (EVs) under each case. Mean ± SEM, n = 4. EVs were observed by TEM and frequency distribution curve of diameter (interval 20 and range 0–1000) was performed by ImageJ. Chi-squared test was performed for EVs distribution. *P < 0.05 vs. NC; ##P < 0.01, ###P < 0.001 vs. miR-9. (d). Immunoblot for exosomal markers TSG101, HSP70 and CD63 in exosomes isolated from 2.5 mL culture supernatants from about 1 × 10⁷ HUVECs (left). The purity of exosome was assessed by GRP94. Densitometric quantification (right). Mean ± SEM, n = 4. *P < 0.05, **P < 0.01 vs. NC; ##P < 0.01 vs. miR-9. (e, f). Transmission electron microscopic view of isolated exosomes (e, average size 63 ± 15 nm, Mean ±SD; 78% vesicles in the range of 50–150 nm) and immunogold labelling of CD63 (f). (g). Nano-flow cytometry analysis of VEGF-positive exosomes released from HUVECs overexpressing miR-9 and following administration of vandetanib or 3-MA (exo1, left; exo2, right). (h). Immunoblot for VEGF in exosomes (10 μg proteins) isolated from HUVEC culture supernatant in the presence or absence of miR-9 overexpression and following administration of vandetanib or 3-MA (bottom). CD63 was used as a reference. Densitometric quantification (top). Control, HUVECs in the absence of treatment. Mean ± SEM, n = 3. *P < 0.05; **P < 0.01 vs. control; ###P < 0.001 vs. miR-9. (i). MiR-9 mRNA levels in exosomes. U6 snRNA and cel-miR-39 were used as endogenous and exogenous controls. Mean ± SEM, n = 3. ***P < 0.001 vs. NC. (j, k). Enzyme-linked immunosorbent assay of exosomal VEGF and VEGF in exosome-depleted media. Exosomal proteins were extracted using radioimmunoprecipitation assay lysis. Data was normalized to the volume of culture supernatants. Mean ± SEM, n = 4. *P < 0.05, **P < 0.01, and ***P < 0.001 vs. NC; #P < 0.05; ##P < 0.01, ###P < 0.001 vs. miR-9; @@ P < 0.01 vs. miR-9 + 3-MA. (l). Schematic representation of induction of release of VEGF-enriched exosomes by Flk1 inhibitor and anti-autophagy.
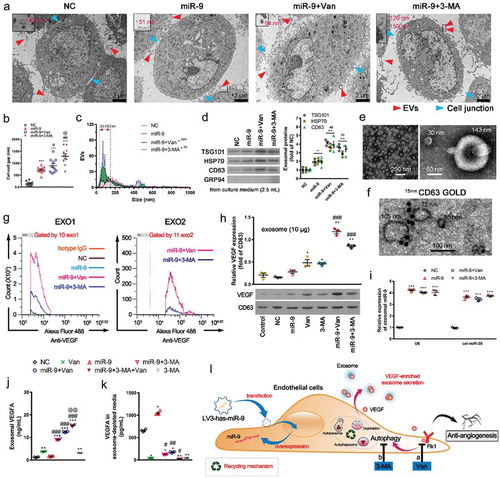
We then isolated the exosomes from the culture media supernatant of HUVECs by ultracentrifugation. Immunoblotting was used to identify the exosomal markers TSG101, HSP70 and CD63 (). The purity of the isolated exosomes was confirmed by GRP94 that is absent in exosomes [Citation32]. Exosomal proteins from 2.5 mL culture supernatants were loaded during western blotting (). The levels of these exosomal proteins were in the order: miR-9 + Van or miR-9 + 3-MA > miR-9 > NC (P < 0.05). The size (diameter) of the isolated exosomes ranged mostly from 30 nm to 150 nm (). The cup-shaped EVs in the inset of are exosomes (one is 30 nm and another 143 nm) [Citation20]. Immunogold labelling of CD63 also confirmed the isolated vesicles were exosomes (). Using nano-flow cytometry, we further detected two groups of exosomes (exo1 and exo 2) that are VEGF-enriched from the supernatant of HUVECs overexpressing miR-9 and following administration of either vandetanib or 3-MA (). The size of these VEGF-enriched exosomes is less than 110 nm (Supplement Figure 2). However, we did not find VEGF-enriched MVs which are greater than 200 nm [Citation33]. Although vandetanib or 3-MA increased the VEGF cargos in the isolated exosomes from the HUVEC culture supernatant, with a further increase from those with miR-9 overexpression (), neither of them had affected the miR-9 cargos in these exosomes ().
The measured VEGF levels in exosomes (lysed using radioimmunoprecipitation assay before ELISA detection, ) were significantly higher than those in culture supernatants (without lysis, ) and those in exosome-depleted media (), e.g. 12.47 ± 0.16 ng/mL in exosomes vs. 0.98 ± 0.06 ng/mL in culture supernatant and 0.17 ± 0.01 ng/mL in exosome-depleted media in miR-9 + vandetanib group, suggesting that VEGF mostly came from the HUVEC released exosomes following vandetanib or 3-MA treatments.
The above findings indicate that treatments with the VEGFR2 or autophagy inhibitor promote the release of VEGF-enriched exosomes from ECs, especially from those tumor-associated ECs (overexpressing miR-9) ().
VEGF-enriched exosomes promote colony formation and vascular mimicry by HCC cells in vitro
To explore the effect of VEGF-enriched exosomes on HCC development, we treated the malignant HCC cell lines Huh7 and SMMC-7721 with isolated exosomes from HUVECs overexpressing miR-9 and following vandetanib or 3-MA treatment, in the presence and absence of a VEGF neutralizing antibody Bevacizumab. Five μg of exosomes were used in the experiments since 5 μg isolated exosomes from HUVECs overexpressing miR-9 could significantly induce colony and tube formation. show that these VEGF-enriched exosomes significantly increased colony and tube formation in both Huh7 and SMMC-7721 cells, compared to miR-9-enriched exosomes from HUVECs overexpressing miR-9 in the absence of inhibitor treatment. hVEGF had a similar effect on the colony and tube formation as the VEGF-enriched exosomes. Bevacizumab significantly attenuated the colony and tube formation induced by these VEGF-enriched exosomes, suggesting that VEGF is the main cargo in these exosomes that should be responsible for the failure of vandetanib to cause lasting remission of angiogenesis.
Figure 5. VEGF-enriched exosomes induce colony formation and vasculogenic mimicry (VM) by HCC cells.
(a). Colony formation and cell counts (per field of 961.6 mm2) of HuH7 (top) and SMMC-7721 cells (bottom) treated with exosomes from the supernatant of HUVECs overexpressing miR-9 and following administration of vandetanib or 3-MA in the presence of Bevacizumab (Bev). hVEGF was used as a positive control. (b). Tube formation pattern by HuH7 and SMMC-7721 cells treated with exosomes in the presence and absence of Bev. (c-f). Colony count of HuH7 (c) and SMMC-7721 (d) cells. Normalized tube length (to control) of HuH7 (e) and SMMC-7721 (f) cells. Mean ± SEM, n = 3. **P < 0.01; ***P < 0.001 vs. NC; @@P < 0.01, @@@P < 0.001 vs. Bev; #P < 0.05, ###P < 0.001 vs. miR-9. (g). Immunoblot for exosomal proteins from the culture supernatant of HUVECs with and witout miR-9 overexpression and following administration of vandetanib or 3-MA in the presence of 0.001% DMSO or 10 μM GW4869 for 48 h. Mean ± SEM, n = 3. *P < 0.05 vs. miR-9; @@P < 0.01 vs. miR-9 + GW4869. (h-j). Tube formation pattern (h) and normalized tube length of HuH7 (i) and SMMC-7721 (j) cells. HCC cells were co-cultured for 48 h with HUVECs that pretreated with vandetanib or 3-MA in the presence of 0.001% DMSO or 10 μM GW4869 for 48 h (sketch map). n = 3. **P < 0.01, ***P < 0.001 vs. NC; @P < 0.05, @@P < 0.01; @@@P < 0.001 vs. miR-9 + GW4869.
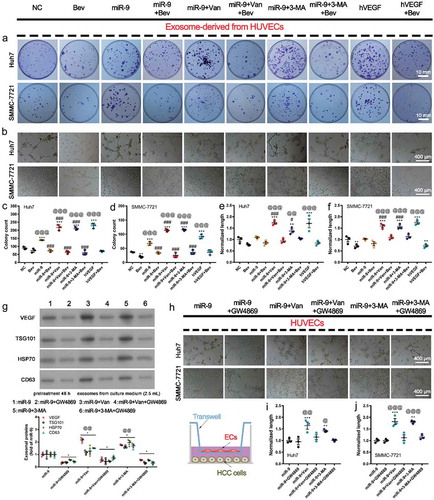
After inhibition of exosome release in HUVECs by GW4869, VEGF was significantly reduced in the cell culture supernatant (), the tube formations by the HCC cells co-cultured with HUVECs overexpressing miR-9 and following vandetanib or 3-MA treatment, were also significantly suppressed (), confirming that the effects on the tube formation were due to the released exosomes which are enriched with VEGF.
Above results demonstrate that VEGF-enriched exosomes promote HCC proliferation and cancer cell vascular mimicry (VM). VM is some uncanny ability of tumor cells to acquire endothelial-like properties and generate vascular patterned networks similar to host endothelial blood vessels [Citation34].
VEGF-enriched exosomes promote tumor vasculogenesis and HCC progression in vivo
To examine the role of VEGF-enriched exosomes in HCC progression in vivo, we injected Matrigel mixed with SMMC-7721 cells and exosomes derived from HUVECs subcutaneously into the ventral region of athymic nude mice. We observed that tumor growth was significantly increased in mice receiving Matrigel mixed with exosomes derived from HUVECs either in the presence of miR-9 (miR-9-enriched exosome, without vandetanib or 3-MA treatment) or absence (NC-exosome) at 10 days and 17 days (P < 0.05), respectively, compared to those receiving Matrigel mixed with phosphate-buffered saline (PBS) (). However, the larger tumors were formed in the mice receiving Matrigel mixed with VEGF-enriched exosomes from HUVECs overexpressing miR-9 following 3-MA treatment. Consistent to that more VEGF-enriched exosomes were induced by vandetanib than by 3-MA (, ), even larger tumor formed as expected when using exosomes from HUVECs overexpressing miR-9 following vandetanib treatment ().
Figure 6. VEGF-enriched exosomes induce tumorigenesis and promote tumor vasculogenesis.
(a–c). In vivo tumorigenesis of SMMC-7721 cells (1.0 × 10⁷ in 500 μL Matrigel) inoculated with phosphate-buffered saline alone or with exosomes (12.5 μg/μl, a total of 100 μg) collected from HUVEC culture supernatant. Images of mice with tumors and harvested tumors after 21 days from SMMC-7721 cells implant (a). Red arrowheads indicate tumors. Tumor volume vs time (b) and tumor weight at 21 days after tumor cell implantation (c). Mean ± SEM, n = 4. *P < 0.05, **P < 0.01; ***P < 0.001 vs. PBS; #P < 0.05, ##P < 0.01 vs. miR-9; @P < 0.05 vs. miR-9 + 3-MA. (d). Endothelial vessels labeled with CD34 (yellow arrowhead) and VM vessels labeled with PAS (blue arrowhead). Data are representatives of three experiments with four animals per group. (e-g). Evaluation of number of endothelial vessels (e), and diameter (f). Area percentage of VM vessels (g). Mean ± SEM, six fields in 0.32 mm2 for each animal, four animals per group, n = 4. *P < 0.05, **P < 0.01; ***P < 0.001 vs. PBS; #P < 0.05, ##P < 0.01, ###P < 0.001 vs. miR-9; @@P < 0.01 vs. miR-9 + 3-MA.
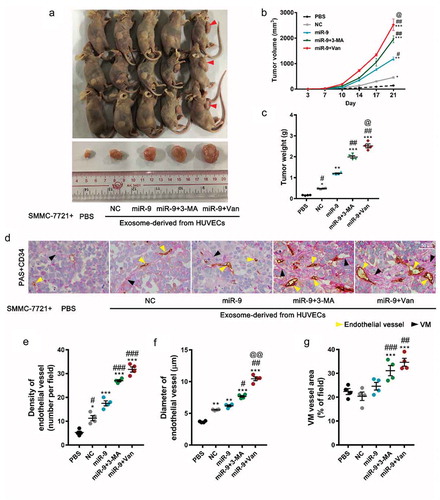
To investigate the microvessel proliferation associated with exosome transfer from the HUVECs, we quantified EC vasculogenesis and VM in the tumor section by immunohistochemical (IHC) staining for CD34 (red in , endothelial vessel indicator) and periodic acid-Schiff (PAS, pink in , VM indicator) staining, respectively (). Exosomes derived from miR-9-overexpressed HUVECs (without vandetanib or 3-MA treatment) did induce more formation of endothelial vessels (P < 0.001 for vessel number and P < 0.01 for vessel diameter) compared to PBS and NC-exosomes, but no more formation of VM. Whereas VEGF-enriched exosomes not only induced even more formation of endothelial vessels () but also more formation of VM (), suggesting that VEGF-enriched exosomes specifically promote VM.
Subsequently we verified the increases in the protein levels of VEGF (), p-Flk1 (), and Flk1 () in tumor cells receiving miR-9- and VEGF-enriched exosomes. These increases were further confirmed by western blot (, ). No changes in apoptosis were observed in tumor cells receiving PBS, and in those receiving NC-, miR-9- and VEGF-enriched exosomes.
Figure 7. VEGF levels and Flk1 activation by VEGF-enriched exosomes.
(a–c). IHC for VEGF (a), p-Flk1 (b), and Flk1 (c) of xenograft tumors. Representatives of three experiments with four animals in each group. (d, e). Immunoblot for VEGF, Flk1, and p-Flk1 in xenograft tumors (d, 50 μg proteins from tumor lysates) and densitometric quantification (e). Mean ± SEM, n = 4. *P < 0.05, **P < 0.01 vs. PBS; #P < 0.05, ##P < 0.01 vs. miR-9; @P < 0.05 vs. miR-9 + 3-MA. (f). Schematic of the hypothetic mechanism for VEGF-enriched exosomes mediating cross-talk between endothelial cells and tumor cells and their promotion of tumor vasculogenesis after anti-angiogenesis and/or anti-autophagy actions. More VEGF-enriched exosomes were generated from the HUVECs treated with vandetanib than from those treated with 3-MA. As expected, anti-angiogenesis actions enhanced the tumor vasculogenesis more compared with anti-autophagy actions.
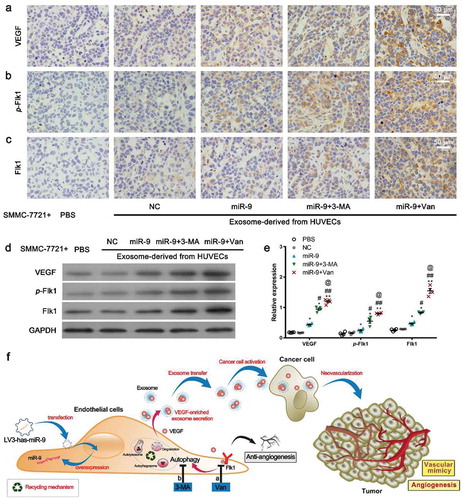
Combining the results from , , , and , we concluded that anti-angiogenesis (e.g. by vandetanib) and/or anti-autophagy (e.g. by 3-MA) initiate the release of VEGF-enriched exosomes from the tumor-associated ECs (overexpressing miR-9), which increase the formation of endothelial vessels and VM, especially the formation of VM in the tumor tissue, and consequently promote tumor growth and progression, as illustrated in .
Discussion
VEGF binding to VEGFRs, such as VEGFR2 (Flk1), initiates a tyrosine kinase signaling cascade to promote angiogenesis for tumor growth and progression [Citation35,Citation36]. Targeting tumor vasculature via VEGFR inhibitors (e.g. vandetanib), or anti-angiogenic therapies (AATs), however, has not resulted in ideal outcomes for most cancer patients [Citation37–Citation39]. Administration of anti-angiogenic agents together with conventional radio- or chemo- therapies has only produced modest survival benefits [Citation40]. Although it has long been recognized that the mechanisms involved in the failure of AATs include the upregulation of alternative proangiogenic pathways, vascular co-option, and resistance to hypoxia [Citation41], how these alternative proangiogenic pathways are developed is a mystery. The results from our study should shed light on it. The finding that anti-VEGFR2 by vandetanib successfully suppressed the angiogenesis of tumor-associated ECs (overexpressing miR-9) and their secretion of VEGFA explains the short-term benefits of AATs. However, vandetanib triggered the release of VEGF-enriched exosomes from ECs, which increased the colony and vascular network formation in HCC in vitro, enhanced endothelial vasculogenesis and VM of HCC and tumor progression in vivo, as well as elevated levels of VEGF, p-Flk1 and Flk1 in the tumor tissue. These findings suggest how the later resistances to AATs are developed. The high level of VEGF also suggests that the newly formed endothelial vessels in the tumor tissue have a leaky wall which is susceptible to tumor invasion and metastasis [Citation42,Citation43].
It has been well established that the “soil” at distant metastatic sites should be first enabled by the factors, e.g. tumor-secreted factors and tumor-shed EVs including exosomes, from the primary tumors, to form suitable microenvironments to the survival and outgrowth of circulating tumor cells (CTCs) before their arrival at these sites (pre-metastatic niches) [Citation44]. It was found that vandetanib induced a significant increase in circulating VEGF and VEGF expression in tumor tissues in HCC patients and xenograft mouse models [Citation39,Citation45,Citation46]. The VEGF-enriched exosomes released from the primary tumor-associated ECs following AATs (by vandetanib) can be a new candidate other than the primary tumor cell-initiated factors to precondition the distant metastatic organs by increasing the permeability of their microvessels for the adhesion and extravasation of CTCs [Citation47–Citation49], as well as for the nutrients supply for tumor growth. Detecting VEGF-enriched exosomes from the blood can be a novel approach for metastatic cancer diagnosis after AATs. Targeting tumor-associated ECs may be as critical as targeting tumors in cancer therapies.
An important difference between AATs and other targeted cancer therapies is that anti-angiogenic agents are usually given to unselected patients for inhibiting the angiogenesis commonly existing in tumor tissues [Citation50]. Oncogenic miR-9 is significantly elevated in HCC tissues and HCC-associated ECs, our findings show that anti-VEGFR2 by vandetanib predominantly increased the release of VEGF-enriched exosomes from miR-9 overexpressed ECs, suggesting that AATs should also be given to selected patients to avoid developing resistances.
We simulated the upregulation of miR-9 in tumor-associated ECs and found that miR-9 promoted EC angiogenesis through activation of VEGF/Flk1 signaling and released miR-9-enriched exosomes which may participate in promoting endothelial vasculogenesis in HCC xenografts in nude mice. Anti-VEGFR2 by vandetanib successfully abolished miR-9 induced EC angiogenesis but triggered the ECs to release VEGF-enriched exosomes.
Since the sensitivity of Apogee A60 Micro Plus Flow Cytometer is 80 nm for the particle size, the exosomal VEGF were further confirmed by WB and ELISA as VEGF-enriched exosomes are in the range of 30–150 nm (). It has been demonstrated that VEGF exists on the lipid-bilayer membrane of the exosomes from the blood sample of glioblastoma multiforme patient [Citation23]. Like cells, lipid-bilayer membrane should be lysed for ELISA detection. In Treps et al’s study [Citation23], EVs were lysed by a 72°C SDS incubation. In our study, we lysed the exosomes using radioimmunoprecipitation assay. The lysed lipid-bilayer membrane released the VEGF from the exosomes and thus led to a higher VEGF level in the isolated exosomes than that in the culture supernatant. In the future, we may seek a better method to isolate the membrane protein from exosomes.
Autophagy is a dynamic process of subcellular degradation and recycling that is essential for cell survival under nutrient-deprived conditions. Autophagy can be tumor-promoting and tumor-suppressing, which depends on the tumor types and treatment methods [Citation51]. It has been demonstrated that miR-9 inhibited autophagy in A549 cells to enhance cisplatin sensitivity [Citation52]. It has also been demonstrated that miR-9 activated autophagy to promote neuronal differentiation [Citation16]. The controversial roles of miR-9 in autophagy depend on the cell type. Our results showed that miR-9 suppressed EC apoptosis but induced autophagy. Induction of autophagy has been shown in AATs-treated ECs [Citation29]. Anti-VEGFR2 by vandetanib abolished miR-9-induced angiogenesis but promoted miR-9-induced autophagy, similarly to other angiogenesis inhibitors such as kringle 5 and endostatin [Citation19].
The induction of autophagy by miR-9 might be associated with multiply target genes. It was demonstrated that miR-9 increases autophagy by regulating histone deacetylases activity in lymphoma cells [Citation53]. Histone deacetylases inhibitors induce autophagy in cells through Forkhead box protein O1 (FOXO1)-dependent pathway [Citation54]. MiR-9 can also directly target on FOXO1 to enhance the invasion and migration of cervical carcinomas [Citation55]. MiR-9 directly targets on Cullin4A (CUL4A) to promote gastric cancer proliferation and invasion by upregulating the Hippo signaling [Citation56] while phosphorylation of LC3 by the Hippo kinases is essential for autophagy [Citation57]. MiR-9 targets on the inhibitors of β-catenin signaling pathway CK1α and GSK3β [Citation58], which contribute to the disruption of the autophagic flux in HCC cells [Citation59]. MiR-9 targets on neurogenic locus notch homolog protein 2 (Notch2) [Citation60], whose pathway is closely associated with autophagy induction in neural progenitor cells [Citation61] and plays an important role in neurogenesis. MiR-9 targets on cyclin D1 [Citation62] that restrains oncogene-induced autophagy [Citation63]. Furthermore, miR-9 directly targets on monocyte chemotactic protein-induced protein 1 (MCPIP1) to promote proliferation of neuronal progenitors by activation of the nuclear factor-kappa B (NF-κB) and cAMP response element-binding protein (CREB) pathways [Citation64]. The suppression of autophagy in pulmonary endothelial cells might be regulated by suppressing NF-κB signaling [Citation55]. Thus, miR-9 may induce autophagy via targeted suppression of FOXO1, CUL4A, CK1α, GSK3β, Notch2, cyclin D1, and MCPIP1. Efforts will be made in future studies to clarify the signaling pathway involved in miR-9-induced autophagy in ECs.
Anti-VEGFR2 and anti-autophagy inhibited the miR-9-induced Flk1 expression and phosphorylation, suggesting that vandetanib inhibits phosphorylation of Flk1, which then is cleared by autophagy rather than recycled, whereas miR-9 increases the recycle of Flk1 by autophagy and the phosphorylation of Flk1 to activate angiogenesis.
Tumor vasculogenesis includes both VM and endothelial vasculogenesis [Citation5,Citation65]. Previous studies suggest that induction of autophagy might be associated with tumor vasculogenesis in some tumors [Citation66,Citation67] but the formation of VM is independent of VEGF-driven angiogenesis through the autophagy pathway and activation of Flk1 [Citation67,Citation68]. Our findings indicate that inhibition of autophagy by 3-MA abolished miR-9-induced EC angiogenesis, similar to that following vandetanib treatment. Therefore, anti-autophagy can be an adjuvant strategy for AATs. Both anti-VEGFR2 and anti-autophagy abolished miR-9-induced angiogenesis although anti-VEGFR2 also promoted autophagy. Anti-autophagy by 3-MA abolished anti-VEGFR2-induced autophagy but did not alter the anti-angiogenic effect induced by anti-VEGFR2. Future studies will be conducted to identify the relevant molecular mechanisms by which anti-autophagy and anti-VEGFR2 contribute to AATs.
On the other hand, inhibition of angiogenesis by vandetanib or 3-MA significantly induced the secretion of VEGF-enriched exosomes from the miR-9 overexpressing ECs with a higher level secretion after vandetanib treatment. Exosomes are intraluminal vesicles released upon fusion of MVBs with the plasma membrane [Citation69]. Inhibition of autophagy may promote EC exosome secretion to remove cellular waste through a fused autophagosome–MVB intracellular compartment [Citation70–Citation72]. However, it was a surprise that inhibition of angiogenesis also promoted ECs to release VEGF-enriched exosomes. But how the VEGF-enriched exosomes are generated and released by anti-angiogenesis and anti-autophagy remains to be found in the future study. Nevertheless, our current results clearly showed the effects of exosomes in tumor vasculogenesis, which resulted from the alternate function of exosomes as intercellular messengers through the delivery of cargos to target other cells, thereby promoting tumor progression and metastasis [Citation20,Citation22,Citation24]. VEGF from these EC released exosomes should be responsible for the failure of vandetanib to cause lasting remission of angiogenesis.
In conclusion, we have discovered that VEGF-enriched exosomes released from the tumor-associated ECs after anti-angiogenesis or anti-autophagy treatments are responsible for the cross-talk between tumor cells and ECs to promote tumor vasculogenesis. Our finding provides an interpretation for how the alternative proangiogenic pathways are developed following AATs. Our study also found that anti-autophagy is as effective as anti-angiogenesis but triggers less release of VEGF-enriched exosomes, suggesting that anti-autophagy is a promising adjuvant to or even a preferred replacement for AATs. Our findings further suggest that control of exosome release or alteration of exosome cargo composition to inhibit tumor vasculogenesis may serve as a novel strategy to augment the long-term efficacy of anti-angiogenic and anti-autophagic therapies for tumors.
Materials and methods
Cell culture
HUVECs (Allcells, Shanghai, China) were cultured in HUVEC medium (HUVEC-004; Allcells) as previously described [Citation73,Citation74]. We used HUVECs at passages three through six. Human HCC cell lines SMMC-7721 and Huh7 were purchased from American Type Culture Collection (ATCC, Manassas, VA, USA) and grown in Dulbecco’s modified Eagle medium high glucose medium (Hyclone; GE Healthcare, Logan, UT, USA USA) with 10% fetal bovine serum (FBS; Hyclone). Cells were maintained at 37°C with 5% CO2.
MiR-9 mimic (5′-TCTTTGGTTATCTAGCTGTATGA-3′) was inserted into the LV3-pGLV-H1-GFP/puro-lentiviral vector (LV3-miR-9; Cat. No. 150611AZ; GenePharma, Shanghai, China). A lentiviral vector (LV3-NC; Cat. No. E23BZ; GenePharma) was used as NC. After DNA sequencing, recombinant lentiviruses (miR-9 mimics and NC) were produced by co-transfection of 293T cells with the lentiviral vectors pGag/Pol, pRev, and pVSV-G and used to infect HUVECs according to the manufacturer’s instructions. Fluorescence-activated cell sorting based on GFP expression was performed after 72 h, and miR-9 overexpression was confirmed by quantitative reverse transcription polymerase chain reaction (qRT-PCR). To investigate the roles of Flk1 and autophagy in tumor-cell migration, invasion, angiogenesis, and the release of exosomes, the Flk1 inhibitor vandetanib (4 μM, S1046, Selleck, Shanghai, China) and autophagy inhibitor 3-MA (5 mM, M9281, Sigma-Aldrich, St. Louis, MO, USA) were administered to pretreated HUVECs for 60 min and subsequently added to the experimental medium (HUVEC basal medium, HUVEC-004B; Allcells). Recombinant human VEGF 165 Protein (50 ng/ml; hVEGF; 293-VE, R&D system, Minneapolis, MN, USA) was used as a positive control. VEGF antibodies (4 μg/ml; Bevacizumab, HY-P9906, MCE, Monmouth Junction, NJ, USA) were used for the in vitro angiogenesis assay and colony formation assay for HCC cells.
Isolation and purification of exosomes
Exosomes were isolated from the cell culture supernatant. Briefly, the lentivirus-infected HUVECs were cultured as monolayers for 48 h in respective complete medium under an atmosphere of 5% CO2 at 37°C. Then, cells were pretreated with or without vandetanib (4 μM) or 3-MA (5 mM) for 60 min, and cultured for 48 h. Exosomes were isolated by differential centrifugation at 300 g (Centrifuge 5804R; Eppendorf, Hamburg, Germany) at 4°C for 20 min and 3000 g at 4°C for 20 min to remove dead cells and cell debris, followed by a 30 min centrifugation at 10,000 g (Centrifuge 5804; Eppendorf) at 4°C to pellet the MVs. The supernatant was filtered with a 0.22 μm filter (Millipore, Billerica, MA, USA). Exosomes in the supernatant were subsequently pelleted by ultracentrifugation (Optima L-80 XP, Beckman Coulter, Brea, CA, USA) for 2 h at 100,000 g. The final EV pellet was resuspended in 100 μL PBS and stored at 4°C.
Nano-flow cytometry analysis of exosomes
To detect specific surface proteins, exosomes were isolated from 50 mL culture supernatants of about 5 × 10⁷ HUVECs and incubated with anti-VEGF antibody (1:200; ab52917; Abcam, Cambridge, MA, USA) for 30 min at 25°C, and then incubated with Alexa Fluor 488 goat anti-rabbit IgG secondary antibody (1:2000; H&L; ab150081; Abcam) for 10 min at 25°C. Rabbit IgG (1:2000; monoclonal; ab172730; Abcam) and unlabeled sample were used as isotype control and blank control, respectively. Then, exosomes were analyzed on an Apogee A60 Micro Plus Flow Cytometer (Apogee Flow Systems, Northwood, UK) that was specially developed for the analysis of nanoparticles (http://www.apogeeflow.com/products.php).
The reference ApogeeMix beads with a refractive index of 1.59 (mixture of 110 and 500 nm green fluorescent latex beads; Cat#1493; Apogee Flow Systems) and non-fluorescent silica beads (180, 240, 300, 590, 880, and 1300 nm; http://www.apogeeflow.com/products.php) with a refractive index of 1.43 were used to assess the flow cytometer performance and exosome size distribution. PBS was used as a background control. Default settings were used for the reference beads and exosome samples. Large angle light scatter (LALS) was used for particle sizing using a sample flow rate of 1.5 μL/min and a total volume of 130 μL. The sample flow rate thresholds for the laser (488-LALS) were set as 30 V and 350 V, and those for the 488-Grn (green fluorescence) laser were 17 V and 475 V. After gating the background, events in the region of interest were calculated using Apogee Histogram software (v255.0.0.68; Apogee Flow Systems).
In vitro angiogenesis assay and colony formation assay
When plated on Matrigel, HUVECs undergo differentiation into capillary-like tube structures in vitro. A tube-formation assay was used to evaluate angiogenesis in vitro as previously described [Citation75]. The 24-well plates were coated with Matrigel (300 μL/well; BD Biosciences, San Jose, CA, USA) without introducing air bubbles. After gelling of the Matrigel, 5 × 10⁴ lentivirus-infected HUVECs were plated into each Matrigel-coated well along with 200 μL of HUVEC basal medium containing 10% FBS. To evaluate roles for exosomes derived from HUVECs in VM of malignancy, 5 × 10⁴ HCC cells (Huh7 or SMMC-7721) were plated into each Matrigel-coated well along with 200 μL of Dulbecco’s modified Eagle high glucose medium containing 10% FBS and 5 μg exosomes. The amount of exosomes was detected by measuring the total protein content using a protein determination kit (Cayman Chemical Company, Ann Arbor, MI, USA). After 6 h (HUVEC angiogenesis) or 8 h (VM by HCC cells) incubation at 37°C in a 5% CO2/95% air incubator, the medium was gently aspirated from each well and incubated with Diff-Quick fixative (Dade Behring, Deerfield, IL, USA) for 30 s and subsequently stained with solution II for 2 min. Tube structures were observed and imaged by microscopy. The pseudo-vascular organization of cells was analyzed by ImageJ software (version 1.51s; National Institutes of Health, Bethesda, MD, USA) using the Angiogenesis Analyzer plugin (written by Gilles Carpentier, 2012. The plugin is available at http://imagej.nih.gov/ij/macros/toolsets/Angiogenesis%20Analyzer.txt).
The crosstalk between HUVECs and HCC cells were performed by Transwell (BD Biosciences). Cells were seeded at a density of 1 × 10⁴ HUVECs per Transwell insert. After pretreatment with culture media containing 0.001% dimethyl sulfoxide (DMSO) and 10 μM GW4869 (dissolved in DMSO; D1692, Sigma-Aldrich, USA) in the presence of vandetanib or 3-MA for 48 h, the Transwell inserts with HUVECs were co-cultured with 5 × 10⁴ HCC cells on the 24-well plates for 48 h. Tube structures were observed and imaged by microscopy.
For the colony formation assay, HCC cells were seeded in a 35-mm cell culture dish at a density of 2 × 10⁴ cells/well and treated with 5 μg of exosomes for 14 days to form colonies. Cells were stained with crystal violet (0.5%, w/v), photographed by microscopy, and quantified using ImageJ software.
In vivo angiogenesis assay
The murine Matrigel plug was used to evaluate angiogenesis in vivo [Citation76]. Use of animals was in accordance with animal care guidelines, and all animal experiments were approved by the Animal Care and Use Committee of Sichuan University, China. Matrigel (500 μL) was subcutaneously injected either alone or mixed with 1.0 × 10⁷ lentivirus-infected HUVECs into the ventral region of three athymic BALB/c Nu/Nu 6-week-old nude mice (Guangdong Medical Lab Animal Center, Guangdong, China) to form a Matrigel plug. Mice were sacrificed at 7-days after injection, and the Matrigel plug was removed, fixed with formalin, and embedded in paraffin. The level of angiogenesis was determined by hematoxylin and eosin and immunohistochemistry (IHC) staining of CD34 and CD31. The amount and size of vascular vessels were analyzed using ImageJ software. Apoptotic cells were detected by the terminal deoxynucleotidyl transferase dUTP nick end labelling (TUNEL) assay.
In vivo tumorigenesis assay
Matrigel (500 µL) was mixed with a total of 1.0 × 10⁷ SMMC-7721 cells and 100 µg of exosomes derived from HUVECs (NC lentivirus-infected HUVECs or miR-9-mimic lentivirus-infected HUVECs in the presence or absence of 3-MA or vandetanib), and subcutaneously injected into the right flank of three 6-week-old Balb/c athymic nude female mice. Matrigel mixed with SMMC-7721 cells and PBS was used as a control. Tumor sizes were measured weekly, and growth curves were plotted. Three weeks later, the mice were euthanized, the dissected tumors were collected and weighted, and tumor volumes were assessed via caliper measurement. Vasculogenesis was assessed by IHC staining and western blot detection of CD34-PAS, VEGF, Flk1, and p-Flk1.
Cell migration and invasion assays
After pretreatment, lentivirus-infected HUVECs were digested with 0.25% EDTA trypsin and resuspended in HUVEC basal medium with or without 4 μM vandetanib, 5 mM 3-MA or 50 ng/mL hVEGF. Cells were seeded at a density of 1 × 10⁵ cells per Transwell (BD Biosciences), and HUVEC basal medium containing 10% FBS was added to the lower chamber. After 48 h, cells were fixed with 4% paraformaldehyde for 10 min, followed by washing twice with PBS and staining with crystal violet (0.5%, w/v). Non-invading cells were removed using a cotton swab, and cells that had migrated through the membrane were quantified [Citation77]. The Transwell membrane was precoated with Matrigel for invasion and not precoated for migration.
Enzyme-linked immunosorbent assay (ELISA) detection of VEGF
Lentivirus-infected HUVECs were pretreated with vandetanib and/or 3-MA for 60 min, and VEGF levels in cell-culture supernatant, exosome-depleted media and exosomes were determined using an ELISA kit (Catalog#PDVE00; R&D Systems, Minneapolis, MN, USA) according to the manufacturer’s instructions. For exosome pellets, proteins were extracted by radioimmunoprecipitation assay lysis.
qRT-PCR
RNA was extracted from cells, tissues, and exosome pellets using TRIzol (Invitrogen, Carlsbad, CA, USA), and qRT-PCR assays were performed using a SYBR Premix Ex Taq kit (TaKaRa, Shiga, Japan) as previously described [Citation73]. The primer sequences were as follows: VEGF, 5′-CTGACGGACAGACAGACAGACACC-3′ (forward) and 5′-AGCCCAGAAGTTGGACGAAAA-3′ (reverse); Flk1, 5′-ACCTGGAGAATCAGACGACAA-3′ (forward) and 5′- GGTTCCCATCCTTCAATACAAT-3′ (reverse); and β-actin, 5′-ATCGTGCGTGACATTAAGGAGAAG-3′ (forward) and 5′-AGGAAGGAAGGCTGGAAGAGTG-3′ (reverse). All primers and probes were obtained from TaKaRa. Gene expression was normalized to that of β-actin using the 2−△△CT method, and data are presented as expression relative to the indicated controls. The stem-loop primers and probes for mature miR-9 and U6 small nuclear (sn)RNA were as follows: hsa-miR-9-5p, 5′-ACACTCCAGCTGGGTCTTTGGTTATCTAG-3′ (forward) and 5′-CTCAACTGGTGTCGTGGAGTCGGCAATTCAGTTGAGTCATACAG-3′ (reverse); and U6 snRNA 5′-CTCGCTTCGGCAGCACA-3′ (forward) and 5′-AACGCTTCACGAATTTGCGT-3′ (reverse). The relative expression level of miR-9 was normalized to that of U6 snRNA and shown as a ratio relative to the expression level in the control. For exosomal miR-9 detection, the synthetic miRNA Caenorhabditis elegans miR-39 (cel-miR-39; 5 fmol/μL; Sequence: 5ʹ-UCACCGGGUGUAAAUCAGCUUG-3′; Qiagen, Hilden, Germany) was added to the isolated RNAs and was used as an exogenous control. Data are representative of three independent experiments.
Western blotting
Proteins were extracted from cells, tissues, and exosome pellets using radioimmunoprecipitation assay lysis buffer containing a protease-inhibitor cocktail (Beyotime, Beijing, China). After determination of protein concentration using a protein determination kit (Cayman Chemical Company, USA), equal amounts (20–30 µg for cells, 10 µg for exosome pellets, and 50 µg for tissues) of protein samples or exosomal proteins from 2.5 mL culture supernatant were size fractionated by sodium dodecyl sulfate polyacrylamide gel electrophoresis, electrotransferred onto a polyvinylidene fluoride membrane (Millipore), blocked with 5% non-fat milk in PBS, and hybridized with antibodies against VEGF (TA500289; Origene, Rockville, MD, USA), Flk1 (#9698; Cell Signaling Technology, Danvers, MA, USA), p-Flk1(Tyr1175; #19A10; Cell Signaling Technology), LC3BI/II (ab192890; Abcam), TSG101 (14,497–1-AP; Proteinteck; Rosemont, IL, USA), HSP70 (10,995–1-AP; Proteinteck), CD63 (ab134045; Abcam), and GRP94 (ab3674; Abcam) at 4°C overnight. A 1:1000 dilution of the antibodies was used for detection. Glyceraldehyde-3-phosphate dehydrogenase (GAPDH) was used as an internal control. The blots were incubated with the corresponding horseradish peroxidase (HRP)-conjugated secondary antibodies (1:5000; Beyotime), and enhanced chemiluminescence was performed using an Immobilon western chemiluminescent HRP substrate (WBKLS0050; Millipore) to visualize the bands. Densitometric quantification was performed using ImageJ software.
Immunostaining and confocal microscopy
Immunofluorescence staining and quantitative analysis of LC3BII and p-Flk1 were performed as previously described [Citation78,Citation79]. After treatment, HUVECs were immediately fixed with 2% paraformaldehyde/0.1% glutaraldehyde for 30 min, permeabilized with 0.1% Triton X-100 (T-8787; Sigma-Aldrich) for 5 min, blocked with 2% goat serum (Invitrogen) for 30 min, stained with antibodies against p-Flk1 (1:100; Tyr1175; #19A10; 1:100; Cell Signaling Technology) and LC3B (1:100; ab192890; 1:100; Abcam) at 4°C overnight, and visualized with Alexa Fluor 647 goat anti-rabbit IgG H&L (1:300; ab150076; Abcam) and Alexa Fluor 594 donkey anti-rabbit IgG H&L (1:300; ab150079; Abcam) secondary antibodies for 1 h at 25°C. All samples were imaged using a Zeiss LSM 510 laser-scanning confocal microscope (Carl Zeiss, Oberkochen, Germany) using a Plan-Apochromat 63×/1.4 oil DIC objective, and image stacks were analyzed with ImageJ software. Quantification of autophagic vacuoles was performed by calculating the numbers of LC3 puncta.
For immunostaining of CD34 in the Matrigel plug, samples were immediately frozen in OCT compound, cut into 5-μm cryosections, and fixed with cold acetone at 4°C for 5 min. After permeabilization with 0.1% Triton X-100 (T-8787; Sigma-Aldrich) for 10 min and blocking with 1% bovine serum albumin for 1 h at 25°C, sections were incubated with the primary antibody against CD34 (1:100; ab81289; Abcam) at 4°C. Samples were then incubated with Alexa Fluor 647 goat anti-rabbit IgG H&L (1:300; ab150076; Abcam) for 1 h and 4′,6-diamidino-2-phenylindole (DAPI; 1 µg/mL; Thermo Fisher Scientific, Waltham, MA, USA) for 5 min at 25°C. Images were captured using confocal microscopy.
Immunohistochemistry (IHC) staining
Matrigel plugs and xenograft tumor samples were immediately dehydrated in 70% ethanol three times for 30 min at 25°C, 90% ethanol two times for 30 min at 25°C, and 100% ethanol three times for 30 min at 25°C and xylene three times for 20 min at 25°C, fixed in formaldehyde fixative solution and embedded in paraffin at 58°C, and then 3-μm sections were cut and immunostained. First, slides were immersed in xylene two times for 15 min each, 100% ethanol two times for 5 min each, 85% ethanol for 5 min and 75% ethanol for 5 min, rinsed with deionized H2O, and immersed into 92–95°C preheated retrieval solution (Catalog# CTS015, R&D Systems) for 8 min and cool for 8 min at 25°C. Slides were rinsed with deionized water, incubated with 3%H2O2 in water for 15 min in the dark, and blocked in 3% bovine serum albumin for 30 min at 25°C. The slides were incubated with primary antibodies diluted in incubation solution containing 1% bovine serum albumin, 0.3% Triton X-100 and 0.01% sodium azide in PBS overnight at 4°C. The primary antibodies included those against CD34 (1:100; ab81289; Abcam), human CD31 (1:100; GB11063-1, Servicebio, China), mouse CD31 (1:100; GB11063-3, Servicebio), VEGFA (1:100; TA500289; Origene), Flk1 (1:100; #9698; Cell Signaling Technology), p-Flk1 (Tyr1175; 1:100; #19A10; Cell Signaling Technology), and LC3B (1:100; ab192890; Abcam). After three washes in PBS for 5 min, slides were incubated with HRP-conjugated secondary antibodies (1:5000; Beyotime) for 50 min. For CD31 staining, slides were incubated with Alexa Fluor 647 goat anti-rabbit IgG H&L (1:300; ab150076; Abcam) for 1 h and 1 µg/mL DAPI for 5 min at 25°C. After three washes in PBS for 5 min each, slides were incubated with fresh DAB Chromogen Solution (Abcam) for 10 min and nuclear counterstained with hematoxylin for 3 min. For CD34-PAS staining, sections were subsequently incubated with PAS for 15 min after IHC staining of CD34. Slides were immediately dehydrated in 75% ethanol for 6 min, 85% ethanol for 6 min, and 100% ethanol two times for 6 min and xylene two times for 5 min, and finally mounted in PermountTM mounting medium (Thermo Fischer Scientific, Pittsburgh, PA, USA) and visualized under a microscope using a bright-field illumination.
TUNEL assay
For TUNEL staining, an in situ cell death detection kit with horseradish peroxidase (POD; Roche, Basel, Switzerland) was used according to the manufacturer’s protocol. After deparaffinization and rehydration, sections were incubated with protease K (40 μg/mL) for 15 min at 37°C and 3.0% hydrogen peroxide for 5 min to remove endogenous peroxidase. The samples were immersed in TUNEL reaction mixture for 75 min at 37°C in the dark, followed by incubation with Converter-POD (Roche) for 30 min. Images were captured by optical microscopy.
Acridine orange (AO) staining of autophagosomes
AO (Sigma-Aldrich) was used to evaluate the formation of acidic vesicular organelles during autophagy. After treatment, HUVECs were washed with PBS once and incubated with AO (1 µg/mL) for 15 min at 37°C in the dark. Cells were then washed with PBS and observed under an inverted fluorescence microscope (Olympus IX71; Olympus, Tokyo, Japan).
Transmission electron microscopy
After treatment, HUVECs were immediately fixed with 2% electron-microscopy-grade glutaraldehyde (Polysciences, Warrington, PA, USA) in 0.1 M sodium cacodylate buffer (pH 7.4) for 30 min. Cells were then washed once with sodium cacodylate buffer, post-fixed using 1% osmium tetroxide (Electron Microscopy Sciences, Hatfield, PA, USA) in 0.1 M sodium cacodylate buffer for 1 h, and en bloc-stained with 1% uranyl acetate (Polysciences) in 70% ethanol for 1.5 h. After dehydration in ascending grades (50–100%) of ethanol, samples were embedded in an epoxy resin mixture of Epon 812 and Araldite M (Sigma-Aldrich). Ultrathin sections (40 nm) were analyzed using a transmission electron microscope (Tecnai G2 Spirit; BioTWIN; FEI; Thermo Fisher Scientific). For isolated exosomes, the resuspended pellets (10 μL) were absorbed onto formvar/carbon-coated copper grids for 5 min at 25°C, contrasted with 10 μL of 1% phosphatotungstic acid for 5 min at 25°C, and examined using transmission electron microscopy. For gold labelling, exosomes were fixed with 2%PFA for 30 min and absorbed onto formvar/carbon-coated copper grids for 20 min at 25°C, followed by washing in 50 mM glycine for 3 min and PBS. The exosomes were blocked with 5%BSA for 10 min, washed with PBS and incubated with CD63 rabbit monoclonal antibody (Ab134045, Abcam) for 30 min at 37°C followed by washing in PBS. Then, the exosomes were incubated with 15 nm gold-conjugated goat anti-rabbit IgG (D111094; Sangon Biotech, Shanghai, China) for 30 min, 1% glutaraldehyde for 3 min, washed in distilled water and finally embedded in 2% phosphatotungstic acid.
Statistical analysis
Statistical significance was determined by student’s t-test or one-way analysis of variance with either the least significant difference test or Tamhane’s T2 test (depending on Levene’s statistic for homogeneity of variance) using SPSS software (v24.0; IBM, Armonk, NY, USA). P < 0.05 was considered statistically significant.
Author contributions
Y.Z. and B.M.F. designed the studies. Y.Z., X.H.Y., and Z.P.Y. performed and analyzed the experiments. Y.Z. and B.M.F. wrote the manuscript. X.H.Y. and B.M.F. assisted with the flow cytometry, data analysis and collection of the samples. X.L.H. and J.W. helped with tissue staining. X.H.L., L.L., and X.J.L. contributed to study design. Y.Z. and B.M.F. oversaw all data analysis.
Disclosure of interest
The authors report no conflicts of interest.
Supplemental Material
Download Zip (2.7 MB)Acknowledgments
The authors would like to thank Bio-Gene Technology Ltd., Hong Kong for help with exosomes analysis using the Apogee A60 Micro Plus Flow Cytometer.
Additional information
Funding
Related Research Data
References
- Cully M. Cancer: tumour vessel normalization takes centre stage. Nat Rev Drug Discov. 2017 Feb 02;16(2):87. PubMed PMID: 28148936.
- Park JS, Kim IK, Han S, et al. Normalization of tumor vessels by tie2 activation and ang2 inhibition enhances drug delivery and produces a favorable tumor microenvironment. Cancer Cell. 2017 Jan 09;31(1):157–20. PubMed PMID: 28073001.
- Hendrix MJ, Seftor EA, Hess AR, et al. Vasculogenic mimicry and tumour-cell plasticity: lessons from melanoma. Nat Rev Cancer. 2003 Jun;3(6):411–421. PubMed PMID: 12778131; eng.
- Wagenblast E, Soto M, Gutierrez-Angel S, et al. A model of breast cancer heterogeneity reveals vascular mimicry as a driver of metastasis. Nature. 2015 Apr 16;520(7547):358–362. PubMed PMID: 25855289; PubMed Central PMCID: PMCPMC4634366. eng.
- Holash J, Maisonpierre PC, Compton D, et al. Vessel cooption, regression, and growth in tumors mediated by angiopoietins and VEGF. Science (New York, NY). 1999 Jun 18;284(5422):1994–1998. PubMed PMID: 10373119; eng.
- Kuczynski EA, Yin M, Bar-Zion A, et al. Co-option of liver vessels and not sprouting angiogenesis drives acquired sorafenib resistance in hepatocellular carcinoma. J Natl Cancer Inst. 2016 Aug;108(8). PubMed PMID: 27059374; PubMed Central PMCID: PMCPMC5017954. eng. DOI:10.1093/jnci/djw030
- Angara K, Borin TF, Arbab AS. Vascular mimicry: a novel neovascularization mechanism driving anti-angiogenic therapy (AAT) resistance in glioblastoma. Transl Oncol. 2017 Jun 29;10(4):650–660. PubMed PMID: 28668763; eng.
- Torre LA, Bray F, Siegel RL, et al. Global cancer statistics, 2012. CA Cancer J Clin. 2015 Mar;65(2):87–108. PubMed PMID: 25651787.
- Jayson GC, Kerbel R, Ellis LM, et al. Antiangiogenic therapy in oncology: current status and future directions. Lancet. 2016 Jul 30;388(10043):518–529. PubMed PMID: 26853587; eng.
- Zhuang G, Wu X, Jiang Z, et al. Tumour-secreted miR-9 promotes endothelial cell migration and angiogenesis by activating the JAK-STAT pathway. Embo J. 2012 Aug 29;31(17):3513–3523. PubMed PMID: 22773185; PubMed Central PMCID: PMCPMC3433782. eng.
- Bartel DP. MicroRNAs: target recognition and regulatory functions. Cell. 2009 Jan 23;136(2):215–233. PubMed PMID: 19167326; PubMed Central PMCID: PMCPMC3794896. eng.
- Drakaki A, Hatziapostolou M, Polytarchou C, et al. Functional microRNA high throughput screening reveals miR-9 as a central regulator of liver oncogenesis by affecting the PPARA-CDH1 pathway. BMC Cancer. 2015 Jul 24;15:542. PubMed PMID: 26206264; PubMed Central PMCID: PMCPMC4512159.
- Zhen Y, Xinghui Z, Chao W, et al. Several microRNAs could predict survival in patients with hepatitis B-related liver cancer. Sci Rep. 2017 Mar 21;7:45195. PubMed PMID: 28322348; PubMed Central PMCID: PMCPMC5359660. eng.
- Ma L, Young J, Prabhala H, et al. miR-9, a MYC/MYCN-activated microRNA, regulates E-cadherin and cancer metastasis. Nat Cell Biol. 2010 Mar;12(3):247–256. PubMed PMID: 20173740; PubMed Central PMCID: PMCPMC2845545. eng.
- Shojaei F, Wu X, Malik AK, et al. Tumor refractoriness to anti-VEGF treatment is mediated by CD11b+Gr1+ myeloid cells. Nat Biotechnol. 2007 Aug;25(8):911–920. PubMed PMID: 17664940; eng.
- Zhang GY, Wang J, Jia YJ, et al. MicroRNA-9 promotes the neuronal differentiation of rat bone marrow mesenchymal stem cells by activating autophagy. Neural Regen Res. 2015 Feb;10(2):314–320. PubMed PMID: 25883633; PubMed Central PMCID: PMCPMC4392682. eng.
- Mowers EE, Sharifi MN, Macleod KF. Functions of autophagy in the tumor microenvironment and cancer metastasis. Febs J. 2018 May;285(10):1751–1766. PubMed PMID: 29356327; PubMed Central PMCID: PMCPMC5992019. eng. .
- Du J, Teng RJ, Guan T, et al. Role of autophagy in angiogenesis in aortic endothelial cells. Am J Physiol Cell Physiol. 2012 Jan 15;302(2):C383–91. PubMed PMID: 22031599; PubMed Central PMCID: PMCPMC3328843.
- Ramakrishnan S, Nguyen TM, Subramanian IV, et al. Autophagy and angiogenesis inhibition. Autophagy. 2007 Sep - Oct;3(5):512–515. PubMed PMID: 17643071; eng.
- Todorova D, Simoncini S, Lacroix R, et al. Extracellular vesicles in angiogenesis. Circ Res. 2017 May 12;120(10):1658–1673. PubMed PMID: 28495996; PubMed Central PMCID: PMCPMC5426696. eng.
- Skog J, Wurdinger T, van Rijn S, et al. Glioblastoma microvesicles transport RNA and proteins that promote tumour growth and provide diagnostic biomarkers. Nat Cell Biol. 2008 Dec;10(12):1470–1476. PubMed PMID: 19011622; PubMed Central PMCID: PMCPMC3423894.
- Kamerkar S, LeBleu VS, Sugimoto H, et al. Exosomes facilitate therapeutic targeting of oncogenic KRAS in pancreatic cancer. Nature. 2017 Jun 22;546(7659):498–503. PubMed PMID: 28607485; PubMed Central PMCID: PMCPMC5538883.
- Treps L, Perret R, Edmond S, et al. Glioblastoma stem-like cells secrete the pro-angiogenic VEGF-A factor in extracellular vesicles. J Extracell Vesicles. 2017;6(1):1359479. PubMed PMID: 28815003; PubMed Central PMCID: PMCPMC5549846. eng.
- Hoshino A, Costa-Silva B, Shen TL, et al. Tumour exosome integrins determine organotropic metastasis. Nature. 2015 Nov 19;527(7578):329–335. PubMed PMID: 26524530; PubMed Central PMCID: PMCPMC4788391. eng.
- Amin MA, Campbell PL, Ruth JH, et al. A key role for Fut1-regulated angiogenesis and ICAM-1 expression in K/BxN arthritis. Ann Rheum Dis. 2015 Jul;74(7):1459–1466. PubMed PMID: 24665114; eng.
- Jiang L, Lin L, Li R, et al. Dimer conformation of soluble PECAM-1, an endothelial marker. Int J Biochem Cell Biol. 2016 Aug;77(Pt A):102–108. PubMed PMID: 27270333; eng.
- Schlingemann RO, Rietveld FJ, de Waal RM, et al. Leukocyte antigen CD34 is expressed by a subset of cultured endothelial cells and on endothelial abluminal microprocesses in the tumor stroma. Lab Invest. 1990 Jun;62(6):690–696. PubMed PMID: 1694254; eng.
- Dan NZ, Khush KK, Romero LI, et al. CD34 is involved in endothelial cell apoptosis and angiogenesis. J Invest Dermatol. 1997;108(4):581.
- Nguyen TM, Subramanian IV, Xiao X, et al. Endostatin induces autophagy in endothelial cells by modulating beclin 1 and beta-catenin levels. J Cell Mol Med. 2009 Sep;13(9b):3687–3698. PubMed PMID: 19298526; PubMed Central PMCID: PMCPMC4516517. eng.
- Williams TF, Mirando AC, Wilkinson B, et al. Secreted threonyl-tRNA synthetase stimulates endothelial cell migration and angiogenesis. Sci Rep. 2013;3:1317. PubMed PMID: 23425968; PubMed Central PMCID: PMCPMC3578223.
- Bazzoni G, Dejana E. Endothelial cell-to-cell junctions: molecular organization and role in vascular homeostasis. Physiol Rev. 2004 Jul;84(3):869–901. PubMed PMID: 15269339; eng. .
- Lotvall J, Hill AF, Hochberg F, et al. Minimal experimental requirements for definition of extracellular vesicles and their functions: a position statement from the international society for extracellular vesicles. J Extracell Vesicles. 2014;3:26913. PubMed PMID: 25536934; PubMed Central PMCID: PMCPMC4275645. eng.
- D’Souza-Schorey C, Clancy JW. Tumor-derived microvesicles: shedding light on novel microenvironment modulators and prospective cancer biomarkers. Genes Dev. 2012 Jun 15;26(12):1287–1299. PubMed PMID: 22713869; PubMed Central PMCID: PMCPMC3387656. eng.
- Maniotis AJ, Folberg R, Hess A, et al. Vascular channel formation by human melanoma cells in vivo and in vitro: vasculogenic mimicry. Am J Pathol. 1999 Sep;155(3):739–752. PubMed PMID: 10487832; PubMed Central PMCID: PMCPMC1866899. eng.
- Ferrara N, Adamis AP. Ten years of anti-vascular endothelial growth factor therapy. Nat Rev Drug Discov. 2016 Jun;15(6):385–403. PubMed PMID: 26775688; eng. .
- Hoeben A, Landuyt B, Highley MS, et al. Vascular endothelial growth factor and angiogenesis. Pharmacol Rev. 2004 Dec;56(4):549–580. PubMed PMID: 15602010; eng.
- Hurwitz H, Fehrenbacher L, Novotny W, et al. Bevacizumab plus irinotecan, fluorouracil, and leucovorin for metastatic colorectal cancer. N Engl J Med. 2004 Jun 3;350(23):2335–2342. PubMed PMID: 15175435.
- Perren TJ, Swart AM, Pfisterer J, et al. A phase 3 trial of bevacizumab in ovarian cancer. N Engl J Med. 2011 Dec 29;365(26):2484–2496. PubMed PMID: 22204725; eng.
- Hsu C, Yang TS, Huo TI, et al. Vandetanib in patients with inoperable hepatocellular carcinoma: a phase II, randomized, double-blind, placebo-controlled study. J Hepatol. 2012 May;56(5):1097–1103. PubMed PMID: 22245891; eng.
- Haas NB, Manola J, Uzzo RG, et al. Adjuvant sunitinib or sorafenib for high-risk, non-metastatic renal-cell carcinoma (ECOG-ACRIN E2805): a double-blind, placebo-controlled, randomised, phase 3 trial. Lancet. 2016 May 14;387(10032):2008–2016. PubMed PMID: 26969090; PubMed Central PMCID: PMCPMC4878938. eng.
- Mitamura T, Gourley C, Sood AK. Prediction of anti-angiogenesis escape. Gynecol Oncol. 2016 Apr;141(1):80–85. PubMed PMID: 26748214; PubMed Central PMCID: PMCPMC4808422. eng. .
- Bates DO, Hillman NJ, Williams B, et al. Regulation of microvascular permeability by vascular endothelial growth factors. J Anat. 2002 Jun;200(6):581–597. PubMed PMID: 12162726; PubMed Central PMCID: PMCPMC1570751. eng.
- Shen S, Fan J, Cai B, et al. Vascular endothelial growth factor enhances cancer cell adhesion to microvascular endothelium in vivo. Exp Physiol. 2010 Feb;95(2):369–379. PubMed PMID: 19880535; PubMed Central PMCID: PMCPMC2859456. eng.
- Peinado H, Zhang H, Matei IR, et al. Pre-metastatic niches: organ-specific homes for metastases. Nat Rev Cancer. 2017 May;17(5):302–317. PubMed PMID: 28303905; eng.
- Inoue K, Torimura T, Nakamura T, et al. Vandetanib, an inhibitor of VEGF receptor-2 and EGF receptor, suppresses tumor development and improves prognosis of liver cancer in mice. Clin Cancer Res off J Am Assoc Cancer Res. 2012 Jul 15;18(14):3924–3933. 10.1158/1078-0432.ccr-11-2041. PubMed PMID: 22611027; eng.
- Iwamoto H, Torimura T, Nakamura T, et al. Metronomic S-1 chemotherapy and vandetanib: an efficacious and nontoxic treatment for hepatocellular carcinoma. Neoplasia (New York, NY). 2011 Mar;13(3):187–197. PubMed PMID: 21390182; PubMed Central PMCID: PMCPMC3050862. eng.
- Fan J, Fu BM. Quantification of malignant breast cancer cell MDA-MB-231 transmigration across brain and lung microvascular endothelium. Ann Biomed Eng. 2016 Jul;44(7):2189–2201. 10.1007/s10439-015-1517-y. PubMed PMID: 26603751; PubMed Central PMCID: PMCPMC4879597. eng.
- Fu BM, Yang J, Cai B, et al. Reinforcing endothelial junctions prevents microvessel permeability increase and tumor cell adhesion in microvessels in vivo. Sci Rep. 2015 Oct 28;5:15697. PubMed PMID: 26507779; PubMed Central PMCID: PMCPMC4623601. eng.
- Zhang L, Zeng M, Fu BM. Inhibition of endothelial nitric oxide synthase decreases breast cancer cell MDA-MB-231 adhesion to intact microvessels under physiological flows. Am J Physiol Heart Circ Physiol. 2016 Jun 1;310(11):H1735–47. PubMed PMID: 27059076; PubMed Central PMCID: PMCPMC4935524. eng.
- Jain RK. Antiangiogenesis strategies revisited: from starving tumors to alleviating hypoxia. Cancer Cell. 2014 Nov 10;26(5):605–622. PubMed PMID: 25517747; PubMed Central PMCID: PMCPMC4269830.
- Sui X, Chen R, Wang Z, et al. Autophagy and chemotherapy resistance: a promising therapeutic target for cancer treatment. Cell Death Dis. 2013 Oct 10;4:e838. PubMed PMID: 24113172; PubMed Central PMCID: PMCPMC3824660. eng.
- Zhang Y, Meng X, Li C, et al. MiR-9 enhances the sensitivity of A549 cells to cisplatin by inhibiting autophagy. Biotechnol Lett. 2017 Jul;39(7):959–966. PubMed PMID: 28337557; eng.
- Kang R, Zeh HJ, Lotze MT, et al. The beclin 1 network regulates autophagy and apoptosis. Cell Death Differ. 2011 Apr;18(4):571–580. PubMed PMID: 21311563; PubMed Central PMCID: PMCPMC3131912. eng.
- Zhang J, Ng S, Wang J, et al. Histone deacetylase inhibitors induce autophagy through FOXO1-dependent pathways. Autophagy. 2015 Apr 3;11(4):629–642. PubMed PMID: 25919885; PubMed Central PMCID: PMCPMC4502718. eng.
- Aishanjiang A, Rouzi N, Jiao Z, et al. MicroRNA-9 enhances invasion and migration of cervical carcinomas by directly targeting FOXO1. Eur Rev Med Pharmacol Sci. 2018 Apr;22(8):2253–2260. PubMed PMID: 29762826; eng.
- Deng J, Lei W, Xiang X, et al. Cullin 4A (CUL4A), a direct target of miR-9 and miR-137, promotes gastric cancer proliferation and invasion by regulating the Hippo signaling pathway. Oncotarget. 2016 Mar 1;7(9):10037–10050. PubMed PMID: 26840256; PubMed Central PMCID: PMCPMC4891102. eng.
- Wilkinson DS, Jariwala JS, Anderson E, et al. Phosphorylation of LC3 by the Hippo kinases STK3/STK4 is essential for autophagy. Mol Cell. 2015 Jan 8;57(1):55–68. PubMed PMID: 25544559; PubMed Central PMCID: PMCPMC4373083. eng.
- Li X, He L, Yue Q, et al. MiR-9-5p promotes MSC migration by activating beta-catenin signaling pathway. Am J Physiol Cell Physiol. 2017 Jul 1;313(1):C80–c93. PubMed PMID: 28424168; eng.
- Turcios L, Chacon E, Garcia C, et al. Autophagic flux modulation by Wnt/beta-catenin pathway inhibition in hepatocellular carcinoma. PloS One. 2019;14(2):e0212538. PubMed PMID: 30794613; PubMed Central PMCID: PMCPMC6386480. eng.
- Roese-Koerner B, Stappert L, Brustle O. Notch/Hes signaling and miR-9 engage in complex feedback interactions controlling neural progenitor cell proliferation and differentiation. Neurogenesis (Austin, Tex). 2017;4(1):e1313647. PubMed PMID: 28573150; PubMed Central PMCID: PMCPMC5443189. eng.
- Wu X, Fleming A, Ricketts T, et al. Autophagy regulates notch degradation and modulates stem cell development and neurogenesis. Nat Commun. 2016 Feb 3;7:10533. PubMed PMID: 26837467; PubMed Central PMCID: PMCPMC4742842. eng.
- Zheng L, Qi T, Yang D, et al. microRNA-9 suppresses the proliferation, invasion and metastasis of gastric cancer cells through targeting cyclin D1 and Ets1. PloS One. 2013;8(1):e55719. PubMed PMID: 23383271; PubMed Central PMCID: PMCPMC3561302. eng.
- Casimiro MC, Di Sante G, Di Rocco A, et al. Cyclin D1 restrains oncogene-induced autophagy by regulating the AMPK-LKB1 signaling axis. Cancer Res. 2017 Jul 1;77(13):3391–3405. PubMed PMID: 28522753; PubMed Central PMCID: PMCPMC5705201. eng.
- Yang L, Chao J, Kook YH, et al. Involvement of miR-9/MCPIP1 axis in PDGF-BB-mediated neurogenesis in neuronal progenitor cells. Cell Death Dis. 2013 Dec 12;4:e960. PubMed PMID: 24336080; PubMed Central PMCID: PMCPMC3877557. eng.
- Ricci-Vitiani L, Pallini R, Biffoni M, et al. Tumour vascularization via endothelial differentiation of glioblastoma stem-like cells. Nature. 2010 Dec 9;468(7325):824–828. PubMed PMID: 21102434; eng.
- Zhang Y, Liu Y, Zou J, et al. Tetrahydrocurcumin induces mesenchymal-epithelial transition and suppresses angiogenesis by targeting HIF-1alpha and autophagy in human osteosarcoma. Oncotarget. 2017 Oct 31;8(53):91134–91149. PubMed PMID: 29207631; PubMed Central PMCID: PMCPMC5710911. eng.
- Wu HB, Yang S, Weng HY, et al. Autophagy-induced KDR/VEGFR-2 activation promotes the formation of vasculogenic mimicry by glioma stem cells. Autophagy. 2017 Sep 2;13(9):1528–1542. PubMed PMID: 28812437; PubMed Central PMCID: PMCPMC5612353. eng.
- Soda Y, Myskiw C, Rommel A, et al. Mechanisms of neovascularization and resistance to anti-angiogenic therapies in glioblastoma multiforme. J Mol Med (Berl). 2013 Apr;91(4):439–448. PubMed PMID: 23512266; PubMed Central PMCID: PMCPMC3665343. eng.
- Thery C, Zitvogel L, Amigorena S. Exosomes: composition, biogenesis and function. Nat Rev Immunol. 2002 Aug;2(8):569–579. PubMed PMID: 12154376; eng. .
- Fader CM, Colombo MI. Multivesicular bodies and autophagy in erythrocyte maturation. Autophagy. 2006 Apr - Jun;2(2):122–125. PubMed PMID: 16874060; eng.
- Fader CM, Sanchez D, Furlan M, et al. Induction of autophagy promotes fusion of multivesicular bodies with autophagic vacuoles in k562 cells. Traffic. 2008 Feb;9(2):230–250. PubMed PMID: 17999726; eng.
- Minakaki G, Menges S, Kittel A, et al. Autophagy inhibition promotes SNCA/alpha-synuclein release and transfer via extracellular vesicles with a hybrid autophagosome-exosome-like phenotype. Autophagy. 2017 Dec 4:1–61. PubMed PMID: 29198173; eng. DOI: 10.1080/15548627.2017.1395992
- Liu JX, Yan ZP, Zhang YY, et al. Hemodynamic shear stress regulates the transcriptional expression of heparan sulfate proteoglycans in human umbilical vein endothelial cell. Cell Mol Biol (Noisy-Le-Grand). 2016;62(8):28–34. PubMed PMID: 27545211.
- Zeng Y, Liu J. Role of glypican-1 in endothelial NOS activation under various steady shear stress magnitudes. Exp Cell Res. 2016 Nov 01;348(2):184–189. PubMed PMID: 27688027.
- Ponce ML. Tube formation: an in vitro matrigel angiogenesis assay. Methods Mol Biol. 2009;467:183–188. PubMed PMID: 19301671.
- Malinda KM. In vivo matrigel migration and angiogenesis assay. Methods Mol Biol. 2009;467:287–294. PubMed PMID: 19301678.
- Zeng Y, Yao X, Chen L, et al. Sphingosine-1-phosphate induced epithelial-mesenchymal transition of hepatocellular carcinoma via an MMP-7/syndecan-1/TGF-beta autocrine loop. Oncotarget. 2016 Sep 27;7(39):63324–63337. PubMed PMID: 27556509.
- Zeng Y, Adamson RH, Curry FR, et al. Sphingosine-1-phosphate protects endothelial glycocalyx by inhibiting syndecan-1 shedding. Am J Physiol Heart Circ Physiol. 2014 Feb;306(3):H363–72. PubMed PMID: 24285115; PubMed Central PMCID: PMCPMC3920139.
- Zeng Y, Ebong EE, Fu BM, et al. The structural stability of the endothelial glycocalyx after enzymatic removal of glycosaminoglycans. PloS One. 2012;7(8):e43168. PubMed PMID: 22905223; PubMed Central PMCID: PMCPMC3419189. eng.