
ABSTRACT
Early diagnosis of colon cancer (CC) is clinically important, as it can significantly improve patients’ survival rate and quality of life. Although the potential role for small extracellular vesicles (sEVs) in early detection of many diseases has been repeatedly mentioned, systematic screening of plasma sEVs derived early CC specific biomarkers has not yet been reported. In this work, plasma sEVs enriched fractions were derived from 15 early-stage (TisN0M0) CC patients and 10 normal controls (NC). RNA sequencing identified a total number of 95 sEVs enriched fraction derived miRNAs with differential expression between CC and NC, most of which (60/95) was in well accordance with tissue results in the Cancer Genome Atlas (TCGA) dataset. Among those miRNAs, we selected let-7b-3p, miR-139-3p, miR-145-3p, and miR-150-3p for further validation in an independent cohort consisting of 134 participants (58 CC and 76 NC). In the validation cohort, the AUC of 4 individual miRNAs ranged from 0.680 to 0.792. A logistic model combining two miRNAs (i.e. let-7b-3p and miR-145-3p) achieved an AUC of 0.901. Adding the 3rd miRNA into this model can further increase the AUC to 0.927. Side by side comparison revealed that sEVs miRNA profile outperformed cell-free plasma miRNA in the diagnosis of early CC. In conclusion, we suggested that circulating sEVs enriched fractions have a distinct miRNA profile in CC patients, and sEVs derived miRNA could be used as a promising biomarker to detect CC at an early stage.
Introduction
Colorectal cancer (CRC) ranks the 3rd most commonly diagnosed cancer worldwide, which resulted in an estimated 881,000 deaths in 2018 [Citation1]. More than 70% of CRC is located on the colon, which is also called colon cancer (CC) [Citation2]. CC has an especially high incidence and mortality in developed areas, such as North America, Europe and Australia [Citation3]. Recently, with the improvement of the economic level, the incidence of CC in East Asia is gradually increasing, and the diagnosis and treatment of CC have become a hot issue of global concern [Citation4]. Owing to the continuous development of endoscopic treatments including endoscopic mucosal resection (EMR) and endoscopic submucosal dissection (ESD), which enable radical resection of CC tumor without open surgery [Citation5–Citation7], the 5-year survival rate of early CC patients has been over 90%. In contrast, for advanced CC patients with distant metastasis, the median survival was less than 2 years [Citation8]. Apparently, identifying CC patient when there is still a chance for endoscopic treatments is significant for improving clinical outcomes. However, so far, there is hardly any method, except for endoscopy, available for early diagnosis of CC [Citation9]. For most CC screening programs, participants are determined simply by their age, sex, BMI and other epidemiological factors [Citation10,Citation11], resulting in low compliance with screening and a significant waste of medical resources. Therefore, the development of alternative approaches allowing detection of CC at an early stage with minimal invasion and easy operation is urgently needed.
MicroRNAs (miRNAs) are endogenous 21-23nt small non-coding RNAs capable of controlling gene expression through post-transcriptional regulation [Citation12]. MiRNAs could degrade complementary target mRNAs in an RNA-induced silencing complex (RISC) dependent manner [Citation13], which is essential in embryo development [Citation14], oncogenesis [Citation15,Citation16], immune regulation [Citation17] and other biological processes [Citation18]. MiRNAs had been identified in many biofluids, such as plasma, serum, and urine [Citation12], suggesting the potential of developing circulating miRNAs as minimally invasive biomarkers of cancer and other diseases [Citation12,Citation19,Citation20]. There are studies proposed that the majority of circulating miRNAs originated from tumor tissues [Citation21,Citation22], while other studies also suggested that circulating miRNAs fluctuated in other diseases [Citation12]. Recently most diagnostic studies focused on the analysis of free-floating circulating miRNAs [Citation19,Citation21,Citation22]. However, the biogenesis of free-floating circulating miRNA is of high heterogeneity, which could derive from cancer cells, fibroblasts, apoptotic cells, and even necrotic cells, by active transport or passive release [Citation23,Citation24]. Additionally, the biological function of free-floating miRNA also remains poorly understood, which largely limits its potential as a biomarker.
Exosomes are 40-100nm membrane vesicles derived from cell endosomes, which participate in cell-cell communication [Citation25]. A significant amount of small extracellular vesicles (sEVs) were considered to be exosomes, complex membrane packets stuffed with a selection of miRNAs, mRNAs, lncRNAs, proteins, and lipids [Citation25,Citation26]. In cancer microenvironment, sEVs are released from donor cells into the niche and affect target cells, which is an active biological process and has an important biological function [Citation25,Citation26]. Additionally, the membrane of sEVs could effectively protect enclosed miRNAs from the RNase presented in biofluids [Citation27,Citation28], thus making sEVs derived miRNA a more reliable determinand than free-floating circulating miRNA.
There is growing evidence suggested the potential role for sEVs in early detection of many diseases [Citation27–Citation30]. However, systematic screening of plasma sEVs derived early CC biomarkers has not yet been reported. In this study, we characterized the total miRNA profile of circulating sEVs enriched fractions in early CC patients paired with non-cancerous individuals with a next-generation sequencing (NGS) method. We identified several sEVs derived miRNAs and combinations which could well distinguish early CC patients from controls, validated those biomarkers in a large independent cohort, and further compared their performance with free-floating miRNAs. The purpose of this study is to identify sEVs derived miRNA biomarkers to discriminate CC in early diagnosis as a minimally invasive method.
Materials and methods
Patients information and sample collection
A total number of 15 early-stage (TisN0M0) CC patients who received endoscopic surgery of CC at Department of Gastroenterology, Beijing Friendship Hospital (Beijing, China) between January 2017 and June 2018 were enrolled in this study along with 10 non-cancerous (NC) outpatients with different gastrointestinal symptoms recruited as controls for biomarker discovery. Additional 134 participants (58 TisN0M0 CC and 76 NC) were enrolled for validation. Written informed consent was obtained from each participant. This study was approved by the ethics committee of Beijing Friendship Hospital. Peripheral blood samples (6mL) from individuals were collected in EDTA tubes following a regular venipuncture procedure in the morning before any food/water intake. After centrifugation at 3,000 × g for 15 min at 4°C, the plasma was aspirated and stored at −80°C before use.
sEV isolation
A total of 3mL plasma was collected from each patient, and each plasma sample was divided into two aliquots (2mL for sEV isolation, 1mL for direct RNA isolation). The ultracentrifugation (UC) method was optimized according to the method previously described [Citation31,Citation32]. After thawing at 37°C, plasma samples were centrifugated at 3,000 × g for 15min to remove cell debris. Then, the supernatant was diluted by seven-fold volume of PBS, centrifuged at 13,000 × g for 30min, and processed through a 0.22μm filter to remove large particles. The supernatant was ultracentrifuged using a P50AT2-986 -rotor (CP100NX; Hitachi, Brea, CA, USA) at 150,000 × g, 4°C for 4h to pellet the sEVs. The pellet was resuspended in phosphate-buffered saline (PBS) and centrifuged again at 150,000 × g 4°C for 2h. After PBS washing, the sEVs enriched fraction pellet was re-suspended in 100µL PBS. Full description of methodologies was also submitted to EV-TRACK [Citation33] (ID: EV190033), summarized in an EV-RNA specific checklist [Citation34] (Supplementary file 1), and checked by a MISEV2018 checklist [Citation34] (Supplementary file 2).
sEV protein quantification
The protein concentration of sEVs enriched fractions was quantified by Pierce BCA Protein Assay Kit (Thermo Scientific, Product No. 23,225) according to the product manual. 10μL of each standard and sEVs enriched fraction sample was pipetted into 96-Well Plates, then added 200μL of the WR to each well and mixed plate thoroughly on a plate shaker for 30 seconds. Then the plate was covered and incubated at 37°C for 30min, cooled to room temperature. The absorbance at 562nm on the plate reader was measured. A standard curve was used to determine the protein concentration of each sEVs enriched fraction sample.
Nanoparticle tracking analysis (NTA)
Vesicle enriched suspension with concentrations between 1x10⁷/mL and 1x10⁹/mL was examined using the ZetaView PMX 110 (Particle Metrix, Meerbusch, Germany) equipped with a 405nm laser to determine the size and quantity of particles isolated. A video of 60-sec duration was taken with a frame rate of 30 frames/sec, and particle movement was analyzed using NTA software (ZetaView 8.02.28).
Transmission electron microscopy (TEM)
A total of 20µL sEVs enriched solution was placed on a copper mesh and incubated at room temperature for 10min. After washing with sterile distilled water, the sEVs enriched fraction was contrasted by uranyl-oxalate solution for 1min. The sample was then dried for 2min under incandescent light. The copper mesh was observed and photographed under a transmission electron microscope (JEOL-JEM1400, Tokyo, Japan).
Western blot analysis
The sEVs enriched supernatant was denatured in 5× sodium dodecyl sulfonate (SDS) buffer and subjected to western blot analysis (10% SDS-polyacrylamide gel electrophoresis; 50µg protein/lane) using rabbit polyclonal antibody CD63 (sc-5275, Santa Cruz, CA, USA), TSG101 (sc-13,611, Santa Cruz, CA, USA), Alix (sc-53,540, Santa Cruz, CA, USA) and calnexin (10,427–2-AP, Promega, Madison, WI). The proteins were visualized on the Tanon4600 Automatic chemiluminescence image analysis system (Tanon, Shanghai, China).
RNase and proteinase treatment of sEVs enriched fractions
Vesicle free RNA was eliminated by a combined treatment of Protease K (The final concentration 100ug/ml) and RNase A (The final concentration 10ug/ml). First, sEVs enriched fractions were treated with Protease K (TIANGEN, cat. No. RT403) for 30min at 37°C, then treated with RNase A (TIANGEN, cat. No. RT405) for 15min at 37°C.
RNA isolation and RNA analyses
Total RNA was extracted and purified from plasma sEVs enriched fractions using miRNeasy® Mini kit (Qiagen, cat. No. 217,004) according to standard protocol. RNA degradation and contamination, especially DNA contamination, was monitored on 1.5% agarose gels. RNA concentration, purity, and integrity were assessed using the RNA Nano 6000 Assay Kit of the Agilent Bioanalyzer 2100 System (Agilent Technologies, CA, USA).
Library preparation and sequencing
For small RNA libraries, a total amount of 2.5ng RNA per sample was used as input material for the RNA sample preparations. Sequencing libraries were generated using NEB Next Multiplex Small RNA Library Prep Set for Illumina (NEB, USA) following the manufacturer’s recommendations and index codes were added to attribute sequences to each sample. Adapter Ligated RNA was mixed with ProtoScript II Reverse Transcriptase, Murine RNase Inhibitor, First Strand Synthesis Reaction Buffer (NEB, cat. No. E7330L) and incubated for 60min at 50°C. Size Selection was performed using 6% PolyAcrylamide Gel. We mixed the purified PCR product (25μL) with 5μL of Gel Loading Dye, loaded 5μL of Quick-Load pBR322 DNA-MspI Digest in on the 6% PAGE 10-well gel, run the gel for 1h at 120V. For miRNA, the bands corresponding to ~150 bp were isolated. At last, the library quality was assessed with both the Agilent Bioanalyzer 2100 and qPCR.
The clustering of the index-coded samples was performed on acBot Cluster Generation System using TruSeq PE Cluster Kitv3-cBot-HS (Illumina) according to the manufacturer’s instructions. After cluster generation, the libraries were sequenced on an Illumina Hiseq X ten platform and 150bp paired-end reads were generated.
Quantification and differential expression analysis of miRNA
With the help of software Bowtie, clean reads were aligned and compared with sequences in databases including Silva, GtRNAdb, Rfam, and Repbase respectively. Reads with more than 10%N, low quality, length >32nt/<16nt, or trimming 3ʹ adapter from the end of reads (no mismatch) were filtered. After filtering unwanted sequences, such as ribosomal RNA (rRNA), transfer RNA (tRNA), small nuclear RNA (snRNA), and small nucleolar RNA (snoRNA), remaining reads were compared with miRNAs from miRbase and Human Genome (GRCh38) to identify known miRNAs as well as the prediction of new miRNAs. Reads counts were generated according to the mapping results of miRDeep2, which was used to calculate TPM. Then we used the TMM method [Citation35] in edgeR to normalize the TPM of miRNA.
Target gene prediction, and GO/KEGG pathway enrichment analysis
For each miRNA with differential expression between CC and NC, its potential target genes predicted by both miRanda and RNAhybrid were included for further analysis. Afterward, we used Blast to align the sequences of target genes with known sequences in Gene ontology (GO) and Kyoto Encyclopedia of Genes and Genomes (KEGG) database and confirmed the potential biological functions of target genes. GOseq R package based on Wallenius non-central hypergeometric distribution was used for GO enrichment analysis. KEGG pathway enrichment was analyzed using a python program KOBAS [Citation36].
Quantification of miRNA expression with qPCR
The same amount of Caenorhabditis elegans cel-39-3p miRNA was spiked into each sEVs sample as an external calibration for RNA extraction, reverse transcription, and miRNA amplification. Total RNA was extracted and purified from plasma sEVs using miRNeasy® Mini kit (Qiagen, cat. 217,004). TaqMan™ advanced miRNA assays were performed for miRNA quantification using Life Taq Man Advanced miRNA cDNA Synthesis Kit (Life Tech, Carlsbad, CA, cat.A28007) and Life Taq Man Fast Advanced Master Mix (Life Tech, Carlsbad, CA, cat.4444557). miRNA quantification was obtained with qPCR using specific miRNA TaqMan gene expression probes (Life Tech, Carlsbad, CA) and an ABI7500 qPCR system (Applied Biosystems) with a miRNA-specific probe mix and cDNA template according to the manufacturer’s protocols. The following probes were used: 478,221 for hsa-let-7b-3p, 478,721 for hsa-miR-150-3p, 477,915 for hsa-miR-145-3p, 477,906 for hsa-miR-139-3p, 477,975 for hsa-miR-21-5p, 479,448 for hsa-miR-30a-5p (Life Technologies). All samples were normalized by the initial biofluid input volume used for RNA extraction, and calibrated by the spike-in cel-39-3p to eliminate the minute bias caused by different RNA isolation efficiencies and PCR efficiencies among samples.
Statistical analysis
Statistical tests were performed using R 3.5.1 (www.r-project.org). All tests were two-tailed and False Discovery Rate (FDR) was controlled for multiple comparisons. P < 0.05 was considered significant. Diagnostic accuracy of candidate miRNAs or their combinations was assessed by receiver operating characteristic (ROC) curves analysis, and the area under the ROC curve (AUC) was also calculated. Packages plyr and reshape2 were used for data sorting and restructuring. VennDiagram, pheatmap, and ggplot2 were used for visualization of results.
Results
Characterization of CC patients’ plasma derived sEVs enriched fractions
In this study, we recruited 73 TisN0M0 CC patients and 86 non-cancerous controls (NC). The participants’ demographic and clinical information of age, gender, tumor location and etc. was summarized in . The sEVs enriched fractions were extracted from the plasma of all CC patients and controls by ultracentrifugation, and the morphology and sizes distribution of sEVs were evaluated by TEM and NTA. TEM and NTA analysis showed that sEVs in the isolated fractions were oval or bowl-shaped with a size range between 75nm to 200nm (,b)). Enrichment of the sEV markers CD63, TSG101 and Alix were all detected in the sEVs enriched fractions isolated from the plasma ()). On the contrary, Calnexin, a negative marker of sEVs was absent in our isolated sEVs enriched fraction samples ()). Besides, the protein levels of the sEVs enriched fraction samples were also evaluated, and an sEV-associated protein concentration of 163.66 ± 133.21μg per mL plasma was reported.
Table 1. Clinical characteristics of CC patients and noncancerous controls.
Figure 1. Isolated sEVs enriched fractions from participants’ plasma. A. TEM images showed that sEVs were oval or bowl-shaped capsules without the nucleus (left panel: a wide field encompassing multiple vesicles; right panel: a close-up image of single vesicles). B. NTA results suggested that sEVs enriched from plasma were about 75-200nm in diameter. C. sEV markers CD63, TSG101 and Alix were all detected in the sEVs enriched fractions isolated from the plasma, and Calnexin, a negative marker of sEV was absent in our isolated sEVs enriched fraction samples. D. A box plot comparing the RNA concentration (ng per mL plasma) of sEVs enriched fractions isolated from CC and NC groups. E. A box plot comparing the RNA concentration (ng per mL plasma) of total plasma from CC and NC groups. F. A box plot comparing the sEVs enriched fractions-RNA percentage between CC and NC groups.
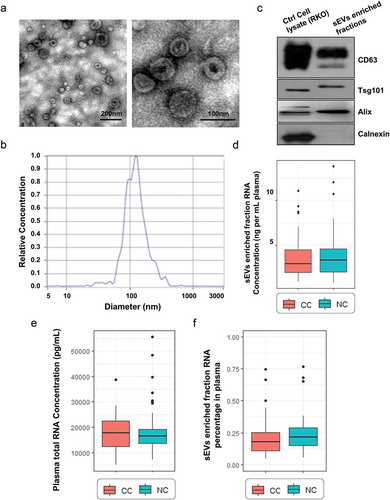
Total RNA isolated from sEVs enriched fractions was analyzed and quantitated. No significant difference was identified in the RNA concentration of sEVs enriched fractions (ng/mL plasma) between CC patients and controls ()). Additionally, the total RNA directly isolated from per mL plasma also showed no significant difference between CC patients and controls ()). sEVs enriched fractions-RNA percentage was calculated through dividing the normalized RNA concentrations of total plasma (total RNA per mL plasma) by RNA concentrations of sEVs enriched fractions (sEVs enriched fractions-RNA per mL plasma). As a result, the sEVs enriched fractions-RNA percentage varies widely between 5% and 75% and showed no significant difference between CC patients and controls ()).
Comparison of sEVs enriched fractions derived miRNAs signatures between CC patients and non-cancerous controls in the testing set
To get a global profile of the sEVs enriched fraction derived miRNA from the plasma of CC patients, we first tested 25 samples (15 CC patients, 10 controls) in the testing set by miRNA sequencing. For each sample, no less than 20.44M clean reads were generated. A total of 1,883 known miRNAs were detected by sequencing. To avoid bias caused by miRNAs with relatively low expression levels, 1,618 miRNAs with median TPM >10 were included for the subsequent analysis. In differentially expressing miRNA (DEMs) analysis (|log2(FC)|>0.584, p < 0.05), 38 miRNAs were found up-regulated, and 57 down-regulated in CC patients than controls. Compared with differentially expressed miRNAs in TCGA dataset, there were 60 DEMs (63.2%) shared between those two analyses, among which 22 were up-regulated and 38 were down-regulated (,b)), indicating the DEMs in plasma sEVs enriched fractions could reflect the miRNA profile in the primary tumor site.
Figure 2. sEVs enriched fractions derived miRNAs profiles of CC and NC groups. A. A Venn diagram showed DEMs shared between TCGA dataset and our plasma sEVs enriched fractions miRNA dataset. B. A heatmap of the 60 DEMs’ expression level across all 25 samples in our plasma sEVs enriched fractions miRNA dataset. C. The specificity and sensitivity of each DEMs in identifying CC patients in our plasma sEVs enriched fractions miRNA dataset. D. The specificity and sensitivity of each DEMs in identifying CC patients in TCGA miRNA dataset.
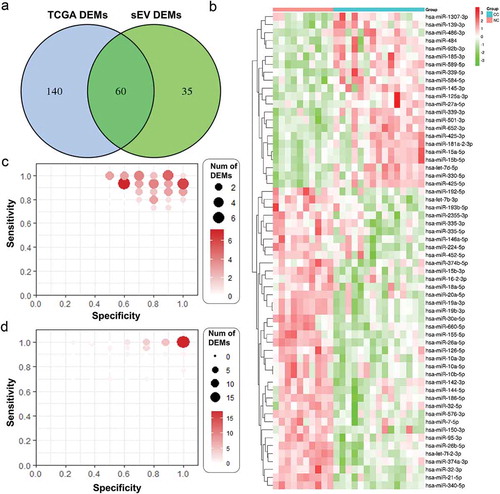
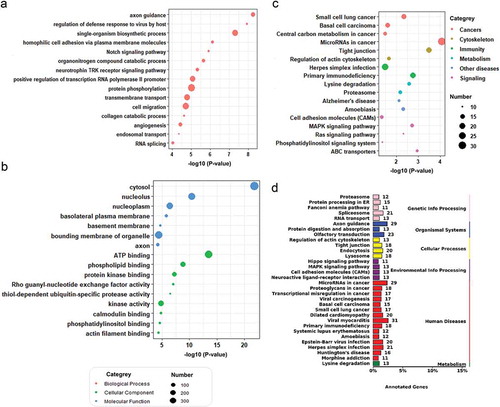
For the screening of potential biomarkers in early CC diagnosis, we calculated the specificity and sensitivity of each DEMs in the testing set ()). Most candidate miRNAs displayed a specificity of 0.6–1.0 and a sensitivity of 0.8–1.0 (), which were further validated in TCGA dataset (). Additionally, in an attempt to reveal the potential function of the plasma sEVs enriched fractions derived miRNA up/down-regulated in CC patients, we analyzed the potential impact of those DEMs on protein-coding mRNAs. Bioinformatics miRNA target database analysis revealed that 3,752 mRNAs were targeted by those DEMs, which were mainly enriched in cytoskeleton and cell migration, ATP binding, single-organism biosynthesis, and cancer-associated pathways ().
Table 2. Top 24 miRNAs ranked by Sensitivity × Specificity (miRNA-seq data).
Figure 3. Target analysis of differentially expressed miRNAs in the plasma sEVs enriched fractions of CC and NC groups. GO/KEGG enrichment of mRNAs targeted by the 60 DEMs identified in our plasma sEVs enriched fractions miRNA analysis was performed. A. A bubble plot of GOs (Biological Process) enriched. B. A bubble plot of GOs (Cellular Component, Molecular Function) enriched. C. A bubble plot of KEGG pathways enriched. D. A barplot showed the numbers of DEMs targeted genes in each KEGG pathways (targeted genes >10).
EV-associated characteristic verification of candidate miRNAs
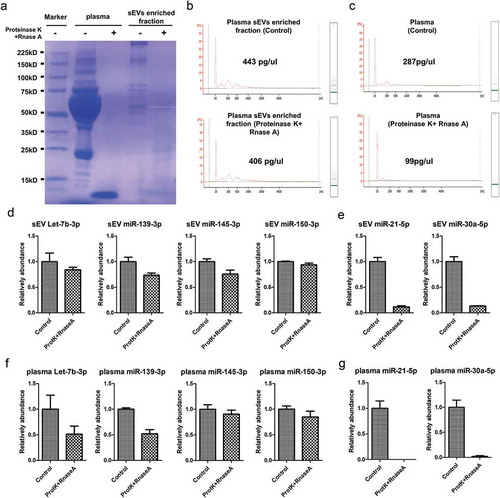
Among all DEMs, we selected the miRNA for validation based on previous literature and the verification of their EV-associated characteristics. Let-7b-3p, miR-150-3p, miR-145-3p, miR-139-3p were previously reported existing in cancer patients’ plasma and functioning in colorectal cancer (), which were also verified as EV-associated (). In order to confirm the origin of these miRNAs, we performed degradation assay using Proteinase K and RNase prior to RNA extraction. Coomassie blue staining verified that the proteins in both plasma and sEVs enriched fractions were largely degraded by Proteinase K ()). Agilent 2100 Bioanalyzer results suggested that sEVs enriched fraction derived RNA was slightly decreased (about 10%, )), while RNA directly extracted from plasma was mostly decreased (about 66%, )) by the pretreatment of Proteinase K and RNase A. We also verified that in sEVs enriched fraction let-7b-3p, miR-150-3p, miR-145-3p, and miR-139-3p could not be degraded by the pretreatment of Proteinase K and RNase A ()). As a positive control, miR-21-5p and miR-30a-5p, two well known RNP associated miRNAs [Citation37], were greatly degraded by the same treatment ()). Those results suggested that let-7b-3p, miR-150-3p, miR-145-3p, and miR-139-3p were all well protected by sEV membrane in sEVs enriched fractions. In total plasma, let-7b-3p, miR-150-3p, miR-145-3p, and miR-139-3p could be partially degraded by the combined treatment of Proteinase K and RNase A ()), but miR-21-5p and miR-30a-5p were nearly completely degraded ()). Those data, accompanied by the previous results, suggested that a significant amount of let-7b-3p, miR-150-3p, miR-145-3p, and miR-139-3p in plasma existed in a sEV-associated manner.
Table 3. Information of the selected miRNAs for RT-qPCR verification.
Figure 4. EV-associated characteristic evaluation of candidate miRNAs. A. Coomassie blue staining showed the total protein level in both plasma and sEVs enriched fractions when treated by Proteinase K and RNase A. B. Representative Agilent 2100 Bioanalyzer results of sEVs enriched fractions derived RNA with (lower panel) and without (upper panel) the pretreatment of Proteinase K and RNase A before RNA extraction procedure. C. Representative Agilent 2100 Bioanalyzer results of total plasma derived RNA with (lower panel) and without (upper panel) the pretreatment of Proteinase K and RNase A before RNA extraction procedure. D. Let-7b-3p, miR-150-3p, miR-145-3p, miR-139-3p levels detected from sEVs enriched fraction samples with and without the pretreatment of Proteinase K and RNase A. E. miR-21-5p and miR-30a-5p levels detected from sEVs enriched fraction samples with and without the pretreatment of Proteinase K and RNase A. F. Let-7b-3p, miR-150-3p, miR-145-3p, miR-139-3p levels detected from plasma samples with and without the pretreatment of Proteinase K and RNase A. G. miR-21-5p and miR-30a-5p levels detected from plasma samples with and without the pretreatment of Proteinase K and RNase A.
sEVs derived miRNAs as biomarkers of early CC in a validation set
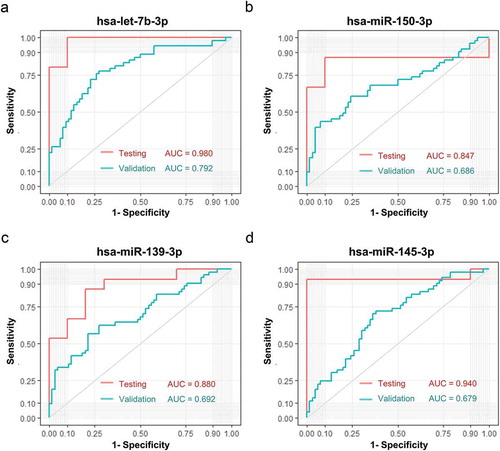
To validate the specificity of these four plasma sEVs derived miRNAs for CC patients found in the testing set, expression of these four miRNAs was measured by RT-qPCR in the validation set of 134 subjects. To verify the potential of miRNA expression, ROC analysis was performed and AUC was calculated. let-7b-3p exhibited an AUC of 0.792, close to the AUC (0.980) calculated from the testing set ()). MiR-150-3p, miR-145-3p, and miR-139-3p achieved an AUC of 0.686, 0.692, and 0.679, respectively, which were lower than the AUC calculated from the testing set (-d)). In summary, all these four miRNAs provided promising AUC values for discriminating between CC patients from controls.
Figure 5. Verification of sEVs derived miRNAs as biomarkers of early CC. Verification of sEVs derived hsa-let-7b-3p (A), hsa-miR-150-3p (B), hsa-miR139-3p (C), hsa-miR145-3p (D) as biomarkers of early CC. The ROC curves of the testing dataset (miRNA sequencing of 25 samples) were shown in red, while the ROC curves of validation dataset (miRNA RT-qPCR of 134 samples) were shown in turquoise.
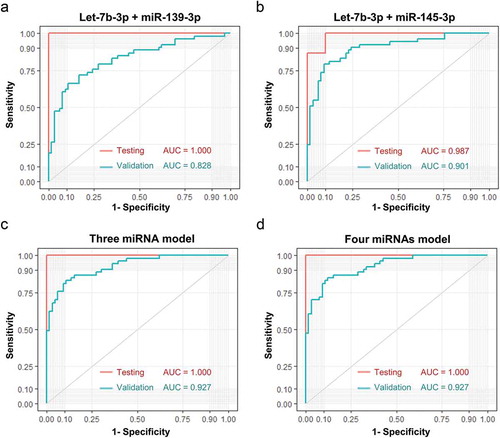
Additionally, using a logistic model, we combined two of those candidate miRNAs together and obtained improved performance compared with individual miRNA. Notably, let-7b-3p plus miR-139-3p exhibited an AUC of 0.828 ()), and let-7b-3p plus miR-145-3p exhibited an AUC of 0.901 ()). Integrating a third candidate could achieve a slightly higher AUC of 0.927 (let-7b-3p, miR-139-3p, and miR-145-3p, )). The addition of miR-150-3p as a fourth candidate failed to achieve further improvement as compared to the three-miRNA model ()).
Figure 6. Performance of sEV miRNA panels as biomarkers of early CC. Verification of panel 1 (A, let-7b-3p + miR-139-3p), panel 2 (B, let-7b-3p + miR-145-3p), panel 3 (C, let-7b-3p + miR-139-3p + miR-145-3p), panel 4 (D, let-7b-3p + miR-139-3p + miR-145-3p + miR-150-3p) as biomarkers of early CC. The ROC curves of testing dataset (miRNA sequencing of 25 samples) were shown in red, while the ROC curves of validation dataset (miRNA RT-qPCR of 134 samples) were shown in turquoise.
Diagnostic efficacy comparison between sEVs derived miRNAs and plasma total miRNAs
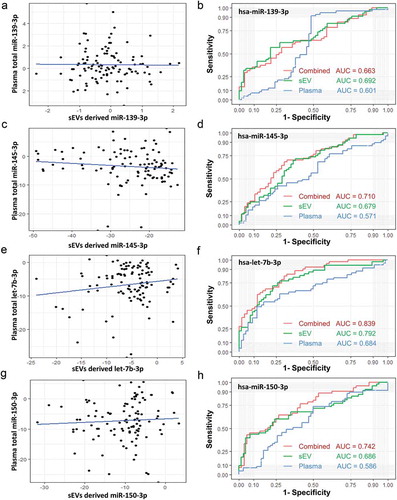
sEVs derived miRNAs are part of plasma total miRNAs. To understand if analyzing total plasma miRNAs can give the same effect as sEVs, we evaluate the diagnostic efficacy of the above selected four miRNAs directly isolated from plasma and compared it with the same miRNAs isolated from plasma sEVs. Our results suggested that the total plasma level of miR-139-3p was not associated with the plasma sEVs derived miR-139-3p ()), and miR-139-3p directly isolated from plasma provided lower AUC values for discriminating between CC patients from controls than the miR-139-3p isolated from plasma sEVs enriched fractions (0.601 vs. 0.692, )). For let-7b-3p, miR-150-3p, and miR-145-3p, their total plasma abundance was also not associated with their abundance in plasma sEVs (,e,g)). In ROC analysis, all these miRNAs directly isolated from plasma provided lower AUC values than the plasma sEVs derived opponents (,f,h)). Additionally, when combined the total plasma abundance with the plasma sEVs abundance using a logistic model, a slightly higher AUC was achieved (,f,h)).
Figure 7. Comparison between sEVs derived miRNAs and plasma total miRNAs. A. Total plasma level of miR-139-3p was not associated with the plasma sEVs derived miR-139-3p (Pearson χ2 = −0.111, p = 0.912). B. The ROC curves of sEVs derived miR-139-3p (green), plasma total miR-139-3p (blue) and a logistic model combined them together (red). C. Total plasma level of miR-145-3p was not associated with the plasma sEVs derived miR-145-3p (Pearson χ2 = −1.138, p = 0.258). D. The ROC curves of sEVs derived miR-139-3p (green), plasma total miR-145-3p (blue) and a logistic model combined them together (red). E. Total plasma level of let-7b-3p was not associated with the plasma sEVs derived let-7b-3p (Pearson χ2 = 1.544, p = 0.126). F. The ROC curves of sEVs derived let-7b-3p (green), plasma total let-7b-3p (blue) and a logistic model combined them together (red). E. Total plasma level of miR-150-3p was not associated with the plasma sEVs derived miR-150-3p (Pearson χ2 = 0.577, p = 0.565). F. The ROC curves of sEVs derived miR-150-3p (green), plasma total miR-150-3p (blue) and a logistic model combined them together (red).
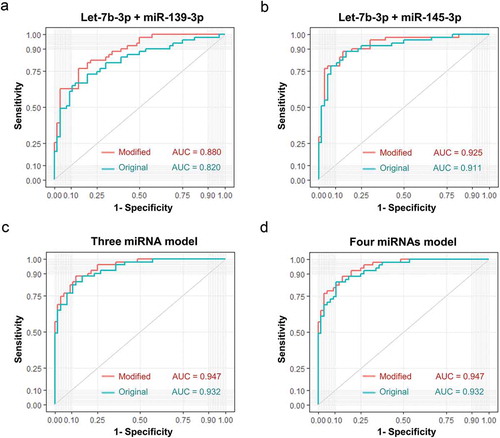
For multiple miRNA panels, sEVs isolated miRNA based models showed a very obvious advantage over total plasma miRNA based models in identifying early-stage CC patients (). Additionally, integrating the total plasma miRNA based models with their sEVs rivals could also improve the ability of discernment in different degrees ().
Figure 8. Diagnostic efficacy comparison between sEVs derived miRNAs panels and plasma total miRNAs panels. Evaluation of panel 1 (A, let-7b-3p + miR-139-3p), panel 2 (B, let-7b-3p + miR-145-3p), panel 3 (C, let-7b-3p + miR-139-3p + miR-145-3p), panel 4 (D, let-7b-3p + miR-139-3p + miR-145-3p + miR-150-3p) as biomarkers of early CC. The ROC curves of sEVs derived miRNAs data were shown in red, while the ROC curves of plasma total miRNAs data were shown in turquoise.
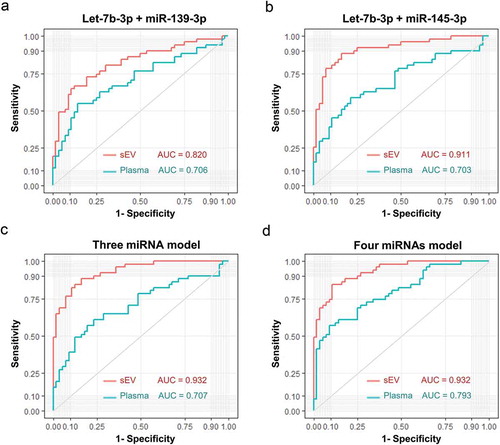
Figure 9. Diagnostic efficacy comparison between sEVs derived miRNAs panels with and without integrating their total plasma miRNA rivals. Evaluation of panel 1 (A, let-7b-3p + miR-139-3p), panel 2 (B, let-7b-3p + miR-145-3p), panel 3 (C, let-7b-3p + miR-139-3p + miR-145-3p), panel 4 (D, let-7b-3p + miR-139-3p + miR-145-3p + miR-150-3p) as biomarkers of early CC. The ROC curves of original sEVs derived miRNAs model were shown in turquoise, while the ROC curves of a modified model integrated original sEVs derived miRNAs with their total plasma rivals were shown in red.
Discussion
Here we isolated sEVs enriched fraction from plasma using a standard ultracentrifugation procedure for exosome isolation. Theoretically, once the EVs were secreted into the extracellular environment, we could not determine its specific origin. Thus we used the nomenclature “Generic term extracellular vesicle (EV) + specification (size)”, according to the MISEV2018 guideline [Citation38] instead of the commonly used term “exosome” in most related biomarker studies. We strongly support the opinion of ISEV that “these definitions (sEV, lEV) are perhaps less biologically meaningful but far more experimentally tractable than the previous exosome/microvesicle definitions” [Citation34].
Recently, sEV has attracted much attention as a new minimally invasive diagnostic tool to identify asymptomatic cancer patients [Citation25,Citation26]. The cargos of sEVs isolated from blood include many different types of cell-free nucleic acids and proteins, among which miRNA has been the research focus in biomarker related translational studies because of its abundance and stability. In this study, a comprehensive analysis of sEVs enriched fraction derived miRNA landscape of early-stage CC patients and non-cancerous controls was performed. Here we identified 38 miRNAs overexpressed and 57 miRNAs down-expressed in CC patients. We selected miRNAs (22 up-regulated, 38 were down-regulated) that were also differentially expressed in the TCGA database as biomarker candidates. The reason why we compare our data side by side with differentially expressed miRNAs identified from TCGA is based on the assumption that miRNAs differentially expressed in colon tumor is more likely to be a valid EV-associated biomarker of CC. We also tried to narrow the range of candidate miRNAs into miRNAs biologically associated with colon cancer to maximize the success rate of EV biomarker verification.
The specificity and sensitivity of each DEMs in the miRNA sequencing data of 25 participants were very close to each other, and most candidate miRNAs displayed a specificity of 0.70–1.00 and a sensitivity of 0.73–1.0. Considering having a small sample size is associated with less precision in ROC estimations, we could not conclude that some miRNAs are definitely better than others only based on the small size miRNA-seq data. Thus, we selected the miRNAs for validation only based on previous literature and the verification of their EV-associated characteristics. All candidates should fulfill three criteria as follows, to maximize the success rate of EV biomarker verification: 1. previously reported existing in cancer patients’ plasma; 2. previously reported function in colorectal cancer; 3. verified of EV-associated but not RNP-associated. Finally, let-7b-3p, miR-139-3p, miR-145-3p, and miR-150-3p were used for verification in a large cohort.
Let-7b is one of the most famous miRNA tumor suppressor, which could inhibit cancer cell proliferation by down-regulating MYC [Citation39], HMGA2 [Citation40] and IMP1 [Citation41]. A series of studies have reported that let-7b could be a potential biomarker in ovarian cancer [Citation42], non-small cell lung cancer (NSCLC) [Citation43], gastric cancer [Citation44] and colorectal cancer [Citation45]. MiR-139 is a negative regulator of cancer motility, which has a wide target profile including ROCK2 [Citation46], IGF-1R [Citation47] and MMP11 [Citation48]. MiR-139 was considered a potential biomarker of bladder cancer [Citation48], hepatocellular carcinoma [Citation46], laryngeal squamous carcinoma [Citation49] and colorectal cancer [Citation47,Citation50]. MiR-145 is often known as a tumor suppressor gene in various tumors, which was found down-regulated in osteosarcoma [Citation51], ovarian cancer [Citation52], gastric cancer [Citation53], colorectal cancer [Citation54] and hepatocellular carcinoma [Citation55]. Recently, a series of studies [Citation56–Citation58] consistently revealed the biomarker potential of plasma miR-145 for the screening of early-stage NSCLC. MiR-150 could target on Myb [Citation59], EGR2 [Citation60] and NOTCH3 [Citation61], which was also reported as a cancer biomarker in various types of cancer [Citation59–Citation62], especially in colorectal cancer [Citation62]. Even though some of those miRNAs were considered as diagnostic or prognostic biomarkers in CRC, this study was still the first one to explore their EV-associated characteristics and their potential in the diagnosis of TisN0M0 CC patients.
The robustness of our miRNA-seq data was confirmed by RT-qPCR analysis of four distinct miRNA candidates in another larger cohort of 134 participants. Here we identify plasma sEVs derived let-7b-3p, miR-150-3p, miR-139-3p and miR-145-3p exhibited an AUC of 0.792, 0.686, 0.692, 0.679, respectively, to distinguish early CC from NC. Many other studies proposed circulating miRNA could serve as a colorectal biomarker and most of them reported an AUC around 0.75 [Citation63–Citation65]. Considering nearly all those studies included CC patients of different stage, the performance of sEVs in identifying early-stage CC patients is promising. Numerous studies have shown that the combination of multiple miRNAs could obtain higher discrimination of early-stage CC patients than a single miRNA biomarker [Citation19,Citation64]. Here we found that combining only two miRNAs (let-7b-3p and miR-145-3p) could obtain an AUC of 0.901, while a three-biomarker panel (let-7b-3p, miR-139-3p, and miR-145-3p) exhibited an AUC of 0.927. Thus, our results showed the great potential of sEVs derived miRNA as a new type of tumor marker.
Although there are many studies on the contents of plasma sEVs cargo [Citation66–Citation68], no studies have been reported to compare the RNA in plasma sEVs enriched fraction with the total RNA in plasma. The association in RNA types and abundance between them was still unrevealed. In this study, we found that the ratio of the RNA derived from sEVs enriched fraction to the total plasma RNA varied dramatically from 5% to 75% in different individuals. However, the mechanism underlying this phenomenon still needs further investigation. We also found that for let-7b-3p, miR-139-3p, miR-150-3p and miR-145-3p, there was no statistically significant correlation between their abundance in sEVs and their total abundance in plasma. In summary, our results supported the opinion that sEVs derived miRNAs had a different biological origin from other free-floating circulating miRNAs in blood. It is known that sEVs derived miRNAs are loaded into exosomes selectively by a specific process [Citation69–Citation71], thus, the sEVs derived miRNA profile is pre-specified and is not random, which refers to the fact that exosomes induce changes which are preprogrammed in the host cells. In brief, plasma sEVs derived miRNA and plasma total miRNA are two completely different kinds of tumor biomarkers.
We also compared the identification ability of CC between plasma sEVs derived miRNA and plasma total miRNA. Our results showed that the AUC of plasma sEVs derived miRNA was about 0.1 higher than the total miRNA of plasma for let-7b-3p, miR-139-3p, miR-150-3p and miR-145-3p. Considering that these four miRNAs were all screened from sEVs based miRNA sequencing, we could not exclude the possibility that other miRNAs had higher tumor recognition ability as a total plasma miRNA biomarker than as sEVs derived biomarker. Additionally, we found that, in most cases, combining total plasma miRNA and sEVs derived miRNA together achieved a slightly higher AUC in identifying early CC than sEVs derived miRNA alone. Although the extent of improving discrimination is minimal, integration of these two types of biomarkers also provides a new insight for further development and improvement of detection tools of early-stage CC patients.
Compared with other biomarker studies [Citation19,Citation63–Citation65], we adopted a much more stringent criterion for the selection of participants. In the CC group, we only included patients in a very early stage (TisN0M0), which were very difficult to diagnose by other approaches. Identification of these patients with a noninvasive tool could not only improve the overall prognosis and five-year survival rate of CC but also improve their quality of life and decrease their medical expenditure to a great extent by providing opportunities for a non-surgical endoscopic cure. In the NC group, we did not recruit healthy individuals as most studies. Instead, we recruited the outpatients of the Department of Gastroenterology with various gastrointestinal symptoms as non-cancerous control. Therefore the possible miRNA disturbance caused by other symptoms was taken into account in advance in the screening process of biomarkers, and the false positive rate could be controlled at a lower level in the subsequent validation of early CC screening.
In conclusion, our study suggested that CC patients retained specific plasma sEVs enriched fraction derived miRNA profile at a very early stage compared with non-cancerous controls. In this study, the unique properties of four plasma sEVs derived miRNAs (let-7b-3p, miR-139-3p, miR-150-3p, miR-145-3p) and their combinations were revealed, which proposed a new promising biomarker category of early CC patients.
Supplemental Material
Download Zip (98.1 KB)Disclosure statement
No potential conflict of interest was reported by the authors.
Supplementary Materials
Supplemental Materials data for this article can be accessed here.
Additional information
Funding
Related Research Data
References
- Bray F, Ferlay J, Soerjomataram I, et al. Global cancer statistics 2018: GLOBOCAN estimates of incidence and mortality worldwide for 36 cancers in 185 countries. CA Cancer J Clin. 2018;68:394–424.
- Bailey CE, Hu C-Y, You YN, et al. Increasing disparities in the age-related incidences of colon and rectal cancers in the USA, 1975-2010. JAMA Surg. 2015;150:17–17.
- Siegel RL, Miller KD, Jemal A. Cancer Statistics, 2017. CA Cancer J Clin. 2017;67:7–30.
- Chen W, Zheng R, Baade PD, et al. Cancer statistics in China, 2015. CA Cancer J Clin. 2016;66:115–132.
- Chiba H, Takahashi A, Inamori M, et al. Early colon cancer presenting as intussusception and successfully treated using endoscopic submucosal dissection. Endoscopy. 2014;46(Suppl 1 UCTN):E326–327.
- Kiriyama S, Saito Y, Yamamoto S, et al. Comparison of endoscopic submucosal dissection with laparoscopic-assisted colorectal surgery for early-stage colorectal cancer: a retrospective analysis. Endoscopy. 2012;44:1024–1030.
- Kudo S. Endoscopic mucosal resection of flat and depressed types of early colorectal cancer. Endoscopy. 1993;25:455–461.
- Fakih MG. Metastatic colorectal cancer: current state and future directions. J Clin Oncol. 2015;33:1809–1824.
- Labianca R, Nordlinger B, Beretta GD, et al. Early colon cancer: ESMO Clinical Practice Guidelines for diagnosis, treatment and follow-up. Ann Oncol. 2013;24(Suppl 6):vi64–72.
- Force USPST, Bibbins-Domingo K, Grossman DC, et al. Screening for Colorectal Cancer: US Preventive services task force recommendation statement. JAMA. 2016;315:2564–2575.
- Sung JJ, Ng SC, Chan FKL, et al. An updated Asia Pacific Consensus Recommendations on colorectal cancer screening. Gut. 2015;64:121–132.
- Etheridge A, Lee I, Hood L, et al. Extracellular microRNA: A new source of biomarkers. Mutat Res. 2011;717:85–90.
- Pratt AJ, MacRae IJ. The RNA-induced silencing complex: a versatile gene-silencing machine. J Biol Chem. 2009;284:17897–17901.
- Gross N, Kropp J, Khatib H. MicroRNA Signaling in Embryo Development. Biology (Basel). 2017;6:34.
- Yan R, Li K, Yuan D-W, et al. Downregulation of microRNA-4295 enhances cisplatin-induced gastric cancer cell apoptosis through the EGFR/PI3K/Akt signaling pathway by targeting LRIG1. Int J Oncol. 2018;53:2566–2578.
- Sun W, Fiorito S, Alessandri C, et al. MicroRNA-181a promotes angiogenesis in colorectal cancer by targeting SRCIN1 to promote the SRC/VEGF signaling pathway. Cell Death Dis. 2018;9:438.
- Ji X, Wang E, Tian F. MicroRNA-140 suppresses osteosarcoma tumor growth by enhancing anti-tumor immune response and blocking mTOR signaling. Biochem Biophys Res Commun. 2018;495:1342–1348.
- Piwecka M, Glažar P, Hernandez-Miranda LR, et al. Loss of a mammalian circular RNA locus causes miRNA deregulation and affects brain function. Science. 2017;357.
- Vychytilova-Faltejskova P, Radova L, Sachlova M, et al. Serum-based microRNA signatures in early diagnosis and prognosis prediction of colon cancer. Carcinogenesis. 2016;37:941–950.
- Schultz NA, Dehlendorff C, Jensen BV, et al. MicroRNA biomarkers in whole blood for detection of pancreatic cancer. JAMA. 2014;311:392–404.
- Greystoke A, Ayub M, Rothwell DG, et al. al., Development of a circulating miRNA assay to monitor tumor burden: from mouse to man. Mol Oncol. 2016;10:282–291.
- Ferracin M, Pedriali M, Veronese A, et al. MicroRNA profiling for the identification of cancers with unknown primary tissue-of-origin. J Pathol. 2011;225:43–53.
- Kohlhapp FJ, Mitra AK, Lengyel E, et al. MicroRNAs as mediators and communicators between cancer cells and the tumor microenvironment. Oncogene. 2015;34:5857–5868.
- Challagundla KB, Fanini F, Vannini I, et al. microRNAs in the tumor microenvironment: solving the riddle for a better diagnostics. Expert Rev Mol Diagn. 2014;14:565–574.
- An T, Qin S, Xu Y, et al. Exosomes serve as tumour markers for personalized diagnostics owing to their important role in cancer metastasis. J Extracell Vesicles. 2015;4:27522.
- Thind A, Wilson C. Exosomal miRNAs as cancer biomarkers and therapeutic targets. J Extracell Vesicles. 2016;5:31292.
- Thery C. Cancer: diagnosis by extracellular vesicles. Nature. 2015;523:161–162.
- Vlaeminck-Guillem V. Extracellular vesicles in prostate cancer carcinogenesis, diagnosis, and management. Front Oncol. 2018;8:222.
- Ko J, Bhagwat N, Black T, et al. miRNA Profiling of Magnetic Nanopore-Isolated Extracellular Vesicles for the Diagnosis of Pancreatic Cancer. Cancer Res. 2018;78:3688–3697.
- Sequeiros T, Rigau M, Chiva C, et al. Targeted proteomics in urinary extracellular vesicles identifies biomarkers for diagnosis and prognosis of prostate cancer. Oncotarget. 2017;8:4960–4976.
- Buschmann D, Kirchner B, Hermann S, et al. Evaluation of serum extracellular vesicle isolation methods for profiling miRNAs by next-generation sequencing. J Extracell Vesicles. 2018;7:1481321.
- Thery C, Amigorena S, Raposo G, et al. Isolation and characterization of exosomes from cell culture supernatants and biological fluids. Curr Protoc Cell Biol. Chapter. 2006;3(Unit): 3–22.
- Consortium E-T, Van Deun J, Mestdagh P, et al. EV-TRACK: transparent reporting and centralizing knowledge in extracellular vesicle research. Nat Methods. 2017;14:228–232.
- Mateescu B, Kowal EJK, van Balkom BWM, et al. Obstacles and opportunities in the functional analysis of extracellular vesicle RNA - an ISEV position paper. J Extracell Vesicles. 2017;6:1286095.
- Robinson MD, Oshlack A, Halsall JA, et al. A scaling normalization method for differential expression analysis of RNA-seq data. Genome Biol. 2010;11:R25.
- Mao X, Cai T, Olyarchuk JG, et al. Automated genome annotation and pathway identification using the KEGG Orthology (KO) as a controlled vocabulary. Bioinformatics. 2005;21:3787–3793.
- Dueck A, Ziegler C, Eichner A, et al. microRNAs associated with the different human Argonaute proteins. Nucleic Acids Res. 2012;40:9850–9862.
- Thery C, Witwer KW, Aikawa E, et al. Minimal information for studies of extracellular vesicles 2018 (MISEV2018): a position statement of the International Society for Extracellular Vesicles and update of the MISEV2014 guidelines. J Extracell Vesicles. 2018;7:1535750.
- Kim HH, Kuwano Y, Srikantan S, et al. HuR recruits let-7/RISC to repress c-Myc expression. Genes Dev. 2009;23:1743–1748.
- Lee YS, Dutta A. The tumor suppressor microRNA let-7 represses the HMGA2 oncogene. Genes Dev. 2007;21:1025–1030.
- Boyerinas B, Park S-M, Murmann AE, et al. Let-7 modulates acquired resistance of ovarian cancer to Taxanes via IMP-1-mediated stabilization of multidrug resistance 1. Int J Cancer. 2012;130:1787–1797.
- Gao Y, Meng H, Liu S, et al. LncRNA-HOST2 regulates cell biological behaviors in epithelial ovarian cancer through a mechanism involving microRNA let-7b. Hum Mol Genet. 2015;24:841–852.
- Jusufovic E, Rijavec M, Keser D, et al. let-7b and miR-126 are down-regulated in tumor tissue and correlate with microvessel density and survival outcomes in non–small–cell lung cancer. PLoS One. 2012;7:e45577.
- Yang X, Cai H, Liang Y, et al. Inhibition of c-Myc by let-7b mimic reverses mutidrug resistance in gastric cancer cells. Oncol Rep. 2015;33:1723–1730.
- Tanaka S, Hosokawa M, Matsumura J, et al. Effects of Zebularine on Invasion Activity and Intracellular Expression Level of let-7b in Colorectal Cancer Cells. Biol Pharm Bull. 2017;40:1320–1325.
- Wong CC, Wong C-M, Tung EK-K, et al. The microRNA miR-139 suppresses metastasis and progression of hepatocellular carcinoma by down-regulating Rho-kinase 2. Gastroenterology. 2011;140:322–331.
- Shen K, Liang Q, Xu K, et al. MiR-139 inhibits invasion and metastasis of colorectal cancer by targeting the type I insulin-like growth factor receptor. Biochem Pharmacol. 2012;84:320–330.
- Yonemori M, Seki N, Yoshino H, et al. Dual tumor-suppressors miR-139-5p and miR-139-3p targeting matrix metalloprotease 11 in bladder cancer. Cancer Sci. 2016;107:1233–1242.
- Luo HN, Wang Z.H., Sheng Y, et al. MiR-139 targets CXCR4 and inhibits the proliferation and metastasis of laryngeal squamous carcinoma cells. Med Oncol. 2014;31:789.
- Shen K, Mao R, Ma L, et al. Post-transcriptional regulation of the tumor suppressor miR-139-5p and a network of miR-139-5p-mediated mRNA interactions in colorectal cancer. Febs J. 2014;281:3609–3624.
- Zhang Z, Zhang M, Chen Q, et al. Downregulation of microRNA-145 promotes epithelial-mesenchymal transition via regulating Snail in osteosarcoma. Cancer Gene Ther. 2017;24:83–88.
- Wu H, Xiao Z, Wang K, et al. MiR-145 is downregulated in human ovarian cancer and modulates cell growth and invasion by targeting p70S6K1 and MUC1. Biochem Biophys Res Commun. 2013;441:693–700.
- Chen JJ, Cai W-Y, Liu X-W, et al. Reverse correlation between MicroRNA-145 and FSCN1 affecting gastric cancer migration and invasion. PLoS One. 2015;10:e0126890.
- Qin J, Wang F, Jiang H, et al. MicroRNA-145 suppresses cell migration and invasion by targeting paxillin in human colorectal cancer cells. Int J Clin Exp Pathol. 2015;8:1328–1340.
- Gao F, Sun X, Wang L, et al. Downregulation of MicroRNA-145 caused by Hepatitis B Virus X protein promotes expression of CUL5 and contributes to Pathogenesis of Hepatitis B virus-associated hepatocellular carcinoma. Cell Physiol Biochem. 2015;37:1547–1559.
- Campayo M, Navarro A, Viñolas N, et al. Low miR-145 and high miR-367 are associated with unfavourable prognosis in resected nonsmall cell lung cancer. Eur Respir J. 2013;41:1172–1178.
- Wang RJ, Zheng YH, Wang P, et al. Serum miR-125a-5p, miR-145 and miR-146a as diagnostic biomarkers in non-small cell lung cancer. Int J Clin Exp Pathol. 2015;8:765–771.
- Tang D, Shen Y, Wang M, et al. Identification of plasma microRNAs as novel noninvasive biomarkers for early detection of lung cancer. Eur J Cancer Prev. 2013;22:540–548.
- Xiao C, Calado DP, Galler G, et al. MiR-150 controls B cell differentiation by targeting the transcription factor c-Myb. Cell. 2007;131:146–159.
- Wu Q, Jin H, Yang Z, et al. MiR-150 promotes gastric cancer proliferation by negatively regulating the pro-apoptotic gene EGR2. Biochem Biophys Res Commun. 2010;392:340–345.
- Kim TH, Jeong J-Y, Park J-Y, et al. miR-150 enhances apoptotic and anti-tumor effects of paclitaxel in paclitaxel-resistant ovarian cancer cells by targeting Notch3. Oncotarget. 2017;8:72788–72800.
- Ma Y, Zhang P, Wang F, et al. miR-150 as a potential biomarker associated with prognosis and therapeutic outcome in colorectal cancer. Gut. 2012;61:1447–1453.
- Huang Z, Huang D, Ni S, et al. Plasma microRNAs are promising novel biomarkers for early detection of colorectal cancer. Int J Cancer. 2010;127:118–126.
- Ng EK, Chong WWS, Jin H, et al. Differential expression of microRNAs in plasma of patients with colorectal cancer: a potential marker for colorectal cancer screening. Gut. 2009;58:1375–1381.
- Cheng H, Zhang L, Cogdell DE, et al. Circulating plasma MiR-141 is a novel biomarker for metastatic colon cancer and predicts poor prognosis. PLoS One. 2011;6:e17745.
- Castillo J, Bernard V, San Lucas FA, et al. Surfaceome profiling enables isolation of cancer-specific exosomal cargo in liquid biopsies from pancreatic cancer patients. Ann Oncol. 2018;29:223–229.
- Keerthikumar S, Chisanga D, Ariyaratne D, et al. ExoCarta: A Web-Based Compendium of Exosomal Cargo. J Mol Biol. 2016;428:688–692.
- Santonocito M, Tobler KJ, Omurtag KR, et al. Molecular characterization of exosomes and their microRNA cargo in human follicular fluid: bioinformatic analysis reveals that exosomal microRNAs control pathways involved in follicular maturation. Fertil Steril. 2014;102(1751–1761):e1751.
- Li SP, Lin ZX, Jiang XY, et al. Exosomal cargo-loading and synthetic exosome-mimics as potential therapeutic tools. Acta Pharmacol Sin. 2018;39:542–551.
- Villarroya-Beltri C, Baixauli F, Gutierrez-Vazquez C, et al. Sorting it out: regulation of exosome loading. Semin Cancer Biol. 2014;28:3–13.
- Janas T, Janas MM, Sapon K, et al. Mechanisms of RNA loading into exosomes. FEBS Lett. 2015;589:1391–1398.