ABSTRACT
Extracellular vesicles (EVs) in plasma are commonly identified by staining with antibodies and generic dyes, but the specificity of antibodies and dyes to stain EVs is often unknown. Previously, we showed that platelet-depleted platelet concentrate contains two populations of particles >200 nm, one population with a refractive index (RI) < 1.42 that included the majority of EVs, and a second population with an RI > 1.42, which was thought to include lipoproteins. In this study, we investigated whether EVs can be distinguished from lipoproteins by the RI and whether the RI can be used to determine the specificity of antibodies and generic dyes used to stain plasma EVs. EVs and lipoproteins present in platelet-depleted platelet concentrate were separated by density gradient centrifugation. The density fractions were analyzed by Western blot and transmission electron microscopy, the RI of particles was determined by Flow-SR. The RI was used to evaluate the staining specificity of an antibody against platelet glycoprotein IIIa (CD61) and the commonly used generic dyes calcein AM, calcein violet, di-8-ANEPPS, and lactadherin in plasma. After density gradient centrifugation, EV-enriched fractions (1.12 to 1.07 g/mL) contained the highest concentration of particles with an RI < 1.42, and the lipoprotein-enriched fractions (1.04 to 1.03 g/mL) contained the highest concentration of particles with an RI > 1.42. Application of the RI showed that CD61-APC had the highest staining specificity for EVs, followed by lactadherin and calcein violet. Di-8-ANEPPS stained mainly lipoproteins and calcein AM stained neither lipoproteins nor EVs. Taken together, the RI can be used to distinguish EVs and lipoproteins, and thus allows evaluation of the specificity of antibodies and generic dyes to stain EVs.
Introduction
Extracellular vesicles (EVs) are membrane-enclosed particles released by cells, which are present in plasma and other body fluids. EVs are potential biomarkers because their concentration, cellular origin, composition and function are disease dependent [Citation1–Citation4].
EVs are commonly studied using flow cytometry, because of its high throughput and the capacity to differentiate between EV populations [Citation5]. In flow cytometry, fluorescence, forward (FSC) and side scattered light (SSC) of single particles above the scatter and/or fluorescence detection threshold are measured. Because a flow cytometer detects all EVs and non-EV particles above this detection threshold, additional identification of EVs is needed to characterize EVs in body fluids.
EVs in plasma and other body fluids are commonly identified using “fluorescent markers”, here defined as fluorochrome-conjugated antibodies and/or generic EV dyes. However, whether these fluorescent markers exclusively stain EVs is difficult to assess, because appropriate reference techniques and/or samples are lacking. Because plasma contains lipoproteins with a concentration that far exceeds the EV concentration, staining specificity is especially relevant for the identification of EVs in plasma samples [Citation6]. Lipoproteins are particles (5–1,200 nm) with a lipid core and a phospholipid monolayer surface that transport lipids throughout the body [Citation7,Citation8]. Fluorescent markers used to stain EVs may also stain lipoproteins due to non-specific binding and cross-reactivity, leading to misidentification of EVs.
Current ways to evaluate the EV staining specificity of a fluorescent marker include isotype controls, biological comparison controls [Citation9] or detergent controls [Citation10]. In isotype controls, the antibody is replaced with an antibody that lacks specificity to the target but which matches the class and type of the antibody used in the application. In biological comparison controls, the sample of interest is replaced with a sample resembling the sample of interest, for example the unstimulated sample in stimulation assays. Neither of these two controls evaluates the interaction between the fluorescent marker and the sample of interest, which may lead to an incorrect specificity. Furthermore, an appropriate biological comparison control for plasma, with similar particle composition but without EVs, is not yet available. Although detergent treatment aims to create such a control by selectively solubilizing EVs in a sample, unfortunately not all EVs will be lysed [Citation10] and also lipoproteins may be affected [Citation11], thus creating a control sample with unknown particle composition.
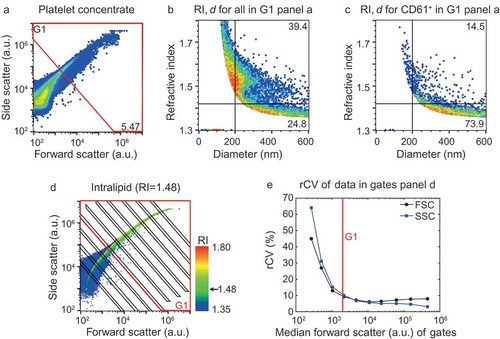
Ideally, the specificity of a fluorescent marker is evaluated using the fluorescent marker itself in the sample of interest, instead of using either a different fluorescent marker (isotype control) or sample (biological comparison and detergent controls). Previously, we showed that the refractive index (RI) and diameter of single particles can be derived from the ratio of SSC over FSC measured by the flow cytometer (Flow-SR) [Citation12]. Application of Flow-SR to platelet-depleted platelet concentrate () revealed a population with an RI < 1.42 and a population with an RI > 1.42 (). Based on the reported RI of EVs in literature [Citation13,Citation14], the population with the RI < 1.42 was expected to contain the majority of EVs. Staining with platelet-EV associated CD61 thereby showed that the RI < 1.42 population contains 74–97% of all CD61+ particles ( [Citation12],). Based on literature values for the RI of lipids and proteins, we hypothesized that the RI > 1.42 population contains lipoproteins [Citation15]. If this hypothesis is true, then the RI offers a tool to evaluate the staining specificity of EVs by fluorescent markers directly in the sample of interest.
Figure 1. Application of the flow cytometry scatter ratio (Flow-SR) to platelet-depleted platelet concentrate. (a) Side (SSC) versus forward scatter (FSC) plot of platelet-depleted platelet concentrate as measured by the A60-micro. (b) Refractive index (RI) versus diameter (d) plot of the events in G1 of panel a. The horizontal line indicates an RI of 1.42, the vertical line a d of 200 nm. (c) Refractive index versus diameter (d) plot of all CD61+ particles in G1 of panel A. Of all CD61+ particles >200 nm, 73.9% has an RI<1.42. (d) SSC versus FSC of intralipid (Fresenius-Kabi, Germany) which contains polydisperse particles with an RI of 1.48. The colour bar indicates the RI of the particle as derived using Flow-SR. Deviations from 1.48 are most likely due to a decrease in the signal-to-noise ratio on SSC and FSC. To quantify the relative noise, the robust coefficient of variation (rCV) on FSC and SSC was determined within the gates (black lines). (e) rCV versus median FSC intensity in the gate for FSC (black circles) and SSC (blue squares). An rCV of 10% on FSC and SSC was considered acceptable, which was found at a median FSC intensity in the gate of 2000 a.u. (red line). The resulting gate G1 (red lines) is shown in a and d and used throughout the manuscript.
Here, we investigated whether we can use the RI to discriminate EVs from lipoproteins, by (1) separating EVs and lipoproteins from platelet-depleted platelet concentrate using density gradient centrifugation, and (2) evaluating the RI of the particles in each density fraction. Next, we examined whether the RI offers a tool to evaluate the EV staining specificity of five commonly used fluorescent markers, namely calcein acetoxymethyl ester (calcein AM), calcein acetoxymethyl ester violet (calcein violet), 4-(2-[6-(dioctylamino)-2-naphthalenyl]ethenyl)-1-(3-sulfopropyl)pyridinium (di-8-ANEPPS), lactadherin-fluorescein isothiocyanate (lactadherin) and an antibody against platelet glycoprotein IIIa-allophycocyanin (CD61-APC).
Materials and methods
Platelet-depleted platelet concentrate
Because density gradient centrifugation has a low recovery of EVs [Citation16], we used platelet concentrate as it contains a higher concentration of platelet EVs than plasma, and a lipoprotein concentration comparable to plasma. Platelet-depleted platelet concentrate was prepared as described previously [Citation17]. Briefly, a platelet concentrate comprised of buffy coats from five donors combined with one plasma unit of one of the donors was obtained from Sanquin (Amsterdam, the Netherlands). Outdated platelet concentrate (30 mL) was diluted 1:1 in phosphate-buffered saline (PBS; 154 mM NaCl, 1.24 mM Na2HPO4.2H2O, 0.2 mM NaH2PO4.2H2O, pH 7.4; 0.22 mm filtered (Merck, Darmstadt, Germany)), after which 12 mL acid citrate dextrose (0.85 M trisodiumcitrate, 0.11 M D-glucose and 0.071 M citric acid) was added. Platelets were removed by centrifugation at 800 g, 20°C for 20 min and subsequently 1,560 g, 20°C for 20 min. The resulting platelet-depleted supernatant was snap-frozen in liquid nitrogen, stored at −80°C, and thawed at 37°C before use.
Density gradient centrifugation
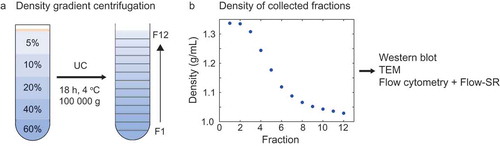
Optiprep (60% (w/v) iodixanol in water, Sigma-Aldrich, St. Louis, MO) was diluted in PBS to obtain 5%, 10%, 20% and 40% Optiprep solutions. Of each solution, 1.6 mL was pipetted in an SW40 tube (Beckman Coulter, Brea, CA), as depicted in . Platelet-depleted platelet concentrate was prediluted two-fold in PBS, of which 200 µL was loaded on top of the density gradient, followed by ultracentrifugation at 100,000 g, 4°C for 18 h (SW41Ti rotor, Optima XPN-100 ultracentrifuge, Beckman Coulter). After ultracentrifugation, 12 fractions of 680 µl were collected from the top of the tube. The density of each fraction was determined from the absorbance at 340 nm using the Spectramax i3 spectrophotometer (Molecular Devices, San Jose, CA) [Citation18]. The 12 collected fractions were analyzed by Western blot, transmission electron microscopy (TEM), and flow cytometry with Flow-SR analysis.
Figure 2. Density gradient centrifugation to separate EVs and lipoproteins in platelet-depleted platelet concentrate. (a) Schematic representation of the Optiprep density gradient and fraction collection. The platelet-depleted platelet concentrate is loaded on top of the density gradient. (b) Density of the collected fractions as derived from 340 nm absorbance. UC: ultracentrifugation, TEM: transmission electron microscopy.
Western blot
Protein from 1 mL of each fraction was precipitated using trichloroacetic acid (20% final concentration; Sigma-Aldrich), and protein concentrations were determined using a Coomassie blue protein assay (Thermo Scientific, Rockford, IL). Precipitated protein of each fraction was dissolved in non-reducing Laemmli sample buffer (Biorad, Hercules, CA). Samples were boiled and 15 µL per fraction was loaded on 4–15% Criterion TGX gels (Biorad), and proteins were transferred to a polyvinylidene difluoride (PVDF) membrane (Millipore, Billerica, MA). Blots were incubated with anti-CD63 (1 µg/mL, clone H5C6, Becton Dickinson, Franklin Lakes, NJ) or anti-Apo-B100 (500-fold diluted, clone 2-B4, MP Biomedicals, Santa Ana, CA), washed and incubated with a secondary goat-anti-mouse-antibody coupled to horseradish peroxidase (Dako, Glostrup, Denmark). Protein bands were visualised by incubating the PVDF membranes with a fivefold diluted peroxidase substrate (LumiLight, Roche Diagnostics, Almere, The Netherlands) for 5 min, followed by analysis of luminescence using a LAS4000 luminescence image analyser (Fuji, Valhalla, NY).
Transmission electron microscopy (TEM)
Two TEM grids were prepared per fraction. A 400 mesh copper grid with carbon-coated formvar (Electron Microscopy Sciences, Hatfield, PA) was placed onto 10 µL of each fraction for 2 min at room temperature. Excess liquid was removed by blotting. Next, the grid was dipped in 10 µL of filtered 2% uranyl acetate (w/v; 0.22 µm filter, both Merck), followed by blotting. Dipping in uranyl acetate and blotting was repeated and the grids were air dried. Per grid, we acquired five images at predefined locations using a TEM instrument (Tecnai-12, Fei, Eindhoven, the Netherlands) at 120 kV, as described previously [Citation19]. Predefined locations were used to prevent operator image selection bias.
Flow cytometry
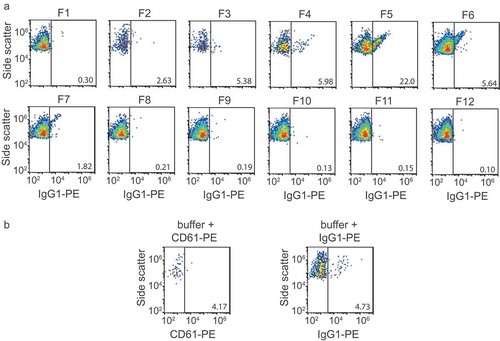
Prediluted antibodies were centrifuged at 19,000 g for 5 min before use, to remove antibody aggregates. Fractions were prediluted in PBS supplemented with 0.32% trisodium citrate according to the previously published protocol [Citation20] to prevent swarm detection. To identify platelet EVs, 2.5 µL of CD61-PE (clone VI-PL2) or IgG1-PE isotype control (both 3.13 µg/mL, Becton Dickinson) was added to 20 µL of diluted fraction and incubated for 2 h at room temperature in the dark. After incubation with antibodies, 200 µL of PBS supplemented with 0.32% trisodium citrate was added to the samples to stop the labelling reaction. Samples were analyzed on an A60-Micro (Apogee, Hertfordshire, UK), of which the sensitivity has been described previously [Citation20]. All samples were measured for 2 min at a flow rate of 3.0 µL/min using SSC triggering (405-nm laser, 100 mW). The detection threshold was set at 14 a.u., which coincides with a scattering cross section of 5.3 nm2 according to [Citation21]. Isotype controls (Appendix, ) were used to set a fluorescent gate for CD61-PE, resulting in a gate with a lower boundary at 67 MESF of PE. Positive (+) events are defined as a fluorescent signal inside the gate. Concentrations were determined by correcting the number of detected particles for flow rate, measurement time and sample dilution.
Flow-SR
Flow-SR was performed as described previously [Citation12], using home-built software (Matlab R2017b, Mathworks, Natick, MA). Briefly, the flow cytometry scatter ratio (Flow-SR) is the ratio of SSC over FSC. Using beads of known size and RI (Exometry, Amsterdam, the Netherlands) together with Mie light scattering theory [Citation22], a mathematical model of the optical configuration of the flow cytometer was constructed. Using this model, a Flow-SR versus diameter lookup table was calculated. Since Flow-SR is independent of the RI for particle diameters ≤1.2 times the illumination wavelength [Citation12], the particle diameter can be derived from the measured Flow-SR. Subsequently, the RI was derived from a lookup table of SSC versus diameter. Lookup tables were calculated for diameters ranging from 10 to 1000 nm, with step sizes of 1 nm, and refractive indices from 1.35 to 1.80 with step sizes of 0.001. The diameter and RI of every particle were added to the .fcs file by the software. The resulting .fcs files were analyzed with FlowJo V10 (FlowJo, Ashland, OR) and Matlab.
In Flow-SR, diameter and RI are derived from the ratio of SSC to FSC. Thus, the reliability of diameter and RI is adversely affected by poor signal-to-noise ratios on SSC and/or FSC. An approximation of the signal-to-noise ratio was obtained by evaluation of the robust coefficient of variation (rCV) on SSC and FSC in a polydisperse sample with a single RI (). We set gate G1 () to keep the rCV on SSC and FSC <10% (). In the remainder of the manuscript, Flow-SR is applied only to particles inside gate G1, thereby excluding events with poor signal-to-noise ratios on SSC and/or FSC. The resulting RI versus diameter plot of G1 () still shows particles with higher RI than expected in biological samples (RI > 1.60), which result from events having a relatively high rCV on SSC and/or FSC. To avoid this artefact, we apply Flow-SR only to particles >200 nm, conform the previously published protocol [Citation12].
Evaluation of fluorescent marker specificity
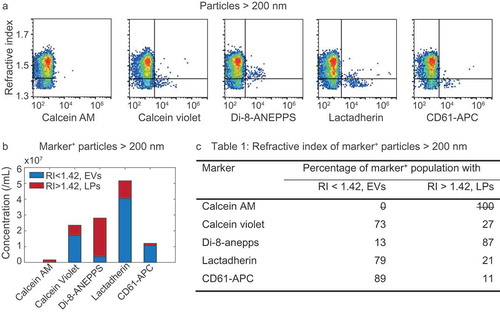
To investigate whether the RI offers a tool to evaluate the EV staining specificity of fluorescent markers, flow cytometry data of an earlier study involving generic dyes [Citation20] were analyzed using Flow-SR. The RI of particles positive for calcein AM, calcein violet, di-8-ANEPPS, lactadherin or CD61-APC was evaluated in human plasma. As previous, positive (+) was defined as a fluorescent signal inside the gate, which were based on analysis of unstained samples for the generic dyes and an isotype control for CD61-APC. For more information regarding sample preparation, staining conditions, etc. see [Citation20].
Results
Validation of RI-based discrimination between EVs and lipoproteins
To validate that the RI can be used to discriminate EVs from lipoproteins, we separated EVs and lipoproteins from platelet-depleted platelet concentrate using density gradient centrifugation, and characterized the fractions by Western blot, TEM and flow cytometry. Subsequently, we applied Flow-SR to the flow cytometry scatter signals of each fraction to derive the RI of the particles present within that fraction.
Characterization of the obtained fractions showed that the density ranged from 1.34 g/mL (fraction 1) to 1.03 g/mL (fraction 12) (). Western blot for the EV-associated tetraspanin CD63 and lipoprotein-associated apolipoprotein B100 (ApoB100) indicated the presence of EVs in fractions 6–8 () and lipoproteins in fraction 11 and 12 (). Although at predefined locations the TEM images of fractions 6–8 contained neither EVs nor lipoproteins, further inspection confirmed the presence of EVs, of which a representative image is shown in ). TEM images confirmed the presence of lipoproteins in fractions 11 and 12, of which a representative image is shown in . Flow cytometry analysis of the fractions showed the highest concentration of CD61+ particles in fractions 6, 7 and 8 (). Thus, characterization of the fractions showed that fractions 6–8, with densities of 1.12 to 1.07 g/mL, are EV-enriched whereas fractions 11 and 12, with densities of 1.04 and 1.03 g/mL, are lipoprotein-enriched.
Figure 3. Analysis of EV- and lipoprotein-enriched fractions by Western blot and transmission electron microscopy (TEM). (a) Western blot for the EV-associated CD63. EVs are present in fractions (F) 6, 7 and 8. (b) Western blot for the lipoprotein-associated ApoB100. Lipoproteins are present in fractions 11 and 12. (c) TEM image of EV-enriched fraction 7. Possibly the white spherical particles are a few lipoproteins. (d) TEM image of lipoprotein-enriched fraction 11. The majority of the particles are lipoproteins (LP), but a few may be EVs. All scale bars represent 200 nm.
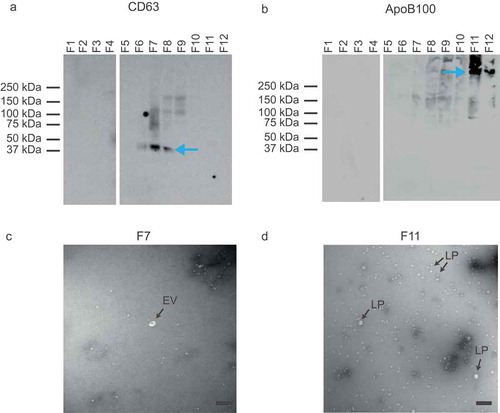
Figure 4. Flow cytometry and Flow-SR results for all fractions. (a) Side scatter versus CD61-PE fluorescence of particles >200 nm for all fractions. (b) Refractive index (RI) versus diameter of particles >200 nm for all fractions. The horizontal line indicates an RI of 1.42. (c) Concentration of CD61+ particles (closed black triangles), CD61+ particles with an RI < 1.42 (open black triangles), particles with an RI < 1.42 (blue circles) and RI > 1.42 (red squares) for each fraction. Fractions 6, 7 and 8 show the highest concentration of RI < 1.42 and RI < 1.42, CD61+ particles. The concentration of RI > 1.42 particles, here found to be lipoproteins, increases with fraction number. The highest concentrations of lipoproteins were found at fraction 11 and 12. Representative data of one out of three independently performed experiments are shown.
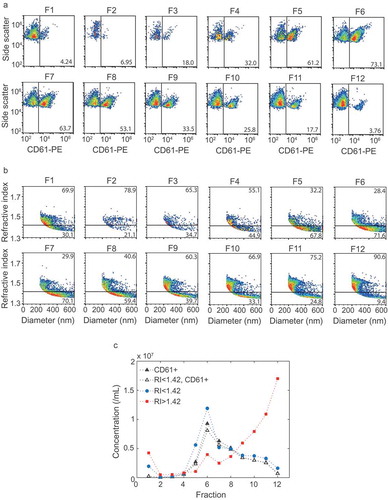
The RI versus diameter plots of all fractions () show that the EV-enriched fractions 6–8, together with fraction 5, contained the highest concentration of particles with an RI < 1.42 (). Furthermore, 92% of the CD61+ particles had an RI < 1.42 (). The lipoprotein-enriched fractions 11 and 12 contained the highest concentration of particles with an RI > 1.42 (). Taken together, EVs end up in the RI < 1.42 population and lipoproteins in the RI > 1.42 population. Hence, the RI can be used to distinguish EVs from lipoproteins in a platelet concentrate or plasma sample.
Application of RI to evaluate fluorescent marker specificity
In a previous study we evaluated commonly used fluorescent markers for their ability to stain EVs in human plasma [Citation20]. Based on our present results, the specificity of these fluorescent markers to stain plasma EVs can be directly evaluated by determining the RI of the stained “EVs”. We therefore applied Flow-SR to the flow cytometry data of [Citation20] to derive the diameter and RI for the particles stained by the fluorescent marker (i.e. marker+ particles) in human plasma.
shows the RI versus marker fluorescence for all particles >200 nm. It is evident that lipoproteins (upper right quadrants in ) are stained by di-8-ANNEPS, lactadherin and to a lesser degree by calcein violet. From the concentration of marker+ particles with RI<1.42 (i.e. EVs, bottom right quadrant) and that of particles with a RI>1.42 (i.e. lipoproteins, upper right quadrant) can be derived, which are shown in and are used to determine the percentages shown in . The quantitative data in ,) shows that CD61 stains EVs with the highest specificity, followed by lactadherin and calcein violet. Di-8-ANEPPS has the lowest specificity, and calcein AM stained neither EVs nor lipoproteins.
Figure 5. Refractive index (RI) of particles >200 nm stained with calcein AM, calcein violet, di-8-ANEPPS, lactadherin, and CD61-APC in platelet-free plasma. (a) RI versus marker fluorescence for particles >200 nm. The horizontal line indicates an RI of 1.42 and separates lipoproteins (LPs; top right quadrant) from EVs (bottom right quadrant). (b) Concentrations of stained (i.e. marker+) EVs (blue) and LPs (red) for the indicated fluorescent marker. (c) Percentage of marker+ particles with an RI typical for EVs and LPs for the indicated fluorescent marker. Representative data of 1 out of 2 measurements shown.
Discussion
The specificity of fluorescent markers to identify EVs in plasma is unknown. Ideally, the specificity of fluorescent markers is evaluated directly using the fluorescent marker itself in the sample of interest, instead of using either a different fluorescent marker (isotype controls) or sample (biological comparison and detergent controls). By using Flow-SR, we previously showed that platelet-depleted platelet concentrate contains two populations of particles, one population with an RI < 1.42, which we found to be EVs, and a population with an RI > 1.42, which we hypothesized to be lipoproteins. Here, we confirmed that the population of particles with an RI > 1.42, present in platelet-depleted platelet concentrate and plasma, are indeed lipoproteins. Subsequently, we showed that the RI provides direct insight into the specificity of fluorescent markers to stain EVs.
Density gradient centrifugation did not result in a perfect separation of EVs and lipoproteins. The lipoprotein-enriched fractions contain some CD61+ particles (), indicating the presence of low concentrations of EVs in these fractions. The EV-enriched fractions possibly also contain low concentrations of lipoproteins, but we lack a reliable method to asses this. The fact that the separation of EVs and lipoproteins was not 100% may explain the particles with an RI > 1.42 in the EV-enriched fractions, and RI < 1.42 in the lipoprotein-enriched fractions. Furthermore, fraction 5 showed CD61+ particles and a high concentration of particles with an RI < 1.42 on flow cytometry (), but an absence of EV-associated CD63 on Western blot (). The apparent discrepancy can be explained by the fact that the detection limit of Western blot differs from that of flow cytometry.
In Flow-SR, the RI is derived from the flow cytometry scatter signals using a two-step procedure. First, the diameter is derived from the ratio of SSC and FSC, secondly, the diameter is used to derive the RI. This two-step procedure enhances uncertainties in the determined RI. However, the median RI for CD61+ EVs >200 nm in this study was 1.39, which is in good agreement with the reported mean RI of platelets of 1.40 [Citation23]. The median RI for the RI > 1.42 lipoprotein population >200 nm in this study was 1.47, which is in good agreement with the reported RI of triglycerides (1.44–1.49 at 434 nm [Citation24]), the main constituent of the largest lipoproteins [Citation25]. Furthermore, for the RI > 1.42 lipoprotein population >300 nm, we found an RI of 1.51, which was also found by others in a recent study [Citation26]. Altogether, we can conclude that our RI values for EVs and lipoproteins are in agreement with literature, suggesting that the inaccuracies in the determined RI are not substantial. Here, we used a threshold at RI = 1.42 to discriminate the two populations with different RI present in plasma and platelet concentrate (). This threshold is based on the facts that (i) lipoproteins consist of lipids and proteins which both have an RI > 1.44 [Citation24,Citation26,Citation27] and (ii) EVs are reported to have an RI < 1.40 [Citation13,Citation14]. Because EVs may differ in composition, for example due to the presence of RNA, some EVs may have an RI > 1.42. For lipoproteins, however, an RI < 1.42 is very unlikely given the reported RI values for both lipids and proteins. We thus chose to set the threshold at RI = 1.42 to minimize lipoprotein contamination in the EV population.
Although we used the RI in the present study to evaluate the specificity of five commonly used fluorescent markers in plasma, it is clear that the RI can be used to evaluate the specificity of any fluorescent marker in any biofluid that contains particles which differ in RI from EVs. Furthermore, with the ability to identify lipoproteins, a whole new application area opens up in medicine. Flow-SR can, for instance, be used as a diagnostic tool to check lipoprotein metabolism (e.g. monitor lipoprotein concentrations after a meal), or to study their involvement in pathogenesis of, for example, atherosclerosis [Citation26]. Flow-SR, thereby, is applicable to all flow cytometers, but the particle size range to which it can be applied will differ per instrument as a result of the detection limit and the wavelength used [Citation12]. In general, increased scatter sensitivity will allow application of Flow-SR to smaller particles.
In addition to the many potential applications of Flow-SR in nanotechnology [Citation12], we have shown here that the RI allows direct and straightforward evaluation of the staining specificity by using the fluorescent marker in the sample of interest. This application potentially reduces the use of time-consuming and non-representative isotype, biological comparison or detergent controls, and reduces the risk of misidentification of EVs. Furthermore, since the RI can be used to distinguish EVs from lipoproteins in a sample, combining the RI with fluorescent marker positivity allows for more specific EV identification. The use of RI as an additional parameter in flow cytometry thus directly increases the reliability and decreases the workload when using EVs as biomarkers.
Disclosure of interest
F.A.W. Coumans and E. van der Pol are shareholders of Exometry (Amsterdam, the Netherlands). The other authors report no conflicts of interest.
Correction Statement
This article has been republished with minor changes. These changes do not impact the academic content of the article.
Additional information
Funding
Related Research Data
References
- O’Driscoll L. Expanding on exosomes and ectosomes in cancer. N Engl J Med. 2015;372:2359–10.
- Loyer X, Vion A-C, Tedgui A, et al. Microvesicles as cell–cell messengers in cardiovascular diseases. Circ Res. 2014;114:345–353.
- Yuana Y, Sturk A, Nieuwland R. Extracellular vesicles in physiological and pathological conditions. Blood Rev. 2013;27:31–39.
- Robbins PD, Morelli AE. Regulation of immune responses by extracellular vesicles. Nat Rev Immunol. 2014;14:195–208.
- Coumans FAW, Brisson AR, Buzas EI, et al. Methodological guidelines to study extracellular vesicles. Circ Res. 2017;120:1632–1648.
- Simonsen JB. What are we looking at? Extracellular vesicles, lipoproteins, or both? Circ Res. 2017;121:920–922.
- Jonas A, Phillips MC. Lipoprotein structure. In: Vance DE, Vance JE, editors. Biochemistry of lipids, lipoproteins and membranes. 5th ed. San Diego: Elsevier; 2008. p. 485–506.
- Gotto AM, Pownall HJ, Havel RJ. Introduction to the plasma lipoproteins. Methods Enzymol. 1986;128:3–41.
- Maecker HT, Trotter J. Flow cytometry controls, instrument setup, and the determination of positivity. Cytometry A. 2006;69A:1037–1042.
- Osteikoetxea X, Sódar B, Németh A, et al. Differential detergent sensitivity of extracellular vesicle subpopulations. Org Biomol Chem. 2015;13:9775–9782.
- Pownall HJ. Remodeling of human plasma lipoproteins by detergent perturbation. Biochemistry. 2005;44:9714–9722.
- van der Pol E, de Rond L, Coumans FAW, et al. Absolute sizing and label-free identification of extracellular vesicles by flow cytometry. Nanomedicine. 2018;14:801–810.
- Gardiner C, Shaw M, Hole P, et al. Measurement of refractive index by nanoparticle tracking analysis reveals heterogeneity in extracellular vesicles. J Extracell Vesicles. 2014;3:25361.
- van der Pol E, Coumans FAW, Sturk A, et al. Refractive index determination of nanoparticles in suspension using nanoparticle tracking analysis. Nano Lett. 2014;14:6195–6201.
- Mills G, Lane P, Weech P. A guidebook to lipoprotein techniques. Amsterdam, The Netherlands: Elsevier; 2000.
- Théry C, Witwer KW, Aikawa E, et al. Minimal information for studies of extracellular vesicles 2018 (MISEV2018): a position statement of the international society for extracellular vesicles and update of the MISEV2014 guidelines. J Extracell Vesicles. 2018;7:1535750.
- Böing AN, van der Pol E, Grootemaat AE, Coumans FA, Sturk A, Nieuwland R. Single-step isolation of extracellular vesicles by size-exclusion chromatography. J Extracell Vesicles. 2014;3. doi:10.3402/jev.v3.23430.
- Alere Technologies AS. Analysis of gradients. Optiprep application sheet C49. 2018 Jan [cited 2019 Feb 22]. Available from: https://www.axis-shield-density-gradient-media.com/C49.pdf.
- Rikkert LG, Nieuwland R, Terstappen LWMM, et al. Quality of extracellular vesicle images by transmission electron microscopy is operator and protocol dependent. J Extracell Vesicles. 2019;8:1555419.
- de Rond L, van der Pol E, Hau CM, et al. Comparison of generic fluorescent markers for detection of extracellular vesicles by flow cytometry. Clin Chem. 2018;64:680–689.
- de Rond L, Coumans FAW, Nieuwland R, et al. Deriving extracellular vesicle size from scatter intensities measured by flow cytometry. Curr Protoc Cytom. 2018;86:e43.
- Mätzler C. MATLAB functions for Mie scattering and absorption. Contract No.: 2002-08 edn. Bern, Switserland: Institut für Angewandte Physik, University of Bern; 2002.
- Kolesnikova IV, Potapov SV, Yurkin MA, et al. Determination of volume, shape and refractive index of individual blood platelets. J Quantum Spectrosc Radiat Transfer. 2006;102:37–45.
- Gouw TH, Vlugter JC. Physical properties of triglycerides. I. Density and refractive index. Fett Wiss Technol. 1966;68:544–549.
- Green PH, Glickman RM. Intestinal lipoprotein metabolism. J Lipid Res. 1981;22:1153–1173.
- Chernova DN, Konokhova AI, Novikova OA, et al. Chylomicrons against light scattering: the battle for characterization. J Biophotonics. 2018;11:e201700381.
- McMeekin TL, Groves ML, Hipp NJ. Refractive indices of amino acids, proteins, and related substances. In: Stekol J (ed.): Amino Acids and Serum Proteins (Advances in Chemistry, Vol. 44). Washington DC: American Chemical Society. 1964. p. 54–66.
Appendix
Figure A1. Flow cytometry isotype and buffer + reagent controls. (a) Side scatter versus IgG1-PE fluorescence of particles >200 nm for all fractions. (b) left panel: side versus CD61-PE fluorescence of particles >200 nm in a sample containing buffer (phosphate-buffered saline) and CD61-PE, right panel: side versus IgG1-PE fluorescence of particles >200 nm in a sample containing buffer and IgG1-PE.