
ABSTRACT
In this study, we evaluated the diagnostic value and molecular characteristics of plasma extracellular vesicles (EVs)-derived miRNAs for patients with solitary pulmonary nodules (SPNs), particularly ground-glass nodules (GGNs). This study was registered at www.clinicaltrials.gov under registration number NCT03230019. Small RNA sequencing was performed to assess plasma EVs miRNAs in 59 patients, including 12 patients with benign nodules (2017, training set). MiRNA profiles of 40 an additional individuals were sequenced (2018, validation set). Overall, 16 pure GGNs, 21 mixed GGNs, and 42 solid nodules were included, with paired post-operative plasma samples available for 20 patients. The target miRNA/reference miRNA ratio was used to construct a support vector machine (SVM) model. The SVM model with the best specificity showed 100% specificity in both the training and validation sets independently. The model with the best sensitivity showed 100% and 96.9% sensitivity in the training and validation sets, respectively. Principal component analysis revealed that pure GGN distributions were distinct from those of solid nodules, and mixed GGNs had a diffuse distribution. Among differentially expressed miRNAs, miR-500a-3p, miR-501-3p, and miR-502-3p were upregulated in tumor tissues and enhanced overall survival. The SVM classifier accurately distinguished malignant GGNs and benign nodules. The distinct profile characteristics of miRNAs provided insights into the feasibility of EVs miRNAs as prognostic factors in lung cancer.
Introduction
Implementation of lung cancer screening using low-dose computed tomography (CT) has increased the rate of detection of small pulmonary nodules [Citation1–Citation3]. Nodules that demonstrate ground-glass opacity on CT, including pure ground-glass nodules (pGGNs) and mixed ground-glass nodules (mGGNs), are particularly challenging to diagnose owing to their malignant potential and heterogeneous characteristics [Citation4,Citation5]. Hence, noninvasive diagnostic methods and risk stratification approaches for pulmonary GGNs need to be developed.
Extracellular vesicles (EVs), comprising nucleotides and proteins, are present in various body fluids [Citation6–Citation9]. EVs contents in body fluids may have applications as diagnostic biomarkers; however, their sensitivity is still unclear [Citation10,Citation11]. Exosome-associated glypican-1 is a diagnostic biomarker for early pancreatic ductal adenocarcinoma, with absolute specificity and sensitivity[Citation12]. Moreover, glypican-1-positive circulating exosomal levels are correlated with tumor burden and patient survival before and after surgery.
Circulating exosomal microRNAs (miRNAs) may serve as potential diagnostic biomarkers for non-small cell lung cancer (NSCLC) [Citation13–Citation17]. Moreover, Jim et al. established a high-throughput sequencing method for exosomal miRNAs in patients with stage I NSCLC and healthy volunteers; a set of adenocarcinoma-specific and squamous cell carcinoma-specific candidate miRNAs was identified[Citation18]. However, these studies have several limitations, including the selective bias inherent to retrospective studies and less rigorous identification methods[Citation19]. Additionally, no controlled studies have compared the differences between malignant solitary pulmonary nodules (SPNs) and benign diseases.
Accordingly, in this prospective study, we aimed to determine the diagnostic value and molecular characteristics of EVs miRNA profiles among malignant SPNs (particularly GGNs), benign nodules, and paired post-operative plasma samples.
Materials and methods
Study design
Consecutive patients with SPNs were included in this prospective study between July 2017 and March 2018 at Guangdong Provincial People’s Hospital. Blood samples were collected from patients in vacutainer tubes containing an anticoagulant (REF367863; Becton Dickinson, Franklin Lakes, NJ, USA) before surgery. Furthermore, the interval for postoperative blood sample collection ranged from 1 week to 1 month. Patients enrolled in 2017 were grouped into the training set, whereas patients enrolled in 2018 were grouped into the validation set. This protocol was approved by the ethics committee of Guangdong Provincial People’s Hospital and registered at www.clinicaltrials.gov on 26 June 2017 (registration number: NCT03230019). All patients provided written informed consent for the collection of plasma samples and for their pathological data to be used in this study.
Plasma isolation
Blood samples included in this study were collected in 10-mL vacutainer tubes with K2EDTA anticoagulant (REF367525; BD, USA), gently inverted to mix eight times, stored with the tubes remaining upright, and then shipped at 4°C within 1 h after collection. After analysis, plasma samples with hemolysis levels of less than 4 were used in this study. To harvest plasma, blood samples were centrifuged at 1500 × g for 15 min at 4°C, and each 1-mL fraction of the supernatant was transferred into a fresh 1.5-mL tube and stored at −80°C before use.
Plasma EV isolation
EVs were isolated using 3D Medicine isolation reagent (L3525; 3DMed, Shanghai, China), a polyethylene glycol-based method. This EV isolation reagent has been modified and improved from the work of Rider et al[Citation20]. and has been registered to the National Medical Products Administration as a Class I medical device (#HMXB20190091) specifically for isolation of EVs in the clinical setting. Briefly, plasma samples were centrifuged at 12,000 × g for 10 min at 4°C after incubation in a water bath. Supernatants were equilibrated to ambient temperature, filtered with a 0.45-μm filter, and then filtered with a 0.22-μm filter. The filtered supernatant was then transferred to fresh 1.5-mL tubes, and one-fourth volume of isolation reagent (L3525; 3DMed, Shanghai, China) was added and mixed by inverting the tubes several times. The mixture was incubated overnight at 4°C and centrifuged at 4700 × g for 30 min at 4°C to obtain EVs precipitates. The isolated EVs were resuspended in 200 μL phosphate-buffered saline (PBS).
Western blotting
Protein extraction was performed using EV isolation reagent (N3525; 3DMed, Shanghai, China) from 120 μL plasma, and EVs were homogenized in 100 μL RIPA lysis buffer with proteinase inhibitors (P0013B; Beyotime, Shanghai, China) on ice for 30 min. Samples were then centrifuged at 12,000 × g for 10 min at 4°C, and 80 µL supernatant was combined with 20 µL SDS-PAGE Sample Loading Buffer 5× (P0015; Beyotime). The mixtures were then incubated for 10 min at 100°C. Protein samples were separated via sodium dodecyl sulphate-polyacrylamide gel electrophoresis on 4–20% gels (Bio-Rad, Redmond, WA, USA), electroblotted onto polyvinylidene difluoride membranes (Millipore, Billerica, MA, USA), and then incubated with primary anti-CD9 antibody (diluted 1:500; cat. no. 13,174; Cell Signaling Technology, Danvers, MA, USA), anti-Alix (3A9) mouse monoclonal antibody (diluted 1:500; cat. no. 2171; Cell Signaling Technology, Danvers, MA, USA), anti-Syntenin antibody (diluted 1:500; cat. no. ab19903; Abcam, Cambridge, UK), anti-TSG101 polyclonal antibody (diluted 1:500; cat. no. abs115706; Absin Bioscience Inc., Shanghai, China), and anti-Calnexin antibody (diluted 1:1000; cat. no. 2679; Cell Signaling Technology, Danvers, MA, USA) at ambient temperature for 2 h. Horseradish peroxidase-conjugated anti-rabbit IgG and anti-mouse IgG were used as the secondary antibodies (diluted 1:5000; cat. no. 7074 and 7076; Cell Signaling Technology, Danvers, MA, USA). Antibody binding was detected using an enhanced chemiluminescence system in accordance with the manufacturer’s protocol (Tanon-5200Multi; Shanghai, China). Proteins extracted from plasma were used as a negative control. Protein levels were calculated from three independent experiments using western blotting. EVs samples from approximately 10 µL plasma were analyzed for Alix, TSG101, syntenin, CD9, and Calnexin levels.
Nanoparticle tracking analysis (NTA)
To track the number and size of EVs, a Nanosight NS 300 system (NanoSight Technology, Malvern, UK) was used [Citation21,Citation22]. Isolated EVs were resuspended in PBS at a concentration of 5 μg/mL and were further diluted 100- to 1000-fold, to achieve between 20 and 100 objects/frame. Samples were manually injected into the sample chamber at ambient temperature. Each sample was configured with a 488-nm laser and a high-sensitivity scientific complementary metal-oxide semiconductor camera, and measurement were performed in triplicate at camera setting 13 with an acquisition time of 30 s and a detection threshold setting of 7. At least 200 completed tracks were analyzed and obtained per video. Finally, nanoparticle tracking data were analyzed for EVs samples using the NTA analytical software (version 2.3).
Scanning electron microscopy (SEM)
For SEM analysis, EVs were resuspended in PBS and fixed in 5% glutaraldehyde. After washing with PBS for 5 min, the EVs were immobilized in 1% OsO4 in PBS and dehydrated with a series of ethanol concentrations (40%, 60%, 80%, and 96–98%). After the ethanol was evaporated, the samples were allowed to dry at ambient temperature for 24 h on Si substrate and then analyzed via SEM (Hitachi High-Technologies, Tokyo, Japan) after gold-palladium sputtering.
RNA isolation from plasma evs
RNA was isolated from EVs using a miRNeasy Serum/Plasma Kit (Qiagen, Valencia, CA, USA) in accordance with the manufacturer’s protocol. Briefly, 700 μL Qiazol was added to the isolated EVs in 200 μL PBS, vortexed, and incubated. Thereafter, 90 μL chloroform was added to the mixture, and the samples were vortexed again, incubated, and centrifuged at 12,000 × g, for 15 min at 4°C. The upper aqueous phase was then transferred to a new tube and supplemented with 100% ethanol at twice the original volume. Thereafter, the samples were loaded onto a spin column with a collection tube and centrifuged at 8000 × g for 15 s. The flow-through was discarded, and the spin column was rinsed twice with a wash buffer and air-dried. The recovered EVs RNA was eluted in 15 μL RNase-free water. To control the quality of miRNAs, the yield and distribution were analyzed using an Agilent 2100 bioanalyzer with Small RNA Chips (5067–1548; Agilent, Technologies, Inc., Santa Clara, CA, USA).
Preparation and sequencing of small RNA libraries
Small RNA library preparation for high-throughput sequencing was carried out using a NEBNext Small RNA Library Prep Set for Illumina (New England BioLabs, Inc., Ipswich, MA, USA).Thereafter, the small RNA library was purified using a NucleoSpin Gel and PCR Clean-up kit (Qiagen, Shanghai, China). The resulting purified library was analyzed for purity on an Agilent 2100 Bioanalyzer (Agilent Technologies, Inc., Santa Clara, CA, USA) and then subjected to single-ended, strand-specific sequencing on an Illumina HiSeq X10 platform.
Bioinformatics analysis of mirna-seq data
The 3′ adaptors of reads were cleaved using a custom programme. Subsequently, the reads were aligned to human genome hg19 assembly (http://hgdownload.soe.ucsc.edu/goldenPath/hg19/bigZips/) by BWA 0.7.12-r1039[Citation23]. The annotations were generated from Gencode[Citation24] v25 and miRBase[Citation25] v21 for statistical analysis and to determine expression levels. miRNA expression was calculated by counting the number of reads mapped to regions annotated by mature miRNAs. To enable cross-sample comparisons, miRNAs expressed (mapped by at least one read) in all samples were considered housekeeping genes. The size factors were calculated on the basis of the 75th percentile of the housekeeping genes described by DESeq2[Citation26], and expression levels were normalized by dividing the raw read counts by size factors.
Statistical analysis
To scale for miRNA expression, principal component analysis (PCA) was performed, wherein the normalized expression levels of each miRNA were scaled by dividing the expression levels by the maximum expression levels of the miRNAs. PCA was then performed on the matrix constructed by the scaled expression levels, using the prcomp function in R 3.3.3. Pathway enrichment of the experimentally validated targets of miRNAs was performed using mirPath[Citation27] v.3, which provided EASE score and false discovery rates using Fisher’s exact tests and unbiased empirical distributions.
Kaplan-Meier plot analysis of The Cancer Genome Atlas (TCGA) data was performed using OncoLnc[Citation28]. Support vector machine (SVM) analysis was performed with default parameters of svm.LinearSVC in the sklearn package. The model kernel was “linear”, penalization was ‘L2ʹ, and loss was “squared_hinge”. Differentially expressed miRNAs between the two groups were defined with two-tailed p values (t-tests) less than 0.001 and having log2 fold-changes (group means) greater than 1 or less than – 1. Differentially expressed miRNAs between the before and after surgery groups were analyzed using pairwise t tests, whereas differentially expressed miRNAs between solid groups 1 and 2 were calculated by Mann-Whitney tests. Results with p values of less than or equal to 0.05 were considered statistically significant.
Results
Patients and clinicopathological data
In total, 99 patients were enrolled in this study, including 20 patients (20.2%) with benign nodules. The other samples were diagnosed as adenocarcinoma, ranging from adenocarcinoma in situ (AIS) to invasive adenocarcinoma. Detailed clinical data are summarized in . Ten patients were diagnosed with AIS, which is technically not a malignant disease. However, from the perspective of the pathological progression of lung adenocarcinoma, we still classified AIS as a type of malignant nodule.
Table 1. Clinicopathological characteristics of samples in the training and validation sets.
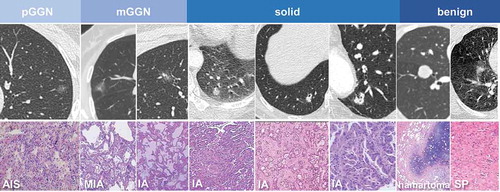
Overall, the 79 malignant samples included 16 pGGNs, 21 mGGNs, and 42 solid nodules, of which 20 were paired post-operative plasma samples. Representative imaging features and pathological information are shown in
Figure 1. Representative imaging and pathological information in different groups. Abbreviations: AIS, adenocarcinoma in situ; MIA, minimally invasive adenocarcinoma; IA, invasive adenocarcinoma; SP, sclerosing pneumocytoma.
Evs characterization
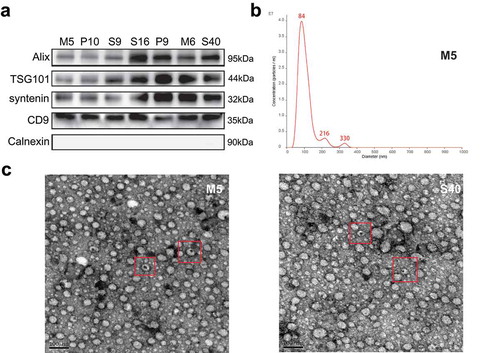
To characterize the isolated EVs in this study, three experiments suggested by the ISEV were performed. First, according to MISEV 2018[Citation29], we evaluated several vesicle markers, including Alix, TSG101, Syntenin, CD9, and Calnexin, in the seven representative EV samples using Western blotting (). Furthermore, to characterize the concentrations and sizes of EVs in the plasma, a Nanosight NS300 system was used for nanoparticle tracking analysis. The results showed that most isolated vesicles were around 100 nm, which is the typical size of exosomes (). Additionally, SEM images from two representative EV samples are shown in .
Figure 2. Characteristic proteins and morphology of extracellular vesicles (EVs). (a) The protein levels of Alix, TSG101, syntenin, CD9, and Calnexin in the EVs of seven representative samples were assessed using western blotting. (b) Nanoparticle tracking analysis results from representative EVs samples are shown. (c) Images of EVs from two representative samples were taken by scanning electron microscopic analysis. The representative EVs morphology is highlighted by a red box.
Normalization, stabilization, and combination to construct the SVM classifier
Samples with mapping rates of greater than 90% were used. The mean percentages of miRNAs of total reads in the training and validation sets were both over 60%, and the reads distribution of each sample is shown in Supplementary Fig. 1A and 1B. We set 5 mapped and expressed reads as the cut-off.
Because EVs miRNA may have originated from different cell types, similar to the concept of normalization during quantitative polymerase chain reaction, the object was analyzed as a ratio of the two miRNAs, wherein one miRNA was considered the “target gene” and the other miRNA was considered the “reference gene.” The prediction value was calculated by dividing the target gene expression levels by those of the reference gene for each sample.
The area under the curve (AUC) of the receiver operating characteristic (ROC) curve was calculated independently in the training set and the validation set for each miRNA ratio. To achieve better stability, miRNA ratios with the same directions in both sets and similar AUCs (difference in AUCs ≤ 0.05) were selected.
To identify biomarkers with the best cut-off to differentiate benign nodules from malignant nodules across two sets of samples, two pairs of miRNA ratios were used to construct a two-dimensional space, and the SVM could be applied to determine the best cut-off to distinguish benign from malignant nodules. The sensitivity and specificity of each pair of miRNA ratio combinations are highlighted in in the order of sum diagnostic value.
Table 2. Separate sensitivity and specificity of SVM models in the training and validation sets in the order of sum area under the curve (AUC; top 10).
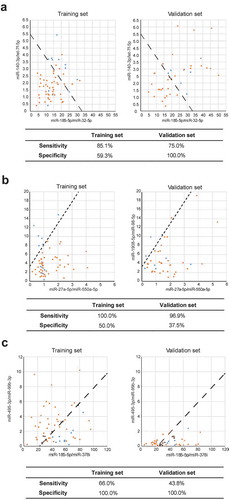
As shown in , miR-185-5p/miR-32-5p and miR-140-3p/let-7f-5p displayed the highest diagnostic value in the SVM model, with a sensitivity and specificity of 85.1% and 75%, respectively, in the training set and 59.3% and 100%, respectively, in the validation set. Furthermore, the combination of miRNAs with the highest sensitivity was miR-27a-5p/miR-550a-5p and miR-1908-5p/miR-98-5p. The sensitivities of this combination in the training and validation sets were 100% and 96.9%, respectively. Moreover, the combination of miRNAs with the highest specificity was miR-185-5p/miR-378i and miR-495-3p/miR-99b-3p. The specificity of this combination was 100% in both the training and validation sets.
Figure 3. Visualized distribution of several support vector machine (SVM) classifiers with different interests. (a) The SVM model with the highest diagnostic value. (b) The SVM model with the highest sensitivity. (c) The SVM model with the highest specificity. Malignant nodule: orange; benign nodule: blue.
Characteristics of evs mirna profiles in three subsets of malignant nodules
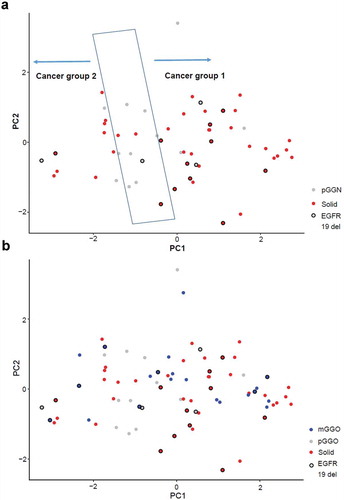
To further evaluate the potential classifications of blood EVs miRNA profiles, PCA was performed before surgery for all samples obtained from patients with malignant nodules. The pGGN samples were distributed distinctly from solid samples (). pGGN samples were primarily localized in the central region, whereas solid samples were categorized into two groups. Interestingly, 11 of 12 solid nodules with small deletions on exon 19 of the epidermal growth factor receptor gene were categorized as group 1; this was significantly higher than in group 2. mGGN samples could also be categorized into the same groups as solid samples (). These results revealed the complexity among malignant nodules from the profiles of blood EVs miRNAs.
Figure 4. Principal component analysis (PCA). (a) PCA of pure ground-glass nodule (pGGN) samples and solid samples. (b) PCA of all malignant nodules, including pGGNs, mixed ground-glass nodules (mGGNs), and solid samples.
Biological analysis of the stratification of malignant nodules
Because the major contributor to the classification in PCA is PC 1, the miRNAs were ranked in accordance with their weight in PC 1. MiRNAs showing the largest contributions in PC 1 had either large positive or negative weights. Differentially expressed miRNAs between groups 1 and 2 with absolute weights larger than 0.05 were selected (). Pathway enrichment analysis revealed that these miRNAs primarily targeted cancer-related pathways, such as the cell cycle and adherens junctions (). Interestingly, three differentially expressed miRNAs with positive weights, namely miR-500a-3p, miR-501-3p, and miR-502-3p, showed strong hazard ratios for the survival of patients with lung adenocarcinoma in tumor tissues (Supplementary Figure 2A). In contrast, miRNAs with high negative weights did not show significant hazard ratios (Supplementary Figure 2B).
Figure 5. Biological analysis of the stratification of malignant nodules. (a) Differentially expressed miRNAs between solid groups 1 and 2 according to PCA (with absolute weights larger than 0.05 were selected). (b) Pathway enrichment analysis of the differentially expressed miRNAs between solid groups 1 and 2. (c) Differences in the expression levels of miR-500a-3p, miR-501-3p, and miR-502-3p between groups 1 and 2. (d) Survival curves of samples with different expression levels of miR-500a-3p, miR-501-3p, and miR-502-3p using data from TCGA database (top 15% versus bottom 15%).
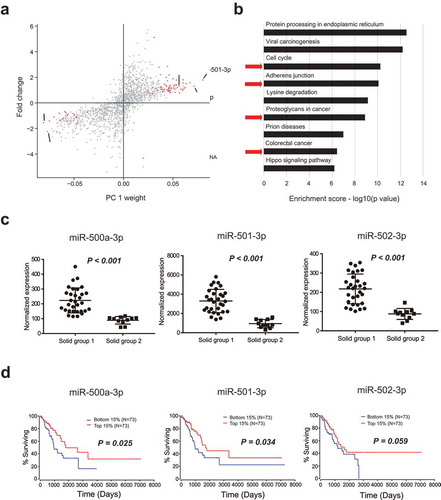
miR-500a-3p, miR-501-3p, and miR-502-3p are proximally located in the intron of CLCN5 and are probably coregulated (Supplementary Figure 2C). These three miRNAs were upregulated in group 1 compared with those in group 2, with significant p values (p < 0.001, p < 0.001, and p < 0.001, respectively; ). Intriguingly, the upregulation of these three miRNAs in tumor tissues from TCGA was associated with better overall survival than that observed in tumor tissues with the downregulation of these miRNAs (). Overall, the upregulation of these three miRNAs in the blood EVs of group 1 solid nodules was associated with improved prognosis in patients.
Comparison of mirna profiles between pre- and postsurgical plasma samples
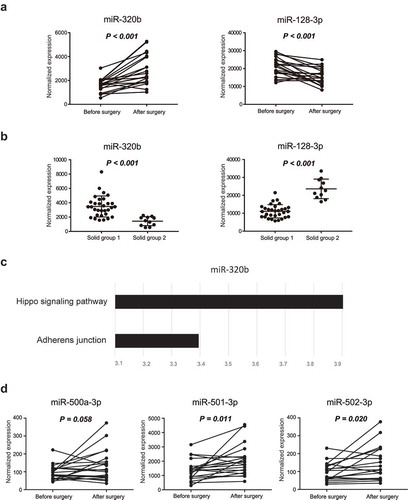
A comparison of the miRNA profiles of blood EVs before and after surgery revealed nine miRNAs with significant differential expression profiles before and after surgery (). Among these miRNAs, miR-320b and miR-128-3p also showed differential expression between group 1 and group 2 solid nodules (,)). The targets of miR-320b were enriched in the Hippo signaling pathway, which is related to cell proliferation (). However, no pathways were enriched for targets of miR-128-3p. These data suggested that group 1 and group 2 solid nodules may be developed from distinct carcinogenic pathways. Furthermore, miR-500a-3p, miR-501-3p, and miR-502-3p were upregulated after surgery, with marginal p values (p = 0.058, p = 0.011, and p = 0.020, respectively), suggesting that abnormal levels of miR-500a-3p, miR-501-3p, and miR-502-3p may be associated with tumor progression ().
Table 3. Significant differential expression of miRNAs before and after surgery.
Figure 6. Biological analysis of exosomal miRNAs between pre- and postsurgical plasma samples. (a) Expression levels of miR-320b and miR-128-3p before and after surgery. (b) Differences in the expression levels of miR-320b and miR-128-3p between group 1 and group 2. (c) The targets of miR-320b were enriched in the Hippo signaling pathway and adherens junctions. (d) Expression levels of miR-500a-3p, miR-501-3p, and miR-502-3p before and after surgery. Differentially expressed miRNAs between the before and after surgery groups were analyzed using pairwise t tests, whereas differentially expressed miRNAs between solid group 1 and 2 were calculated by Mann-Whitney tests. Results with p values of less than or equal to 0.05 were considered statistically significant.
Discussion
EVs contain numerous bioactive molecules, such as proteins and nucleic acids, from parent cells, thereby playing vital roles in intercellular communication [Citation6,Citation9,Citation30,Citation31]. Previous studies have reported the promising diagnostic value of circulating EV contents owing to their unique compositions and functions [Citation12,Citation18,Citation32]. However, these studies are inadequate because of their selection bias and small sample size. In contrast, this prospective study involved the analysis of consecutive blood samples from patients with SPNs, and the plasma EVs miRNA profiles were analyzed via high-throughput sequencing. The diagnostic candidates were further confirmed via SVM, and the potential biological characteristics of EVs miRNAs were analyzed via bioinformatics analysis.
Cell-free DNA is another important circulating material that is often analyzed in studies involving liquid biopsies. An interim analysis of TCGA data with regard to liquid biopsy for early stage NSCLC was published in 2018[Citation33]. Overall, in 63 patients with stage I–IIIA NSCLC, with the precondition of 98% specificity, the sensitivities of whole-genome bisulphite assays, whole genome assays, and targeted assays were 41%, 38%, and 51%, respectively. Moreover, plasma proteins can serve as diagnostic markers for early-stage lung cancer. In the PANOPTIC trial[Citation34], the proteomics classifier attained 97% sensitivity, 44% specificity, and a 98% negative predictive value. Similarly, Li established a 13-protein classifier for pulmonary nodules, which also approached a closed negative predictive value of 90%[Citation35]. Thus, comparable diagnostic value was observed for the SVM classifier of EVs miRNA. We believed that the current results are promising for clinical practice based on the following findings. First, in this study, of all 79 malignant nodules, 17 nodules (21.5%) were smaller than 1 cm, and 43 nodules (54.4%) ranged from 1 to 2 cm. Moreover, these nodules included 16 pure GGNs and 21 mixed GGNs. In other words, the cases included in this study were stage IA lung cancer, which is the earliest stage in TNM lung cancer staging. Accordingly, most of these tumors would have been difficult to biopsy in clinical practice, representing a major challenge to be overcome in thoracic surgery. Second, we could not maintain high specificity and sensitivity at the same time for biological markers. For SPN noninvasive diagnosis, specificity is the primary consideration. As we found in this study, miRNA pairs with high specificity could achieve 100% specificity in both the training set and validation set. Additionally, miRNA pairs with high sensitivity could achieve 100% and 96.9% sensitivity in the training set and validation set, respectively. Hence, we believe that these miRNA pairs had diagnostic value and were stable.
miR-500a-3p, miR-501-3p, and miR-502-3p were upregulated in group 1 upon PCA and after surgery, indicating that miR-500a-3p, miR-501-3p, and miR-502-3p were associated with tumor progression. Moreover, analysis of TCGA data revealed that upregulation of miR-500a-3p, miR-501-3p, and miR-502-3p was associated with enhanced overall patient survival. Although the occurrence of these three miRNAs in lung cancer is unclear, the tumor-promoting abilities of these miRNAs have been observed in other cancer types. Indeed, miR-500a-3p is upregulated in various human cancers and non-neoplastic diseases [Citation36–Citation39]. In liver cancer, miR-500a-3p is upregulated in liver cancer stem cells, thereby promoting cancer stem cell-like properties via activation of signal transducer and activator of transcription 3; additionally, miR-500a-3p overexpression is correlated with poor survival [Citation40,Citation41]. In gastric cancer, overexpression of the same miRNA was correlated with cancer progression and resistance to apoptosis, leading to sustained activation of nuclear factor-κB in vitro and in vivo[Citation42]. The tissue factor pathway inhibitor is repressed by miR-500 in prostate cancer, in which upregulation of this miRNA is associated with poor prognosis and overall survival[Citation43]. Results of functional analyses revealed that overexpression of miR-501-3p in HCCLM3 cancer cells inhibits cell proliferation, migration, invasion, and the epithelial-mesenchymal transition, whereas loss of miR-501-3p in PLC/PRF/5 cancer cells facilitates all of these cellular activities[Citation44]. M2 macrophage-derived exosomal miR-501-3p inhibits the tumor-suppressor TGFBR3 gene and facilitates the development of PDAC by activating the TGF-β signaling pathway[Citation45]. Importantly, miR-501-3p is also significantly downregulated in exosomes from patients with prostate cancer[Citation46]. In addition, overexpression of miR-502-3p dramatically inhibits hepatocellular carcinoma cell proliferation, metastasis, invasion, and cell adhesion[Citation47].
The contrasting association with tumorigenesis and disease outcomes may be explained on the basis of the diverse source of EVs miRNAs detected in patient plasma. EVs play important roles in cell-cell communication by transporting lipids, proteins, and nucleic acids across the extracellular space. In addition to promoting progression in tumor cells, exchange of EVs is a crucial mode of communication among dendritic cells, the most potent antigen-presenting cells[Citation48]. Among others, miR-500 and miR-501-3p are exclusively present in EVs originating from mature dendritic cells, indicating that these EVs miRNAs present in patient plasma may originate from different sources. For example, high levels of miR-500a-3p and miR-501-3p in postoperative samples may indicate activated immunity in response to tissue damage after surgery. In contrast, these changes may also be associated with sustained inflammatory responses during tumor growth[Citation49].
Several limitations in this study warrant mention. First, as a single-center study, it is uncertain whether these predictive tools are applicable to other populations with different cultures and ethnic groups. Future work with larger cohorts from multiple centers is still needed to externally validate our results. Second, we lacked prognostic information because all cases were newly diagnosed.
In summary, the current study provided a stable and valuable SVM classifier model based on plasma EVs-derived miRNAs to distinguish malignant GGNs and benign nodules (highest specificity: 100%; highest sensitivity: 98.9%). Additionally, distinct characteristics of miRNA profiles among pure GGNs, mixed GGNs, and solid samples were newly discovered. We believe that the development of an effective, noninvasive diagnostic and risk stratification model could be helpful for clinicians.
Disclosure of Interest
All authors affiliated with 3D Medicines Inc. are current or former employees. No potential conflicts of interest were disclosed by the other authors.
Supplemental Material
Download Zip (129.7 KB)Acknowledgments
We appreciate the support and participation of the physicians and patients in this study. We would like to thank Editage (www.editage.cn) for English language editing.
Supplementary Material
Supplemental material for this article can be accessed here
Additional information
Funding
References
- Aberle DR, Abtin F, Brown K. Computed tomography screening for lung cancer: has it finally arrived? Implications of the national lung screening trial. J Clin Oncol. 2013;31:1002–13.
- National lung screening trial research team. Reduced lung-cancer mortality with low-dose computed tomographic screening. N Engl J Med. 2011;(365):395–409.
- Saghir Z, Dirksen A, Ashraf H, et al. CT screening for lung cancer brings forward early disease. The randomised Danish lung cancer screening trial: status after five annual screening rounds with low-dose CT. Thorax. 2012;67:296–301.
- Tan BB, Flaherty KR, Kazerooni EA, et al. American college of chest physicians. The solitary pulmonary nodule. Chest. 2003;123:89S–96S.
- Detterbeck FC, Homer RJ. Approach to the ground-glass nodule. Clin Chest Med. 2011;32:799–810.
- Vlassov AV, Magdaleno S, Setterquist R, et al. Exosomes: current knowledge of their composition, biological functions, and diagnostic and therapeutic potentials. Biochim Biophys Acta. 2012;1820:940–948.
- Becker A, Thakur BK, Weiss JM, et al. Extracellular vesicles in cancer: cell-to-cell mediators of metastasis. Cancer Cell. 2016;30:836–848.
- Kalluri R. The biology and function of exosomes in cancer. J Clin Invest. 2016;126:1208–1215.
- Kourembanas S. Exosomes: vehicles of intercellular signaling, biomarkers, and vectors of cell therapy. Annu Rev Physiol. 2015;77:13–27.
- Chen IH, Xue L, Hsu CC, et al. Phosphoproteins in extracellular vesicles as candidate markers for breast cancer. Proc Natl Acad Sci U S A. 2017;114:3175–3180.
- Soung YH, Ford S, Zhang V, et al. Exosomes in cancer diagnostics. Cancers (Basel). 2017;9:8.
- Melo SA, Luecke LB, Kahlert C, et al. Glypican-1 identifies cancer exosomes and detects early pancreatic cancer. Nature. 2015;523:177–182.
- Sandfeld-Paulsen B, Aggerholm-Pedersen N, Bæk R, et al. Exosomal proteins as prognostic biomarkers in non-small cell lung cancer. Mol Oncol. 2016;10:1595–1602.
- Cazzoli R, Buttitta F, Di Nicola M, et al. microRNAs derived from circulating exosomes as noninvasive biomarkers for screening and diagnosing lung cancer. J Thorac Oncol. 2013;8:1156–1162.
- Silva J, García V, Á Z, et al. Vesicle-related microRNAs in plasma of nonsmall cell lung cancer patients and correlation with survival. Eur Respir J. 2011;37:617–623.
- Rabinowits G, Gerçel-Taylor C, JM D, et al. Exosomal microRNA: a diagnostic marker for lung cancer. Clin Lung Cancer. 2009;10:42–46.
- Jakobsen KR, Paulsen BS, Bæk R, et al. Exosomal proteins as potential diagnostic markers in advanced non-small cell lung carcinoma. J Extracell Vesicles. 2015;4:26659.
- Jin X. Evaluation of tumor-derived exosomal miRNA as potential diagnostic biomarkers for early-stage non-small cell lung cancer using next-generation sequencing. Clin Cancer Res. 2017;23:5311–5319.
- Li P, Kaslan M, Lee SH, et al. Progress in exosome isolation techniques. Theranostics. 2017;7:789–804.
- Rider MA, Hurwitz SN, Meckes DG Jr. ExtraPEG: a polyethylene glycol-based method for enrichment of extracellular vesicles. Sci Rep. 2016;6:23978.
- Felicetti F, De Feo A, Coscia C, et al. Exosome-mediated transfer of miR-222 is sufficient to increase tumor malignancy in melanoma. J Transl Med. 2016;14:56.
- Zhang H, Deng T, Liu R, et al. Exosome-delivered EGFR regulates liver microenvironment to promote gastric cancer liver metastasis. Nat Commun. 2017;8:15016.
- Li H, Durbin R. Fast and accurate long-read alignment with Burrows-Wheeler transform. Bioinformatics. 2010;26:589–595.
- Harrow J, Frankish A, Gonzalez JM, et al. GENCODE: the reference human genome annotation for The ENCODE project. Genome Res. 2012;22:1760–1774.
- Griffiths-Jones S, Saini HK, van Dongen S, et al. miRBase: tools for microRNA genomics. Nucleic Acids Res. 2008;36:D154–8.
- Love MI, Huber W, Anders S. Moderated estimation of fold change and dispersion for RNA-seq data with DESeq2. Genome Biol. 2014;15:550.
- Vlachos IS, Zagganas K, Paraskevopoulou MD, et al. DIANA-miRPath v3.0: deciphering microRNA function with experimental support. Nucleic Acids Res. 2015;43:W460–6.
- Anaya J. OncoLnc: linking TCGA survival data to mRNAs, miRNAs, and lncRNAs. PeerJ Comput Sci. 2016;2:e67.
- Thery C, Witwer KW, Aikawa E, et al. Minimal information for studies of extracellular vesicles 2018 (MISEV2018): a position statement of the International society for extracellular vesicles and update of the MISEV2014 guidelines. J Extracell Vesicles. 2018;7:1535750.
- Xu R, DW G, HJ Z, et al. Extracellular vesicle isolation and characterization: toward clinical application. J Clin Invest. 2016;126:1152–1162.
- Ge R, Tan E, Sharghi-Namini S, et al. Exosomes in cancer microenvironment and beyond: have we overlooked these extracellular messengers? Cancer Microenviron. 2012;5:323–332.
- Liu C, Xu X, Li B, et al. Single-exosome-counting immunoassays for cancer diagnostics. Nano Lett. 2018;18:4226–4232.
- Oxnard GR, Maddala T, Hubbell E, et al. Genome-wide sequencing for early stage lung cancer detection from plasma cell-free DNA (cfDNA): the circulating cancer genome Atlas (CCGA) study. American Society of Clinical Oncology Annual Meeting, Chicago, IL, 2018.
- Silvestri GA, Tanner NT, Kearney P, et al. Assessment of plasma proteomics biomarker’s ability to distinguish benign from malignant lung nodules: results of the PANOPTIC (Pulmonary nodule plasma proteomic classifier) trial. Chest. 2018;154:491–500.
- Li XJ, Hayward C, Fong PY, et al. A blood-based proteomic classifier for the molecular characterization of pulmonary nodules. Sci Transl Med. 2013;5:207ra142.
- Ruiz-Lafuente N, Alcaraz-García MJ, Sebastián-Ruiz S, et al. IL-4 up-regulates MiR-21 and the MiRNAs hosted in the CLCN5 gene in chronic lymphocytic leukemia. PLoS One. 2015;10:e0124936.
- Cosar E, Mamillapalli R, Ersoy GS, et al. Serum microRNAs as diagnostic markers of endometriosis: a comprehensive array-based analysis. Fertil Steril. 2016;106:402–409.
- Liao XH, Xie Z, Guan CN. MiRNA-500a-3p inhibits cell proliferation and invasion by targeting lymphocyte antigen 6 complex locus K (LY6K) in human non-small cell lung cancer. Neoplasma. 2018;65:673–682.
- Revathidevi S, Sudesh R, Vaishnavi V, et al. Screening for the 3ʹUTR polymorphism of the PXR gene in South Indian breast cancer patients and its potential role in pharmacogenomics. Asian Pac J Cancer Prev. 2016;17:3971–3977.
- Jiang C, Long J, Liu B, et al. miR-500a-3p promotes cancer stem cells properties via STAT3 pathway in human hepatocellular carcinoma. J Exp Clin Cancer Res. 2017;36:99.
- Lou W, Liu J, Gao Y, et al. MicroRNA regulation of liver cancer stem cells. Am J Cancer Res. 2018;8:1126–1141.
- Zhang L, Ding Y, Yuan Z, et al. MicroRNA-500 sustains nuclear factor-kappaB activation and induces gastric cancer cell proliferation and resistance to apoptosis. Oncotarget. 2015;6:2483–2495.
- Cai B, Chen W, Pan Y, et al. Inhibition of microRNA-500 has anti-cancer effect through its conditional downstream target of TFPI in human prostate cancer. Prostate. 2017;77:1057–1065.
- Luo C, Yin D, Zhan H, et al. microRNA-501-3p suppresses metastasis and progression of hepatocellular carcinoma through targeting LIN7A. Cell Death Dis. 2018;9:535.
- Yin Z, Ma T, Huang B, et al. Macrophage-derived exosomal microRNA-501-3p promotes progression of pancreatic ductal adenocarcinoma through the TGFBR3-mediated TGF-beta signaling pathway. J Exp Clin Cancer Res. 2019;38:310.
- Rodríguez M, Bajo-Santos C, Hessvik NP, et al. Identification of non-invasive miRNAs biomarkers for prostate cancer by deep sequencing analysis of urinary exosomes. Mol Cancer. 2017;16:156.
- Jin H, Yu M, Lin Y, et al. MiR-502-3P suppresses cell proliferation, migration, and invasion in hepatocellular carcinoma by targeting SET. Onco Targets Ther. 2016;9:3281–3289.
- Montecalvo A, Larregina AT, Shufesky WJ, et al. Mechanism of transfer of functional microRNAs between mouse dendritic cells via exosomes. Blood. 2012;119:756–766.
- Rakoff-Nahoum S. Why cancer and inflammation? Yale J Biol Med. 2006;79:123–130.