
ABSTRACT
Extracellular vesicles (EVs) play central physiological and pathophysiological roles in intercellular communication. Biomarker studies addressing disorders such as cardiovascular diseases often focus on circulating microRNAs (miRNAs) and may, depending on the type of disease and clinic routine, utilise patient specimens sampled from arterial or venous blood vessels. Thus, it is essential to test whether circulating miRNA profiles depend on the respective sampling site. We assessed potential differences in arterial and venous cell-free miRNA profiles in a cohort of 20 patients scheduled for cardiac surgery. Prior to surgery, blood was simultaneously sampled from the radial artery and the internal jugular vein. After precipitating crude EVs, we performed small RNA Sequencing, which failed to detect significantly regulated miRNAs using stringent filtering criteria for differential expression analysis. Filtering with less strict criteria, we detected four miRNAs slightly upregulated in arterial samples, one of which could be validated by reverse transcription real-time PCR. The applicability of these findings to purified arterial and venous EVs was subsequently tested in a subset of the initial study population. While an additional clean-up step using size-exclusion chromatography seemed to reduce overall miRNA yield compared to crude EV samples, no miRNAs with differential arteriovenous expression were detected. Unsupervised clustering approaches were unable to correctly classify samples drawn from arteries or veins based on miRNAs in either crude or purified preparations. Particle characterisation of crude preparations as well as characterisation of EV markers in purified EVs resulted in highly similar characteristics for arterial and venous samples. With the exception of specific pathologies (e.g. severe pulmonary disorders), arterial versus venous blood sampling should therefore not represent a likely confounder when studying differentially expressed circulating miRNAs. The use of either arterial or venous serum EV samples should result in highly similar data on miRNA expression profiles for the majority of biomarker studies.
Abbreviations ACE inhibitors: Angiotensin-converting-enzyme inhibitors; ApoA1: Apolipoprotein A1; CNX: Calnexin; Cv: Coefficient of variation; cDNA: Complementary DNA; CABG: Coronary artery bypass graft; DGE: Differential gene expression; DPBS: Dulbecco’s Phosphate Buffered Saline; EVs: Extracellular vesicles; log2FC: Log2 fold change; baseMean: Mean miRNA expression; miRNA: MicroRNA; NTA: Nanoparticle Tracking Analysis; NGS: Next-Generation Sequencing; RT-qPCR: Reverse transcription quantitative real-time PCR; rRNA: Ribosomal RNA; RT: Room temperature; SEC: Size-exclusion chromatography; snoRNA: Small nucleolar RNA; snRNA: Small nuclear RNA; small RNA-Seq: Small RNA Sequencing; SD: Standard deviation; tRNA: Transfer RNA; TEM: Transmission electron microscopy; UA: Uranyl acetate.
Introduction
Recent research has demonstrated the crucial pathophysiological role of extracellular vesicles (EVs) in cell-cell communication in cardiovascular diseases and multiple other disorders. EVs, loaded with signalling molecules such as proteins, lipids and RNA, are involved in numerous physiological and pathological processes [Citation1]. Previous biomarker research has pointed out that arterial and venous blood are not entirely rheologically comparable, and it has therefore been proposed to consistently use either arterial or venous blood samples for biomarker detection [Citation2]. This recommendation has, however, never been systematically tested regarding circulating cell-free microRNAs (miRNAs) or circulating EVs and their molecular cargo, particularly miRNAs. If applicable to EV research, it would render results of studies using arterial and venous approaches to blood sampling difficult to compare.
When analysing circulating miRNAs derived from porcine whole blood samples by Next-Generation Sequencing (NGS), 12 miRNAs with different arteriovenous expression levels were identified by Bai et al. [Citation3]. Aligning matched arterial and venous rat plasma samples using microarray techniques, altered expression levels of 24 miRNAs were detected in another study [Citation4]. In contrast, identical protein expression was found in paired arterial and venous human samples when comparing serum biomarker levels using ELISA [Citation5]. These data indicate that arterial and venous blood samples may have many similarities regarding protein and miRNA content, but it cannot be ruled out that differences in specific blood components might exist nonetheless.
Blood samples for diagnostic or research purposes are usually drawn using peripheral venous access, whereas arterial lines inserted for monitoring purposes are more convenient and often preferred in critically ill patients undergoing intensive care unit therapy or major surgery. This may result in inherent differences in EV biomarker validity and sensitivity when data from arterial and venous samples are compared within a particular study [Citation6] or in a loss of information when only one type of vascular access is used. Additionally, potential differences in miRNA profiles render comparability of results across studies that are based on either arterial or venous EVs and other carriers of circulating miRNAs difficult. A more detailed analysis of potential differences in EV morphology and non-coding RNA load could provide information on organ-specific effects, as arterial EVs pass through the left ventricle and lungs whereas venous EVs may more closely reflect the total venous return. Therefore, it seems to be of considerable interest to systematically analyse and compare circulating miRNAs sampled from arteries and veins. In this study, we compared circulating miRNA profiles in paired arterial and venous sera from cardiac surgical patients using small RNA Sequencing (small RNA-Seq). After detecting highly similar arteriovenous miRNA expression in crude cell-free preparations, these findings were additionally validated in purified EVs. Subsequent biological characterisation failed to establish systematic differences in characteristics of either crude preparations or purer EVs. The study was performed in accordance with the MISEV guidelines [Citation7]. Sequencing data were deposited with the European Nucleotide Archive (http://www.ebi.ac.uk/ena/data/view/PRJEB33261) and all relevant data of the experiments were submitted to the EV-TRACK knowledgebase (EV-TRACK ID: EV190051) [Citation8]
Materials and methods
Study population
The study population consisted of 20 cardiac surgical patients (n = 18 male and n = 2 female, age: 67.3 ± 10.7 years, BMI: 28.8 ± 5.9) with severe heart disease (). Out of those patients, fifteen had coronary artery disease requiring coronary artery bypass surgery (CABG) and five patients had combined heart valve disease and were scheduled for CABG and aortic or mitral valve replacement. Fifteen patients had arterial hypertension, seven suffered from non-insulin-dependent diabetes and five presented with mild preoperative renal function impairment. Ten patients received beta-adrenergic antagonists, seven were treated with angiotensin-converting-enzyme inhibitors (ACE inhibitors) and twelve were on statins or combinations of these compounds.
Table 1. Demographics and clinical characteristics of the study population.
Sample collection
An arterial line (20 G, 8 cm polyethylene catheter, Vygon, Aachen, Germany) was preoperatively introduced into the radial artery. After induction of anaesthesia using the hypnotic agent propofol and the opiate sufentanil, a central venous line (8.5 F, 16 cm, polyurethane catheter with chlorhexidine coating, Arrow International, Teleflex Medical GmbH, Fellbach, Germany) was placed into the internal jugular vein.
Arterial and venous blood were simultaneously sampled from the arterial line and the central venous line. For each patient, blood at both sampling sites was drawn into one 9 ml serum collection tube (S-Monovette, Sarstedt AG&Co, Nümbrecht, Germany) each, allowed to clot for 30 min and subsequently centrifuged at 3,400 x g for 10 min at room temperature (RT). Within 10 min of separation, serum was aliquoted and stored at – 80°C.
Enrichment of crude cell-free RNA
Crude EVs were enriched from 1 ml serum using a polymer-based precipitation method (miRCURY Exosome Isolation Kit-Serum and Plasma, Exiqon, Vedbaek, Denmark). Pellets were resuspended in the provided resuspension buffer for subsequent RNA extraction and downstream characterisation.
Total RNA was extracted from crude EVs with either the miRCURY RNA Isolation Kit-Biofluids (Exiqon, Vedbaek, Denmark) for NGS or the miRNeasy Micro Kit (Qiagen, Venlo, The Netherlands) for reverse transcription quantitative real-time PCR (RT-qPCR), respectively. To increase the yield of these samples, herein referred to as crude cell-free RNA, eluates were reapplied to the membrane for a second elution. Eluates were concentrated to a volume of 8 µl for NGS and 5 µl for RT-qPCR by applying vacuum-induced centrifugal evaporation (Savant SpeedVac SC100, Savant Instruments Inc., Bloomberg, USA). RNA size distribution and yield were assessed by capillary electrophoresis (2100 Bioanalyzer, RNA 6000 Pico Kit, Agilent Technologies, Santa Clara, USA).
Validation of arteriovenous miRNA profiles in purified EV samples
To validate our findings on crude cell-free RNA in EV samples with higher purity, we performed additional experiments using a subgroup of the initial patient population (n = 14). In these experiments, crude EVs were enriched from 1 ml arterial or venous serum using precipitation as described above and further purified by size-exclusion chromatography (SEC, qEVoriginal, Izon Bioscience, Cambridge, UK). Crude EV pellets were resuspended in 500 µl Dulbecco’s Phosphate Buffered Saline (DPBS) and loaded onto qEV columns as per the manufacturer’s instructions. The EV-containing fractions 7–9 were collected, pooled and pelleted by ultracentrifugation for 2 h at 200,000 x g (Beckman Optima LE-80K Ultracentrifuge, SW60 Rotor, k-factor 84.0, Brea, USA). Total RNA was subsequently extracted from pellets using the miRNeasy Micro Kit (Qiagen, Venlo, The Netherlands). Preparation of sequencing libraries, sequencing-by-synthesis and differential gene expression (DGE) analyses were performed as described below. For EV characterisation experiments, pellets were resuspended in 30 µl sterile-filtered DPBS or lysed in 1x RIPA buffer (Abcam, Cambridge, UK).
Next-Generation Sequencing
The applied methods were previously described [Citation6]. Briefly, complementary DNA (cDNA) libraries were prepared from 6 µl of total RNA from arterial and venous samples using the NEBNext Multiplex Small RNA Library Prep Set for Illumina (New England Biolabs Inc., Ipswich, USA). To compensate for low RNA input and reduce the formation of primer dimers, all adaptors and primers were diluted 1:2 in nuclease-free water. After amplifying the cDNA products by PCR, the concentration of ligation products corresponding to miRNAs was determined on the 2100 Bioanalyzer using the DNA 1000 Kit (Agilent Technologies, Santa Clara, USA). Whenever available, 8 ng of each bar-coded sample were pooled, and size selection for ligation products equivalent to miRNAs was subsequently performed using 4% agarose gel electrophoresis. For samples with lower concentrations, the total amount of cDNA was used for sequencing. After purification of cDNA libraries (Monarch DNA Gel Extraction Kit, New England Biolabs Inc., Ipswich, USA) and quality control using capillary electrophoresis (2100 Bioanalyzer, DNA High Sensitivity Kit, Agilent Technologies, Santa Clara, USA), small RNA-Seq was performed in 50 cycles of single-end sequencing using the HiSeq2500 (Illumina Inc., San Diego, USA).
Data analysis
Small RNA-Seq data were processed as described previously [Citation6]. In summary, FastQC (version 0.11.5) [Citation9] was used to evaluate sequence quality and length distribution. Using Btrim, adaptor sequences were trimmed [Citation10], and all reads lacking adaptors were discarded. Additionally, reads shorter than 16 nucleotides in length were excluded [Citation11]. Reads that mapped to sequences of ribosomal RNA (rRNA) and transfer RNA (tRNA) obtained from RNAcentral were eliminated from the data set [Citation12]. The remaining reads were aligned to miRNA sequences in the most recent version (22) of miRBase [Citation13] and subsequently to small nucleolar RNA (snoRNA) and small nuclear RNA (snRNA) sequences from RNAcentral. Mapping was accomplished with Bowtie [Citation14] and the “best” alignment algorithm, allowing one mismatch for alignment to both RNAcentral and miRBase. Subsequently, DGE analyses were performed using the Bioconductor package DESeq2 (version 1.22.1) [Citation15] for R (version 3.5.3) with the included normalisation strategy based on median ratios of mean miRNA expression and the Benjamini–Hochberg method to correct for false discovery. Setting a mean expression of ≥ 50 reads (baseMean), a log2 fold change (log2FC) |log2FC| ≥ 1 and adjusted p-value (padj) ≤ 0.05 as thresholds, no differentially expressed miRNAs were detected. To identify slightly regulated miRNAs, results from DGE analyses were filtered with less stringent criteria (baseMean ≥ 50, |log2FC| ≥ 0.5, padj ≤ 0.1).
Results were tested for normal distribution using the Shapiro-Wilk test. Data that were not normally distributed are reported as median and quartiles (Q25, Q75) and were compared using the non-parametric Mann Whitney U test. Normally distributed data were compared using two-tailed, paired Student’s t-test and are reported as mean ± standard deviation (SD). A p-value ≤ 0.05 was regarded as statistically significant.
RT-qPCR
All miRNAs remaining differentially regulated after filtering the crude cell-free NGS data were tested in the same study population by RT-qPCR as described previously [Citation16]. To identify reference candidates, we evaluated the most stably expressed miRNAs from the small RNA-Seq dataset by geNorm [Citation17] and NormFinder [Citation18]. Four µl RNA were used as starting material for reverse transcription (miRCURY LNA RT Kit, Qiagen, Venlo, The Netherlands). After dilution of cDNA (1:30), qPCR was performed using the miRCURY LNA SYBR Green PCR Kit. Individual miRCURY LNA miRNA PCR Assays (Qiagen, Venlo, The Netherlands) were purchased for miR-223-3p, miR-379-5p, miR-493-5p and miR-542-3p as well as two reference miRNAs (miR-30d-5p and miR-30e-5p, ). qPCR reactions were run on a Rotor-Gene Q thermal cycler (Qiagen, Venlo, The Netherlands). Data were normalised using the geometric mean of the reference miRNAs and quantified relatively with the ∆∆Cq method [Citation19]. Statistical significance was tested using two-tailed, paired Student’s t-test with a significance level of p ≤ 0.05.
Table 2. Mean Cq values for RT-qPCR reference genes and statistical testing for arteriovenous differences using two-tailed, paired student’s t-test.
Nanoparticle tracking analysis
Size and concentration of extracellular particles in crude and purified EV samples were determined by Nanoparticle Tracking Analysis (NTA, ZetaView PMX 110, Particle Metrix, Meerbusch, Germany). The optical layout of this device is a 90 ° laser scattering video microscope equipped with a digital camera (640 x 480 px) and a 520 nm diode laser. Two cycles of videos were recorded, each by scanning 11 distinct positions in the cell cross section applying at a frame rate of 30 fps. The temperature was adapted to 21°C for all measurements. Settings were optimised by adjusting the minimum brightness to 20, the shutter to 70 and the sensitivity to 85%. Post-acquisition parameters were set to min size 5 and max size 1000. All samples were diluted to an appropriate concentration for particle measurements in sterile-filtered DPBS. Videos were analysed with the ZetaView 8.04.02 software, tracking at least 500 particles per sample. At maximum three positions per sample were excluded from analysis. Original particle concentrations per ml serum were calculated as described elsewhere [Citation20]. Statistical significance was tested using two-tailed, paired Student’s t-test with a significance level of p ≤ 0.05.
Transmission electron microscopy
Two µl of crude and purified EV samples were diluted 1:5 in sterile-filtered DPBS and adsorbed for 20 min onto formvar/carbon-coated 200 mesh nickel grids (Electron Microscopy Sciences, Hatfield, USA). Grids were fixed with 2 % paraformaldehyde for 20 min, washed in sterile-filtered DPBS and fixed with 1% glutaraldehyde for 5 min. Following washing in ultrapure water, negative staining was performed in 0.2 µm filtered 4% uranyl acetate (UA; Sigma-Aldrich, St. Louis, USA) for 5 min. Grids were embedded in 0.4% UA/1.8% methyl cellulose for 10 min in the dark and air-dried. Particle morphology was illustrated by Transmission Electron Microscopy (TEM) using a Zeiss EM900 (Carl Zeiss Microscopy GmbH, Jena, Germany) with a wide-angle dual speed 2KCCD camera at 80 kV.
Western blot analysis
To assess potential differences in EV marker expression, crude EVs were precipitated from arterial and venous sera and purified by SEC as described above. Resulting pellets were subsequently lysed on ice in 30 µl 1x RIPA buffer (Abcam, Cambridge, UK) containing protease inhibitors (cOmplete Mini Protease Inhibitor Cocktail, Roche, Basel, Switzerland) for 15 min. Half the lysate was used for reducing and non-reducing SDS-PAGE, respectively. To enhance the dissolution of EVs, samples were sonicated using an ultrasonic bath three times for 1 min each. Immunoblotting was performed under reducing conditions for syntenin, alix, calnexin (CNX), apolipoprotein A1 (ApoA1) and serum albumin and non-reducing conditions for CD63 and CD81. Lysates were either heated for 10 min at 70°C in reducing Laemmli buffer (Bio-Rad, Hercules, USA) containing β-Mercaptoethanol (Sigma-Aldrich, St. Louis, USA), or incubated for 20 min at RT in non-reducing Laemmli buffer (Bio-Rad, Hercules, USA). After separation on NuPAGE 4–12% Bis-Tris Gels (Invitrogen, Carlsbad, USA), proteins were transferred to 0.45 µm nitrocellulose membranes (GE Healthcare Life Sciences, Chicago, USA). Membranes were blocked with 1% non-fat milk powder in phosphate buffered saline with tween for 1 h at RT and incubated with primary antibodies at 4°C overnight. After triplicate washing with blocking buffer, appropriate horseradish peroxidase coupled secondary antibodies were added to the membranes for 1 h at RT. Following another three washing steps, blots were imaged using the Clarity Western ECL Blotting Substrate Kit (Bio-Rad, Hercules, USA). Primary antibodies were purchased from Abcam (rabbit anti-Syntenin clone EPR8102, 1:5,000, ab57113, 1:250; mouse anti-CD63, clone TS63, ab59479, 1:500; rabbit anti-ALIX clone EPR15314-33, ab186728, 1:1000; mouse anti-CD81, clone M38, ab79559, 1:1000; rabbit anti-ApoA1, clone EP1368Y, ab52945, 1:1000; mouse anti-Human Serum Albumin, clone 1A9, ab37989, 1:2000, Cambridge, UK) and Biomol (goat anti-Calnexin, WA-AF1179a, 1:2,500, Hamburg, Germany). Secondary antibodies were obtained from Abcam (goat anti-Mouse HRP, ab97040, 1:10,000, goat anti-Rabbit, ab97080, 1:10,000, rabbit anti-Goat HRP, ab97105, 1:10,000, Cambridge, UK). HEK293 cell lysate (OriGene, LY500001, Rockville, USA, 10 µg), recombinant human ApoA1 (Abcam, ab50239, Cambridge, UK, 50 ng), and HepG2 cell lysate (Abcam, ab7900, Cambridge, UK, 30 µg) were used as positive controls.
Ethics approval and consent to participate
Approval of the study was granted by the Ethics Committee of the Medical Faculty of the Ludwig-Maximilians-University of Munich under Protocol #551-14. All samples from this study were anonymised during analyses. The study was conducted in accordance with approved guidelines and written informed consent for publication of blinded individual person’s data was obtained from each participant.
Results
RNA profiles and sequencing library composition of arterial and venous samples are highly similar
Using capillary electrophoresis to characterise crude cell-free and EV RNA profiles, major differences in RNA quantities between individual patients, but not arterial and venous specimens, were revealed. The median amount of total RNA in crude EVs precipitated from 1 ml serum was 16.32 (10.58–29.95) ng for arterial specimens and 11.95 (9.54–26.2) ng for venous ones, and there was no statistically significant difference between the groups (p = 0.61). In EVs additionally purified by SEC, the median yield was 2.01 (1.40–2.78) ng and 1.53 (0.95–3.14) ng for arterial and venous EVs, respectively. RNA yields from arterial and venous EVs were not significantly different (p = 0.53).
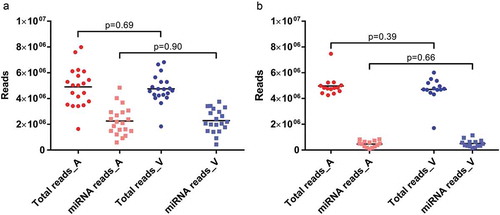
As evidenced by high Phred scores, technical sequencing quality was excellent for all arterial and venous libraries. Phred scores were 38.06 (29.38–38.97) for arterial and 38.02 (28.56–38.98) for venous crude cell-free samples, respectively. In the experiments using additionally purified EVs, Phred scores were 39.12 (39.06–39.15) for arterial EVs and 39.12 (39.02–39.15) for venous EVs. For crude cell-free samples, library sizes as well as proportions of miRNA reads were very similar for specimens from both sampling sites (). Arteriovenous differences were not statistically different for either library sizes (p = 0.69) or number of mapped miRNAs (p = 0.90). When comparing library sizes of crude and purified samples, there were no significant differences for arterial (p = 0.88) or venous (p = 0.89) samples. With the caveat that different RNA isolation kits were used for crude and purified EVs, the latter yielded significantly lower numbers of miRNA reads for both arterial (p = 1.14E-6) and venous (p = 4.72E-8) specimens (). Within purified EVs, neither library sizes (p = 0.39) nor miRNA reads (p = 0.66) were significantly different between arterial and venous samples.
Figure 1. Library sizes (dots) and mapped miRNA reads (squares) for arterial (red) and venous (blue) crude cell-free samples (a) and samples additionally purified by SEC (b). All data are absolute numbers of reads. Lines indicate mean per-group read counts.
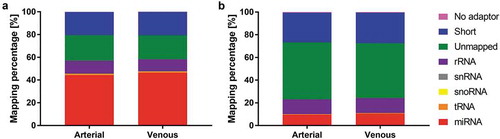
These apparently sample type-specific differences were further substantiated in the detailed mapping statistics (). Purified EVs presented lower frequencies of miRNA mapping and an increased share of reads mapping to rRNA and reads that did not align to any of the major small RNA classes (miRNA, tRNA, snoRNA, snRNA). Relative miRNA frequencies were 44.20 ± 9.96% (arterial crude cell-free samples), 46.39 ± 11.46% (venous crude cell-free samples), 9.51 ± 5.03% (arterial purified EVs) and 10.48 ± 4.55% (venous purified EVs). There were no apparent arteriovenous differences in small RNA mapping for crude cell-free () or purified () samples.
Figure 2. Mapping distribution for crude cell-free samples (a) and samples additionally purified by SEC (b). Statistics of reads mapped to major classes of non-coding RNAs. Read counts are visualised as relative frequencies of total library sizes. Mapping rates for miRNAs were 44.20 ± 9.96% (arterial crude samples), 46.39 ± 11.46% (venous crude samples), 9.51 ± 5.03% (arterial purified EVs) and 10.48 ± 4.55% (venous purified EVs).
Arterial and venous miRNA profiles overlap significantly in crude and purified samples
Overall miRNA expression was first assessed in exploratory data analysis. In both sample types, arterial and venous miRNA profiles correlated extremely well (). Coefficients of determination for all detected miRNAs were 0.9923 and 0.9992 in crude () and purified () samples, respectively. The same stringent correlation was observed for miRNAs with lower expression levels (< 1E4 reads) in both crude (0.9948, ) and purified (0.9943, ) samples.
Figure 3. Correlation of arterial and venous miRNA expression in crude cell-free samples for all miRNAs (R2 = 0.9923, a) and miRNAs with a mean expression < 1E4 reads (R2 = 0.9948, b). Similarly, in samples purified by SEC, correlation of arterial and venous miRNA expression was extremely high for all miRNAs (R2 = 0.9992, c) and miRNAs with a mean expression < 1E4 reads (R2 = 0.9943, d). All data are mean DESeq2-normalised read counts for arterial and venous samples (n = 20 for crude and n = 14 for purified samples, respectively).
Unsupervised clustering of miRNA expression further highlighted similarities between arterial and venous samples. As visualised by principal component analysis ( and ), expression profiles in arterial and venous specimens overlapped considerably for both crude cell-free samples and purified EVs. In hierarchical clustering analysis, arterial and venous samples did not cluster systematically. While crude EVs clustered by patient ID rather than sampling site, this trend was less pronounced for additionally purified samples ( and ), still indicating that individual person-to-person variation might be more pronounced than the variability introduced by sampling arterial or venous blood. This hypothesis was further strengthened as the variability of highly expressed miRNAs in arterial and venous samples within patients was generally lower than their variability in arterial and venous samples across patients for both crude cell-free samples and purified EVs ().
Figure 4. Unsupervised clustering of miRNA expression in crude (top panel) and SEC-purified (bottom panel) samples. Samples are colour-coded in red (arterial) and blue (venous). Patients are displayed by individual symbols. In principal component analysis, arterial and venous expression profiles of crude (a) and purified (c) samples displayed significant overlap. In hierarchical clustering, individual specimens in crude samples generally clustered by patient ID rather than sampling site (b), while purified EVs clustered by patient ID to a lower degree (d).
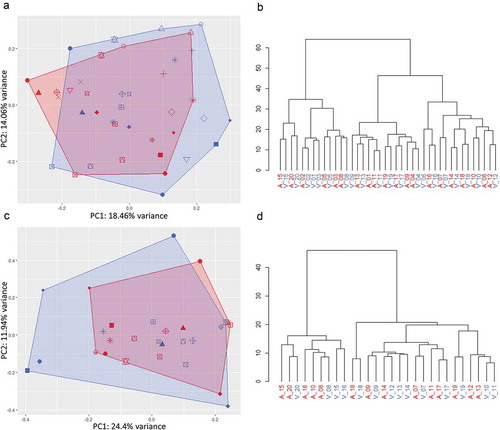
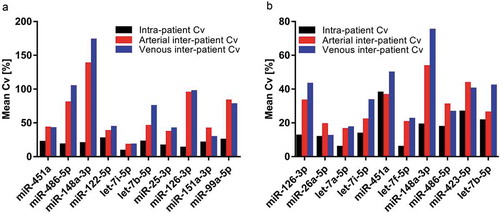
Figure 5. Variability of the top ten most abundant miRNAs within and across patients for crude cell-free samples (a) and additionally purified samples (b). Black bars: Mean intra-patient coefficient of variation (Cv) of arterial and venous samples. Red and blue bars: Mean Cv of all arterial and venous samples across patients, respectively.
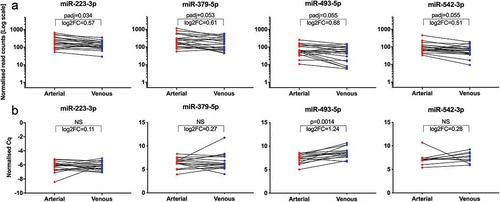
Applying our standard stringent DGE filtering criteria (baseMean ≥ 50, |log2FC| ≥ 1 and padj ≤ 0.05) to expression profiles in crude cell-free samples, no significantly regulated miRNAs were detected. Only with less stringent filtering criteria (baseMean ≥ 50, |log2FC| ≥ 0.5, padj ≤ 0.1) could we identify a subset of four miRNAs (miR-223-3p, miR-379-5p, miR-493-5p, miR-542-3p) to be differentially expressed (). Although all four miRNAs displayed an overall trend towards higher arterial expression, contradictory higher venous expression was detected in individual specimens. With an upregulation of 1.60-fold in arterial samples, miR-493-5p displayed the largest regulation of all miRNAs. Out of the four upregulated miRNAs, only miR-493-5p was significantly (p = 1.4E-3) higher expressed in arterial specimens (fold change 2.37) in the subsequent RT-qPCR validation (). In SEC-purified EVs, no miRNAs with significant arteriovenous differences were detected using either set of filtering criteria detailed above. Additionally, none of the other non-coding RNA classes assessed in this study (rRNA, snRNA, snoRNA, tRNA) displayed any significant expression differences between samples from arterial and venous sera for either crude or purified EVs. In summary, patient-specific inter-sample variation was high, while overall differences in arterial versus venous samples were marginal. This implies that in our cohort, small RNA-Seq data from both crude and purified EVs were not able to distinguish between arterial and venous serum samples.
Figure 6. Significantly regulated miRNAs from NGS and validation by RT-qPCR. Illustration of four miRNAs differentially regulated between arterial and venous crude samples from NGS (a). Normalised read counts were plotted for each paired arterial and venous specimen. Individual changes in miRNA expression are indicated by lines. All miRNAs displayed a slight overall tendency of higher expression in arterial samples, albeit with reversed trends for some patients. padj: adjusted p-value; log2FC: log2 fold change. Illustration of normalised Cq values from the subsequent RT-qPCR validation (b). Only miR-493-5p showed significantly higher expression in arterial samples. Specimens which did not proper amplify during RT-qPCR were removed from the data set, and only matched arterial and venous samples were included for analyses. miR-223-3p, n = 19; miR-379-5p, n = 17; miR-493-5p, n = 15; miR-542-3p, n = 10; NS: not significant.
Extracellular particles and EVs in arterial and venous sera display eminently comparable physiochemical characteristics
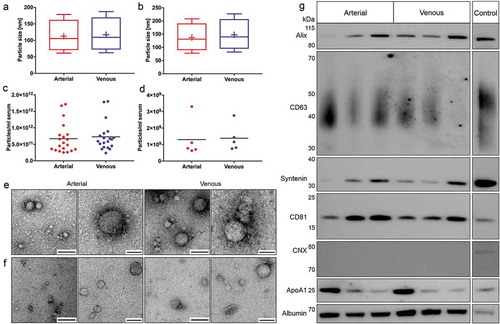
The concentration, size and morphology of extracellular particles in crude preparations and purified EVs were assessed to investigate potential arteriovenous differences. Nanoparticle tracking analysis revealed that arterial crude and purified EVs were marginally smaller, albeit with size differences bordering on the margin of error for NTA technologies [Citation21]. Extracellular particles in crude arterial and venous samples had mean diameters of 113.20 ± 8.30 nm and 117.15 ± 6.20 nm and median diameters of 97.85 ± 8.02 nm and 101.27 ± 6.20 nm, respectively (). Particle concentrations were 6.71E11 ± 4.53E11 particles/ml serum in arterial and 7.27E11 ± 4.33E11 particles/ml serum in venous crude specimens (). Purified EVs had mean diameters of 138.54 ± 10.18 nm (arterial) and 147.54 ± 6.84 nm (venous) and median diameters of 123.78 ± 9.72 nm (arterial) and 132.00 ± 6.22 nm (venous, ). NTA of purified EVs revealed overall lower particle concentrations compared to crude preparations. Arterial and venous purified EVs had particle concentrations of 1.30E+09 ± 1.13E+09 particles/ml serum and 1.38E+09 ± 8.18E+08 particles/ml serum, respectively (). Using electron microscopy, we detected EV-like particles with diameters of approximately 100 nm in arterial and venous samples for both isolation protocols ( and ). SEC-purified samples were analysed by immunoblotting to substantiate potential arteriovenous differences in EV protein markers (). While the commonly used EV protein markers alix, CD63, syntenin and CD81 were equally detected in arterial and venous samples, the negative marker CNX was not detected, indicating the absence of contamination with cellular fragments. However, contaminations of by SEC-purified samples with high-density lipoproteins (ApoA1) and highly abundant serum proteins (albumin) were present to the same extent in EVs isolated from arterial and venous blood. Since SDS-PAGE input was normalised to serum volume (instead of EV protein amount), differently pronounced protein bands were detected due to varying levels of marker proteins across individual patients. Our data indicate that specimens from arterial and venous sera have highly similar biological characteristics on both the level of overall extracellular particles and the level of purified EVs.
Figure 7. Biological characterisation of crude and purified EVs. Characterisation of particle size distributions by NTA in crude (n = 20, a) and purified samples (n = 5, b). Data are displayed as boxplots from the 10th to the 90th percentile, showing median (line) and mean (+) particle diameters. Median diameters of crude EVs from arterial and venous serum did not differ significantly (p = 0.056), while mean diameters of arterial particles were significantly smaller (p = 0.040). Particle diameters in additionally purified samples were also significantly smaller for arterial samples (median: p = 0.034, mean: p = 0.031). Depiction of particle concentrations/ml serum by NTA in crude (n = 20, c) and purified samples (n = 5, d). No significant changes in particle numbers could be detected for arterial and venous crude (p = 0.059) and purified EVs (p = 0.650). Lines indicate mean. Illustration of spherical EV-like extracellular particles with a size of about 100 nm by TEM for crude (e) and purified samples (f). Matched specimens from n = 3 individuals were imaged for both isolation protocols. Scale bar 1st and 3rd column: 250 nm; Scale bar 2nd and 4th column: 100 nm. Immunoblot profiling of SEC-purified samples (g). Arterial and venous samples were positive for EV-specific protein markers (alix, CD63, syntenin and CD81). CNX could not be detected in any of the samples. All samples were positive for non-EV-enriched proteins ApoA1 and serum albumin. Results are depicted for three paired arterial and venous biological replicates. HEK293 cell lysate was used as a positive control for alix, CD63, syntenin, CD81 and CNX. Recombinant ApoA1 and HepG2 cell lysate served as a positive control for ApoA1 and serum albumin, respectively.
Discussion
As central players in liquid biopsies, EVs hold great promise for diagnosis, prognosis and therapeutic guidance. However, the isolation, study and characterisation of EVs is often challenging, as they are small-sized, and only limited quantities can usually be obtained from patient-derived samples [Citation22]. To avoid the influence of confounding variables on blood miRNA profiles, collection tubes, preparation, handling and storage of samples should be standardised [Citation23]. The formation of platelet-derived EVs was shown to occur as a response to platelet activation [Citation24] induced by surface contact, pressure and high shear stress [Citation25,Citation26] during blood sampling. Therefore, it is recommended to standardise needle bore size, diameter, length of the sampling system and sampling site [Citation26]. Since a significant impact on miRNA expression profiles has been shown for different EV isolation methods [Citation6] and sequencing methodologies [Citation27], these parameters should also be considered, especially when combining multiple datasets. While cell-free miRNAs that robustly indicate disease states are still valuable biomarker candidates regardless of their association with EVs, and impurities in EV preparations were shown to have little impact on downstream nucleic acid quantification [Citation28], specific diseases and clinical questions might require additional validation using more EV-specific isolation methods such as density gradient centrifugation. As demonstrated previously, serum EV precipitates contain a significant amount of cell-free proteins, which might include well-known carriers of circulating miRNAs such as argonaute 2 or lipoprotein particles [Citation29–Citation31]. We therefore characterised miRNA profiles in both crude and additionally purified samples to assess potential carrier-specific arteriovenous differences. As some lipoproteins overlap in size with EVs [Citation32], samples purified by SEC still contain a certain amount of contamination [Citation33], which was also shown in the current study. Despite previously reported variables that can influence the diagnostic potential of EVs, only minor differences between paired arterial and venous miRNA profiles were observed in samples with lower and higher purity, and extracellular particles from both compartments appeared to have highly similar biological properties.
Since blood flows from pulmonary to systemic circulation, it is conceivable that arterial blood is enriched with biomolecules from lung cells or the left ventricle when compared to venous blood. In our study, however, we only found a minor subset of slightly differentially expressed miRNAs, while the majority of arterial miRNAs matched the expression levels in venous samples. The fact that different RNA extraction kits were used for NGS and RT-qPCR in the experiments on crude samples might have resulted in divergent miRNA recovery [Citation34], and therefore could have affected results for the technical validation of candidate miRNAs.
As light scattering-based methods of EV quantification are prone to detecting nonvesicular particles such as lipoproteins, which outnumber circulating EVs by orders of magnitude, they most likely overestimate EV concentrations [Citation32]. In accordance with previous findings by our group [Citation6], the reduced frequencies of miRNA mapping in SEC-EVs observed in this study might therefore be due to the removal of nonvesicular miRNA carriers or larger EVs by the additional purification step. While it seems likely that lower miRNA yields in purified samples stem from the fact that the less specific precipitation method also captured miRNAs not associated with EVs, it needs to be mentioned that different RNA extraction kits were used in experiments on crude preparations and SEC-EVs. Technical biases brought about by the respective extraction chemistry might therefore have partly contributed to the quantitative miRNA differences between the two sample types used in this study.
Emphasis should also be put on the fact that we only studied serum, but not plasma samples. As a by-product of coagulation, it has been shown that serum RNA concentrations might be higher, and that sera are enriched in cell-free platelet-derived miRNAs when compared to the corresponding plasma samples [Citation35]. Therefore, performing the same experiments using platelet-free plasma might result in arterial and venous differences, which possibly have been obscured due to high platelet-derived RNA content in the serum samples from our study.
Another limitation of our study results from the fact that we only studied patients with severe heart disease, and this conclusion may not be applicable to all individuals and all disorders. Additional arteriovenous comparisons need to be performed in patients showing specific pathologies (e.g. patients with severe pulmonary disease). Nevertheless, it seems feasible to use either arterial or venous serum in the majority of miRNA-based EV biomarker studies with comparable results.
Acknowledgments
The authors thank Franz Jansen for excellent technical assistance during EV isolation and RNA extraction.
Disclosure statement
The authors confirm that there are no potential conflicts of interest.
Additional information
Funding
Related Research Data
References
- Shah R, Patel T, Freedman JE. Circulating extracellular vesicles in human disease. N Engl J Med. 2018;379:958–12.
- Mokken FC, van der Waart FJM, Henny CP, et al. Differences in peripheral arterial and venous hemorheologic parameters. Ann Hematol. 1996;73:135–137.
- Bai L, Ma J, Wang Y, et al. MicroRNAomes of porcine arterial and venous blood. J Anim Vet Adv. 2014;13:21–27.
- Xu W, Zhou Y, Xu G, et al. Transcriptome analysis reveals non-identical microRNA profiles between arterial and venous plasma. Oncotarget. 2017;8:28471–28480.
- Kelly E, Owen C, Abraham A, et al. Comparison of arterial and venous blood biomarker levels in chronic obstructive pulmonary disease. F1000 Research. 2013;2:114.
- Buschmann D, Kirchner B, Hermann S, et al. Evaluation of serum extracellular vesicle isolation methods for profiling miRNAs by next-generation sequencing. J Extracell Vesicles. 2018;7:1481321.
- Thery C, Witwer KW, Aikawa E, et al. Minimal information for studies of extracellular vesicles 2018 (MISEV2018): a position statement of the international society for extracellular vesicles and update of the MISEV2014 guidelines. J Extracell Vesicles. 2018;7:1535750. Epub 2019/ 01/15.
- Consortium E-T, Van Deun J, Mestdagh P, et al. EV-TRACK: transparent reporting and centralizing knowledge in extracellular vesicle research. Nat Methods. 2017;14:228.
- Andrews S. FastQC: a quality control tool for high throughput sequence data. 2010. Available online at: http://www.bioinformatics.babraham.ac.uk/projects/fastqc
- Kong Y. Btrim: a fast, lightweight adapter and quality trimming program for next-generation sequencing technologies. Genomics. 2011;98:152–153.
- Buschmann D, Haberberger A, Kirchner B, et al. Toward reliable biomarker signatures in the age of liquid biopsies - how to standardize the small RNA-Seq workflow. Nucleic Acids Res. 2016;44:5995–6018.
- RN C, Petrov AI, Kay SJE, et al. RNAcentral: an international database of ncRNA sequences. Nucleic Acids Res. 2015;43:D123–D9.
- Kozomara A, Griffiths-Jones S. miRBase: annotating high confidence microRNAs using deep sequencing data. Nucleic Acids Res. 2014;42:D68–D73.
- Langmead B, Trapnell C, Pop M, et al. Ultrafast and memory-efficient alignment of short DNA sequences to the human genome. Genome Biol. 2009;10:R25.
- Love MI, Huber W, Anders S. Moderated estimation of fold change and dispersion for RNA-seq data with DESeq2. Genome Biol. 2014;15:550.
- Reithmair M, Buschmann D, Marte M, et al. Cellular and extracellular miRNAs are blood-compartment-specific diagnostic targets in sepsis. J Cell Mol Med. 2017;21:2403–2411.
- Vandesompele J, De Preter K, Pattyn F, et al. Accurate normalization of real-time quantitative RT-PCR data by geometric averaging of multiple internal control genes. Genome Biol. 2002;3:Research0034.
- Andersen C, Jensen J, TF O. Normalization of real-time quantitative reverse transcription-PCR data: a model-based variance estimation approach to identify genes suited for normalization, applied to bladder and colon cancer data sets. Cancer Res. 2004;64:5245–5250.
- Livak K, Schmittgen T. Analysis of relative gene expression data using real-time quantitative PCR and the 2(-Delta Delta C(T)) method. Methods. 2001;25:402–408.
- Eitan E, Green J, Bodogai M, et al. Age-related changes in plasma extracellular vesicle characteristics and internalization by leukocytes. Sci Rep. 2017;7:1342.
- Bachurski D, Schuldner M, Nguyen PH, et al. Extracellular vesicle measurements with nanoparticle tracking analysis - an accuracy and repeatability comparison between NanoSight NS300 and ZetaView. J Extracell Vesicles. 2019;8: 1596016. Epub 2019/ 04/17.
- Ramirez MI, Amorim MG, Gadelha C, et al. Technical challenges of working with extracellular vesicles. Nanoscale. 2018;10:881–906.
- Glinge C, Clauss S, Boddum K, et al. Stability of circulating blood-based MicroRNAs - Pre-Analytic methodological considerations. PLoS One. 2017;12:e0167969.
- Cauwenberghs S, Feijge MA, Harper AG, et al. Shedding of procoagulant microparticles from unstimulated platelets by integrin-mediated destabilization of actin cytoskeleton. FEBS Lett. 2006;580:5313–5320.
- Reininger AJ, Heijnen HF, Schumann H, et al. Mechanism of platelet adhesion to von Willebrand factor and microparticle formation under high shear stress. Blood. 2006;107:3537–3545.
- Lance MD, Henskens YM, Nelemans P, et al. Do blood collection methods influence whole-blood platelet function analysis? Platelets. 2013;24:275–281.
- Coenen-Stass AML, Magen I, Brooks T, et al. Evaluation of methodologies for microRNA biomarker detection by next generation sequencing. RNA Biol. 2018;15: 1133–1145. Epub 2018/ 09/19.
- Quek C, Bellingham SA, Jung CH, et al. Defining the purity of exosomes required for diagnostic profiling of small RNA suitable for biomarker discovery. RNA Biol. 2017;14:245–258.
- Arroyo JD, Chevillet JR, Kroh EM, et al. Argonaute2 complexes carry a population of circulating microRNAs independent of vesicles in human plasma. Proc Natl Acad Sci U S A. 2011;108: 5003–5008. Epub 2011/ 03/09.
- Vickers KC, Palmisano BT, Shoucri BM, et al. MicroRNAs are transported in plasma and delivered to recipient cells by high-density lipoproteins. Nat Cell Biol. 2011;13: 423–433. Epub 2011/ 03/23.
- Turchinovich A, Weiz L, Langheinz A, et al. Characterization of extracellular circulating microRNA. Nucleic Acids Res. 2011;39:7223–7233.
- Sodar BW, Kittel A, Paloczi K, et al. Low-density lipoprotein mimics blood plasma-derived exosomes and microvesicles during isolation and detection. Sci Rep. 2016;6:24316. Epub 2016/ 04/19.
- Karimi N, Cvjetkovic A, Jang SC, et al. Detailed analysis of the plasma extracellular vesicle proteome after separation from lipoproteins. Cell Mol Life Sci. 2018;75: 2873–2886. Epub 2018/ 02/15.
- Tan GW, Khoo AS, Tan LP. Evaluation of extraction kits and RT-qPCR systems adapted to high-throughput platform for circulating miRNAs. Sci Rep. 2015;5:9430.
- Wang K, Yuan Y, Cho JH, et al. Comparing the MicroRNA spectrum between serum and plasma. PLoS One. 2012;7:e41561.