
ABSTRACT
Extracellular vesicles (EVs) have great potential as a source for clinically relevant biomarkers since they can be readily isolated from biofluids and carry microRNA (miRNA), mRNA, and proteins that can reflect disease status. However, the biological and technical variability of EV content is unknown making comparisons between healthy subjects and patients difficult to interpret. In this study, we sought to establish a laboratory and bioinformatics analysis pipeline to analyse the small RNA content within EVs from patient serum that could serve as biomarkers and to assess the biological and technical variability of EV RNA content in healthy individuals. We sequenced EV small RNA from multiple individuals (biological replicates) and sequenced multiple replicates per individual (technical replicates) using the Illumina Truseq protocol. We observed that the replicates of samples clustered by subject indicating that the biological variability (~95%) was greater than the technical variability (~0.50%). We observed that ~30% of the sequencing reads were miRNAs. We evaluated the technical parameters of sequencing by spiking the EV RNA preparation with a mix of synthetic small RNA and demonstrated a disconnect between input concentration of the spike-in RNA and sequencing read frequencies indicating that bias was introduced during library preparation. To determine whether there are differences between library preparation platforms, we compared the Truseq with the Nextflex protocol that had been designed to reduce bias in library preparation. While both methods were technically robust, the Nextflex protocol reduced the bias and exhibited a linear range across input concentrations of the synthetic spike-ins. Altogether, our results indicate that technical variability is much smaller than biological variability supporting the use of EV small RNAs as potential biomarkers. Our findings also indicate that the choice of library preparation method leads to artificial differences in the datasets generated invalidating the comparability of sequencing data across library preparation platforms.
Introduction
EVs are produced by most cells in the body and are increasingly appreciated as important players in cell-cell communication [1]. They are small (<1 um), membrane-bound structures that are capable of horizontally transferring biologically active molecules such as DNA, RNA, lipids and proteins [2]. EVs have been isolated from diverse body fluids including serum and plasma, urine, cerebrospinal fluid, epididymal fluid, amniotic fluid, malignant and pleural effusions of ascites, bronchoalveolar lavage fluid, synovial fluid and breast milk [3]. Although a wide variety of molecules are encapsulated by EVs, microRNAs (miRNAs) have attracted the most attention because they regulate gene expression [4] and some miRNAs are enriched in EVs relative to their parent cells [5].
There are several types of EVs. They include microvesicles and exosomes that are best understood and distinguished by size and mechanism of biogenesis [6]. Exosomes are formed in clusters of intra-luminal vesicles, collectively called a multivesicular body, that fuses with the plasma membrane to release the vesicles extracellularly [7]. Additionally, exosome biogenesis results in the enrichment of specific molecules when compared to the cell of origin, and although the mechanism is unknown, this produces a distinct molecular signature [8]. In contrast, microvesicles are formed by budding from the plasma membrane and have a broad distribution of size. Their content has not been well characterized [9].
The clinical utility of using EVs as biomarkers is driven by a number of factors: 1) the ability to profile EVs in circulating biofluids [10], 2) their biogenesis that results in the presence of certain molecules that reflect the biological state of the cells of origin [11], and 3) the stability of the molecules within EVs [12]. However, the utility of EVs as biomarkers is hindered by the lack of information about the different populations of EVs present in each biofluid, the variability of their contents within an individual and the quantity and types of RNA cargo contained within each EV. How these factors contribute to the variability between individuals (biological variability) is unknown, weakening confidence in data interpretation. This is compounded by a poor understanding of the technical variability produced by the chosen methods used. Thus, a better understanding of the biological and technical variability inherent in measuring miRNA levels in serum EVs is needed for confidence in the use of EV miRNA as a biomarker.
The primary objective of this study was to evaluate both the biological and technical variability of EV RNA isolated from the serum of healthy donors. Biological variability was tested utilizing serum from five healthy donors, and technical variability was assessed by preparing RNA and individual libraries across five technical replicates for each biological replicate. Additionally, the potential technical bias introduced by RNA isolation and library preparation was assessed by using synthetic spike-ins. We show here that biological variability greatly exceeds the technical variability. Therefore, differences between diseased and healthy groups can be attributed to biological mechanisms. We also show that some methods of library preparation result in significant biases in miRNA identification and therefore that the library preparation method is a critical consideration in biomarker discovery.
Results
Characterization of extracellular vesicles
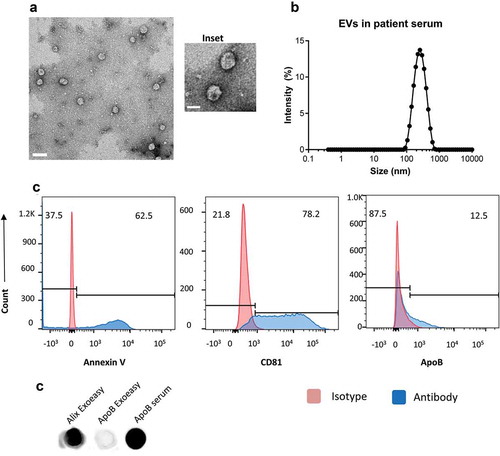
We isolated EVs from 1 mL of serum from five healthy donors using the Exoeasy exosome isolation kit. The EVs were resuspended in PBS and imaged by transmission electron microscopy to reveal intact circular particles that were generally smaller than 200nm () and inset). The size distribution was assessed by dynamic light scattering and showed a peak around ~200nm ()). The vesicles were analysed by flow cytometry for the presence of the tetraspanins CD63, CD81 and CD9 and Annexin V ()). For flow cytometry, EVs were attached to beads for analysis. We observed the presence of both Annexin V and CD81 by flow cytometry but were unable to detect the presence of CD9 or CD63. We were able to detect the presence of ApoB by flow cytometry on a small percentage of beads indicating a low frequency of lipoprotein complexes ()). We also confirmed the expression of EV marker Alix and ApoB expression on isolated EV’s and saw that Alix was present in the isolates while ApoB was absent ()). We used serum as a positive control for ApoB. These data suggest that the isolated particles consist of EVs with exosome-like characteristics.
Figure 1. Serum extracellular vesicles isolated from healthy volunteers are a mixture of exosomes and other microvesicles.
(a) A representative transmission electron micrograph (TEM) of EVs from patient serum is shown (scale bar = 200nm), an inset shows a zoomed in view of particles (scale bar = 100 nm). (b) Dynamic light scattering of serum EVs shows that the average size of isolated particles to be around 200nm. (c) Flow cytometric analyses of beads incubated with EVs shows the detection of Annexin V, CD81 and ApoB with fluorochrome-labelled primary antibodies. Annexin V, CD81 and ApoB are shown in the histograms in blue while the isotype controls are depicted in red. (d) Dot Blot showing the expression of Alix and ApoB in EV’s isolated from Serum using the ExoEasy protocol. Serum was blotted as a positive control for ApoB.
The overall workflow for the study is outlined in Fig. S2A. For RNA isolation we compared the Trizol LS to a column-based isolation method (Qiagen exoRNeasy kit) and found that both methods yielded equivalent amounts of RNA (Fig. S1A, p-value = 0.90). The exoRNeasy kit was used throughout the remainder of this study because of its ease of use. A representative electropherogram from a patient sample shows the size distribution of RNA obtained using the exoRNeasy kit which indicates that the method yields the expected RNA size distribution profile (Fig. S1B).
Biological variability exceeds technical variability using the truseq small RNA protocol
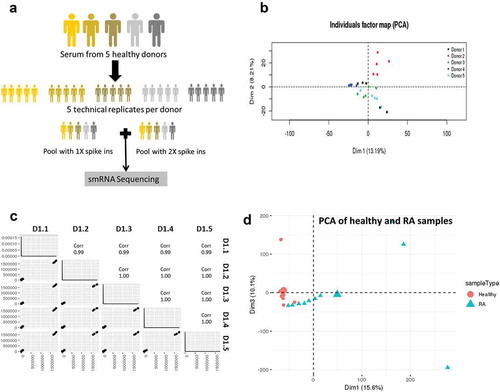
To address the technical and biologic variance of EV small RNA Seq, we performed small RNA Seq on EVs isolated from five healthy donors to assess biological variation and on five replicates of each donor to assess technical variability ()). In addition, we added a pool of 52 synthetic spike-ins at either 1X or 2X concentration to a pool of the five donors to assess the sensitivity and specificity of the library preparation method.
Figure 2. Biological variability is much greater than technical variability.
(a) Serum from five healthy donors was obtained to assess biological variability, and each donor was replicated five times to assess technical variability. All samples were spiked in with a mix of 52 small RNAs to measure the linearity and reproducibility of Truseq illumina sequencing. (b) Principal component analysis shows that the samples from the five biological replicates for each donor. Each donor is shown as a separate colour. (c) Pairwise scatter plots of the five technical replicates of donor 1 is shown as a measure of technical variance. (d) Principal component analysis showing separation of EV samples from healthy and RA serum.
The EV RNA was used as input for library preparation with the Illumina Truseq small RNA protocol and sequenced using a HiSeq 3000 (Illumina Inc). The raw FastQ reads were checked for quality (Supplementary File 1), aligned to the human genome, read counts were generated per gene locus and normalized to library size for further analysis. The total numbers of reads from all the donors were roughly equal (Figure S2B, p-value = 0.83). Similarly, the total assigned reads from the 1X and 2X were comparable (Figure S2C, p-value = 0.21). The mapping characteristics of this study can be found in Supplementary Table 3.
The source of data variability within the dataset was assessed using principal component analysis. This unsupervised analysis showed that the variability between technical replicates for a given donor was much less than the inter-individual variability ()). This provided evidence that the technical variability was low with respect to the biological variability, resulting in the clusters being formed mainly by the biological variance that comes from individual donors. Technical variance was calculated as (1-R2) *100% where R2 was calculated between all the mapped reads of each pair of technical replicates of a biological donor. Pairwise scatter plots were used to measure the technical variance between replicates of the same donor and we estimated that technical variances within donors averaged 0.25% (0.10–0.50%) () and data not shown). While the inter-individual variance was greater than technical variance, it did not exceed the differences between healthy subjects and patients with rheumatoid arthritis (RA) ()) indicating that this approach could identify differences between healthy and patient populations.
Spike-in analysis reveals a sequencing bias with truseq protocol
The samples spiked with 1X and 2X amounts of synthetic oligonucleotides were used to assess miRNA bias in library preparation ()). Each sample (1X or 2X) was sequenced three times to create a total of six libraries and the average of the three samples per group was used for analysis. The samples with 1X and 2X were identical in all respects except for the concentration of spike-ins. We analysed the number of reads of the 52 spike-ins from the 1x and 2x samples by plotting their known input concentrations to the output reads to assess the integrity of library preparation method. The synthetic spike-ins consist of a mixture of 52 sequences that are supplied at three concentrations: 0.75 femtomole (fmol), 7.5 fmol and 37.5 fmol. We show the correlation between input spike-in concentration and output reads by RNA-Seq for the three replicates of 1X in ). In the absence of a bias, we expected the input spike-in concentration to correlate with the number of output spike-in reads after sequencing (close to the line of best fit shown in blue). However, we observed a very poor correlation between input concentration and output reads (R2 = 0.30) indicating a problem in the methodology ()). Additionally, comparing the 1X to the 2X samples should result in a line with a slope of 2 since each spike-in was added at twice the input concentration in the 2x samples (), dashed black line). But we found that several spike-ins were well above this line of best fit while others were below this line in the output read counts (), solid blue line with slope of 2.72). Thus, there is a methodological bias in the library preparation protocol that results in some spike-ins being overrepresented while others are underrepresented in the sequencing data.
Figure 3. Spike-in analysis reveals the presence of sequencing bias in Truseq protocol.
(a) Comparison of the spike-in input concentrations (known) versus the output from the 1X samples measured in terms of number of reads mapped in the Truseq protocol showing a correlation of 0.30 which implying the presence of a bias in the protocol. (b) Comparison of the samples spiked with 1x and 2X spike-ins shows the number of reads obtained per spike-in. The solid blue line is the line of best fit, while the dashed black line shows the expected line with a slope of 2. Several spike-ins do not align on either line indicating either over or underrepresentation in the output read counts. (c) The follow-up study comprised three donors (previously used) replicated three times each (technical replicates). All nine RNA samples were spiked 1X synthetic miRNA mix and sequenced using either a Truseq small RNA protocol or a Nextflex small RNA protocol to compare which kit reduced the bias observed. (d) Shown is the comparison of the spike-in input concentration versus output reads for the Illumina Truseq (blue) and Bioo Nextflex (red) small RNA kits.
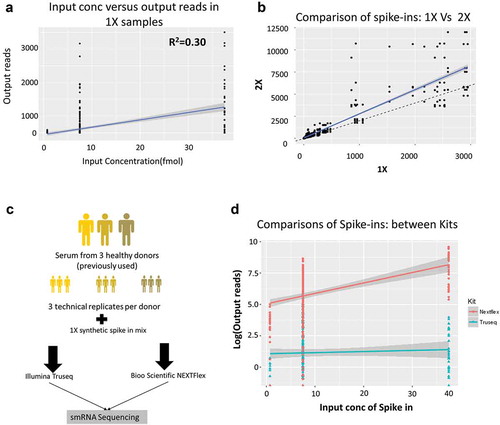
Biases introduced during library preparation predominantly occur at the adapter ligation step [13]. Small RNA library preparation involves ligating adapters directly onto the 3ʹ and 5ʹ ends of the RNA molecule in two separate steps, and each of these ligation steps has been shown to introduce significant bias into library preparation [14]. The Truseq method ligates adapters with fixed ends to the RNA. However, recent studies have shown that having random bases at the ends of the adapters greatly reduces bias in comparison to using nonrandomized adapters. We identified the Nextflex small RNA sequencing kit (Bioo Scientific) as an alternative to the Truseq small RNA protocol (Illumina Inc.) since it used randomized adapters to ligate to the RNA that should reduce ligation bias based on the sequence affinity of ligases. Thus, a follow-up study was conducted on a subset of three of the original donors and consisted of three technical replicates per donor (for a total of nine samples), into which we added 1X of the spike-in mix. Each of the nine samples was then sequenced using either the Illumina Truseq small RNA Protocol or the Bioo Scientific Nextflex protocol for small RNA ()).
The spike-in reads from the second study were extracted from all libraries and compared against the input concentration by protocol and showed that the Nextflex protocol has a linear range across input concentrations with an overall correlation of 0.67 as compared to Truseq’s correlation of 0.33 ()). Additionally, there was a statistically significant difference in the correlations of output reads to input concentrations by a chi-square test (p-value <0.0001) between the Truseq and Nextflex protocols. Thus, the Nextflex protocol yielded results that were a better fit to the introduced spike-in concentrations.
Choice of library preparation impacts the miRNA sequences detected by RNAseq
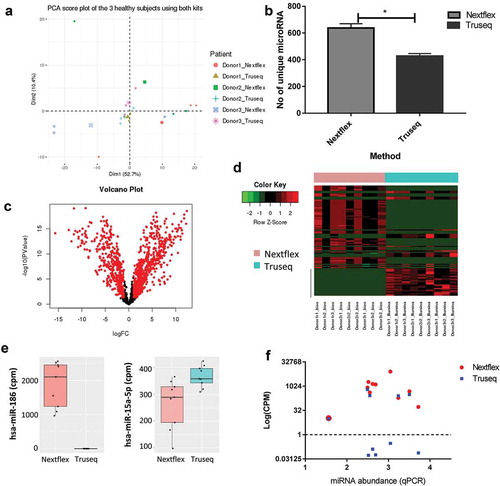
To further evaluate differences between the Truseq and Nextflex library preparation methods we compared the reads generated by each protocol. The quality of the reads generated from each sample was summarized using multiQC (Supplementary file 2) and the mapping characteristics can be accessed in Supplementary Table 3. In order to eliminate a batch effect due to the two libraries being run independently on the sequencer, a batch correction was applied using the R Bioconductor sva package ComBat function [15]. A principal component score plot of the ComBat corrected dataset labelled by donor showed that the samples clustered by donor as expected ()). However, the choice of kit also impacted the clustering as can be seen from the PCA score plot labelled by library preparation method (Fig S3A) indicating that both the biological variance and choice of kit contributed to the variability of the dataset. Furthermore, the total number of mapped reads from the three donors across both kits was comparable (Figure S3B, paired t-test between Truseq and Nextflex for mapped read was not significant with a p-value of 0.15), as was the type of RNA detected by each kit (Fig S3C). Since small RNA sequencing kits are commonly used to study miRNA expression [16], we compared the unique miRNAs mapped by each kit. We found that the Nextflex kit identified about 150 more unique miRNAs compared to the Truseq kit across donors (), p-value = 0.01). However, the Truseq protocol produced a larger percentage of miRNAs than the Nextflex protocol, and this difference was statistically significant (Figure S3D, p-value = 0.003) suggesting that the latter may over-represent certain miRNA sequences and miss others, consistent with the spike-in analysis.
Figure 4. Choice of library preparation impacts the sequencing results obtained by small RNA-Seq.
(a) Principal component analysis shows the biological and technical variability between samples after sequencing with the Truseq and Nextflex kits. The samples were batch corrected by ComBat to account for batch-specific differences and the image are coloured by donor and kit. (b) The number of unique miRNAs detected is higher in the Nextflex kit when compared to the Truseq Kit (p-value = 0.01). (c) Volcano plots of differential gene expression between the Truseq and Nextflex kits are shown. The plots illustrate the log10 Benjamini–Hochberg corrected p-value vs. the log2 change of transcript abundance. Red indicates miRNAs that differ between kits. (d) Heatmap of the top differential expressed genes using the Nextflex and Truseq kits is shown. The horizontal bar on top depicts the samples from each kit, the colour that represents the specific kit is provided in the legend on the left of the figure. (e) Representative box plots are shown of two differentially expressed miRNA that were detected by either the Nextflex or both the Nextflex and Truseq kits. The y-axis shows the counts per million reads of the two miRNAs as detected by library preparation kit (f) Scatter plot measuring miRNA expression by sequencing (measured in log counts per million, coloured by kit) versus quantitative PCR shows that only Nextflex detected all 10 of the genes detected by qPCR. The Pearson correlation for the Nextflex kit was 0.1 against qPCR while the correlation for Truseq versus qPCR was 0.05.
The datasets generated with both the Truseq and Nextflex methods had very little technical variance. Pairwise scatter plots were generated to assess the technical variance between replicates of the same donor. There was high correlation between replicates indicating very low technical variance irrespective of the library preparation method used (S4A and S4B). The average correlation between replicates in the Nextflex kit was 0.94 (Range 0.89–0.99) while the average correlation was 0.95 using the Truseq kit (Range 0.92–1.00) and there were no significant differences in the technical variability between the two kits. (p-value >0.05) Comparisons of the kits were conducted by donor and while there is high correlation of replicates within the same kit (>0.90), between kit correlations were poor, as the correlation coefficients are rarely greater than 0.55 (Fig S5). Thus, data generated by different protocols cannot be directly compared.
We performed differential expression analysis between the reads of all the transcripts obtained by the two library preparation protocols. Since the RNA used as input for both protocols was identical, no significant differences were expected between them in the absence of technical bias. However, differential expression analysis revealed 1075 transcripts that were significantly different between the two protocols (Table S1). A volcano plot of all the differentially expressed genes shows that most of the differences are significantly based on a > twofold change in expression and p value of less than 0.05 (), significant genes are in red), while a heatmap with the top 100 differentially expressed genes shows that the expression levels of these transcripts vary widely ()). Thus, some miRNAs were identified in one library preparation method, while others appeared more abundant in one kit compared to the other ()).
To determine which of the two kits better agreed with expression levels estimated by PCR-based quantitation, we performed quantitative PCR (qPCR) of the 10 differentially expressed miRNA comprising top 5 upregulated and top 5 downregulated miRNA when comparing the Nextflex and Truseq kit output reads (Table S2). The qPCR data were converted to miRNA abundance (2^- [CT (miRNA)-CT (U6)]) and compared to the reads obtained for the same miRNA by both Truseq and Nextflex protocols ()). All the genes had detectable read counts in the Nextflex protocol, but only 5/10 were detectable in Truseq (log (TMM normalized reads)>1). None of the five miRNA molecules that were undetected by the Truseq protocol were of low abundance according to qPCR, consistent with the presence of a methodological bias in the Truseq library preparation method rather than a poorer lower limit of detection. Additionally, the Pearson correlation was calculated between qPCR and each of the library preparation kits. The correlation coefficients were 0.05 and 0.1 for the Truseq and Nextflex kits, respectively. Thus, of the two library preparation methods, the Nextflex method generates data that is more likely to reflect the expression level of miRNAs. The qPCR results did not correlate perfectly with the Nextflex sequencing reads suggesting that while this method reduces ligation bias, it does not eliminate it. This could be because qPCR itself might contain inherent methodological biases and we are comparing data from two different methodologies [17]. However, qPCR data is often used for validating data from NGS platforms and we like others have used it to estimate the output of the library preparation methodologies employed in this study [18].
Discussion
The miRNA content of EVs isolated from body fluids is a potential source of biomarkers of disease progression and response to therapy [19] 20]. One of the most useful methods for discovery of miRNA biomarkers is RNAseq, since it presumably provides an unbiased view of miRNA content. However, there is little understanding of the biological and technical variability in this method. Understanding these sources of variability is essential for the identification of instructive EV miRNA biomarkers. This study was designed to estimate the biological and technical variation in healthy controls. Technical variability is an important parameter to assess in experiments and is inversely proportional to coverage [21]. We ensured that we had sufficient coverage (>30M reads per sample) to estimate the variability of the protocol that was independent of the read depth. Our analysis used EVs isolated from healthy human serum that averaged about 200nm in size and of which some expressed classical exosome markers including Alix, CD81 and Annexin V. We showed that while we had some presence of lipoproteins as detected by ApoB, most of the isolated particles were EV’s with exosome-like characteristics (). We found that biological variability far outweighed technical variability and that the biological variability did not interfere with identifying significant differences between healthy and diseased subjects. Thus, following the workflow described herein, miRNA content of body fluid derived EVs can be used to identify biomarkers of disease.
In addition to estimating the extent of biological and technical variability, we observed a methodological bias in library preparation. Using synthetic spike-ins, we found a poor correlation between the input concentration and the RNA sequencing reads generated by the Truseq method, the most widely used protocol for small RNA sequencing ()). The critical step in most library preparation protocols is the ligation of adapters to both ends of the sequences of interest and it is the most significant source of bias [13]. Ligases tend to have strong sequence specific biases, and coupled with RNA primary and secondary structure, they can significantly distort the sequencing data [22]. The Truseq kit uses universal adapters with fixed sequences that are susceptible to ligase related sequencing biases. This can be seen when comparing the output reads between the 1X and 2X samples ()). Alternatives to the Truseq method exist that do not use universal adapters. For example, the Nextflex protocol from Bioo Scientific uses a pool of adapters with degenerate bases at ligation boundaries that should help reduce the biases caused by ligase sequence specificity. Indeed, we found in a side-by-side comparison that the Nextflex method introduced significantly less bias than the Truseq method according to the analysis of spike-in reads ()). Furthermore, when the data produced by these two protocols were compared, ~11% of the genes were identified as differentially expressed (,). Since the total RNA used as input for both protocols was identical, we would expect there to be no significant differences between them. We used qPCR to determine which of the two protocols most closely reflects true expression, since qPCR does not rely on library preparation. Of the 10 genes identified as most significantly different between protocols, all 10 were detected by qPCR in agreement with the Nextflex method, as opposed to 5 of 10 with the Truseq method. Thus, a method of library preparation that uses degenerate adapters is more likely to yield less biased results. A caveat is that the Truseq and Nextflex libraries were sequenced in independent runs on the sequencer, and while we have applied batch correction prior to comparing the two datasets, it is not possible to remove effects resulting from differing library preparation chemistry and sequencing runs entirely.
However, it should be kept in mind that while the Nextflex protocol reduced the bias, it did not likely eliminate all bias. The qPCR results did not correlate exactly with the reads from the Nextflex protocol and the spike-in analysis shows that there is still some over/under-representation of specific spike-ins. Thus, there is still room for improvement in the library preparation protocols and further studies utilizing the spike-ins as a quality control metric are warranted. The Nextflex protocol detected more unique miRNA as compared to the Truseq protocol ()), although the fraction of total reads represented by miRNA is higher with the Truseq protocol (Figure S3D) indicating that the Truseq protocol might over-represent the miRNA’s that are incorporated in the adapters due to the presence of the ligation bias. Additionally, the comparison of the correlation between technical replicates sequenced with the two protocols was ~0.55 indicating that the data is not comparable between kits (Figure S5). Overall, in order to maintain comparability between datasets that are generated in either smaller parts to create a whole or in collaboration with other groups, the technology used to prepare libraries must be the same and a change in this part of the study can critically impact the results of the biological question being addressed.
RNA sequencing has emerged as the gold standard for the de novo discovery and quantification of small RNA species and a variety of protocols exist on the market to access this information. Several studies including those conducted by the SeqC/MaQC III consortium have used known inputs of RNA to assess the metrics of different platforms [23]. They have shown that qPCR itself is subject to internal biases and that there is no gold standard for assessing NGS data [17]. They also show that RNA Seq platforms continue to have systematic as well as sample specific biases and that platform QC needs to be studied independently to inform future study designs. Additionally, studies have been performed on plasma miRNA sequencing platforms and reveal that library preparation using degenerate adapters was ideal to mitigate some of the biases encountered in small RNA sequencing [24]. We extend this finding to serum EV derived small RNA and show that incorporation of synthetic spike-ins is a useful approach to quantifying the biases across protocols.
Overall, we have shown that technical variability accounts for very little of the variability between healthy subjects (<1%). Although biological variability among healthy subjects is significant, it is still sufficiently low to allow for identification of biomarkers that distinguish healthy and disease subjects [11] 20]). Of particular importance to the search for miRNA biomarkers is bias introduced by the library preparation method. We recommend methods that use degenerate adapters over those that use adapters with fixed sequences, such as the Nextflex method used here. Additionally, we recommend the incorporation of synthetic spike-ins in these miRNA experiments to validate new library preparation technologies and as a benchmarking tool for comparison of platforms to provide integrity in the search for miRNA biomarkers.
Materials and methods
Healthy volunteers
Whole blood was obtained from healthy volunteer blood donors into a 10 ml Serum Separator tube (Cat #367,820 BD Diagnostics, Franklin Lake, NY, USA) with informed consent following an IRB approved protocol with no restrictions on age, gender, etc. (Sanguine Biosciences, Sherman Oaks, CA, USA). The blood was allowed to clot for 30 mins at room temperature and subsequently centrifuged at 1200 g for 10 min at 25°C. The serum fraction was re-centrifuged at 16,000 g for 10 min at 4°C and stored at −80°C until analysis.
Extracellular vesicle isolation and characterization
1 mL of serum was used as input in the exoRNeasy Serum/Plasma Maxi Kit (QIAGEN GmbH, Hilden, Germany) per the manufacturer’s instructions. Briefly, prefiltered serum was mixed 1:1 with 2x binding buffer (XBP) and added to the exoEasy membrane affinity column and centrifuged. Wash buffer (XWP) was added to the column and eluted in 400 μL of buffer XE. The eluate was passed through the column again and the EVs were aliquoted and stored at −20°C for future use.
Transmission electron microscopy
All spreads were done on freshly prepared carbon stabilized Formvar support films. A 5 µl drop of appropriately diluted sample (i.e., EVs) was adsorbed onto a carbon-coated grid for 30 s. The excess liquid was blotted away with a number 1 filter paper and the samples were negatively stained for 45 s with 1% uranyl acetate in water, to fix and contrast the spread EV samples. Allowing 30 s to stain the preps, the excess stain was removed, and the samples are air dried in a controlled humidity chamber (60% relative humidity for 10 min).
Once dried, the samples were examined using a FEI Tecnai 12 Spirit transmission electron microscope at 80 kV, equipped with a Gatan Erlangshen CCD camera. The micrographs were taken at magnifications appropriate to record the fine structure of the EVs and give a representative sample of the entire spread [25].
Flow cytometry
To analyse the expression of exosomal surface markers, 4 μm aldehyde/sulphate latex beads (Thermo Fisher Scientific) were incubated with EVs for 15 min at room temperature followed by addition of PBS (with 0.1% BSA and 0.01%sodium azide) and further incubated overnight [26]. The EVs were washed twice and incubated with primary antibodies or isotypes in the dark for 30 min using CD9-PE (cat #312105, Isotype Cat # 400113), Annexin V-Percp-Cy5.5 (Cat# 640936, Isotype Cat # 400149), CD81-Pe/Cy7 (cat#349511, Isotype Cat #400125), ApoB-FITC (Cat # sc-393636, Isotype Cat #312105) or CD63-APC (Cat# 31201, Isotype Cat # 400121). The bead-EV mixture was washed twice and data were acquired on a LSRFortessa™ (BD Biosciences). Data analysis was performed using the FloJo software (FlowJo version 10, Ashland, OR) [27].
Dot blot
Isolated EV’s were resuspended in RIPA buffer (Thermo Fisher Scientific, Waltham, MA) with protease inhibitor cocktail tablet (Sigma Aldrich, St Louis, MO) and cell debris was removed by centrifugation. The lysate was concentrated using an Amicon Ultra 4 centrifugal filter with a 10 K molecular weight cut off (Millipore Sigma, Burlington MA). 10 µL of lysate (or 10 µL of serum for a positive control) was spotted on a nitrocellulose membrane (Thermo Fisher Scientific) and allowed to dry at room temperature. The membrane was blocked with 5% BSA in TBS-T, incubated with primary antibodies against Alix (cat # MA1-83977, Thermo Fisher Scientific), or ApoB-HRP (cat# 393636 HRP, Santa Cruz Biotechnology) for 30 mins at room temperature. The blot was washed three times in TBST and probed with HRP conjugated secondary antibody (where applicable – cat # 31430, Thermo Fisher Scientific) for 30 mins at room temperature. The blot was washed three times with TBST and probed with Super Signal West Femto Kit (cat # 34094, Thermo Fisher Scientific). The blot was imaged on the C300 Chemiluminescent Western Blot Imaging System (Azure Biosystems, Dublin, CA, USA)
Nanoparticle tracking analysis
The Zetasizer Nano ZS 90 (Malvern Instruments, Orsay, France) was used to analyse particle size distribution of samples diluted 1:100 in 1 ml PBS according to the manufacturer’s instructions.
RNA isolation and quality control
1 mL of serum was pre-filtered through a 0.80 μM syringe filter prior to EV processing and then processed using the exoRNeasy Serum/Plasma Maxi Kit (QIAGEN GmbH, Hilden, Germany) per the manufacturer’s instructions. Briefly, prefiltered serum was mixed 1:1 with 2x binding buffer (XBP) and added to the exoEasy membrane affinity column and centrifuged. Wash buffer (XWP) was added to the column and centrifuged followed by vesicle lysis in QIAzol. The lysate was collected by centrifugation and the ExiSEQ NGS Spike-in kit – small RNA/microRNA (Cat # 800100, Exiqon Inc., Vedbaek, Denmark) was used to spike-in the samples before addition of chloroform and centrifugation to separate organic and aqueous phases. The aqueous phase was mixed with ethanol and added to a RNeasy MinElute spin column and centrifuged. The column was washed once with buffer RWT, and then twice with buffer RPE followed by elution of RNA in 20uL of water. The total RNA size distribution was assessed by Agilent 4200 Tapestation (Agilent, Santa Clara, USA) to ensure that each sample had RNA that was under 200 nucleotides and was thus suitable to be used for small RNA sequencing. Additionally, the concentration was measured using the Qubit high sensitivity RNA assay since the library preparation kits recommend using the Qubit to measure RNA input concentrations (Thermo Fisher Scientific, San Francisco, USA).
The spike-ins were added per the manufacturer’s instructions to the 1X samples (viz. 2uL per mL of serum processed). The 2X samples received 4ul of spike-in per ml of serum processed for RNA. The spike-ins consist of a mixture of 52 sequences that are supplied at three concentrations: 0.75 fmol (low), 7.5fmol (medium) and 37.5fmol (high). When used at the recommended concentration (i.e. 2uL per ml of serum used), they will account for 1–3% of the sequencing reads.
Library prep and sequencing
Illumina truseq protocol
Total RNA was used as input in the Illumina TruSeq Small RNA (Illumina, San Diego, USA) kit to make libraries at the Genome Technology Access Centre (Washington University, St. Louis USA). QC of EV RNA was performed on an Agilent Bioanalyzer. 10 ng of RNA was used for input into the TruSeq Small RNA Library Prep kit (Illumina). Libraries were generated per manufacturer’s protocol with the following modifications. Samples were amplified for 15 cycles due to the lower input. Twelve uniquely indexed libraries were pooled in equimolar ratio based on concentration between 145–160 bp as was determined by Agilent Bioanalyzer. The pools were size selected and purified together per manufacturer’s protocol. Indexed samples were pooled and run on 6% TBE PAGE gels. Band between 145–160 bp was cut out. DNA was eluted from gel overnight and concentrated by ethanol precipitation. Each pool of 12 was run on a lane of HiSeq3000 as single read 50 cycles.
Bio scientific nextflex protocol
10 ng of total RNA was used as input for library preparation with the NEXTflex Small RNA-Seq kit V3 (Bioo Scientific, Austin, TX) following the manufacturer’s instructions with sample amplification for 23 cycles. The libraries were size selected using the Pippin prep per the Nextflex protocol and eluted bands between 115 and 170 bp resulting in a product around 150 bp. (Sage Science, Beverly, MA) and purified together per manufacturer’s protocol. Nine uniquely indexed libraries were pooled in equimolar ratio based on concentration between 145–160 bp as was determined by Agilent Bioanalyzer. The pools were size selected and purified together per manufacturer’s protocol and run on a lane of HiSeq3000 as single read 50 cycles.
Rheumatoid arthritis sample collection
Serum from 10 patients with rheumatoid arthritis and 10 age and gender-matched controls were obtained from a vendor collection. Total RNA isolation was performed on all 20 samples together as described above. The RNA was used as input for library preparation using the Illumina Truseq protocol at the Genome Technology Access Centre (Washington University, St. Louis USA), as described above.
Quantitative PCR
cDNA was generated using 2 µL of purified total RNA (from three healthy donors) with the TaqMan Advanced miRNA cDNA Synthesis kit per the manufacturer’s instructions (Thermo Fisher Scientific). qPCR was then performed (in triplicate) for each sample using 2 µL of diluted cDNA, TaqMan Advanced miRNA Assays (given below), and Applied Biosystems™ TaqMan™ Fast Advanced Master Mix under fast cycling conditions on the ABI 7500 Fast real-time PCR system (Thermo Fisher Scientific). Ten miRNAs were selected and quantified for expression with U6 snRNA as the normalizer (Table S2).
miRNA abundance was evaluated in four biological replicates for each group with three technical replicates for each primer pair. A modified 2−ΔΔCt method [28]was used to calculate miRNA abundance for each gene of interest. Briefly, after averaging the threshold cycles (Ct) of the technical replicates for each biological replicate, the mean Ct for the reference genes U6 was subtracted from the mean Ct for each gene of interest (ΔCt). This value was transformed (logarithmically) to give relative miRNA abundance (log2 (2−ΔCt))
Data analysis and statistics
The data generated were assessed for quality using the FASTQC [29] and summarized using the MultiQC tool [30]. The total reads for each sample are provided in table S3 (column E). RNA-seq reads from the Truseq Illumina protocol were subjected to 3ʹ adapter trimming with the fastx_toolkit (ver. 0.0.13, http://hannonlab.cshl.edu/fastx_toolkit) followed by quality control to filter out the reads with low quality. Additionally, the reads with a length under 18 were removed per previous analyses in the field [31]. RNA-seq reads from the Nextflex protocol were subjected to 3ʹ adapter trimming with Cutadapt [32] followed by clipping four bases from either end of the sequence. The data were filtered to remove low-quality reads and reads with a length under 18 were discarded.
The resulting reads were mapped to the human genome using Bowtie2 [33]. Reads that mapped more than 100 times were filtered and the resulting reads were mapped to RNACentral version 11 [34]. Gene counts were derived from the number of uniquely aligned unambiguous reads by Subread: featureCount version 1.4.5. The number of assigned reads per sample is provided in Table S3 (Column F)
All gene-level and transcript counts were then imported into the R/Bioconductor package EdgeR and TMM normalization size factors were calculated to adjust for samples for differences in library size [35]. Genes or transcripts not expressed in any sample were excluded from further analysis. The TMM size factors and the matrix of counts were then analysed with the R/Bioconductor package Limma and weighted likelihoods based on the observed mean-variance relationship of every gene/transcript and sample were then calculated for all samples with the voomWithQualityWeights function.
Supplemental Material
Download Zip (10 MB)Acknowledgments
Transmission electron microscopy was carried out in the Core Electron Microscopy Facility of the University of Massachusetts Medical School, Worcester MA. We thank Greg Hendricks (UMass) for help preparing samples. We thank the Genome Technology Access Center in the Department of Genetics at Washington University School of Medicine for help with genomic analysis. The Center is partially supported by NCI Cancer Center Support Grant #P30 CA91842 to the Siteman Cancer Center and by ICTS/CTSA Grant# UL1TR002345 from the National Center for Research Resources (NCRR), a component of the National Institutes of Health (NIH), and NIH Roadmap for Medical Research. This publication is solely the responsibility of the authors and does not necessarily represent the official view of NCRR or NIH.
Disclosure statement
SS, SHC and CC are employees of AbbVie Inc. MXD and VK were employees at Abbvie Inc. at the time of the study. The design, study conduct, and financial support for this research were provided by AbbVie. AbbVie participated in the interpretation of data, review, and approval of the publication.
Supplementary material
Supplemental data for this article can be accessed here.
Additional information
Funding
Related Research Data
References
- Vlassov AV, Magdaleno S, Setterquist R, et al. Exosomes: current knowledge of their composition, biological functions, and diagnostic and therapeutic potentials. Biochim Biophys Acta Gen Subj. 2012;1820(7):940–12.
- Yáñez-Mó M, Siljander PR-M, Andreu Z, et al. Biological properties of extracellular vesicles and their physiological functions. J Extracell Vesicles. 2015;4(1):27066.
- van der Pol E, Böing AN, Harrison P, et al. Classification, functions, and clinical relevance of extracellular vesicles. Pharmacol Rev. 2012;64(3):676–705.
- Catalanotto C, Cogoni C, Zardo G. MicroRNA in control of gene expression: an overview of nuclear functions. Int J Mol Sci. 2016;17(10):1712.
- Zhang D, Lee H, Zhu Z, et al. Enrichment of selective miRNAs in exosomes and delivery of exosomal miRNAs in vitro and in vivo. Am J Physiol Lung Cell Mol Physiol. 2017;312(1):L110–l121.
- Colombo M, Raposo G, Théry C. Biogenesis, secretion, and intercellular interactions of exosomes and other extracellular vesicles. Annu Rev Cell Dev Biol. 2014;30(1):255–289.
- Kowal J, Tkach M, Théry C. Biogenesis and secretion of exosomes. Curr Opin Cell Biol. 2014;29:116–125.
- Janas T, Janas MM, Sapoń K, et al. Mechanisms of RNA loading into exosomes. FEBS Lett. 2015;589(13):1391–1398.
- Gould SJ, Raposo G. As we wait: coping with an imperfect nomenclature for extracellular vesicles. J Extracell Vesicles. 2013;2(1).
- Turpin D, Truchetet M-E, Faustin B, et al. Role of extracellular vesicles in autoimmune diseases. Autoimmun Rev. 2016;15(2):174–183.
- Srinivasan S, Su M, Ravishankar S, et al. TLR-exosomes exhibit distinct kinetics and effector function. Sci Rep. 2017;7:41623.
- Enderle D, Spiel A, Coticchia CM, et al. Characterization of RNA from exosomes and other extracellular vesicles isolated by a novel spin column-based method. Plos One. 2015;10(8):e0136133.
- Baran-Gale J, Kurtz CL, Erdos MR, et al. Addressing bias in small RNA library preparation for sequencing: a new protocol recovers microRNAs that evade capture by current methods. Front Genet. 2015;6:352.
- Hafner M, Renwick N, Brown M, et al. RNA-ligase-dependent biases in miRNA representation in deep-sequenced small RNA cDNA libraries. RNA. 2011;17(9):1697–1712.
- Johnson WE, Li C, Rabinovic A. Adjusting batch effects in microarray expression data using empirical bayes methods. Biostatistics. 2007;8(1):118–127.
- Campbell JD, Liu G, Luo L, et al. Assessment of microRNA differential expression and detection in multiplexed small RNA sequencing data. Rna. 2015;21(2):164–171.
- Git A, Dvinge H, Salmon-Divon M, et al. Systematic comparison of microarray profiling, real-time PCR, and next-generation sequencing technologies for measuring differential microRNA expression. RNA. 2010;16(5):991–1006.
- Blondal T, Brunetto MR, Cavallone D, et al. Genome-wide comparison of next-generation sequencing and qPCR platforms for microRNA profiling in serum. Methods Mol Biol. 2017;1580:21–44.
- Hon KW, Abu N, Ab Mutalib N-S, et al. Exosomes as potential biomarkers and targeted therapy in colorectal cancer: a mini-review. Front Pharmacol. 2017;8:583.
- Mitchell PJ, Welton J, Staffurth J, et al. Can urinary exosomes act as treatment response markers in prostate cancer? J Transl Med. 2009;7(1):4.
- McIntyre LM, Lopiano KK, Morse AM, et al. RNA-seq: technical variability and sampling. BMC Genomics. 2011;12:293.
- Jayaprakash AD, Jabado O, Brown BD, et al. Identification and remediation of biases in the activity of RNA ligases in small-RNA deep sequencing. Nucleic Acids Res. 2011;39(21):e141-e141. e141-e141.
- Consortium, S.M.-I., et al.A comprehensive assessment of RNA-seq accuracy, reproducibility and information content by the sequencing quality control consortium. Nat Biotechnol. 2014;32(9):903–914.
- Giraldez MD, Spengler RM, Etheridge A, et al. Comprehensive multi-center assessment of small RNA-seq methods for quantitative miRNA profiling. Nat Biotechnol. 2018;36(8):746–757.
- Hendricks GMAG,G. Protocol 191: analysis of rAAv sample morphology using negative staining and high resolution electron microscopy. In: Sambrook MRGAJ, editor. Molecular cloning (A laboratory manual). Long Island, New York: Cold Spring Harbor Press; 2012. p. 1301–1303.
- Suárez H, Gámez-Valero A, Reyes R, et al. A bead-assisted flow cytometry method for the semi-quantitative analysis of Extracellular Vesicles. Sci Rep. 2017;7(1):11271.
- Srinivasan S, Vannberg FO, Dixon JB. Lymphatic transport of exosomes as a rapid route of information dissemination to the lymph node. Sci Rep. 2016;6:24436.
- Livak KJ, Schmittgen TD. Analysis of relative gene expression data using real-time quantitative PCR and the 2(-Delta Delta C(T)) method. Methods. 2001;25(4):402–408.
- Andrews S, FastQC: a quality control tool for high throughput sequence data. Available from: http://www.bioinformatics.babraham.ac.uk/projects/fastqc, 2010.
- Ewels P, Magnusson M, Lundin S, et al. MultiQC: summarize analysis results for multiple tools and samples in a single report. Bioinformatics. 2016;32(19):3047–3048.
- Seco-Cervera M, González-Rodríguez D, Ibáñez-Cabellos JS, et al. Small RNA-seq analysis of circulating miRNAs to identify phenotypic variability in Friedreich’s ataxia patients. Sci Data. 2018;5:180021.
- Martin M. Cutadapt removes adapter sequences from high-throughput sequencing reads. EMBnet. journal. 2011;17(1):10–12.
- Langmead B, Salzberg SL. Fast gapped-read alignment with Bowtie 2. Nat Methods. 2012;9:357.
- consortium TR. RNAcentral: a comprehensive database of non-coding RNA sequences. Nucleic Acids Res. 2017;45(D1):D128–d134.
- Dillies M-A, Rau A, Aubert J, et al. A comprehensive evaluation of normalization methods for Illumina high-throughput RNA sequencing data analysis. Brief Bioinform. 2013;14(6):671–683.