
ABSTRACT
Extracellular vesicles (EVs) play a vital role in normal lung physiology to maintain homeostasis in the airways via intercellular communication. EVs include exosomes and microvesicles, and are characterized by their phospholipid bilayers. EVs have been recognized as novel circulating biomarkers of disease, which are released by different cell types. In this study, we used different EV isolation and purification methods to characterize the plasma-derived EV miRNAs from non-smokers, smokers and patients with COPD. A small RNA sequencing (RNA-seq) approach was adapted to identify novel circulating EV miRNAs. We found that plasma-derived EVs from non-smokers, smokers and patients with COPD vary in their size, concentration, distribution and phenotypic characteristics as confirmed by nanoparticle tracking analysis, transmission electron microscopy, and immunoblot analysis of EV surface markers. RNA-seq analysis confirmed the most abundant types of small RNAs, such as miRNAs, tRNAs, piRNAs snRNAs, snoRNAs and other biotypes in plasma-derived EVs. We mainly focused on miRNAs as novel biomarkers in smokers and patients with COPD for further analysis. Differential expression by DESeq2 identified distinct miRNA profiles (up-regulated: miR-22-3p, miR-99a-5p, miR-151a-5p, miR-320b, miR-320d; and down-regulated: miR-335-5p, miR-628-3p, miR-887-5p and miR-937-3p) in COPD versus smokers or non-smokers in a pairwise comparison. Gene set enrichment analysis (GSEA) of differentially expressed miRNAs revealed the top pathways, gene ontology and diseases associated with smokers and patients with COPD. We selectively validated miRNAs in EVs isolated from BEAS-2B cells treated with cigarette smoke extract by quantitative PCR analysis. For the first time, we report that plasma-derived EV miRNAs are novel circulating pulmonary disease biomarkers. Thus, molecular profiling of EV miRNAs has great translational potential for the development of biomarkers that may be used in the diagnosis, prognosis, and therapeutics of COPD.
Introduction
Chronic obstructive pulmonary disease (COPD) is characterized by persistent, DNA damage-mediated chronic inflammation in the lung, leading to tissue remodelling, alveolar destruction, airflow limitation and accelerated decline in lung function [Citation1]. Cigarette smoking is the main risk factor for this debilitating disease, while exposure to other environmental factors, noxious gases, indoor and outdoor air pollution (biomass fuel) and occupational dusts have also been identified as possible risk factors [Citation1]. The lung airway epithelium is the first site that encounters exposure to cigarette smoke (CS). Chronic CS exposure in the lung results in the production of airway epithelium-induced pro-inflammatory mediators, as well as senescence-associated secretory phenotype, which entails (SASP: cytokines IL-1, IL-6, IL-8, MCP-1, etc.) the release of damage-associated molecular patterns (e.g. S100 proteins, heat shock proteins, high-mobility group box-1, receptor for advanced glycation end-products) both locally in the lung and systemically in circulation [Citation2,Citation3]. Release of inflammatory cytokines during CS exposure causes recruitment of immune-inflammatory cells into the lungs, which further amplifies the inflammatory response and increases the release of proteases and other reactive oxidative species, leading to parenchymal damage (alveolar destruction) and contributing to the development of COPD/emphysema [Citation4]. There are several different mechanisms proposed that could play an important role in the pathogenesis of COPD such as oxidative stress, inflammation, protease/anti-protease, epigenetics, apoptosis, cellular senescence and mitochondrial dysfunction [Citation4–Citation6].
Prior report supports the fact that microRNAs (miRNAs) play a crucial role in the pathophysiology of chronic inflammatory lung diseases (COPD, asthma, and idiopathic pulmonary fibrosis [IPF]) and lung cancer [Citation7–Citation9]. miRNAs are small non-coding RNAs (~19-25 nucleotides), that can cause post-transcriptional gene repression/silencing due to increased mRNA degradation or by inhibiting translation of target-specific mRNA. miRNAs are known to play a pivotal regulatory role in various cellular (proliferation, differentiation, apoptosis, and stress resistance) and biological processes (immune regulation, inflammatory response, autophagy, cellular senescence, tissue remodelling, angiogenesis, and tumour development) [Citation10–Citation12]. Aberrant expression of certain miRNAs has been implicated in the development and progression of COPD [Citation8,Citation9,Citation13,Citation14]. Thus, manipulation of miRNA expression in the target organ represents a potential avenue to develop treatment strategies.
Transfer RNAs (tRNAs) play an essential role in protein synthesis. There are two main types of tRNA-derived small RNAs (tsRNAs): tRNA-derived fragments (tRFs: 14–30 nucleotides long) and tRNA halves (31–40 nucleotides long). Recent studies have demonstrated that tsRNAs perform several biological functions such as acting as signalling molecules during stress responses, and serving as regulators of transcription, translation, DNA damage response, viral infections, cancer and neurodegeneration [Citation15]. Furthermore, Piwi-interacting RNAs (piRNAs: 36–32 nucleotides long) have been shown to modulate gene expression pathways via interacting with Piwi proteins [Citation16]. Prior studies on differentially expressed piRNAs were reported in several types of malignancies (lung, breast, gastric and colorectal cancers) [Citation16]. However, to date, no study has been conducted to comprehensively analyze different types of small RNA species such as miRNAs, tRNAs and piRNAs in human plasma-derived EVs as circulating biomarkers in smokers and patients with COPD compared to non-smokers by small RNA-sequencing.
Recent report evidently suggests that cell-derived extracellular vesicles (EVs)/exosomes mediate cell-to-cell communication and immunoregulatory functions [Citation10,Citation12,Citation17]. In this study, we will use the term EVs as recommended by the International Society for Extracellular Vesicles, which includes vesicles present in extracellular space (both exosomes and microvesicles) [Citation18]. Exosomes are small nano-sized vesicles (endosomal origin: 50–150 nm) released into extracellular space after fusion of several multivesicular endosomes [Citation19]. Microvesicles vary in their sizes (plasma membrane origin: 100–2000 nm) and originate by budding or shedding from the plasma membrane [Citation19]. EVs are released by several different cell types, including both immune (macrophages, B- and T-lymphocytes, and dendritic cells) and structural cells (epithelial, alveolar macrophages, alveolar type I and II cells, endothelial, fibroblasts, and smooth muscle cells) in the lungs [Citation10,Citation12,Citation17]. EVs/exosomes contain enriched amounts of specific surface markers/proteins, including those of endosomal origin (CD9, CD63, CD81, HSP 70, Alix, TSG101 and Major Histocompatibility Complex classes I and II), regulatory proteins, mRNA and miRNAs [Citation19,Citation20].
There is growing evidence that EVs/exosomes are enriched in several different biofluids (serum/plasma, bronchoalveolar lavage fluid, saliva, urine, etc.), and their composition changes in the disease state vs. normal conditions, emphasizing the role of EVs as novel circulating biomarkers [Citation21]. Recently, increased CD9+ EVs isolated from patients with COPD and acute exacerbations (AECOPD) were found to correlate with systemic inflammatory markers (CRP, sTNFR1, IL-6 in plasma) compared to healthy controls, suggesting the importance of molecular characterization of EVs/exosomes [Citation22]. In this study, we used standard isolation and characterization methods for the isolation of EVs/exosomes from stored human plasma obtained from non-smokers, smokers and patients with COPD. We further used next-generation sequencing (NGS) to characterize small RNAs that are enriched in isolated EVs/exosomes (mainly miRNAs, tRNAs, piRNAs and other ncRNA biotypes) from smokers and patients with COPD compared to non-smokers in order to fully understand their role in the pathogenesis of smoking-related chronic lung diseases. This study shows great potential to identify novel circulating EV biomarkers from human plasma that may be used for the diagnosis, prognosis and therapeutics of chronic inflammatory lung diseases such as COPD.
Materials and methods
Ethics statement
All protocols, procedures and subject/patient recruitment described in this study were approved by the ethical Institutional Review Board (IRB)/Research Subject Review Board (RSRB) committee of the University of Rochester Medical Center, Rochester, NY (RSRB#00028789). All subjects and patients provided written informed consent. Select plasma samples from non-smokers, smokers and patients with COPD from an earlier study were used. Please refer to the clinical characteristics summary of subjects as described previously () [Citation23].
Table 1. Clinical characteristics of non-smokers, smokers and patients with COPD used for small RNA-sequence analysis of plasma-derived EVs.
Collection of human blood/plasma
Blood samples (50–100 ml) were obtained from non-smokers, smokers, and patients with COPD between 8 am and 2 pm. Blood samples were collected using BD vacutainer brand safety-lok blood collection set with BD vacutainer K2 EDTA plus blood collection tubes. The anticoagulant-treated blood samples were mixed with equal volumes of sterile HBSS by inverting the tube several times. The diluted blood samples (20 ml) were each transferred to a clean 50 ml centrifuge tube containing Ficoll-paque media (15 ml). The tubes were then centrifuged at 800 g for 15 min at 20°C. The upper layer containing plasma was collected from each sample and stored in a 50 ml falcon tube at – 80°C until use. The layers of mononuclear cells (monocytes) were isolated, washed and plated for another study.
Isolation of plasma-derived EVs/exosomes
ExoQuickTM method
ExoQuickTM exosome precipitation solution was obtained from System Biosciences and stored at 4°C. Human plasma samples were thawed on ice for isolation of EVs using the ExoQuick method. In brief, plasma samples were centrifuged at 3,000 x g for 15 min to remove cells and cell debris. Clarified plasma samples were then transferred to a clean tube containing an equal volume of ExoQuick exosome precipitation solution. These mixtures were incubated overnight at 4°C and then centrifuged at 1,500 x g for 30 min. The supernatant was aspirated and the EV pellets were re-suspended in a 100–200 μl suitable buffer (1x PBS) or lysis reagent for downstream applications [Citation24].
Exo-SpinTM method
Exo-Spin™ exosome purification kit for plasma was purchased from Cell Guidance Systems and stored at 4°C. Human plasma samples were thawed on ice for isolation of EVs using the Exo-Spin method. In brief, 250–500 μl plasma samples were centrifuged first at 300 x g and then at 16,000 x g for 10 and 30 min, respectively, to remove platelets and larger vesicles. Half the volume of Exo-Spin buffer was added to the plasma samples, which were then mixed by inverting and incubated at 4ºC for at least 1 hr before centrifugation at 16,000 x g for 60 min. The EV pellets were re-suspended in 100–200 μl PBS and purified using the Exo-Spin column. Finally, EVs were eluted in 100–200 μl PBS for downstream processing/application [Citation24].
Plasma EVs/exosome purification and RNA isolation
Frozen plasma samples were thawed in ice at 4°C. ~4-5 ml of thawed plasma samples were aliquoted in 15 ml conical tubes, then centrifuged at 400 x g (~2000 rpm) for 2 min to remove cells and precipitated plasma proteins/lipids. Cell-free plasma samples (~4 ml) were then transferred into 50 ml conical tubes for exosome purification followed by RNA isolation according to the manufacturer’s instructions (Plasma/serum exosome purification and RNA isolation midi kit; Norgen Biotek Corp. Cat# 58,500).
Exosome purification step: In brief, 12 ml of nuclease-free water was added to ~4 ml of cell-free plasma in a 50 ml falcon tube, followed by the addition of 300 μl of ExoC buffer. Then, 400 μl of slurry E was added and the contents were mixed by vortexing for 10 sec. The mixture was incubated at room temperature (RT) for 5 min before the samples were vortexed another 10 sec followed by centrifugation at 2000 rpm for 2 min. Then, the supernatant was discarded and the pellet was mixed with 400 μl of ExoR buffer, vortexed for 10 sec and incubated at RT for 10 min. Again the samples were vortexed for 10 sec, then centrifuged at 500 rpm for 2 min. Finally, the supernatant containing the exosomes was transferred to a mini filter spin column and centrifuged at 6000 rpm for 1 min. The eluted fraction contains the exosomes that are ready for any downstream applications. EVs prepared from the above-mentioned methods were stored at −20°C for immediate use or stored at −80°C for long-term.
Exosomal RNA isolation step: In brief, we added 600 μl of lysis buffer A and 75 μl of lysis additive B to the 400 μl of ExoR buffer containing the purified exosomes. The tubes were mixed by vortexing for 10 sec and then incubated at RT for 15 min. In 2 ml tubes, we added 1 ml of 96-100% ethanol to the exosome mixture and mixed by vortexing for 10 sec. We then transferred 750 μl of this mixture into a mini spin column and centrifuged at 3,300 x g (~6000 rpm) for 1 min. The flow-through was discarded, and the mini spin column was re-assembled to transfer the remaining mixtures for two additional times. Then, the spin column was washed with 600 μl of wash solution A and centrifuged at 3,300 x g for 30 sec and the flow-through was discarded. Similarly, the column wash step was repeated one more time. Additionally, the spin column was centrifuged at 13,000 x g for 1 min to remove residual wash buffer. Finally, the spin column was transferred to a clean 1.5 ml tube. To the column, we added 50 μl of elution solution A and centrifuged initially at 2000 rpm for 1 min, followed by a final centrifugation step at 8000 rpm for 2 min. Exosomal RNA from plasma samples isolated via this method was used for RNA-sequencing analysis. The quantity and quality of the exosomal RNA were further analyzed by either the RiboGreen assay (1 μl of RNA was used in a 20 μl reaction) or by using the Agilent 2100 Bioanalyzer system (Agilent Technologies, Inc.) using the total RNA Pico Series II chip [Citation25]. Purified exosomal RNA from all samples was tested for amplification of 5S rRNA (for quantitative PCR) and miR-21 or miR-16 stem-loop RT-PCR as described [Citation26].
Transmission electron microscopy
Exosomes were visualized using transmission electron microscopy (TEM) as described previously [Citation24,Citation27]. Briefly, 2–4 μl of exosome was fixed in 4% paraformaldehyde and deposited onto carbon-coated electron microscopy grids. Then, the grids were washed twice with 1x PBS, followed by once with 1x PBS containing glycine (50 mM) each for 3 min, and then with 1 x PBS containing BSA (0.5%) for 10 min. Finally, the grids were stained with 2% uranyl acetate and observed with Hitachi 7650 Analytical TEM.
Nanoparticle tracking analysis (NanoSight NS300) and tunable resistive pulse sensing (TRPS) measurements
Particle size and concentration of plasma-derived EVs were analyzed by nanoparticle tracking analysis (NTA) using the NanoSight Technology NS300. In brief, exosomes isolated by Exo-Quick/ExoSpin were diluted in PBS (1:1000) and mixed before being introduced into the sample chamber using a syringe pump with a fixed flow rate. Three video recordings were made for a period of 60 sec each. NS300 uses a combination of shutter speed and gain followed by manual focusing, which allows for optimum visualization of the maximum number of EVs. The nanoparticle tracking analysis (NTA) post-acquisition settings were optimized and kept constant between the samples and analyzed as described previously [Citation24,Citation28].
Tunable Resistive Pulse Sensing (TRPS) measurements were performed using a qNano (Izon Science, U.K.). We used nanopore NP250, which has a pore size of 250 nm, for all samples used in this analysis (). We additionally used calibration beads TKP200, which were supplied with the nanopores, for analysis. Approximately 75–80 μl of 1x PBS buffer was dispensed into the bottom fluid cell, and 40 μl of the sample was dispensed into the top fluid cell. Tran-membrane voltage was applied and adjusted using Izon’s Control Suite software (ICS v3.32.2001). All measurements were performed to obtain particle size and concentration measurements as described previously [Citation29]. Representative data files for TRPS analyses are included as supplemental data (Supplementary Figure 1). We have submitted all the relevant data from our experiments to the EV-TRACK knowledgebase (EV-TRACK ID: EV190041; http://evtrack.org/review.php) [Citation30].
Table 2. Particle concentration, size (mode and mean) and protein concentration of plasma-derived EVs.
Cell culture and treatment
Human bronchial epithelial cells (BEAS-2B; ATCC, Manassas, VA) were cultured in 5% CO2 at 37°C in a suitable culture medium. Briefly, BEAS-2B cells were maintained in the DMEM-Ham’s F12 50:50 mixture (DMEM-F12; Mediatech, Manassas, VA) supplemented with 10% exosome-depleted FBS One Shot (Gibco, Cat. # A27208-03), containing 15 mM HEPES, penicillin (100 U/mL), and streptomycin (100 μg/mL). U937 monocytic cells (U937; ATCC) were cultured in 5% CO2 at 37°C in RPMI 1640 medium containing 5% FBS and penicillin/streptomycin (1%).
BEAS-2B cells (4 × 10⁶) and U937 cells (5 × 10⁶) were grown in 100 mm dishes to ∼90-95% confluency in a suitable culture medium with 1% or 5% exosome-depleted FBS (Gibco). Then, cells were treated with CSE (0.5%) for 3 days at 37°C with 5% CO2. Untreated cells were used as the control in this experiment. At the end of treatment, the conditioned medium was collected for isolation of exosomes/EVs. Similarly, BEAS-2B cells were grown in 100 mm dishes and treated with and without CSE (0.5%) for 3 days for isolation of total RNA for NanoString nCounter Human v3 miRNA expression assay.
Exosome labelling and confocal microscopy
EVs/exosomes isolated from the plasma of non-smokers and smokers were labelled with ExoGlow-membrane EV labelling kit (Cat# EXOGM600A-1) according to the manufacturer’s instructions (System Biosciences, Palo Alto, CA). In brief, exosomes prepared from the above-mentioned exosome/EV isolation method (Plasma/serum exosome purification kit; Norgen Biotek Corp.) were used for ExoGlow-membrane labelling. First, to 12 μl of reaction buffer, we added 2 μl of labelling dye in a 0.6 ml tube and mixed thoroughly. Then, the recommended concentration of exosomes (50–100 μg) measured by the micro BCA kit was mixed along with the labelling reaction buffer and incubated at RT for 30 min. We used PD spin trap G-25 GE buffer exchange columns to remove free unlabelled dye according to the manufacture’s protocol. Finally, the eluted and labelled exosomes from the spin trap G-25 column were used for visualizing the uptake of labelled, plasma-derived EVs in BEAS-2B cells. Images were captured using the Laser Scanning Confocal Microscope (FV1000 Olympus) after 24-h post-incubation of labelled EVs in BEAS-2B cells.
Exosomes purification from conditioned medium and Exosomal RNA isolation
Cell culture medium (10 ml) harvested in 15 ml conical tube was centrifuged at 200 x g (~1,000 rpm) for 15 min to remove any cells and debris. The cell-free media was then transferred into a 50 ml conical tube for exosome purification according to the manufacturer’s instructions as described above using Norgen Biotek kits (Cell culture media exosome purification and RNA isolation Midi kit; Norgen Biotek Corp. Cat # 60800).
Immunoblot analysis of EV/Exosomal markers
Exosomal proteins were measured using the micro BCA kit. Twenty five micrograms of protein were electrophoresed on 7.5% or 4-15% gradient SDS-PAGE gels and transferred onto nitrocellulose membranes (Amersham, Arlington Heights, IL, USA). The nitrocellulose membranes were blocked with 5% BSA or milk and subsequently incubated overnight at 4°C with specific primary antibodies (1:1000 dilution) such as TSG-101 (Santa Cruz, sc-7964), Rab-5b (Santa Cruz, sc-373725), Alix (Santa Cruz, sc-53540), calnexin (Santa Cruz, sc-11397) and GRP94 (Santa Cruz, sc-393402). After 3–5 washing steps (10 min each), the levels of protein were detected by probing with a specific secondary anti-rabbit -mouse or -goat antibody (1:20,000 dilution) linked to horseradish peroxidase (Dako, Santa Barbara, CA, USA) for 1 h, and bound complexes were detected using the enhanced chemiluminescence method (ECL; Perkin-Elmer, Waltham, MA). Then, the images were captured by using the Bio-Rad ChemiDoc MP Imaging system.
Small RNA library construction and sequencing
The small RNA libraries were prepared from the exosomal RNA isolated from each sample [non-smokers (6), smokers (6), and patients with COPD (8)] using the Norgen Biotek Small RNA library prep kit (Cat# 63600) for Illumina according to the manufacturer’s instructions, as described previously [Citation26]. The library was quantified using the High Sensitivity DNA Analysis kit on the Agilent 2100 Bioanalyzer system. Libraries were diluted as required and sequenced on the Illumina MiSeq or Illumina NextSeq 500 sequencing platform using the MiSeq reagent kit v3 or NextSeq 500/550 High Output kit v2 (51 cycles using a 75-cycle kit) at the Norgen Biotek. Corp. (ON, Canada).
Sequencing read mapping and small RNA annotation
The raw data from the Illumina MiSeq/NextSeq 500 were converted to fastq format. Files were then exported to the Genboree Workbench’s exceRpt small RNA-seq pipeline (version 4.6.2) for read mapping to the hg38 human genome version [Citation31]. This allowed for a single-mismatched base down to 18 nucleotides. After adapter trimming, read quality was assessed by FASTQC to filter out reads with a quality score lower than 30 on the PHRED scale. Reads were first mapped to the UniVec and human ribosomal RNA (rRNA) sequences to exclude them before mapping to databases of miRBase version 21, gtRNAdb and piRNABank to assign reads to miRNAs, tRNAs and piRNAs, respectively, as described [Citation26].
Quantitative real-time PCR
To validate a few miRNAs identified in RNA-sequencing data, we performed qPCR analysis of selected miRNA targets. The miRNA-specific primer pairs were obtained from Applied Biological Materials Inc. (ABM, BC, Canada). First, 50 ng of exosomal RNA was reverse transcribed using the miRNA cDNA synthesis kit, with Poly (A) polymerase tailing (ABM, BC, Canada) according to the manufacturer’s instructions. Two microlitres of synthesized cDNA were used as a template for all the qPCR reactions performed with RT2 SYBR Green/ROX PCR master mix using the CFX96 real-time system (Bio-Rad). Differential expression of miRNAs between the exosomal RNA isolated from CSE-treated BEAS-2B or U937 and control cells (without treatment) were expressed as relative abundance/fold change. Fold-Change (2^(- Delta Delta Ct)) is the normalized gene expression (2^(- Delta Ct)) in the Treated Sample (CSE) divided by the normalized gene expression (2^(- Delta Ct)) in the Control Sample (Control). For all the miRNA targets analyzed by qPCR, 5S rRNA was used a housekeeping control, cellular RNA reverse transcribed in a similar manner was used as a positive control, and no template control was used as a negative control. Melting curve analysis was used to confirm the specificity of the amplification reactions.
Nanostring miRNA analysis
Total RNA was extracted from control and CSE (0.5% for 3 days) treated BEAS-2B cells using miRNeasy mini kit (Qiagen, CA). miRNA expression in 300 ng RNA was quantified by NanoString nCounter Profiler, using a Human v3 miRNA Assay (Cat. # CSO-MIR3-12). The miRNA data was normalized using a global normalization method, which normalizes to total counts of the 100 most highly expressed (on average) miRNA targets across all samples (n = 5/group) using nSolver analysis software 4.0 (NanoString Technologies Inc., Seattle, WA).
Extracellular vesicles/exosome miRNA database searches
The identified miRNAs from human plasma-derived EVs were searched for in online databases, such as the extracellular vesicles miRNA database (http://bioinfo.life.hust.edu.cn/EVmiRNA), Vesiclepedia (http://microvesicles.org/) [Citation32] ExoCarta (http://exocarta.org/) [Citation33] and miRDB (http://mirdb.org/) [Citation34]. In brief, these curated databases provide a compendium of miRNAs identified in several EVs/exosome preparations and from other sample types. Information from all the above-mentioned Exosome/EV miRNA databases was accessed in November–December 2018. Venn diagrams were created using the online tool (http://bioinformatics.psb.ugent.be/webtools/Venn/) to compare lists of miRNAs, in order to find the common and unique EV/exosome-enriched miRNA biomarkers identified in this study.
Data and statistical analysis
After preprocessing and quality control of the RNA-seq fastq files, the summarized RNA-seq count data was first analyzed to filter out genes with summed counts across all samples less than 10. Then, the trimmed mean of M values (TMM) method was used for count normalization across the non-smokers, smokers, and patients with COPD groups for miRNA analysis [Citation35]. The pairwise differences in miRNA, tRNA and piRNA expression levels among the non-smokers, smokers, and patients with COPD groups were examined using the linear contrast in the DESeq2 RNA-seq differential analysis method [Citation36]. The false discovery rate (FDR) was controlled for at 5% using the Benjamini-Hochberg method for each pairwise comparison. Heatmaps were generated using the pheatmap function in the pheatmap package in R 3.5.1. The Ward.D hierarchical clustering method was used to cluster samples and significant miRNAs. The clustering was based on Euclidean distance. A heatmap of significant miRNAs, tRNAs and piRNAs selected from the DESeq2 method was generated to show the differences between groups based on their pairwise comparisons.
Functional over-representation analysis and gene set enrichment analysis of miRNAs
We assessed the functions of the differentially expressed miRNAs from non-smokers vs. smokers, non-smokers vs. COPD and smokers vs. COPD using miRNA enrichment analysis and annotation tool (miEAA; https://ccb-compute2.cs.uni-saarland.de/mieaa_tool/; accessed in June 2019) [Citation37]. MiEAA is a web-based application that offers a variety of commonly applied statistical tests such as over-representation analysis (ORA) and miRNA set enrichment analysis, which is similar to Gene Set Enrichment Analysis (GSEA). MiEAA performs rich functionality in terms of miRNA categories (gene ontology, pathways, diseases) and tests whether a category is significantly enriched (FDR adjustment) in a given miRNA set with respect to the reference using statistical tests implemented in the gene set analysis toolkit, GeneTrail.
Results
Isolation and characterization of plasma-derived EVs
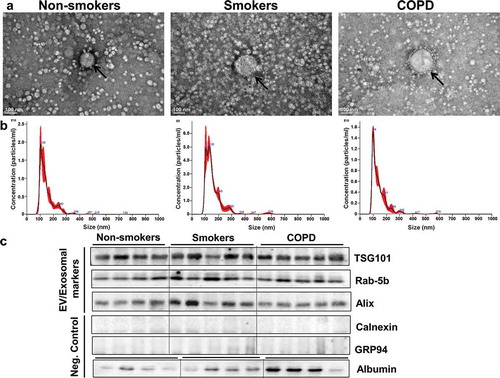
We show a comprehensive analysis of EV/exosome isolation and characterization, as well as small RNA-sequencing of human plasma-derived EVs from six non-smokers, six smokers and eight patients with COPD. Initial experiments for isolation and characterization of EVs/exosomes were performed using either the ExoQuick or ExoSpin method. We performed transmission electron microscopy (TEM), nanoparticle tracking analysis (NTA) and tunable resistive pulse sensing (TRPS) of plasma-derived EVs that range from ~50-150 nm in size ((a,b); Supplementary Figure 1 and ). TEM analysis confirmed morphology of cup-shaped EVs isolated from plasma samples of non-smokers, smokers and patients with COPD. We found evidence of lipoprotein aggregates in EVs isolated using the ExoQuick method. NanoSight NTA analysis was performed in EVs isolated by ExoSpin method to further analyze the size range, mean, mode and particle concentration of plasma-derived EVs. Our data on the concentration of EVs from non-smokers, smokers and patients with COPD did not show a significant difference in the size distribution or total number of particles, but showed vesicles enriched in the size range of exosomes among all three groups. We performed a micro BCA protein analysis to quantify the amount of total exosomal protein present in isolated EVs that were relatively comparable between all three groups (). We used traditional immunoblot analysis to determine enrichment of EV/exosome markers in plasma-derived EVs from non-smokers, smokers and patients with COPD. We found exosomal markers TSG-101, Rab-5b and Alix to be enriched in plasma-derived EVs isolated from non-smokers, smokers and patients with COPD ()). EVs isolated from human plasma samples did not contain calnexin or GRP94, suggesting no contamination of the endoplasmic reticulum proteins ()).
Figure 1. Isolation and characterization of plasma-derived EVs from non-smokers, smokers and patients with COPD.
(a) Representative transmission electron microscopy (TEM) images of plasma-derived EVs isolated using ExoQuick method (scale bar, 100 nm). (b) Representative graphs of nanoparticle tracking analysis (NTA) of plasma-derived EVs from non-smokers, smokers and patients with COPD, indicating concentration and size distribution of isolated particles. Size distribution and concentration of particles including protein concentration of isolated EVs are summarized in (n = 5/group). Representative immunoblot images show enrichment of EV/exosomal markers TSG101, Rab-5b and Alix but no contamination of endoplasmic reticulum proteins (calnexin and GRP94) in plasma-derived EVs (n = 4-5/group).
EVs labelled to demonstrate uptake by human bronchial epithelial cells (BEAS-2B)
We used plasma-derived EVs isolated from the non-smoker and smoker groups for labelling using the ExoGlow-membrane EV labelling kit. Labelled EVs were added to BEAS-2B cells to verify the uptake of plasma-derived EVs by human bronchial epithelial cells in culture. Red fluorescently labelled EVs were identified within the BEAS-2B cells, suggesting uptake of EVs (Supplementary Figure 2). Live confocal microscopy images were obtained from different regions after 24-h post-treatment of labelled EVs that showed about 50-60% BEAS-2B cells positive for uptake of labelled EVs from non-smoker and smoker groups.
Input read alignment and small RNA biotype mapping
Exosomal RNA concentration in human plasma-derived EVs from non-smokers, smokers and patients with COPD ranged between 59 and 310 pg/μl, as measured by RiboGreen assay for quantification of exosomal RNA. Reads obtained from sequencing were used for alignment and mapping to the human genome after adapter clipping and quality filtering. The range of average input reads from each of the samples from the three different experimental groups (non-smokers, smokers and patients with COPD) was from 2.5 to 28.6 million reads. The average reads from non-smokers, smokers and patients with COPD were about 10.0 ± 10.1, 10.2 ± 10.6 and 23.3 ± 2.4 million reads, respectively. The percentage of successfully clipped reads was more than 67-80% from all the samples, with a smallest percentage of reads that failed quality filters. Reads were mapped to human rRNA to exclude rRNA sequences before mapping them to the human genome. The average percentage of reads aligned to human rRNA was less than 2% on an average from most of the samples. This reflects on the reads used for alignment to the human genome. The percentage of reads used for alignment was mapped to the human genome, and small RNA biotypes (miRNA sense, tRNA sense, piRNA sense, and Gencode sense). Those that were not mapped to genome or transcriptome can be found in Supplementary Table 1. Additionally, the QC metrics, such as input (million reads), successfully clipped, failed quality filter, UniVec contaminants, rRNA, reads used for alignment, miRNA sense, tRNA sense, piRNA sense, Gencode sense and not mapped to genome or transcriptome that were significantly different among all the three groups were included as boxplots (Supplementary Figure 3). This justifies us not being able to perform the generalized linear model (GLM) to adjust for covariance because of an overfitting issue and unstable estimates due to the small sample size among the different groups analyzed in this study.
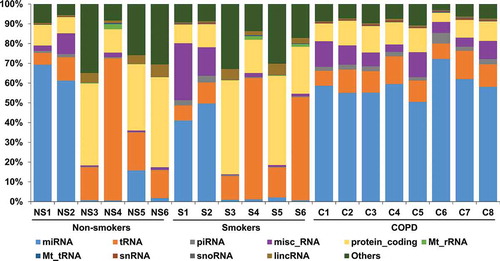
The reads mapped to the human genome were classified based on the percentage distribution of various small RNA biotypes (). The average total reads mapped to small RNA biotypes within each group ranged from 1.1 to 1.4 million reads. We observed a distinct pattern and percentage distribution of biotypes enriched in non-smokers, smokers and patients with COPD ( and ). miRNA (24.9 ± 31.9%, 15.9 ± 22.9% and 58.9 ± 6.4%), tRNA (23.3 ± 24.3%, 26.5 ± 23.8% and 11.1 ± 2.5%) and protein_coding (25.2 ± 16.9%, 25.7 ± 16.7% and 10.2 ± 2.8%) biotypes were among the top enriched biotypes in non-smokers, smokers and patients with COPD, respectively. misc_RNA and lincRNA biotypes ranged from 3.0% to 8.2% and 0.5% to 2.9%, respectively. Finally, piRNAs (0.6–2.6%), Mt_rRNAs (0.1–0.6%), Mt_tRNAs (0.1%), snRNAs (0.1–0.5%) and snoRNAs (0.1–0.3%) were among the least represented biotypes in non-smokers, smokers and patients with COPD ( and ). The biotype distribution percentages for individual samples from all three groups are represented in (). We mainly focused on the miRNA data from RNA-seq analysis for further investigation in this study.
Table 3. Percentage of biotype counts in non-smokers, smokers and patients with COPD.
Figure 2. Relative biotype distribution from each sample.
This graph represents average percentage of biotype counts of each sample from non-smokers (NS1-6), smokers (S1-6) and patients with COPD (C1-8).
Comparison of miRNAs between non-smokers, smokers and patients with COPD
The combined raw read count data revealed a total of 329 distinct miRNAs identified from all three groups (non-smokers, smokers and patients with COPD). Only 219 miRNA sequences contained average counts greater than five reads per million. Low abundant miRNA sequences containing averages less than five normalized reads per million were not included for comparison. From our analysis, 139, 115 and 198 total miRNAs were identified to be present in plasma-derived exosomal RNA from non-smokers, smokers and patients with COPD, respectively. Upon analyzing the average reads per million of common and unique miRNAs across all three groups, 99 miRNAs were found to be common among non-smokers, smokers and patients with COPD, and 100 miRNAs were found to be common among non-smokers and smokers. Additionally, when we compared non-smokers and COPD, there were 121 miRNAs in common. Finally, when we compared smokers and COPD, there were 111 miRNAs common between those two groups ()). The non-smokers, smokers and patients with COPD groups each had a certain number of miRNAs (17, 3 and 65, respectively) that were unique to each group ()).
Figure 3. Venn diagram showing unique and common miRNAs in different groups and differentially expressed miRNA comparisons.
(a) Venn diagram shown here represents miRNA with average read counts >5 reads per million used for comparison among non-smokers, smokers and patients with COPD. (b) The pairwise comparisons showing differences in the expression of miRNAs among the non-smokers, smokers, and patients with COPD analyzed using the linear contrast in the DESeq2 RNA-seq differential analysis method are summarized in the form of a Venn diagram. Directionality of the differentially expressed miRNAs across two different comparisons are indicated by green (up-regulation) and red (down-regulation) colouring, and those that did not show similar directionality were shown in black (non-smokers vs. COPD and smokers vs. COPD). Selected miRNA targets significantly increased in non-smokers vs. smokers, non-smokers vs. COPD and smokers vs. COPD from RNA-seq analyses which correlate with qPCR validation using in vitro BEAS-2B cells control vs. CSE treatment were highlighted in a box and bolded (see )).
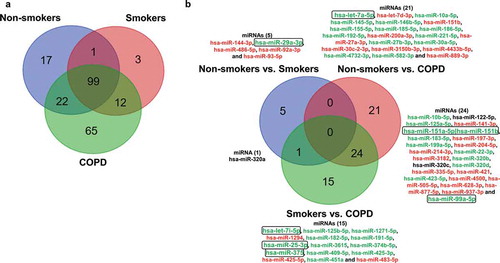
The most variable miRNAs were calculated based on the trimmed mean of M values (TMM) method using normalized miRNA counts across the non-smokers, smokers and patients with COPD groups. Normalized read counts were subjected to differential expression analysis by DESeq2, which displayed the change in miRNA expression between different pairwise comparisons. We found five differentially expressed miRNAs when we compared non-smokers vs. smokers ()). When we compared non-smokers vs. COPD, we found 21 miRNAs differentially expressed ()). Furthermore, when we compared smokers vs. COPD, we found 15 miRNAs differentially expressed ()). Only one miRNA was found in common that was differentially expressed between the non-smokers vs. smokers and smokers vs. COPD comparisons; 24 miRNAs were identified in common among the non-smokers vs. COPD and smokers vs. COPD comparisons, and none of the miRNAs were found in common among the three different pairwise comparisons shown in ). We analyzed the unique miRNAs in our study using the top 20 most abundant miRNAs identified among three comparison groups. Results revealed the presence of 17 miRNAs enriched in all three groups, 1 unique miRNA each in non-smokers and smokers group and 2 unique miRNAs in the patients with COPD group that were among the Top 20 abundant miRNAs ().
Table 4. Twenty most abundant miRNAs detected in plasma-derived EVs from non-smokers, smokers and patients with COPD.
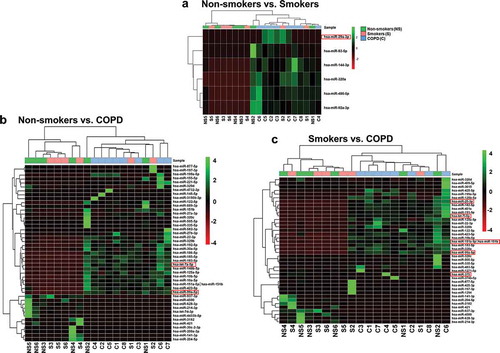
Heatmaps were generated using the pheatmap function in the pheatmap package in R 3.5.1. The Ward.D hierarchical clustering method was used to cluster samples and significant miRNAs. The clustering was based on Euclidean distance. We used linear contrast in the DESeq2 RNA-seq differential expression analysis controlled for 5% FDR using the Benjamini-Hochberg method for each pairwise comparison. Results revealed significant miRNAs differentially expressed in non-smokers vs. smokers, non-smokers vs. COPD and smokers vs. COPD pairwise comparisons were used for cluster analysis by the hierarchical clustering method. The identified candidate miRNAs in each pairwise comparison were selected by test statistics and p-values (with unadjusted raw p-value P < 0.05) (–)). Additionally, we also generated heatmaps and hierarchical cluster analysis in pairwise comparison using adjusted p-value P < 0.01 (Supplementary Figure 4(a,b)). Only six unique miRNAs were differentially expressed in non-smokers vs. COPD and smokers vs. COPD pairwise comparisons (Supplementary Table 2). We did not observe any miRNA candidates differentially expressed in non-smokers vs. smokers pairwise comparison using adjusted p-value.
Figure 4. Hierarchical cluster analysis of differentially expressed miRNAs.
(a) Heatmap clustering of the differentially expressed miRNAs significant among non-smokers vs. smokers groups. (b) Heatmap clustering of the differentially expressed miRNAs significant among non-smokers vs. COPD groups. (c) Heatmap clustering of the differentially expressed miRNAs significant among smokers vs. COPD groups. These miRNAs were identified based on individual pairwise comparisons (with unadjusted raw p-value; P < 0.05). The analysis was generated using Z scores of the most differentially expressed significant miRNAs. The dendrogram shows clustering of pairwise comparisons among the different groups (non-smokers vs. smokers, non-smokers vs. COPD and smokers vs. COPD). A few of the miRNA targets significantly increased in non-smokers vs. smokers, non-smokers vs. COPD and smokers vs. COPD from RNA-seq analyses that correlate with qPCR validation and NanoString using in vitro BEAS-2B cells control vs. CSE treatment were highlighted in a red box.
Comparison of tRNAs between non-smokers, smokers and patients with COPD
The combined raw read count data revealed a total of 25 distinct tRNAs identified from all three groups (non-smokers, smokers and patients with COPD). Upon analysing the average read counts in the three groups, we found six different tRNAs: tRNALys, tRNAGly, tRNACys, tRNAAla, tRNAGlu and tRNAVal to be the most abundant tRNA fragments among the 25 enriched in plasma-derived EV tRNAs identified in this study. The most variable tRNAs were calculated based on the trimmed mean of M values (TMM) method using normalized tRNA counts across the non-smokers, smokers and patients with COPD groups. Normalized read counts were subjected to differential expression analysis by DESeq2, which displayed the change in tRNA expression between different pairwise comparisons. We were unable to detect any unique tRNAs differentially expressed in non-smokers vs. smokers. We found five differentially expressed tRNAs when we compared non-smokers vs. COPD (two unique: tRNALys and tRNAGlu; three common tRNAGly, tRNATyr and tRNA) and in smokers vs. COPD groups (two unique: tRNALeu and tRNAMet; three common tRNAGly, tRNATyr and tRNA), and none of the tRNAs were found in common among the non-smokers vs. smokers, non-smokers vs. COPD and smokers vs. COPD pairwise comparisons (Supplementary Figure 5(a-c) and Supplementary Table 3).
Heatmaps were generated using the pheatmap function in the pheatmap package in R 3.5.1. The Ward.D hierarchical clustering method was used to cluster samples and enriched tRNAs. The clustering was based on Euclidean distance. We used linear contrast in the DESeq2 RNA-seq differential expression analysis controlled for 5% FDR using the Benjamini-Hochberg method for each pairwise comparison. Results revealed significant tRNAs differentially expressed in non-smokers vs. smokers, non-smokers vs. COPD and smokers vs. COPD pairwise comparisons used for cluster analysis by the hierarchical clustering method. The identified candidate tRNAs in each pairwise comparison were selected by test statistics and p-values (with both unadjusted raw p-value [P < 0.05] and adjusted p-value [P < 0.01]). Results revealed the presence of five tRNAs differentially expressed in non-smokers vs. COPD and smokers vs. COPD (two unique and three common) pairwise comparisons among the 25 enriched tRNAs. We did not observe any tRNA candidates differentially expressed in the non-smokers vs. smokers pairwise comparison using both the unadjusted as well as the adjusted p-value (Supplementary Figure 5(a-c) and Supplementary Table 3).
Comparison of piRNAs between non-smokers, smokers and patients with COPD
The combined raw read count data revealed a total of 34 distinct piRNAs identified from all the three groups (non-smokers, smokers and patients with COPD). Upon analyzing the average read counts in all the three groups, we found three different piRNAs: piR-016658, piR-016659 and piR-019825that were among the most abundant piRNAs among the 34 enriched in plasma-derived EV piRNAs identified in this study. The most variable piRNAs were calculated based on the trimmed mean of M values (TMM) method using normalized piRNA counts across the non-smokers, smokers and patients with COPD groups. Normalized read counts were subjected to differential expression analysis by DESeq2, which displayed the change in piRNA expression between different pairwise comparisons. We were unable to detect any unique piRNAs differentially expressed in non-smokers vs. smokers. We found one unique differentially expressed piRNA when we compared the non-smokers vs. COPD (piR-012753) and smokers vs. COPD (piR-016735) groups. Only one piRNA (piR-020813) was found in common that was differentially expressed between the non-smokers vs. smokers, non-smokers vs. COPD and smokers vs. COPD comparisons (Supplementary Figure 6(a-c) and Supplementary Table 4).
Heatmaps were generated using the pheatmap function in the pheatmap package in R 3.5.1. The Ward.D hierarchical clustering method was used to cluster samples and enriched piRNAs. The clustering was based on Euclidean distance. We used linear contrast in the DESeq2 RNA-seq differential expression analysis controlled for 5% FDR using the Benjamini-Hochberg method for each pairwise comparison. Results revealed significant piRNAs differentially expressed in non-smokers vs. smokers, non-smokers vs. COPD and smokers vs. COPD pairwise comparisons used for cluster analysis by the hierarchical clustering method. The identified candidate piRNAs in each pairwise comparison were selected by test statistics and p-values (adjusted p-value P < 0.01). Results revealed the presence of four piRNAs (one unique [piR-016735] and three common [piR-004153, piR-020813 and piR-020450]) differentially expressed in smokers vs. COPD when compared to non-smokers vs. smokers pairwise comparison among the 34 enriched piRNAs. We found two piRNAs (one unique: piR-012753 and one common: piR-020813) differentially expressed in non-smokers vs. COPD when compared to non-smokers vs. smokers and smokers vs. COPD pairwise comparisons (Supplementary Figure 6(a-c) and Supplementary Table 4).
Functional over-representation analysis (ORA) and gene set enrichment analysis (GSEA) of miRNAs
We performed functional over-representation analysis (ORA) and gene set enrichment analysis (GSEA) of differentially expressed miRNAs from pairwise comparisons (non-smokers vs. smokers, non-smokers vs. COPD and smokers vs. COPD) using miEAA, a web-based application. Over-representation analysis found significant enrichment of differentially expressed miRNAs from non-smokers vs. smokers that belong to the categories gene ontology (GO) and target genes (Supplementary Table 5). ORA of differentially expressed miRNAs from non-smokers vs. COPD identified significant enrichments that belong to categories such as pathways, gene ontology and diseases (Supplementary Table 5). ORA among non-smokers vs. COPD comparisons showed enrichment of smoking-mediated signalling pathways such as apoptosis signalling pathway, inflammation mediated by chemokine and cytokine signalling pathway, oxidative stress response, which are associated with respective gene ontology and diseases (Supplementary Table 5). Furthermore, ORA of smokers vs. COPD also revealed significant enrichment of miRNA targets that belongs to pathways, gene ontology and diseases similar to those observed in miRNAs differentially expressed among non-smokers vs. COPD comparison (Supplementary Table 5).
ORA based on published studies about miRNA profiles from peripheral blood under diseases category using differentially expressed miRNAs (non-smokers vs. COPD comparison) revealed enrichment of miRNAs up-regulated in COPD (hsa-miR-185-5p; hsa-miR-151a-5p; hsa-miR-183-5p; hsa-miR-192-5p; hsa-miR-27a-3p; hsa-let-7d-3p; hsa-miR-199a-5p; hsa-miR-197-3p; hsa-miR-145-5p; hsa-miR-204-5p) among the top subcategory along with other cancer-deregulated conditions (benign prostate hyperplasia, colon, and lung cancer, etc.) (Supplementary Table 5). These results from ORA in non-smokers vs. COPD pairwise comparison support 9 out of 10 dysregulated miRNAs that were either up-regulated (hsa-miR-185-5p; hsa-miR-183-5p; hsa-miR-192-5p; hsa-miR-199a-5p; hsa-miR-145-5p) or down-regulated (hsa-miR-27a-3p; hsa-let-7d-3p; hsa-miR-197-3p; hsa-miR-204-5p) among different pairwise comparisons ()).
Next, we performed GSEA using differentially expressed miRNAs from non-smokers vs. smokers pairwise comparison. We did not obtain any enrichment data due to a smaller number of differentially expressed miRNAs present between these comparisons. When we conducted GSEA using differentially expressed miRNAs from non-smokers vs. COPD, two categories (pathways and gene ontology) showed enrichment, as observed in ORA data analysis along with immune cells (CD19, CD3 and CD56) (Supplementary Table 6). We found novel pathways enriched in GSEA using differentially expressed miRNAs from smokers vs. COPD pairwise comparison. This includes p53 pathway feedback loops 2, miRNAs involved in DNA damage response (DDR), G1 to S cell cycle control, regulation of actin cytoskeleton and DNA damage response among the top five most enriched pathways (Supplementary Table 6).
miRNA database search/analysis
We performed database searches for the differentially expressed miRNAs from adjusted p-values that were significant between non-smoker vs. COPD (miR-151a-5p; miR-151b, miR-335-5p, miR-320d, miR-628-3p miR-877-5p and miR-937-3p) and smoker vs. COPD (miR-22-3p, miR-99a-5p, miR-320b, miR-320d, miR-877-5p and miR-937-3p) comparisons. EV miRNA, ExoCarta, Vesiclepedia and miRDB database searches confirmed that most of the identified miRNAs listed above were previously shown to be enriched/identified in either serum/plasma, cerebrospinal fluid, and/or colorectal cancer cell-derived exosomes/EVs. Additionally, a few of the miRNAs were also shown to be identified in urine and one among them in neuroblastoma cell-derived exosomes/EVs. The detailed summary of exosome/EV miRNA database searches and analyses is shown in Supplementary Table 7.
Validation of selected RNA-seq miRNAs by quantitative real-time PCR and nanostring analysis
We used human bronchial epithelial cells (BEAS-2B) with and without treatment of CSE (0.5%) for 3 days to isolate exosomes/EVs from conditioned media to validate selected miRNAs identified in RNA-seq analysis. We choose 11 different miRNAs (miR-let-7a-5p, miR-let-7i-5p, miR-29a-3p, miR-92a-3p, miR-99a-5p, miR-100-5p, miR-151b, miR-184, miR-375, miR-486-5p and miR-584-5p) based on their read counts. A few of them were among the 20 most abundant miRNAs differentially expressed and other miRNAs were identified in RNA-seq analysis from non-smokers, smokers and patients with COPD based on pairwise comparisons. The qPCR results showed that for 8 out of 11 miRNAs, the expression was significantly increased in CSE-derived exosomes from BEAS-2B cells compared to controls (). The remaining three miRNAs did not show a significant change in their exosomal miRNA expression levels between CSE vs. control groups ().
Figure 5. Validation of differentially expressed miRNAs using CSE-treated BEAS-2B cell-derived EVs.
Expression of selected miRNAs in human bronchial epithelial cell-derived EVs with and without treatment with 0.5% CSE for 3 days. Quantitative real-time PCR was performed using the EV RNA samples. Data are presented as 2^(–delta delta Ct) relative to 5S rRNA. Relative abundance of differentially expressed miRNAs in control vs. CSE treatment groups. Data are shown as means ± SEM (n = 5/group). **P < 0.01, ***P < 0.001, significant compared with control group.
Similarly, we used human monocyte cells (U937) with and without CSE (0.5%) for 3 days to isolate exosome/EVs from conditioned media to validate a few miRNAs identified in RNA-seq analysis. We choose 11 different miRNAs (miR-let-7a-5p, miRlet-7i-5p, miR-23b-3p, miR-25-3p, miR-29a-3p, miR-92a-3p, miR-99a-5p, miR-103a-3p, miR-128-3p, miR-151b and miR-375) based on their read counts. The qPCR analysis did not show significant changes in control vs. CSE-derived exosomes from U937 cells (Supplementary Figure 7). However, we found most of the exosomes derived from CSE-treated U937 cells showed a trend of reduced miRNA expression (miR-let-7a-5p, miR-let7i-5p, miR-103a-3p and miR-151b) (Supplementary Figure 7). Our data on CSE-mediated alterations in the enrichment of miRNAs packaged in exosomes by different cell-types (epithelial cells vs. monocytes) may play an important role in understanding cellular communication during disease progression. Several of the validated miRNAs targets from BEAS-2B CSE-derived exosomal miRNAs showed consistent differences when compared to miRNA data from RNA-sequencing (smokers and COPD groups compared to non-smokers), which supports the role of epithelial cell-derived exosomes in smoking-related chronic lung diseases. Our data suggests that a few of the systemic miRNA biomarkers (plasma-derived exosomal miRNAs) identified in smokers and patients with COPD have the potential to be novel circulating exosomal miRNA biomarkers.
An additional experiment was performed using BEAS-2B cells with and without CSE (0.5%) treatment for 3 days. Total RNA was isolated for miRNA profiling by NanoString to further validate miRNA targets identified in EV RNA-seq data analysis. The miRNA data from NanoString was normalized using a global normalization method that normalizes to total counts of the 100 most highly expressed miRNAs across the samples analyzed using nSolver analysis software 4.0. Hierarchical clustering was performed using normalized counts for selected miRNAs that show differential expression based on the ratio data (CSE vs. control) with P < 0.05 (Supplementary Figures 8,9). NanoString analysis revealed 13 miRNAs that were differentially expressed between the two groups. Five miRNAs were down-regulated (miR-574-5p, miR-575, miR-146a-5p, miR-320e and miR-181a-5p) and eight miRNAs were up-regulated (miR-15a-5p, miR-130a-3p, miR-19b-3p, miR-16-5p, miR-99a-5p, miR-30a-3p, miR-25-3p and miR-32-5p) in the CSE-treated group compared with the control (Supplementary Figures 8,9 and Supplementary Table 8). Notably, two miRNAs (miR-99a-5p and miR-25-3p) were among the 13 miRNAs found to be differentially expressed in CSE-treated group, as identified by NanoString, that confirm the directionality and abundance of miRNA expression as observed in patients with COPD (non-smokers vs. COPD and smokers vs. COPD) comparison from the RNA-seq analysis of plasma-derived EV miRNAs shown earlier.
Discussion
We know that EVs/exosomes contain proteins, mRNAs, and non-coding (ncRNAs) as a cause for mediating diverse cellular and biological processes via intercellular cell-cell communication between neighbouring vs. distant cells [Citation10–Citation12,Citation17]. Recently, small RNA sequence analyses from different bodily fluids such as blood, leukocytes, plasma, serum, saliva, cell-free saliva, urine and cell-free urine have provided evidence of the relative distribution of unique miRNAs, tRNAs and piRNAs [Citation26]. Next-generation sequencing (NGS) approaches such as small RNA-sequencing can be used as powerful tools to identify novel circulating exosomal miRNAs as biomarkers in the normal vs. diseased state. To date, no study has been conducted to identify the unique expression profiles and signatures of exosomal miRNAs from smokers and patients with COPD compared to healthy controls (non-smokers). We hypothesize that smoking and progression of chronic lung disease (i.e. COPD) can alter the composition and packaging of proteins, mRNA and ncRNAs in EVs/exosomes. In this study, we show for the first time, a comparative analysis of small RNAs based on RNA-sequencing analysis of human plasma-derived EVs, focusing on ncRNAs, specifically miRNAs that are differentially expressed in smokers and patients with COPD compared to non-smokers.
Prior reports have shown that miRNAs play an essential role in regulating gene expression in several different physiological and pathophysiological conditions [Citation11,Citation12]. Additionally, we know that dysregulation of various miRNAs in the airway epithelium, systemic circulation and lung tissues is involved in the pathogenesis of chronic inflammatory lung diseases, such as COPD [Citation8,Citation14,Citation38,Citation39]. In this study, we found that miRNAs are among the major biotypes distributed in plasma-derived exosomal RNAs that are differentially expressed in smokers and COPD compared to non-smokers. Comparative analysis revealed several common and unique miRNAs among different pairwise comparisons such as non-smokers vs. smokers, non-smokers vs. COPD and smokers vs. COPD groups ()). Differential expression analysis using DESeq2 revealed six distinct miRNAs significant in the non-smokers vs. smokers comparison (miR-486-5p, miR-92a-3p, miR-320a, miR-144-3p, miR-93-5p and miR-29a-3p). None of these six miRNA targets were significant after adjusting the p-values. This could be due to small sample size used for comparison between non-smokers vs. smokers group. Previously miR-486-5p and miR-144 (>2 fold increase) have been shown to be differentially expressed in lung tissues of COPD patients compared to smokers without COPD [Citation14].
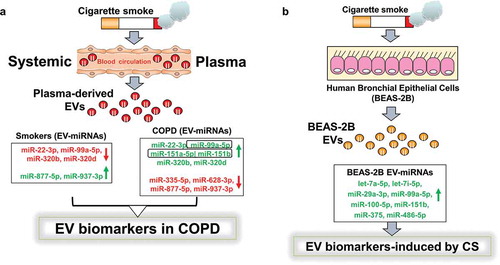
Figure 6. Schematic summary for the identified novel EV miRNA biomarkers from RNA-sequencing analysis and qPCR validation.
(a) We isolated EVs from plasma samples of human subjects (non-smokers, smokers and patients with COPD). Summary from RNA-seq analysis showed significant miRNAs up- or down-regulated in smokers vs. COPD and non-smokers vs. COPD pairwise comparisons. (b) Selected miRNAs were further validated using BEAS-2B cells treated with and without CSE (0.5%) for 3 days. Total RNA from BEAS-2B EVs was isolated and cDNAs prepared to validate miRNAs identified in RNA-seq analysis using qPCR. A few of the miRNA targets significantly increased in non-smokers vs. smokers, non-smokers vs. COPD and smokers vs. COPD from RNA-seq analyses that correlate with qPCR validation and NanoString using in vitro BEAS-2B cells control vs. CSE treatment were highlighted in a box and bolded (see )).
In another study, peripheral blood mononuclear cells (PBMCs) from patients with COPD compared to smokers showed up-regulation of eight miRNAs (miR-24-3p, miR-93-5p, miR-320a, miR-320b, miR-191-5p, let-7b-5p, miR-342-3p and miR-92a-3p) and down-regulation of three miRNAs (miR-3613-3p, miR-1273g-3p and miR-4668-5p) [Citation40]. miR-24-3p expression was consistently higher in monocytes; and smokers showed expression of miR-93-5p in monocytes, and CD4+ and CD8+ T cells and in monocytes from patients with COPD. Additionally, they showed CD8+ T cells were the major cell type responsible for increased expression of miR-320a and miR-320b in patients with COPD [Citation40]. It is possible that some of the differentially expressed miRNAs in the non-smokers vs. smokers comparison could be due to different cell types (T lymphocytes, B lymphocytes and monocytes) present in the blood of smokers that release EVs/exosomes enriched in the specific miRNAs identified in this study.
Differential expression analysis for non-smokers and COPD groups revealed 45 miRNAs significantly dysregulated, of which 6 miRNAs were found significant even after adjusting the p-value. Four miRNAs (miR-335-5p, miR-877-5p, miR-937-3p and miR-628-3p) were significantly down-regulated in patients with COPD compared to non-smokers ()). The remaining two miRNAs (miR-151a-5p and miR-320d) were up-regulated in COPD patients compared to non-smokers ()). Earlier report of miRNA expression in lungs from COPD patients compared with smokers without COPD showed significant down-regulation of miR-937 (<2 fold decrease) [Citation14]. Another report of PBMCs isolated from 12 patients with COPD (6 with severe disease and 6 with mild disease) that contained PiZZ (Glu342Lys) inherited alpha1-antitrypsin deficiency (AATD) show reduced expression of miR-335-5p in severe AATD patients [Citation41]. Even with the small sample size, identified miR-335-5p down-regulation was associated with 12 target genes involved in cytokine signalling, MAPK/mk2, JNK signalling cascades and angiogenesis in severe COPD-AATD compared with mild patients [Citation41].
Finally, based on a pairwise comparison of the smokers vs. COPD groups, 40 miRNAs were significantly dysregulated, of which 6 miRNAs were found significant after adjusting the p-value. Three of the miRNAs were common among the non-smokers vs. COPD comparison groups (miR-877-5p, miR-320d and miR-937-3p) and the same were identified significant in smokers vs. COPD comparison ()). In addition, three newly identified miRNAs among smokers vs. COPD comparison group are miR-22-3p, miR-99a-5p and miR-320b. Our data shows reduced expression of miR-99a-5p in smokers compared to COPD that correlated with previous report where they identified 28 differentially expressed miRNAs using bronchial airway epithelium from smokers vs. never smokers (n = 10/group) with the majority of them being down-regulated in smokers [Citation39]. Recently, using high-throughput miRNA microarray analysis in lung tissues from 10 COPD patients and 10 healthy controls, they have identified 341 differentially expressed miRNA in COPD compared to healthy controls, of which, miR-22-3p was one of 15 up-regulated miRNAs that was further validated by qPCR [Citation42]. Earlier report supports our findings that miR-320b expression was increased in PBMCs from COPD patients compared with smokers [Citation40].
Additionally, there are several candidate miRNAs that could potentially be used as novel circulating biomarkers if validated using larger sample sizes. This includes several miRNAs identified to be differentially expressed (up- or down-regulated) in patients with COPD and smokers compared to non-smokers (Supplementary Table 1). Previous reports from smokers and patients with COPD compared to healthy controls showed differential expression of miRNAs [Citation9,Citation13,Citation14,Citation39]. It is very difficult to compare data reported from different studies mainly due to different sample types used for the analysis of miRNAs such as serum/plasma, bronchoalveolar lavage fluid, and whole blood and lung tissues. Some additional parameters that may contribute to observed differences and overlap between studies are relatively small sample sizes, different platforms used for miRNA profiling and differential expression analysis methods including statistical analysis.
Here we highlighted some key reports that shared a few miRNAs differentially expressed in the non-smokers vs. COPD patients and smokers vs. COPD pairwise comparisons identified in this study. Earlier, plasma profiling of miRNAs revealed nine differentially expressed miRNAs in current smokers with COPD compared to healthy smokers (down-regulation: miR-29b, miR-483-5p, miR-152, miR-629, miR-26b, miR-101, miR-106b, miR-532-5p and miR-133b) [Citation43]. Using miRNA profiles from cell fractions of BAL fluid from 23 patients with COPD, 15 smokers and 1 ex-smoker without COPD revealed 10 miRNAs up-regulated (miR-15b, miR-132, miR-145, miR-212, miR-223, miR-342-5p, miR-422a, miR-423-5p, miR-425 and miR-486-3p) and 9 down-regulated (miR-29, miR-34a, miR-98, miR-146b-5p, miR-193a-5p, miR-218, miR-324-5p, miR-342-3p and miR-365) in the COPD group compared to smokers without COPD [Citation9]. Previous report on miR-199a-5p in patients with COPD showed a negative correlation with lung function (FEV1) but increased expression in lung tissues of COPD compared to non-smoking control group [Citation44]. The same miR-199a-5p was significantly reduced in Tregs from patients with COPD compared with smokers and healthy non-smokers (control) in another study [Citation45]. This demonstrates the importance of cell-type specific differences that may contribute to altered expression of miRNAs in patients with COPD. Another report showed involvement of miRNAs (up-regulated: miR-520e, miR-302d, miR-92a, miR-638, miR-211 and miR-150; down-regulated: let-7c, let-7d, let-7e, let-7f, miR-181c, miR-181d, miR-30a-3p, miR-30c, miR-30e-5p and miR-30e-3p) in emphysematous lesions in patient with COPD by combining measures from microarray and micro-computed tomography scans [Citation46].
Emerging reports of chronic lung diseases demonstrate the importance of using different bodily fluids/bio-specimens such as exhaled breath condensate (EBC) and sputum-derived exosomes for biomarker discovery in patients with chronic pulmonary diseases (e.g. Asthma and idiopathic pulmonary fibrosis) [Citation8,Citation47–Citation49]. In this study, we have validated a few selected miRNAs identified from RNA-seq analysis that were significantly up-regulated in smokers or patients with COPD by using exosomes isolated from BEAS-2B cells treated with and without CSE for 3 days. Out of 11 miRNAs selected for validation, 8 miRNAs (let-7a-5p, let-7i-5p, miR-29a-3p, miR-99a-5p, miR-100-5p, miR-151b, miR-375, miR-486-5p) were significantly increased in BEAS-2B-EVs confirmed by qPCR analysis ()). NanoString data from CSE-treated BEAS-2B cells in vitro confirmed the directionality and abundance of miR-99a-5p and miR-25-3p (up-regulation) as observed in RNA-seq analysis of plasma-derived EVs from patients with COPD. Of the 13 differentially expressed miRNAs identified by NanoString analysis, a few of these miRNAs (miR-99a-5p, miR-146a-5p, miR-30a-3p, miR-181a-5p, miR-15a-5p, miR-19b-3p and miR-130a-3p) have been reported to be dysregulated during smoking-related carcinogenesis, COPD and pulmonary fibrosis [Citation14,Citation50,Citation51]. Previous report has shown that miR-146a induction by cytokine ex vivo was reduced in fibroblasts from patients with COPD who smoke compared to smokers without COPD [Citation52]. In another report, the ratio of serum miR-21 to miR-181a was used as a predictive biomarker in asymptomatic heavy smokers [Citation53]. Additionally, when we validated a few of the exosomal miRNAs derived from CSE-treated U937 cells, 4 out of 11 miRNAs showed reduced expression compared to control. We found the directionality of exosomal miRNA expression was very different in human monocytes (trending towards down-regulation) and epithelial cells (up-regulated) treated with CSE compared to control. This demonstrates a cell-type-dependent enrichment of exosomal miRNAs during CSE-induced cellular stress in vitro.
We showed for the first time that plasma-derived EV miRNAs can be novel circulating biomarkers in smokers and patients with COPD using the next-generation sequencing approach. This will progress the idea of using RNA-sequencing approaches from different body fluids from chronic inflammatory lung diseases to identify EV biomarkers (miRNAs) that can be used for diagnosis, prognosis and therapeutics [Citation8,Citation54]. Future studies will explore how these novel EV miRNA biomarkers can be further validated using in vitro (using different lung cell types) and in vivo (susceptible mouse) models of chronic lung diseases. We are aware that our study has some limitations such as low sample sizes in different groups for comparison. QC metrics were significantly different between groups including input, filter, reads used, genome, genecode sense, and not mapped. This could be due to the small sample size; we were unable to include them in the generalized linear model (GLM) to adjust for covariate, as we would have an overfitting issue and unstable estimates if we included those variables in the model. We hope the normalization step before our DE analysis mitigates some of these differences. We have performed the RNA-seq analysis in batches (using Miseq and Next-seq 500 Illumina platforms) and combined the data for overall analysis and interpretation. In the future, we plan to conduct RNA-seq analysis from multiple cohorts for comparison and validation of the data and increase the sample sizes based on power calculations before we conduct similar high-throughput EV-based miRNA biomarker analysis. We have identified a few novel miRNAs differentially expressed in smokers and patients with COPD from relatively small sample sizes, which need further validation. We provided some validation of significantly increased miRNAs identified using in vitro (BEAS-2B or U937-EVs) cell culture-based experiments followed by qPCR analysis.
Additionally, we performed differential expression analysis for transfer RNA-derived RNAs (tDRs) and Piwi-interacting RNAs (piRNAs) based on the next most abundant small RNA species enriched in plasma-derived EVs from this study. We found five tRNAs differentially expressed (tRNALys, tRNAGly, tRNATyr, tRNAGlu and tRNA) in non-smokers vs. COPD and five tRNAs (tRNAGly, tRNATyr, tRNALeu, tRNA and tRNAMet) in smokers vs. COPD pairwise comparison among the 25 enriched tRNAs. Despite the variation in the percentage tRNA sense read counts among the three groups (non-smokers, smokers and patients with COPD), we still found a few differentially expressed tRNAs from the RNA-sequencing data. tRNA-derived fragments (tRFs) and miRNAs are synthesized/produced as a result of different stress responses. Prior report shows tRFs are generated in a Dicer-dependent manner [Citation55]. tRFs synthesized by Dicer cleavage of tRNAGly have been shown to modulate DNA damage response and proliferation in B cell lymphoma [Citation56]. The exact mechanism by which tRFs are produced remains unclear. Additionally, a novel class of tRFs derived from tRNAGlu, tRNAAsp, tRNAGly and tRNATyr shows tumour suppression by blocking the transcription of multiple oncogenes in breast cancer cells via displacing their 3ʹUTRs from RNA-binding protein (YBX1: Y-box binding protein 1) [Citation57]. Evidence from the literature suggests that tRFs suppress the translation of target genes thereby regulating target gene expression in a way similar to miRNAs [Citation58].
Differential expression analysis revealed three piRNAs (piR-004153, piR-020813 and piR-020450) in non-smokers vs. smokers, two piRNAs (piR-012753 and piR-020813) in non-smokers vs. COPD and four piRNAs (piR-004153, piR-020813, piR-020450 and piR-016735) in smokers vs. COPD pairwise comparison among the 34 enriched piRNAs. Despite the lesser variation in the percentage of piRNA sense read counts among the three groups (non-smokers, smokers and patients with COPD), we still found a few differentially expressed piRNAs from the RNA-sequencing data. piR-004153 has been reported as a serum piRNA signature for a non-invasive diagnostic and prognostic biomarker in colorectal cancer that was significantly down-regulated [Citation59]. A piR disease database search revealed piR-020450 is down-regulated in breast, liver and ovarian cancers (http://piwirna2disease.org/) [Citation60]. Previous findings showed differential regulation of piR-016735 in endometrial cancer (up-regulation) and breast cancer (down-regulation), respectively [Citation61,Citation62]. However, nothing is explored in terms of tRFs or piRNAs in plasma-derived EVs from smoking-related chronic inflammatory lung diseases. We did not perform a thorough analysis of other biotypes, such as snRNAs and snoRNAs in this report. Future studies will identify other differentially expressed small RNA enriched biotypes. Additionally, we will validate identified ncRNA biomarkers from non-smokers, smokers and patients with COPD groups with larger sample sizes along with correlation analyses such as age and sex-matched groups, smoking history (pack years) and lung function.
In summary, we have taken efforts to isolate and characterize plasma-derived EVs/exosomes from non-smokers, smokers and patients with COPD. We employed small RNA-sequencing analysis to identify the enrichment of ncRNA classes, such as miRNAs, tRNA, lincRNA, piRNAs snRNAs snoRNAs and other biotypes. We specifically focused on miRNAs, tRNAs and piRNAs for differential expression (DESeq2) and miRNAs alone for further analysis including validation. miRNAs that showed significant changes between different pairwise comparisons were selected and further validated by qPCR analysis using EVs and in total RNA from control vs. CSE-treated BEAS-2B cells by human miRNA panel using NanoString technology. Gene set enrichment analysis revealed several targets that play crucial roles in biological pathways that regulate cytokine signalling (inflammation), extracellular matrix and tissue remodelling in smokers and patients with COPD. Future studies are ongoing to identify EV biomarkers using different body fluids such as serum/plasma vs. BAL fluid vs. urine from non-smokers, smokers and patients with COPD to find possible correlations between local vs. systemically circulating EV biomarkers of disease.
Supplemental Material
Download Zip (10.9 MB)Acknowledgments
This study was supported in part by the University of Rochester’s Lung Biology Strategic Plan - Pilot Project (IKS) and the National Institute of Health NIH 2R01HL085613, HL137738, HL135613, and ES028006 (IR). Dr Li’s effort is in part supported by the University of Rochester CTSA award number UL1 TR002001 from the National Center for Advancing Translational Sciences of the National Institutes of Health. Authors would like to thank Ms Daria Krenitsky and Dr Krishna Maremanda for their technical help and Ms Samantha R. McDonough, BS for her help in editing the manuscript.
Author contributions
IKS and IR: conceived and designed the experiments; IKS: conducted the experiments; IKS and DL: performed data analysis; IKS: wrote the manuscript; IKS, DL, and IR: edited the manuscript.
Conflicting interests
The authors have declared that no conflict of interest exists.
Supplementary material
The supplementary material for this article can be accessed here.
Additional information
Funding
Related Research Data
References
- Hogg JC, Timens W. The pathology of chronic obstructive pulmonary disease. Annu Rev Pathol. 2009;4:435–21. PubMed PMID: 18954287. .
- Pouwels SD, Heijink IH, Ten Hacken NH, et al. DAMPs activating innate and adaptive immune responses in COPD. Mucosal Immunol. 2014 Mar;7(2):215–226. PubMed PMID: 24150257.
- Kumar M, Seeger W, Voswinckel R. Senescence-associated secretory phenotype and its possible role in chronic obstructive pulmonary disease. Am J Respir Cell Mol Biol. 2014 Sep;51(3):323–333. PubMed PMID: 25171460. .
- Yao H, Rahman I. Current concepts on oxidative/carbonyl stress, inflammation and epigenetics in pathogenesis of chronic obstructive pulmonary disease. Toxicol Appl Pharmacol. 2011 Jul 15;254(2):72–85. PubMed PMID: 21296096; PubMed Central PMCID: PMCPMC3107364. .
- Sundar IK, Yao H, Rahman I. Oxidative stress and chromatin remodeling in chronic obstructive pulmonary disease and smoking-related diseases. Antioxid Redox Signal. 2013 May 20;18(15):1956–1971. PubMed PMID: 22978694; PubMed Central PMCID: PMCPMC3624634. .
- Lerner CA, Sundar IK, Rahman I. Mitochondrial redox system, dynamics, and dysfunction in lung inflammaging and COPD. Int J Biochem Cell Biol. 2016 Dec;81(Pt B):294–306. PubMed PMID: 27474491; PubMed Central PMCID: PMCPMC5154857. .
- Stolzenburg LR, Harris A. The role of microRNAs in chronic respiratory disease: recent insights. Biol Chem. 2018 Feb 23;399(3):219–234. PubMed PMID: 29148977.
- De Smet EG, Mestdagh P, Vandesompele J, et al. Non-coding RNAs in the pathogenesis of COPD. Thorax. 2015 Aug;70(8):782–791. PubMed PMID: 25995155.
- Molina-Pinelo S, Pastor MD, Suarez R, et al. MicroRNA clusters: dysregulation in lung adenocarcinoma and COPD. Eur Respir J. 2014 Jun;43(6):1740–1749. PubMed PMID: 24743967.
- Hough KP, Chanda D, Duncan SR, et al. Exosomes in immunoregulation of chronic lung diseases. Allergy. 2017 Apr;72(4):534–544. PubMed PMID: 27859351; PubMed Central PMCID: PMCPMC5462600.
- Yanez-Mo M, Siljander PR, Andreu Z, et al. Biological properties of extracellular vesicles and their physiological functions. J Extracell Vesicles. 2015;4:27066. PubMed PMID: 25979354; PubMed Central PMCID: PMCPMC4433489. .
- Nana-Sinkam SP, Acunzo M, Croce CM, et al. Extracellular vesicle biology in the pathogenesis of lung disease. Am J Respir Crit Care Med. 2017 Dec 15;196(12):1510–1518. PubMed PMID: 28678586; PubMed Central PMCID: PMCPMC5754438.
- Osei ET, Florez-Sampedro L, Timens W, et al. Unravelling the complexity of COPD by microRNAs: it’s a small world after all. Eur Respir J. 2015 Sep;46(3):807–818. 10.1183/13993003.02139-2014. PubMed PMID: 26250493.
- Ezzie ME, Crawford M, Cho JH, et al. Gene expression networks in COPD: microRNA and mRNA regulation. Thorax. 2012 Feb;67(2):122–131. PubMed PMID: 21940491.
- Shen Y, Yu X, Zhu L, et al. Transfer RNA-derived fragments and tRNA halves: biogenesis, biological functions and their roles in diseases. J Mol Med (Berl). 2018 Nov;96(11):1167–1176. 10.1007/s00109-018-1693-y. PubMed PMID: 30232504.
- Sun T, Han X. The disease-related biological functions of PIWI-interacting RNAs (piRNAs) and underlying molecular mechanisms. ExRNA. 2019;1(1):21.
- Fujita Y, Kosaka N, Araya J, et al. Extracellular vesicles in lung microenvironment and pathogenesis. Trends Mol Med. 2015 Sep;21(9):533–542. PubMed PMID: 26231094.
- Gould SJ, Raposo G. As we wait: coping with an imperfect nomenclature for extracellular vesicles. J Extracell Vesicles. 2013;2. PubMed PMID: 24009890; PubMed Central PMCID: PMCPMC3760635. DOI:10.3402/jev.v2i0.20389.
- Colombo M, Raposo G, Thery C. Biogenesis, secretion, and intercellular interactions of exosomes and other extracellular vesicles. Annu Rev Cell Dev Biol. 2014;30:255–289. PubMed PMID: 25288114. .
- Abels ER, Breakefield XO. Introduction to extracellular vesicles: biogenesis, RNA cargo selection, content, release, and uptake. Cell Mol Neurobiol. 2016 Apr;36(3):301–312. PubMed PMID: 27053351; PubMed Central PMCID: PMCPMC5546313.
- Clayton A, Buschmann D, Byrd JB, et al. Summary of the ISEV workshop on extracellular vesicles as disease biomarkers, held in Birmingham, UK, during December 2017. J Extracell Vesicles. 2018;7(1):1473707.
- Tan DBA, Armitage J, Teo TH, et al. Elevated levels of circulating exosome in COPD patients are associated with systemic inflammation. Respir Med. 2017 Nov;132:261–264. PubMed PMID: 28476471.
- Sundar IK, Yao H, Huang Y, et al. Serotonin and corticosterone rhythms in mice exposed to cigarette smoke and in patients with COPD: implication for COPD-associated neuropathogenesis. PloS One. 2014;9(2):e87999. PubMed PMID: 24520342; PubMed Central PMCID: PMC3919731. .
- Sundar IK, Li D, Rahman I. Proteomic analysis of plasma-derived extracellular vesicles in smokers and patients with chronic obstructive pulmonary disease. ACS Omega. 2019;4(6):10649–10661.
- Mateescu B, Kowal EJ, van Balkom BW, et al. Obstacles and opportunities in the functional analysis of extracellular vesicle RNA - an ISEV position paper. J Extracell Vesicles. 2017;6(1):1286095. PubMed PMID: 28326170; PubMed Central PMCID: PMCPMC5345583. .
- El-Mogy M, Lam B, Haj-Ahmad TA, et al. Diversity and signature of small RNA in different bodily fluids using next generation sequencing. BMC Genomics. 2018 May 29;19(1):408. PubMed PMID: 29843592; PubMed Central PMCID: PMCPMC5975555.
- Thery C, Amigorena S, Raposo G, et al. Isolation and characterization of exosomes from cell culture supernatants and biological fluids. In: Bonifacino JS, et al., editor. Current protocols in cell biology/editorial board; 2006 Apr. p. 22. Chapter 3: Unit3 PubMed PMID: 18228490. doi:10.1002/0471143030.cb0322s30.
- Gardiner C, Ferreira YJ, Dragovic RA, et al. Extracellular vesicle sizing and enumeration by nanoparticle tracking analysis. J Extracell Vesicles. 2013;2:19671. PubMed PMID: 24009893; PubMed Central PMCID: PMC3760643. .
- Hong CS, Funk S, Muller L, et al. Isolation of biologically active and morphologically intact exosomes from plasma of patients with cancer. J Extracell Vesicles. 2016;5:29289. PubMed PMID: 27018366; PubMed Central PMCID: PMCPMC4808740. .
- Consortium E-T, Van Deun J, Mestdagh P, et al. EV-TRACK: transparent reporting and centralizing knowledge in extracellular vesicle research. Nat Methods. 2017 Feb 28;14(3):228–232. PubMed PMID: 28245209.
- Subramanian SL, Kitchen RR, Alexander R, et al. Integration of extracellular RNA profiling data using metadata, biomedical ontologies and Linked Data technologies. J Extracell Vesicles. 2015;4:27497. PubMed PMID: 26320941; PubMed Central PMCID: PMCPMC4553261. .
- Kalra H, Simpson RJ, Ji H, et al. Vesiclepedia: a compendium for extracellular vesicles with continuous community annotation. PLoS Biol. 2012;10(12):e1001450. PubMed PMID: 23271954; PubMed Central PMCID: PMCPMC3525526. .
- Keerthikumar S, Chisanga D, Ariyaratne D, et al. ExoCarta: a web-based compendium of exosomal cargo. J Mol Biol. 2016 Feb 22;428(4):688–692. PubMed PMID: 26434508; PubMed Central PMCID: PMCPMC4783248. .
- Wong N, Wang X. miRDB: an online resource for microRNA target prediction and functional annotations. Nucleic Acids Res. 2015 Jan;43(D1):D146–52. PubMed PMID: 25378301; PubMed Central PMCID: PMCPMC4383922.
- Robinson MD, Oshlack A. A scaling normalization method for differential expression analysis of RNA-seq data. Genome Biol. 2010;11(3):R25. PubMed PMID: 20196867; PubMed Central PMCID: PMCPMC2864565. .
- Love MI, Huber W, Anders S. Moderated estimation of fold change and dispersion for RNA-seq data with DESeq2. Genome Biol. 2014;15(12):550. PubMed PMID: 25516281; PubMed Central PMCID: PMCPMC4302049. .
- Backes C, Khaleeq QT, Meese E, et al. miEAA: microRNA enrichment analysis and annotation. Nucleic Acids Res. 2016 Jul 8;44(W1):W110–6. PubMed PMID: 27131362; PubMed Central PMCID: PMCPMC4987907.
- Akbas F, Coskunpinar E, Aynaci E, et al. Analysis of serum micro-RNAs as potential biomarker in chronic obstructive pulmonary disease. Exp Lung Res. 2012 Aug;38(6):286–294. PubMed PMID: 22686440.
- Schembri F, Sridhar S, Perdomo C, et al. MicroRNAs as modulators of smoking-induced gene expression changes in human airway epithelium. Proc Natl Acad Sci U S A. 2009 Feb 17;106(7):2319–2324. PubMed PMID: 19168627; PubMed Central PMCID: PMCPMC2650144.
- Dang X, Qu X, Wang W, et al. Bioinformatic analysis of microRNA and mRNA regulation in peripheral blood mononuclear cells of patients with chronic obstructive pulmonary disease. Respir Res. 2017 Jan 5;18(1):4. PubMed PMID: 28057018; PubMed Central PMCID: PMCPMC5217451.
- Esquinas C, Janciauskiene S, Gonzalo R, et al. Gene and miRNA expression profiles in PBMCs from patients with severe and mild emphysema and PiZZ alpha1-antitrypsin deficiency. Int J Chron Obstruct Pulmon Dis. 2017;12:3381–3390. PubMed PMID: 29238183; PubMed Central PMCID: PMCPMC5713702. .
- Shen Z, Tang W, Guo J, et al. miR-483-5p plays a protective role in chronic obstructive pulmonary disease. Int J Mol Med. 2017 Jul;40(1):193–200. PubMed PMID: 28534971.
- Soeda S, Ohyashiki JH, Ohtsuki K, et al. Clinical relevance of plasma miR-106b levels in patients with chronic obstructive pulmonary disease. Int J Mol Med. 2013 Mar;31(3):533–539. PubMed PMID: 23338559.
- Mizuno S, Bogaard HJ, Gomez-Arroyo J, et al. MicroRNA-199a-5p is associated with hypoxia-inducible factor-1alpha expression in lungs from patients with COPD. Chest. 2012 Sep;142(3):663–672. PubMed PMID: 22383663; PubMed Central PMCID: PMCPMC3435138.
- Chatila WM, Criner GJ, Hancock WW, et al. Blunted expression of miR-199a-5p in regulatory T cells of patients with chronic obstructive pulmonary disease compared to unaffected smokers. Clin Exp Immunol. 2014 Jul;177(1):341–352. PubMed PMID: 24634990; PubMed Central PMCID: PMCPMC4089184.
- Christenson SA, Brandsma CA, Campbell JD, et al. miR-638 regulates gene expression networks associated with emphysematous lung destruction. Genome Med. 2013;5(12):114. PubMed PMID: 24380442; PubMed Central PMCID: PMCPMC3971345.
- Sinha A, Yadav AK, Chakraborty S, et al. Exosome-enclosed microRNAs in exhaled breath hold potential for biomarker discovery in patients with pulmonary diseases. J Allergy Clin Immunol. 2013 Jul;132(1):219–222. PubMed PMID: 23683467.
- Njock MS, Guiot J, Henket MA, et al. Sputum exosomes: promising biomarkers for idiopathic pulmonary fibrosis. Thorax. 2018 Sep 22. PubMed PMID: 30244194. DOI:10.1136/thoraxjnl-2018-211897.
- Sanchez-Vidaurre S, Eldh M, Larssen P, et al. RNA-containing exosomes in induced sputum of asthmatic patients. J Allergy Clin Immunol. 2017 Nov;140(5):1459–1461 e2. PubMed PMID: 28629752.
- Bagnato G, Roberts WN, Roman J, et al. A systematic review of overlapping microRNA patterns in systemic sclerosis and idiopathic pulmonary fibrosis. Eur Respir Rev. 2017 Sep;26(144):160125. PubMed PMID: WOS:000412288100012; English.
- Fujii T, Shimada K, Nakai T, et al. MicroRNAs in smoking-related carcinogenesis: biomarkers, Functions, and Therapy. J Clin Med. 2018 May 7;(5):98. PubMed PMID: WOS:000435194400011; English. DOI:10.3390/jcm7050098.
- Sato T, Liu XD, Nelson A, et al. Reduced miR-146a increases prostaglandin E-2 in chronic obstructive pulmonary disease fibroblasts. Am J Respir Crit Care Med. 2010 Oct 15;182(8):1020–1029. PubMed PMID: WOS:000283384000008; English.
- Xie LH, Wu MH, Lin H, et al. An increased ratio of serum miR-21 to miR-181a levels is associated with the early pathogenic process of chronic obstructive pulmonary disease in asymptomatic heavy smokers. Mol Biosyst. 2014;10(5):1072–1081. PubMed PMID: WOS:000333581100010; English. .
- Hu G, Drescher KM, Chen XM. Exosomal miRNAs: biological properties and therapeutic potential. Front Genet. 2012;3:56. PubMed PMID: 22529849; PubMed Central PMCID: PMCPMC3330238. .
- Kumar P, Anaya J, Mudunuri SB, et al. Meta-analysis of tRNA derived RNA fragments reveals that they are evolutionarily conserved and associate with AGO proteins to recognize specific RNA targets. BMC Biol. 2014 Oct;1(12):78. PubMed PMID: 25270025; PubMed Central PMCID: PMCPMC4203973. .
- Maute RL, Schneider C, Sumazin P, et al. tRNA-derived microRNA modulates proliferation and the DNA damage response and is down-regulated in B cell lymphoma. Proc Natl Acad Sci U S A. 2013 Jan 22;110(4):1404–1409. PubMed PMID: 23297232; PubMed Central PMCID: PMCPMC3557069.
- Goodarzi H, Liu X, Nguyen HC, et al. Endogenous tRNA-derived fragments suppress breast cancer progression via YBX1 displacement. Cell. 2015 May 7;161(4):790–802. PubMed PMID: 25957686; PubMed Central PMCID: PMCPMC4457382.
- Li S, Xu Z, Sheng J. tRNA-derived small RNA: a novel regulatory small non-coding RNA. Genes (Basel). 2018 May 10;9(5):246. PubMed PMID: 29748504; PubMed Central PMCID: PMCPMC5977186. .
- Qu AL, Wang WF, Yang YM, et al. A serum piRNA signature as promising non-invasive diagnostic and prognostic biomarkers for colorectal cancer. Cancer Manag Res. 2019;11:3703–3720. PubMed PMID: WOS:000467153800001; English. .
- Muhammad A, Waheed R, Khan NA, et al. piRDisease v1.0: a manually curated database for piRNA associated diseases. Database (Oxford). 2019 Jan;1. DOI:10.1093/database/baz052. PubMed PMID: 31267133; PubMed Central PMCID: PMCPMC6606758.
- Krishnan P, Ghosh S, Graham K, et al. Piwi-interacting RNAs and PIWI genes as novel prognostic markers for breast cancer. Oncotarget. 2016 Jun 21;7(25):37944–37956. PubMed PMID: WOS:000378229100042; English.
- Ravo M, Cordella A, Rinaldi A, et al. Small non-coding RNA deregulation in endometrial carcinogenesis. Oncotarget. 2015 Mar 10;6(7):4677–4691. PubMed PMID: WOS:000352792000011; English.