
ABSTRACT
Background: In 2001, we studied the presence and coagulant properties of “microparticles” in the blood of healthy humans. Since then, multiple improvements in detection, isolation and functional characterization of the now called “extracellular vesicles” (EVs) have been made, and shortcomings were identified. Aim: To revisit the presence and function of EVs in blood from healthy humans. Methods: Blood was collected from 20 healthy donors. EV-containing plasma was prepared according to new guidelines, and plasma was diluted to prevent swarm detection. Single EVs were measured by flow cytometry with known sensitivity of fluorescence and light scatter. The haemostatic properties of EVs were measured by thrombin-, fibrin-, and plasmin generation. Plasma concentrations of thrombin-antithrombin complexes and prothrombin fragment 1 + 2 were measured to assess the coagulation status in vivo. Results: Compared to 2001, the total concentrations of detected EVs increased from 190- to 264-fold. In contrast to 2001, however, EVs are non-coagulant which we show can be attributed to improvements in blood collection and plasma preparation. No relation is present between the plasma concentrations of EVs and either TAT or F1 + 2. Finally, we show that EVs support plasmin generation. Discussion: Improvements in blood collection, plasma preparation and detection of EVs reveal that results from earlier studies have to be interpreted with care. Compared to 2001, higher concentrations of EVs are detected in blood of healthy humans which promote fibrinolysis rather than coagulation.
Introduction
At present, the number of publications on extracellular vesicles (EVs) is growing exponentially. In 2001, we published a manuscript entitled “Cell-derived microparticles circulate in healthy humans and support low grade thrombin generation”. At that time, “microparticles” were measured by flow cytometry [Citation1]. Although we and others were aware that we were using an instrument developed to measure single cells and not “microparticles”, to which extent the sensitivity of our instrument hampered our EV measurements was completely “terra incognita”. Although our old manuscript is still being cited, in total 438 citations in Web of Science and 638 citations in Google Scholar since 2001 (9 May 2019), the greatly improved understanding of detection of single EVs by flow cytometry, combined with the development of dedicated protocols for blood collection and handling, made us to reconsider our earlier findings.
In 2001, the term “microparticles” was used for “larger” extracellular vesicles (EVs), supposedly released directly from the plasma membrane as “ectosomes”. These larger EVs were considered to be the “tip of the iceberg” because the true size of the iceberg, that is all EVs including those below the detection limit, was unknown. In 2014, Brisson and co-workers reported the first size distribution of all EVs in normal human plasma, and thus for the very first time they showed the true size of the iceberg [Citation2]. Importantly, they showed that the size distribution of EVs is a continuum, and that most EVs have a diameter of less than 300 nm.
In 2001, the sensitivity of flow cytometers to detect EVs was unknown. In the latest standardization study on the concentration of EVs measured by flow cytometry, still one in three flow cytometers failed to detect any EVs, and most detected <1% of all EVs present. In fact, only a very few dedicated flow cytometers are capable of detecting a substantial fraction of all EVs present [Citation3]. Thus, with hindsight, most if not all of the earlier flow cytometry results should be interpreted with caution [Citation4].
Finally, blood collection and handling procedures have been a major confounder in the earlier studies on the presence and functional activity of EVs. For example, in 2001, platelet-poor plasma was used to study the coagulation properties of EVs. The current ISTH guidelines on plasma EVs, however, recommend the use of platelet-depleted plasma because platelet-poor plasma still contains a considerable number of residual platelets which may affect both the detection of “platelet-derived EVs” as well as their supposed coagulant properties.
Taken together, we revisited the presence and haemostatic function of EVs in plasma of healthy humans, and explain the discrepancies between our earlier and present findings.
Materials and methods
Reagents and assays
CD14-APC (clone 61D3) was obtained from eBioscience (San Diego, CA), CD41-FITC (clone HIP8) and CD45-APC (clone HI30) from BioLegend (San Diego, CA), CD61-APC (clone Y2/51) and CD235a-FITC (clone JC159) from Dako (Glostrup, Denmark), CD66b-FITC (clone 80H3) from Beckman Coulter Inc. (Marseille, France), CD62E-PE (clone 68-5H11), CD142-PE (clone HTF-1), IgG1-PE (clone X40), IgG1-FITC (clone X40) and IgG1-APC (clone MOPC-21) from BD Biosciences (San Jose, CA). Bovine Lactadherin-FITC is from Haematologic Technologies Inc. (Essex Junction, VT). Reptilase was obtained from Roche (Mannheim, Germany) and the chromogenic substrate S2238 from Chromogenix AB (Mölndal, Sweden). The plasma concentrations of prothrombin fragment 1 + 2 (Enzygnost F1 + 2 monoclonal kit) and thrombin-antithrombin complexes (Enzygnost TAT micro kit) were determined by ELISA as described by the manufacturer Siemens (Marburg, Germany). Dade Innovin (contained recombinant tissue factor) was from Siemens (Newark, NJ), and Synthasil (contained synthetic phospholipids) from Instrument Laboratory (Bedford, MA).
Blood collection
Venous blood (blood/citrate ratio 9:1) was collected from 20 healthy individuals (10 males) in 0.109 mol/L trisodium-citrate (Becton Dickinson, San Jose, CA) with informed consent and as approved by the medical ethical committee of the Amsterdam UMC (W18-289-18335). Platelet-depleted plasma was prepared by two consecutive centrifugation steps for 20 min at 1560g at room temperature, first the blood and then the plasma layer, to prepare platelet-depleted plasma. The plasma was aliquoted, snap-frozen with liquid nitrogen for 15 min and stored at −80°C until use. Our procedure to prepare platelet-depleted plasma differs slightly from the protocol of Lacroix et al. [Citation5], which will be discussed in the Discussion section.
Flow cytometry analysis
Plasma was thawed for 1 min at 37°C. To avoid swarm detection, the plasma was diluted 4 to 200-fold to 5000 events/s with PBS/citrate buffer (1.45 mmol/L phosphate, 154 mmol/L sodium chloride and 10.9 mmol/L trisodium-citrate; pH 7.4, 0.05 µm filtered). The dilution was donor dependent. Before labelling, the antibodies were centrifuged at 18,900g for 5 min at 4°C to remove antibody aggregates. To establish the cellular origin or exposure of phosphatidylserine (PS) of EVs, 20 µL diluted plasma was incubated with 2.5 µL antibodies of interest or PS binding agent. After addition of antibodies, EV-containing samples were incubated in the dark for 2 h at 20°C. Subsequently, the labelling was stopped by the addition of 200 µL citrate-PBS buffer followed by detection of EVs using an Apogee A60 Micro Flow Cytometer (Apogee Flow Systems, Hertfordshire, UK). Samples were analysed for 2 min with a flow rate of 3.01 µL/minute. The trigger was set on Large Angle Light Scattering (LALS) at 14 and the voltages for 405-Small Angle Light Scatter (SALS), 405-LALS, 638-D Red, 488-Green, 488-Orange were set at 380, 375, 510, 520 and 520, respectively. Because we demonstrated recently that light scatters triggering outperforms triggering on generic dye fluorescence of EVs in plasma on our current flow cytometer, we used light scatter rather than fluorescence triggering [Citation6]. Data were analysed with software FlowJo (Version 10, FlowJo LLC, Ashland, OR). The fluorescence gate was set on IgG control samples. To estimate the number of EVs/L plasma, the number of vesicles (N) found in the upper and lower right quadrant of the flow cytometry analysis was used in the formula: Number/L = N x [60/time measurement] x [total volume/flowrate] x [106/volume sample] x dilution sample.
Coagulation
We used two assays to measure the ability of EVs to promote coagulation. The first assay is the thrombin generation test (TGT), which was also used in 2001 [Citation1]. In this assay, thrombin generation is monitored in reptilase-treated and thus defibrinated “EV-depleted” pooled plasma using a chromogenic substrate. In brief, 20 µL of isolated EVs (10-fold concentrated) was reconstituted in defibrinated, pooled plasma from healthy volunteers (“EV-depleted”; 30 min centrifuged by 18,890 x g at 20°C). It should be mentioned that due to the limited sensitivity of flow cytometry in 2001, we called this “EV-depleted plasma”. However, as shown recently for foetal calf serum [Citation7,Citation8], most small EVs cannot be removed from plasma or serum by (ultra) centrifugation. To this plasma (120 µL), either EVs, Innovin (50-fold diluted; 6.1 pmol/mL final concentration) or Synthasil (fivefold diluted before use) were added, the last two to initiate the extrinsic or intrinsic coagulation, respectively (20 µL). At t = 0, thrombin generation was triggered by addition of 30 µL CaCl2 (16.7 mmol/L final concentration). At fixed intervals after t = 0, 3 µL aliquots were removed from this mixture and added to 147 µL prewarmed (37°C) chromogenic substrate S2238. After 3 min, the conversion of S2238 was stopped by the addition of 90 µL citric acid (1 mol/L) and the generated amount of p-nitroaniline was determined at λ = 405 nm.
The second coagulation assay is the fibrin generation test (FGT), which was performed as described earlier [Citation9]. In brief, 90 µL platelet-depleted plasma from healthy volunteers with 6 µL saline was incubated for 5 min at 37°C. After recalcification (15 µL), the half time to reach maximal fibrin formation (½OD max) was recorded by measuring the optical density (λ = 405 nm; SPECTRAmax microplate reader, Molecular Devices, San Jose, CA). In control experiments, 3 µL Innovin (50-fold diluted) or Synthasil (fivefold diluted) were added to 90 µL of EV-depleted normal plasma.
Fibrinolysis
The plasmin generation capacity of the EVs was assessed by isolating EVs and measuring their ability to initiate plasmin generation using a chromogenic assay [Citation10,Citation11]. In brief, 200 µL citrate-anticoagulated plasma was diluted (1:2) in PBS/BSA (phosphate buffer saline, 0.1% bovine serum albumin and 0.1% NaN3) and incubated for 1 h at room temperature under mild rotation with magnetic beads (M450 Dynabeads; InVitrogen/Dynal, Oslo, Norway) coated with specific antibodies (anti-CD15). Plasmin was generated by incubating plasminogen (4 μmol/L, Stago, Asnières, France) with the EVs in the presence of ε-aminocaproic acid (5 mmol/L, Sigma-Aldrich, Saint-Louis, MO) and was detected at 405 nm after incubation with a plasmin-selective chromogenic substrate ([methyl-malonyl]-hydroxypropylarginine-p-nitroaniline, CBS0065, Stago, 2 mmol/L). The kinetics were followed for 2 h at 37°C, and Vmax was measured in the linear part of each curve. The results were expressed in units of A405 nm × 10−3/minute.
Results
Concentration of extracellular vesicles in plasma of healthy humans
The concentration and cellular origin of EVs were measured in plasma of healthy humans as described (). In 2001, flow cytometry results were corrected for isotype control. Since then, it has been questioned whether this isotype control correction is the right choice [Citation12,Citation13]. Therefore, in , our old (2001) and new (2018) data are shown with and without correction of isotype control.
Table 1. Concentration and cellular origin of extracellular vesicles in human plasma.
When corrected for isotype control, the “total” concentration of plasma EVs was 506 × 106 EVs/L in 2001, defined as the sum of platelet EVs (82%), erythrocyte EVs (15%) and leukocyte EVs (3%). Without correction, this concentration increased to 524 × 106 EVs/L, without affecting the cellular origin of EVs. Using our current procedures and infrastructure, and without isotype control correction, this “total” concentration of plasma EVs increases to 138,300 × 106 EVs/L, a 264-fold increase, of which 52% are platelet EVs, 29% erythrocyte EVs and 20% leucocyte EVs. As shown in , also a low concentration of EVs from (activated) endothelial cells (E-selectin, CD62E) can be detected, suggesting that venous blood from healthy subjects also contains EVs originating from the vessel wall. Taken together, substantially higher concentrations of plasma EVs are detected compared to 2001.
Extracellular vesicles and coagulation
In 2001, we demonstrated that EVs from plasma of healthy humans promote thrombin generation [Citation1]. When the old (2001) thrombin generation test (TGT) results () are compared to the results of our “new” (2018) fibrin generation test (FGT) [Citation9], it is clear that no fibrin formation is observed in healthy control plasma containing EVs (). This is unexpected, because thrombin is the enzyme that converts soluble fibrinogen into insoluble fibrin, and thus thrombin generation should also result in fibrin formation. In a control experiment, we confirmed that all (four) donors tested showed thrombin generation under conditions identical to 2001 with regard to blood collection and sample preparation (data not shown). To exclude that this apparent discrepancy is due to a difference in sensitivity between both assays, we activated in a control experiment both the extrinsic and intrinsic coagulation pathways by addition of increasing concentrations of Innovin and Synthasil. As shown in , the FGT is more sensitive than the TGT for both Innovin and Synthasil. Thus, the observed discrepancy that EVs generate thrombin but no fibrin is not explained by the fact that the FGT is less sensitive than the TGT. Despite the fact that our new coagulation assay is more sensitive than our old assay, we were unable to confirm our earlier finding that plasma EVs promote coagulation.
Figure 1. Comparison of the thrombin and fibrin generation tests in human plasma. Thrombin generation (TGT; thrombin generation test) 2001 (a) versus fibrin formation (FGT; fibrin generation test) 2018 (b) by extracellular vesicles, Innovin (c, d) or Synthasil (e, f). In both assays, calcium chloride is added at t = 0.
Blood collection and EV-mediated coagulation
Trying to explain why EVs triggered coagulation in 2001 (TGT, ) and not in 2018 (FGT, ), we compared the procedures of blood collection and handling [Citation3]. A comparison between the protocols showed two main differences ().
Table 2. Protocols to detect extracellular vesicles and their coagulant activity in 2001 and 2018.
Firstly, blood was collected in siliconized glass tubes in 2001, whereas now plastic collection tubes are used (please see Methods for details). Secondly, to remove platelets a single centrifugation step was used to produce platelet-poor plasma in 2001, whereas now two centrifugation steps are used to prepare platelet-depleted plasma [Citation3,Citation14].
To determine whether these two before mentioned differences explain the observed (in)ability of EVs to promote coagulation, we compared the effects of blood collection tubes and plasma preparation. Blood was collected in siliconized glass tubes and platelet-poor plasma was prepared as in 2001. For comparison, blood from the same donors (n = 6) was collected in plastic collection tubes to prepare both platelet-poor and platelet-depleted plasma.
shows representative fibrin generation (, left) and thrombin generation curves (, right). Recalcification of platelet-poor plasma from blood collected in siliconized glass tubes triggers fibrin formation ( left, curve A). Also, “EVs” isolated from this plasma trigger thrombin generation upon reconstitution in normal plasma ( right, curve A). When blood is collected in a plastic tube and platelet-poor plasma is prepared, the plasma clots in the FGT albeit slower than when collected in a siliconized glass tube ( left, curve B), whereas the EVs isolated from this blood trigger no detectable thrombin generation ( right, curve B). When platelet-depleted plasma is prepared from blood collected in plastic tubes, neither fibrin formation ( left, curve C) nor thrombin generation ( right, curve C) is observed. Thus, the observed ability of EVs to trigger coagulation depends strongly on the blood collection tube used and on the plasma preparation conditions. Taken together, and our earlier reported “coagulant activity” of EVs from healthy donors is likely explained by contact activation due to blood collection in glass tubes combined with insufficient removal of platelets.
Figure 2. Effect of blood collection and handling on the coagulant properties of human plasma. Platelet-poor plasma (single centrifugation to remove platelets) collected in a siliconized glass tube (a) or plastic tube (b); (c) platelet-depleted plasma (double centrifugation) prepared from blood collected in a plastic tube. For the fibrin generation test (FGT, left), the prepared plasma samples (containing endogenous EVs) were recalcified at t = 0 as described in Methods. For the thrombin generation test (TGT, right), EVs were isolated from the prepared plasma samples and reconstituted in EV-depleted normal plasma as described in Methods, and thrombin generation was initiated by recalcification at t = 0. Please notice that the time scale (X-axis) differs for FGT and TGT. Representative data from one volunteer are shown. In total, six independent experiments were performed.
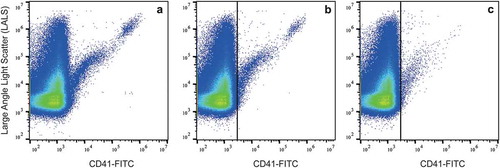
confirms that platelet-poor plasma contains residual platelets (upper right “cloud”), irrespective of whether the blood was collected in glass or plastic tubes (, respectively). In contrast, platelets are virtually undetectable when platelet-depleted plasma is prepared (), showing that “double centrifugation” is essential to remove platelets adequately. Taken together, changes in procedures of blood collection and handling markedly affect the plasma composition and the downstream functional measurements of EVs.
Figure 3. Presence of residual platelets in platelet-poor and platelet-depleted plasma. Platelet-poor plasma was prepared from blood collected in a glass tube (a) or plastic tube (b); (c) platelet-depleted plasma was prepared by double centrifugation from blood collected in a plastic tube.
Coagulation activation in vivo
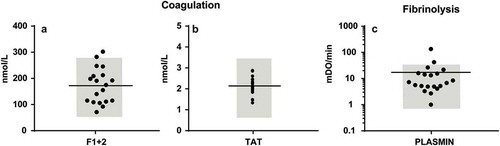
As in 2001, we measured the concentrations of F1 + 2 and TAT as markers of the in vivo coagulation activation status (). All measured concentrations except two are within the reported reference ranges of the assays, 181.5 ± 76.0 pmol/L and 2.1 ± 0.42 µg/L (mean ± standard deviation), respectively, and no correlations were present with the measured concentration of EVs (data not shown), indicating that there is no direct relationship between coagulation activation in vivo and measured concentrations of plasma EVs ex vivo.
Figure 4. Concentrations of plasma coagulation and fibrinolysis activation markers (a) Concentration of coagulation activation markers prothrombin fragment (F) 1 + 2 and thrombin-antithrombin complexes (TAT) in human plasma; (b) Plasmin generation by EVs in human plasma. Reference ranges are shown in grey.
Plasmin generation by the EVs
Plasmin activity generated by the EVs was detectable (11.5 ± 10.2 mOD/minute, n = 20, ), with two values outside the expected normal range. Our results are about two-fold higher than those reported earlier, which may be due to difference in pre-analytics, such as the lower centrifugation speed used to prepare plasma [Citation10,Citation11]. Nevertheless, under normal (physiological) conditions, plasma EVs support fibrinolysis rather than coagulation.
Discussion
The two main findings of this study are that (i) the total concentration of EVs in human plasma has increased 190 to 264-fold compared to 2001, and that (ii) the reported coagulant activity of EVs could not be reproduced.
There are several reasons why a higher concentration of EVs is now being measured (). Firstly, by optimizing the concentration of antibodies and by prolonging the labelling time, a substantial increase in detected concentrations of EVs has been achieved [Citation2,Citation3]. Moreover, a previous centrifugation step aimed to concentrate EVs prior to measuring and to remove excess of unbound antibodies resulting in clumping of platelet EVs and/or residual platelets was omitted. In fact, the formation of these clumps or aggregates probably explains why previously, on relative insensitive flow cytometers, mainly “EVs” of platelet origin were measured [Citation2,Citation15]. Given the fact that recent evidence suggests that the bulk of small EVs cannot be pelleted from plasma or serum by (ultra) centrifugation supports the idea that residual platelets rather than platelet-derived EVs explained these earlier observations [Citation8].
Secondly, recently we showed that lactadherin outperforms other “generic” fluorescent markers for detection of plasma EVs by flow cytometry [Citation16]. Both lactadherin and annexin V bind to phosphatidylserine (PS) exposed on plasma EVs, but the term “generic markers” is misleading here because not all plasma EVs expose detectable levels of PS [Citation17]. In contrast to annexin V, however, lactadherin does not require calcium ions for binding to PS, and therefore lactadherin is easier to use in a “plasma environment” because there is no risk of clotting. When comparing the total concentration of EVs stained by annexin V (2001) and by lactadherin (2018; ), the increase in the total concentration of detected EVs is 805-fold. Although this increase is substantial, two remarks should be made here. Firstly, when looking at our 2018 results (), an almost two-fold higher concentration of plasma EVs stain for lactadherin than with fluorescently labelled antibodies. Thus, either part of these lactadherin-positive EVs are false-positive events, and/or there is still a large population of EVs being undetected by flow cytometry. The latter seems likely because we recently showed that a sensitive method that detects multiple EVs by antibody capturing to a surface, surface plasmon resonance imaging (SPRi), clearly outperforms detection of single EVs using the same antibodies [Citation18]. Therefore, the difference in sensitivity between SPRi and flow cytometry is likely explained by the fact that in SPRi multiple EVs are captured which expose with numbers of antigens, whereas single EVs generate scatter and fluorescence signals below the detection limit of detectors used in even the newest generation of flow cytometers [Citation3,Citation19].
Thirdly, because the concentration of EVs in human body fluids is high, and because the volume of the flow cell on flow cytometers has dimensions developed to measure single cells and thus are relatively large for EVs, multiple EVs are simultaneously present within the laser beam, and together these EVs generate a single trigger “event” above the threshold, the lower limit of detection [Citation20]. Due to “swarm detection” the concentration of EVs was underestimated, and this underestimation can be easily circumvented by diluting the sample before measuring. Moreover, dilution is also necessary because flow cytometers can analyse only a maximum number of events/s, for example, about 5000 events/s for the Apogee A60 [Citation21]. Obviously, correction for “swarm detection” strongly contributes to the higher concentrations of EVs now being measured.
Fourthly, light scattered by a particle depends on both its diameter and refractive index (RI). Until recently, light scatter-based size gates for EVs were set on flow cytometers using polystyrene reference particles [Citation22,Citation23]. Because polystyrene particles have a higher RI than EVs [Citation24,Citation25], such size gates overestimate the diameter of measured EVs [Citation20]. After correction for the difference in RI between EVs and reference materials, much less EVs are being measured than previously anticipated [Citation4]. Thus, most flow cytometers are still insufficiently sensitive and measure only the larger EVs, and even the most dedicated instruments are still unable to measure single EVs with a diameter below 150–200 nm. Scatter and fluorescence detectors differ in sensitivity between instruments. By developing mathematical (Mie) models, it is has become possible to correct for differences in optical configuration, i.e. sensitivity, of commercially available flow cytometers. Combined with the fact that in such models also the difference in RI between reference particles and EVs is taken into account, these models provide a solid basis and a realistic insight into the ability of a flow cytometer to detect EVs. In fact, these models offer the opportunity to set absolute size gates in nm for EVs on different types of flow cytometers [Citation4]. Based on this knowledge, we now know that in 2001 the (old) BD FACS Calibur system measured single EVs >500 nm, whereas the (new) Apogee A60 detects single EVs >170 – 180 nm. Because the size distribution of EVs follows a power-law distribution [Citation2,Citation26], the Apogee A60 detects a higher concentration of EVs than the BD FACS Calibur in the same sample.
Taken together, although the detection of single EVs by flow cytometry is still far from perfect, at least we know what we are measuring and which limitations need to be overcome the coming years. Given the fact that also flow cytometry companies are becoming interested in detection of EVs, one may anticipate that new instruments will have improved sensitivity with regard to the detection of smaller EVs. Despite all improvements, however, one still may wonder whether all detected “EVs” are truly EVs. Apart from the fact that EVs are detected based on their binding of fluorescently labelled antibodies and/or lactadherin, we recently validated that >90% of the CD61-positive events with a diameter >200 nm, as detected as by our (Apogee) flow cytometer, have low RI of 1.39, which is close to the reported RI of platelets of 1.40 and which differs significantly from the RI of the lipoprotein population, which is 1.47 on our flow cytometer (Leonie de Rond, personal communication).
As mentioned, we were unable to reproduce the earlier reported coagulation activation activity of EVs in healthy plasma despite the fact that the FGT is more sensitive than the TGT. Of note, the earlier observed thrombin generation in plasma of healthy subjects is absent when blood is collected in the presence of corn trypsin inhibitor, an inhibitor of (activated) coagulation factor XII(a), confirming that the observed thrombin generation was due to contact activation (data not shown). This discrepancy seems to be explained by major changes in blood collection conditions and plasma preparation protocols, although it would be interesting to validate this finding using other currently available coagulation assays. provides an overview of publications in which the coagulant properties of EVs have been reported in plasma of healthy humans, often as a control group in a patient study. To which extent these findings, including our own, are caused by blood collection conditions and plasma preparation protocols needs to be confirmed but contact activation is likely to play a major role in most if not all earlier studies. In fact, in recalcified fresh platelet-depleted plasma from 20 healthy subjects, spontaneous fibrin formation (clotting) was observed in five samples (20%), with clotting times between 1379–2585 s. Upon addition of polybrene, a contact activation inhibitor, before recalcification, none of the samples clotted for at least 1 h (data not shown). Thus, a role for contact activation seems likely, and despite the fact that using platelet-depleted instead of platelet-poor plasma suppressed contact activation in most plasma samples efficiently, the addition of an inhibitor of the contact activation system seems to rule out this cofounder completely.
Table 3. Publications presenting information on the coagulant properties of plasma EVs in healthy humans.
Our present study shows that EVs in plasma from healthy humans support fibrinolysis. Although it would be interesting to determine whether this fibrinolytic activity is limited to a particular (sub) population of EVs, we consider this beyond the scope of our present study.
Recently, we summarized artefacts, flaws and limitations made by us and other EV researchers in detection and characterization of EVs during the last 15–20 years [Citation3]. By learning from our earlier shortcomings, and by understanding recent developments being made in EV detection and characterization, the overall progress in this still novel research field is tremendous, and at present we are in the process of developing “minimal requirements” [Citation27–Citation29], which are currently also being developed for detection of EVs by flow cytometry.
Authorship addendum
RB designed, analyzed and interpreted the results. RB and CH performed most experiments. RL performed and analyzed the plasmin generation assay. RB wrote the manuscript. AS and RN helped designing the experiments and writing the manuscript. All authors approved the final version of the manuscript.
Declaration of interest disclosures
Romaric Lacroix has a collaboration contract with Stago (licensed patent). The other authors state that they have no conflict of interest.
Related Research Data
References
- Berckmans RJ, Nieuwland R, Boing AN, et al. Cell-derived microparticles circulate in healthy humans and support low grade thrombin generation. Thromb Haemost. 2001;85:639–10.
- Arraud N, Linares R, Tan S, et al. Extracellular vesicles from blood plasma: determination of their morphology, size, phenotype and concentration. J Thromb Haemost. 2014;12:614–627.
- Coumans FAW, Brisson AR, Buzas EI, et al. Methodological guidelines to study extracellular vesicles. Circ Res. 2017;120:1632–1648.
- van der Pol E, Sturk A, van Leeuwen T, et al. group I-S-VW. Standardization of extracellular vesicle measurements by flow cytometry through vesicle diameter approximation. J Thromb Haemost. 2018;16:1236–1245.
- Lacroix R, Judicone C, Mooberry M, et al. Standardization of pre-analytical variables in plasma microparticle determination: results of the international society on thrombosis and haemostasis SSC collaborative workshop. J Thromb Haemost. 2013;11:1190–1193.
- de Rond L, Coumans FAW, Nieuwland R, et al. van der Pol E. Deriving extracellular vesicle size from scatter intensities measured by flow cytometry. Curr Protoc Cytom. 2018;86:e43.
- Prior SM, Park MS, Mann KG, et al. Endogenous procoagulant activity in trauma patients and its relationship to trauma severity. TH Open. 2019;3:e10–e9.
- Kornilov R, Puhka M, Mannerstrom B, et al. Efficient ultrafiltration-based protocol to deplete extracellular vesicles from fetal bovine serum. J Extracell Vesicles. 2018;7:1422674.
- Berckmans RJ, Sturk A, van Tienen LM, et al. Cell-derived vesicles exposing coagulant tissue factor in saliva. Blood. 2011;117:3172–3180.
- Lacroix R, Plawinski L, Robert S, et al. Leukocyte- and endothelial-derived microparticles: a circulating source for fibrinolysis. Haematologica. 2012;97:1864–1872.
- Cointe S, Harti Souab K, Bouriche T, et al. A new assay to evaluate microvesicle plasmin generation capacity: validation in disease with fibrinolysis imbalance. J Extracell Vesicles. 2018;7:1494482.
- Crompot E, Van Damme M, Duvillier H, et al. Avoiding false positive antigen detection by flow cytometry on blood cell derived microparticles: the importance of an appropriate negative control. PLoS One. 2015;10:e0127209.
- Hulspas R, O’Gorman MR, Wood BL, et al. Considerations for the control of background fluorescence in clinical flow cytometry. Cytometry B Clin Cytom. 2009;76:355–364.
- Lacroix R, Judicone C, Poncelet P, et al. Impact of pre-analytical parameters on the measurement of circulating microparticles: towards standardization of protocol. J Thromb Haemost. 2012;10:437–446.
- Aatonen M, Valkonen S, Boing A, et al. Isolation of platelet-derived extracellular vesicles. Methods Mol Biol. 2017;1545:177–188.
- de Rond L, van der Pol E, Hau CM, et al. Comparison of generic fluorescent markers for detection of extracellular vesicles by flow cytometry. Clin Chem. 2018;64:680–689.
- Chandler WL, Yeung W, Tait JF. A new microparticle size calibration standard for use in measuring smaller microparticles using a new flow cytometer. J Thromb Haemost. 2011;9:1216–1224.
- Gool EL, Stojanovic I, Schasfoort RBM, et al. Surface plasmon resonance is an analytically sensitive method for antigen profiling of extracellular vesicles. Clin Chem. 2017;63:1633–1641.
- Arraud N, Gounou C, Turpin D, et al. Fluorescence triggering: a general strategy for enumerating and phenotyping extracellular vesicles by flow cytometry. Cytometry A. 2016;89:184–195.
- van der Pol E, van Gemert MJ, Sturk A, et al. Single vs. swarm detection of microparticles and exosomes by flow cytometry. J Thromb Haemost. 2012;10:919–930.
- Nolan JP, Stoner SA. A trigger channel threshold artifact in nanoparticle analysis. Cytometry A. 2013;83:301–305.
- Poncelet P, Robert S, Bouriche T, et al. Standardized counting of circulating platelet microparticles using currently available flow cytometers and scatter-based triggering: forward or side scatter? Cytometry A. 2016;89:148–158.
- Cointe S, Judicone C, Robert S, et al. Standardization of microparticle enumeration across different flow cytometry platforms: results of a multicenter collaborative workshop. J Thromb Haemost. 2017;15:187–193.
- van der Pol E, Coumans FA, Sturk A, et al. Refractive index determination of nanoparticles in suspension using nanoparticle tracking analysis. Nano Lett. 2014;14:6195–6201.
- Gardiner C, Shaw M, Hole P, et al. Measurement of refractive index by nanoparticle tracking analysis reveals heterogeneity in extracellular vesicles. J Extracell Vesicles. 2014;3:25361.
- van der Pol E, Coumans FA, Grootemaat AE, et al. Particle size distribution of exosomes and microvesicles determined by transmission electron microscopy, flow cytometry, nanoparticle tracking analysis, and resistive pulse sensing. J Thromb Haemost. 2014;12:1182–1192.
- Lotvall J, Hill AF, Hochberg F, et al. Minimal experimental requirements for definition of extracellular vesicles and their functions: a position statement from the international society for extracellular vesicles. J Extracell Vesicles. 2014;3:26913.
- Witwer KW, Soekmadji C, Hill AF, et al. Updating the MISEV minimal requirements for extracellular vesicle studies: building bridges to reproducibility. J Extracell Vesicles. 2017;6:1396823.
- Théry C, Witwer KW, Aikawa E, et al. Minimal information for studies of extracellular vesicles 2018 (MISEV2018): a position statement of the international society for extracellular vesicles and update of the MISEV2014 guidelines. J Extracell Vesicles. 2018;7:1535750.
- Dashkevich NM, Vuimo TA, Ovsepyan RA, et al. Effect of pre-analytical conditions on the thrombodynamics assay. Thromb Res. 2014;133:472–476.
- Stief TW. Influence of the surface on thrombin generation. Int J Lab Hematol. 2008;30:269–277.
- Chaari M, Ayadi I, Rousseau A, et al. Impact of breast cancer stage, time from diagnosis and chemotherapy on plasma and cellular biomarkers of hypercoagulability. BMC Cancer. 2014;14:991.
- Alvarez-Roman MT, Fernandez-Bello I, Jimenez-Yuste V, et al. Procoagulant profile in patients with immune thrombocytopenia. Br J Haematol. 2016;175:925–934.
- Gheldof D, Haguet H, Dogne JM, et al. Procoagulant activity of extracellular vesicles as a potential biomarker for risk of thrombosis and DIC in patients with acute leukaemia. J Thromb Thrombolysis. 2017;43:224–232.
- Ammollo CT, Semeraro F, Milella RA, et al. Grape intake reduces thrombin generation and enhances plasma fibrinolysis. Potential role of circulating procoagulant microparticles. J Nutr Biochem. 2017;50:66–73.
- Nielsen T, Kristensen AF, Pedersen S, et al. Investigation of procoagulant activity in extracellular vesicles isolated by differential ultracentrifugation. J Extracell Vesicles. 2018;7:1454777.
- Aupeix K, Hugel B, Martin T, et al. The significance of shed membrane particles during programmed cell death in vitro, and in vivo, in HIV-1 infection. J Clin Invest. 1997;99:1546–1554.
- van Doormaal F, Kleinjan A, Berckmans RJ, et al. Coagulation activation and microparticle-associated coagulant activity in cancer patients. An exploratory prospective study. Thromb Haemost. 2012;108:160–165.
- Zhao L, Bi Y, Kou J, et al. Phosphatidylserine exposing-platelets and microparticles promote procoagulant activity in colon cancer patients. J Exp Clin Cancer Res. 2016;35:54.
- Radu CM, Campello E, Spiezia L, et al. Origin and levels of circulating microparticles in normal pregnancy: a longitudinal observation in healthy women. Scand J Clin Lab Invest. 2015;75:487–495.
- Patil R, Ghosh K, Shetty S. A simple clot based assay for detection of procoagulant cell-derived microparticles. Clin Chem Lab Med. 2016;54:799–803.