
 ?Mathematical formulae have been encoded as MathML and are displayed in this HTML version using MathJax in order to improve their display. Uncheck the box to turn MathJax off. This feature requires Javascript. Click on a formula to zoom.
ABSTRACT
Both exosomes and soluble factors have been implicated in the generation of an immunosuppressive tumour microenvironment. Determining the contribution of each requires stringent control of purity of the isolated analytes. The present study compares several conventional exosome isolation methods for the presence of co-enriched soluble factors while isolating exosomes from human melanoma-derived cell lines. The resultant preparations were analysed by multiplex bead array analysis for cytokine profiles, and by electron microscopy and nanotracking analysis for exosome size distribution and concentration. It is demonstrated that the amount and repertoire of soluble factors in exosome preparations is dependent upon the isolation method used. A combination of ultrafiltration and size exclusion chromatography yielded up to 58-fold more exosomes than ultracentrifugation, up to 836-fold lower concentrations of co-purified soluble factors when adjusted for exosome yield, and a greater than two-fold increase in PD-L1 expressing exosomes. Mechanistically, in context of the immunomodulatory effects of exosomes, the exosome isolation method should be carefully considered in order to limit any effects due instead to co-eluted soluble factors.
Introduction
Cancer metastasis involves the generation of a metastatic niche in which immune cells play a role [Citation1]. Among cancers, melanoma has a high propensity to metastasize to distant sites [Citation2]. The prevailing paradigm is that the tumour microenvironment (TME) provides the necessary growth factors, chemokines and cytokine signals (hereafter called soluble factors) to sustain tumours. Furthermore, these factors may cluster at distant sites generating a premetastatic niche conducive for metastatic adhesion and invasion [Citation1]. In addition to these soluble factors, tumour- and stromal cell-derived extracellular vesicles (EV) and their cargo also contribute to the TME [Citation3,Citation4], and to local immunosuppression.
Exosomes are a subset of extracellular vesicles (EV) that are between 30 and 150 nm and are purposely packaged through the endocytic pathway and released through the multi-vesicular body (MVB) for cell-to-cell communication. For the purpose of this paper, exosomes are defined as a subset of EV that are less than 200 nm in size (e.g. through ultrafiltration) and are enriched for CD63 and the MVB-associated endosomal marker TSG101. As a package, an exosome is believed to carry some of the soluble factors from the originating cell [Citation5,Citation6]. Exosome-associated immunosuppressive pathways have been implicated to directly impair T-cell function and viability [Citation7–Citation11]. Recently, the presence of PD-L1 on melanoma associated exosomes and their consequent immunosuppressive function was demonstrated in-vivo, and the increase in circulating exosomal PD-L1 was proposed as an indicator to stratify clinical responders from non-responders [Citation12].
Exosomes and specific soluble factors from tumour appear to be equally capable of immune suppression. Of note is the difficulty to separate out the functional effects of exosomes from soluble factors and in some cases “soluble factor” terminologies include exosomes as part of a subset of soluble factors, i.e. a “soluble biological mediator” [Citation13]. Soluble factors, by functional definition, are immune modulating factors, 10–100 kDa in size, found in the tumour extracellular environment [Citation14]. Depending on the type and concentration of soluble factors, they can either have pro- or anti-tumoural effects [Citation15].
The mechanisms of immunosuppression in the TME are complex and the contribution of non-cellular components of the TME, including soluble factors, exosomes and their interaction, is an active area of research. Due to the nanometre size of exosomes and relatively small molecular weight of soluble factors, a conclusive answer is elusive [Citation16]. There is little evidence to suggest that soluble factors and exosomes can be isolated to the complete exclusion of the other [Citation17]. The present study compares conventional EV isolation methods and purification steps and determines the quantity of co-isolated soluble factors. Exosomes and soluble factors derived from human melanoma cell culture supernatant (HMEX), as well as detection of the immunosuppressive checkpoint inhibitor PD-L1, served as the study’s model systems.
Materials and methods
Cell culture
Cell lines 2183-Her4 (BRAF wild-type melanoma cell line) and 888-mel (BRAF V600E mutant melanoma cell line) were obtained from National Institutes of Health (NIH). Validation of cell line authenticity was done through Genomic Shared Resource Center (Roswell Park Comprehensive Cancer Center) using short tandem repeat DNA fingerprinting (STR DNA fingerprinting). Cells were cultured in RPMI 1640 media supplemented with GlutaMAX (Gibco, USA), 5 U/mL Penicillin Streptomycin (Gibco, USA) and 5% foetal bovine serum (Gibco, USA) to create full media. 24 h before experimentation, adherent cells were washed with a small volume of “supplement-free” RPMI 1640 media and replaced with full media, using exosome-depleted FBS to 5% (Gibco, USA) in place of FBS.
Isolation of exosomes
Isolation of exosomes was done in accordance to our previously published method [Citation18]. During the “Rapid Exosome Isolation Using Size exclusion chromatography” (REIUS) method, 15 mL of cell culture supernatant was centrifuged at 300 g, 5 min (Centrifuge model no. 5810R, Eppendorf, USA) to pellet any contaminating cells. The resultant supernatant was decanted into a 50 mL falcon tube for centrifugation at 3000 g, 15 min for removal of cell debris. The supernatant was transferred again to another 50 mL falcon tube and filtered through a 0.20 μm (200 nm) syringe filter (MBL, Germany) to eliminate contaminating particles greater than 200 nm in size. The filtered supernatant was transferred to Amicon Ultra-15 Centrifugal Filter Units, MWCO 100 kDa (Millipore, USA), and spun down to an appropriate volume for use in Exo-spin Size Exclusion Chromatography columns in accordance to manufacturer’s instructions (Cell Guidance Systems, USA).
For ultracentrifugation (UC), 15 mL of cell culture supernatant was centrifuged at 300 g, 5 min and the cell pellet discarded. The resultant supernatant was decanted into a 2 mL microcentrifuge tube for centrifugation at 10,000 g, 20 min, and then ultracentrifuged at 100,000 g at 4°C in 5 mL ultracentrifuge tubes (NC9157569, Beckman Coulter, USA) for 70 min (SW50.1 Rotor, Swinging Bucket in a Beckman Coulter L8-80M Ultracentrifuge, speed set at 32,700 rpm to reach RCFavg = 100,000; maximum acceleration and deceleration; k-factor = [2.533 × 10⁵ × ln (rmax/rmin)/(RPM/1000)2] = 138.9, verified using Beckman Coulter k-factor calculator (https://www.beckman.com/centrifuges/rotors/calculator); adjusted k Factor (k adj) = k-factor× (max rpm/actual rpm)2 = 324.7). The resultant exosome pellet from 15 mL total volume (merged from three tubes) was resuspended in a total volume of 200 μL of PBS.
For ExoQuick ULTRA (EqU, System Biosciences, USA), 15 mL of cell culture supernatant was isolated for EV as per the manufacturer’s instructions.
Resultant isolates from REIUS, UC and EqU were either used immediately or stored at 4°C overnight for subsequent experiments. Unless specified, all centrifugation and exosome isolation steps were performed at room temperature (rtp).
Western blotting
For western blotting, protein lysates were prepared from cells and EV isolates. Cell lysates were obtained by washing cells in DPBS and then lysing in radio-immunoprecipitation assay (RIPA) buffer (Thermofisher Scientific, USA), with Halt© protease inhibitors (Thermofisher Scientific, USA), and completing the manufacturer’s protocol. Exosome lysates were obtained by adding RIPA with protease inhibitors to exosome isolates and completing the RIPA protocol. For cell lysates, protein concentration was determined using the Pierce © BCA Protein Assay Kit, and volumes were adjusted in RIPA buffer to 1 mg/mL and 50 μL was loaded. For exosome protein lysates, samples were loaded in accordance to volume (to a final volume of 50 μL per well or 20 μg per well in 1× final concentration of SDS-PAGE loading buffer with β-mercaptoethanol) on Mini-PROTEAN TGX precast gels (4–20% gradient gel, 10 well, 50 μL per well). Binding of primary antibodies against CD63 (HPA010088, Sigma, USA), TSG101 (EPR7130, Abcam, USA), β-actin (3700S, Cell Signalling, USA) and β-tubulin (#2146, Cell Signalling, USA) were detected indirectly with secondary antibodies conjugated to IRDyes (LI-COR) and visualized using the Li-Cor IR Odyssey Imaging System (LI-COR, USA).
Exosome size and concentration measurements
Size and concentration measurements of the purified exosomal samples were performed with a ZetaView Nanoparticle tracking analyser (NTA) (Particle Metrix, USA). The samples were run at 25 degrees using 0.20 μm filtered PBS as a diluent. Size and concentration of vesicles were measured using the ZetaView Nanoparticle Tracking Analyser (Particle Metrix, Germany) with a 488 nm laser light source. For video acquisition, a shutter speed of 600 and a frame rate of 60 were used and the sensitivity was set at 89 according to the system’s software guidance algorithms. Before measurements were taken, accuracy of the ZetaView was verified using 100 nm standard beads. Samples were diluted in PBS with a dilution factor of 1:1000–1:5000 to achieve a particle count in the range of 200–500.
Transmission electron microscopy (TEM)
TEM visualization of exosomes was done in accordance to our previously published method [Citation18]. A negative staining technique was employed to visualize the exosomes. An enriched exosome suspension was resuspended in filtered PBS, dispensed on carbon-coated electron microscopy grids on parafilm and left to absorb for 1 min at rtp, then transferred to a drop of Uranyless® solution for 1 min and left to air dry. Excess stain was blotted away. Imaging was performed using either a JEOL 100CX II Transmission Electron Microscope at 100 kV or Hitachi HT7800 High Resolution Transmission Electron Microscope at 100 kV.
Surface plasmon resonance (SPR) biosensor for detection of exosomal PD-L1
The setup of the compact SPR biosensor system and the SPR biochip fabrication methods were described previously, with minor revisions [Citation19]. Briefly, sapphire glass slides (600 ± 10 μm) were cleaned subsequently by acetone, methanol and deionized water (DI water). Then 2 nm Ti adhesion layers followed by 49 nm Au thin layers were deposited on the cleaned glass slides via the e-beam evaporator (Indel system). For biochip surface modification of antibodies, the biochip was first incubated with the mixture of methyl-polyethylene glycol-thiol (PEG) (PEG200, MW = 200 g/mol, Catalogue number: 26132, Thermofisher Scientific, USA) and biotinylated PEG thiol (PEG1000, MW = 1000 g/mol, Catalogue number: PG2-BNTH-1k, Nanocs, USA) at the molar ratio of 3:1 with a final concentration of 10mM in PBS at rtp for 1 h. Unbound PEG was washed off with PBS and 0.05 mg/mL of NeutrAvidin (Catalogue number: 31000, Thermofisher Scientific, USA) was added to react with biotin at rtp for 1 h. Thereafter unreacted NeutrAvidin was washed away with DI-water. Biotinylated anti-PD-L1 antibodies (13-5983-82, Thermofisher Scientific, USA) or biotinylated anti-IgG antibodies (13-4714-85, Thermofisher Scientific, USA) were added at the concentration of 0.05 mg/mL and incubated at rtp for 1 h. After washing away unbound antibodies with DI-water, the biochip was ready to use.
To detect exosomal PD-L1, a 647 nm laser was used and the laser power was set at 30 mW. Water and PBS were first applied on the biochip and the reflected light intensities were collected their SPR signals for 2 min each and used as baseline signals (Iwater and IPBS). Then the PBS was replaced with exosome samples. The reflected light intensity was measured during real-time binding of exosome on the biochip for 1 h. Any unbound exosomes were then carefully washed away with PBS, and the final SPR signal from PD-L1+ exosomes was measured (Iexosomes). The signal fold change correlates directly to the expression of PD-L1 on exosomes, which was calculated using the following formula:
Luminex assay
A 13-plex MILLIPLEX® MAP Human High Sensitivity T-Cell Magnetic Bead Panel 96-Well Plate Assay (Cat No.: HSTCMAG28SPMX13, Millipore Sigma, USA) was used to examine samples for the presence of key factors that influence the T-cell immunomodulatory response. Analytes for the 13-plex Luminex assay are: GM-CSF, IFNγ, IL-1β, IL-2, IL-4, IL-5, IL-6, IL-7, IL-8, IL-10, IL-12 (p70), IL-13, TNF-α. The assay plate was read on a Luminex 200™ instrument with xPONENT acquisition software (equipment settings at 100 μL sample volume, 50 bead events per bead set, default reporter gain setting and timeout setting at 1 min, per kit manufacturer’s protocol). The resultant data were analysed using Upstate BeadView software for median fluorescent intensity (MFI) using a 5-parameter logistic curve-fitting method to calculate analyte concentrations in both samples and control wells. A dilution factor of 10 was multiplied to analyte concentrations measured in diluted samples. The QC results indicated assay performance within the batch-specific specifications supplied by the manufacturer.
Statistical analysis
For statistical analysis, Student’s t-test was performed with GraphPad Prism 5.0 (GraphPad Software, Inc., San Diego, CA), with p < 0.05 defined as significant. All experiments were done at least three separate times. All numerical values represent the mean ± SE. Number of asterisks in and denote minimum statistical significance, i.e. *: p < 0.05, **: p < 0.01, ***: p < 0.005 and ****: p < 0.001.
Results
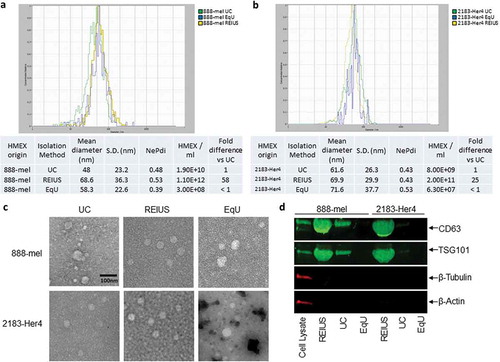
For the purpose of this paper, exosomes are a fraction of EV that are less than 200 nm in size, express both tetraspanin CD63 and the endosomal marker TSG101, and are negative for the expression of β-actin and β-tubulin. Techniques that are developed to enrich for exosomes will be called exosome isolation methods. REIUS or UC or EqU based exosome isolation methods resulted in similar size distribution and morphology, but compared to the REIUS method, UC or EqU had 25 to 58-fold lower particle yield, depending on cell line, after adjusting for and taking into account each method’s sample volume (). Electron microscopy confirmed that particles from REIUS and UC possess a circular morphology with an intact membrane based on negative staining and are consistent in size using NTA (). As different techniques yielded different final volumes, the volume of resultant isolate was normalized using 3 kD MWCO UF to a final volume of 200 µL. Western blot of isolations by REIUS or UC loaded in equal volumes consistently displayed differences in the protein expression of CD63 and TSG101 when comparing exosome isolation methods (). For the applied volumes, almost no detectable CD63 was observed for the EqU preparation, likely because it was below the detection limit despite best efforts to concentrate sufficient material and thus was excluded from further analysis. In all three methods of exosome isolation examined, no cytoplasmic contamination was detected based on quantification of β-tubulin or β-actin, when compared to cell lysate as a control. Taken together, these results show that greater numbers of exosomes are isolated when using the REIUS method compared to UC and that both UC and REIUS can enrich for exosomes.
Figure 1. HMEX size distribution, concentration, morphology and protein characteristics in 888-mel and 2183-Her4 when various exosome isolation methods are used. 15 mL of supernatant was isolated from 16.5 × 10⁶ cells and was processed for exosome isolation using various methods. UC: Ultracentrifugation/REIUS: Rapid Exosome Isolation using Ultrafiltration and Size Exclusion Chromatography/EqU: ExoQuick Ultra. (a) HMEX size distribution in 888-mel and (b) 2183-Her4 is consistent regardless of exosome isolation method used. Concentrations of HMEX vary depending on the method of exosome isolation chosen. Exosome polydispersity index (NePdi) is the ratio of standard deviation over mean exosome size based on NTA (Zetaview). (c) Transmission Electron Microscopy images of isolated exosomes with negative staining by Uranyless. Circular morphology and the absence of internal staining indicate intact, compartmentalized vesicles. Size is consistent with results from Zetaview. (d) Protein characteristics of exosomes using western blotting technique. Exosomes isolated using different techniques were all concentrated to a 200 µl final volume, of which 50 µl was loaded for western blotting for comparison of yield. CD63 is an exosome-enriched marker and TSG-101 is an endosomal pathway marker specific for exosomes. β-tubulin and β-actin are cytoplasmic markers. The absence of β-tubulin and β-actin compared to cell lysate sample confirms the presence of purified exosomes with minimal cytoplasmic contaminants. CD63 forms a single fused band at higher protein concentrations but forms two distinct bands when loaded at lower protein concentrations in western blot (Supplementary Figure 7).
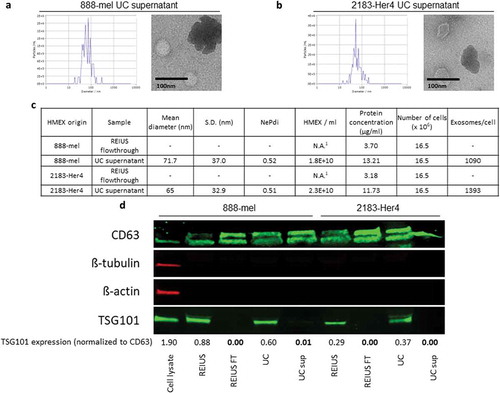
Because fewer exosomes are isolated by UC than the REIUS method, we hypothesized that not all exosomes are pelleted during UC. To test this, supernatants were collected following the initial pelleting of exosomes by UC at 100,000 g for 70 min and were concentrated with an UF 3kD MWCO filter to reduce water mass and reduce resultant liquid volume. ZetaView was then used to detect for the presence of exosomes in the supernatant. The UC supernatants indeed contained particles of similar size distribution and concentration to the UC exosome pellets (). This suggests that UC causes a differential separation of EV, as a significant number of EV do not pellet. One possible explanation is that EV are known to have a density that is similar to protein aggregates (between 1.15 and 1.19 g/mL vs. 1.22 g/mL for protein aggregates) [Citation20,Citation21]. For a fair comparison, 100 kD filtration column flow through fraction (FT fraction) after the REIUS method was also examined for the presence of EV. EV were analysed in the FT fraction and were below the detection limit (1 × 10⁷ per mL), which is more than 10,000-fold lower than the REIUS exosome isolate. However, CD63 was still detectable in the FT fraction by western blot (). Possible explanations are that in the FT fraction, CD63 may be present from membrane debris or that detection of exosomes by CD63 protein by western blot versus detection by nanotracking analysis by ZetaView have different levels of sensitivity. Recent publications however indicate cell origin-dependent heterogeneity of expression and expression levels of the tetraspanins, including CD63 [Citation22]. These observations indicate that quantitative comparisons of exosome concentrations by comparing CD63 expression levels should be used with caution. However, in this case the discrepancies are not related to different origins of the EVs but rather different purification methods applied to the same EV source. Interestingly, exosome specific endosomic pathway marker TSG101 was only present in REIUS and UC exosome isolates, but not in the REIUS FT fraction or UC supernatant. In absence of the housekeeping proteins β-tubulin and β-actin in the EV preparations and the possibility that equal protein amounts from REIUS and UC may contain different amounts of exosomes neither of these parameters could be used to standardize the western blot analysis in . Therefore, in order to demonstrate the absence of TSG101 in the presence of CD63 in the various experimental conditions, the signals were normalized to the intensities of the CD63 bands by density. Taken together, based on NTA analysis and the absence of TSG101, FT fractions contain negligible concentrations of exosomes while UC supernatants contain particles consistent with either EV that are of non-endosomal origin or protein aggregates.
Figure 2. Significant proportion of exosomes remain in supernatant after UC. 15 ml of UC supernatant was concentrated using 3kD MWCO ultrafiltration columns to examine for the presence of exosomes in supernatant. UC supernatant size distribution and TEM images from both (a) 888-mel and (b) 2183-Her4. Significant protein aggregation is observed. (c) Physical characteristics of exosomes. UC supernatant has exosomes consistent in size to the UC-isolated exosome fraction. REIUS FT was concentrated using 3kD MWCO ultrafiltration columns to examine for the presence of exosomes. REIUS FT has no observable particles based on NTA. 1: below detection limit. (d) Protein characteristics of exosomes using western blotting technique. CD63 is an exosome-enriched marker and TSG-101 is an endosomal pathway marker specific for exosomes. β-tubulin and β-actin are cytoplasmic markers. The absence of β-tubulin and β-actin compared to cell lysate sample confirms the presence of purified exosomes with minimal cytoplasmic contaminants. For consistency of comparison, 20 µg of sample was loaded per well for western blotting.
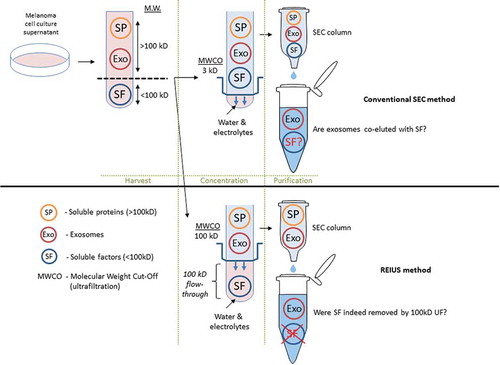
Among possible immunomodulatory signals that can be co-eluted with exosomes are soluble factors that are immunomodulatory, such as cytokines. Such non-exosomal, soluble factors are assumed not to be present in significant concentration in exosomal isolation methods, but may inevitably confound deeper understanding of exosome function, since exosomes are capable of carrying an internal payload that can also be an immunomodulatory soluble factor [Citation23]. Based on literature review, soluble factors released by melanoma into the TME are under 100 kD size (Supplementary Table 1). Using this information and with prior knowledge that exosomes do not pass through 100 kD MWCO ultrafiltration columns [Citation18], we hypothesized that many immunomodulatory soluble factors can be segregated from exosomes by ultrafiltration with a MWCO of 100kD, and that the use of 100 kD MWCO is critical in reducing the carry-over of soluble factor contamination into downstream applications ().
Figure 3. Schematic representation comparing exosome isolation strategies using SEC method. In conventional SEC, melanoma cell culture supernatant is harvested and is directly applied to SEC columns. In some cases, when concentration is required, low (3 kD) MWCO ultrafiltration is used to reduce excess water and electrolytes to load the correct volume onto SEC (100 μL). It is assumed that soluble biologics (e.g. cytokines) that remain are an integral part of exosomes. For REIUS method, 100 kD MWCO ultrafiltration is used to reduce soluble factors that are under 100 kD, followed by SEC. This method is proposed to reduce soluble factors more efficiently than SEC alone. For both methods, presence of non-exosomal soluble factors was examined in detail. Portions of this figure were made using templates from Motifolio Scientific Illustration Toolkits (www.motifolio.com).
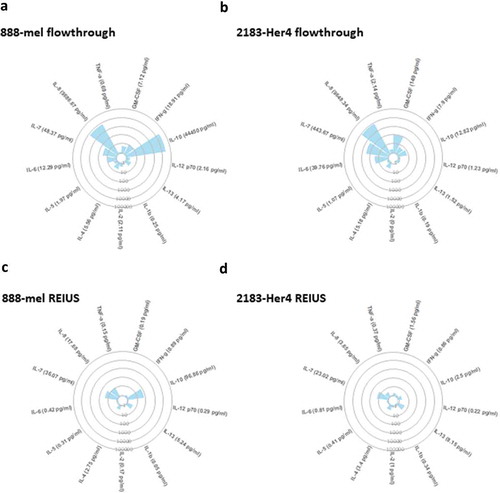
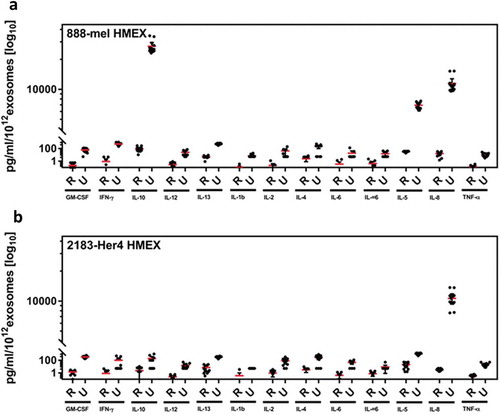
Previous studies have used Multiplex ELISA to detect immunostimulatory cytokines present in melanoma patient serum and melanoma cell line supernatants [Citation24,Citation25]. Using multiplex ELISA, we first investigated whether pre-filtering with a 100kD MWCO UF column is capable of removing significant T-cell modulatory cytokines, as an elimination step prior to exosome isolation. This was determined by measuring the levels of cytokines present in the flow-through after 100kD MWCO UF of supernatants from two melanoma cell lines (888-mel and 2183-Her4) that correspond to the cytokines that were “reduced”. While several cytokines were present in sub-picogram quantities, some cytokines were present in nanogram quantities (i.e. 44.45 ng/mL of IL-10 for 888-mel) (). About 888-mel supernatant flow-through contained detectable levels for all 13 analysed cytokines, ranging from 0.25 pg/mL for IL-1b to 9,686.67 pg/mL for IL-8 and 44,450 pg/mL for IL-10. The supernatant flow-through for 2183-Her4 contained a different pattern of detectable levels for 12 of the 13 analysed cytokines, ranging from 0.19 pg/mL for IL-1b to 9,648.34 pg/mL for IL-8 (). While IL-10 is present at a high concentration for 888-mel, 2183-Her4 supernatant had 12.82 pg/mL of IL-10. This is consistent with BRAFV600E mutant melanomas expressing high levels of immunosuppressive IL-10 as a cancer-immune evasion mechanism [Citation26].
Figure 4. 100 kD MWCO ultrafiltration elimininates substantial cytokine contamination from cell culture supernatant. Circular cytokine plot overview of the 13-plex luminex assay result displaying cytokines that were reduced through 100 kD MWCO ultrafiltration (flow-through) and cytokines present with exosomes after REIUS method. Soluble factors detected in (a) 888-mel and (b) 2183-Her 4 supernatants from 100 kD MWCO UF flow-through that contains non-exosome associated soluble factors. Soluble factors detected in HMEX isolated using REIUS method from (c) 888-mel and (d) 2183-Her4 cell line. Individual data points used to generate the plot is included in supplementary data (supplementary table 2) (n = at least 6).
Next we examined exosomes isolated by the REIUS method for the presence of any co-eluted cytokines. The concentrations of many of the 13 cytokines analysed were noticeably lower when compared to the levels found in the flow-through supernatants (). Four analytes among the 13-plex assay with the highest concentration were chosen for detailed analysis, i.e. IFN-γ, IL-7, IL-8 and IL-10. For the REIUS method, only three cytokines had a concentration greater than 10 pg/mL for 888-mel (IL-7, IL-8 and IL-10) and one cytokine for 2183-Her4 (IL-7) (). The concentration of the Th1 cytokine GM-CSF in 2183-Her4 REIUS isolated HMEX was 1.56 pg/mL compared to 149 pg/mL in flow-through and the Th2 cytokine IL-10 in 888-mel REIUS isolated HMEX was 96.86 pg/mL vs. 44,450 pg/mL in flow-through (). This reduction in strongly modulating Th1 and Th2 cytokine levels is beneficial for any downstream applications using isolated exosomes that involves the use of immune cells such as T cells. These results show that not only the levels of cytokines present in exosomes isolated by the REIUS method are greatly reduced compared to levels present in the initial cell culture supernatants (i.e. 100 kD MWCO flow-through), but that cytokine co-elutes can be reduced without sacrificing exosome yield by using the REIUS method. We questioned whether REIUS has any advantage over SEC methods that do not use a combination of 100 kD MWCO UF and SEC to isolate exosomes. Use of SEC to isolate exosomes is establishing popularity, but in some cases not used in tandem with ultrafiltration columns [Citation27,Citation28]. We thus compared REIUS method to SEC alone to determine if there is a difference in soluble factor concentration dependent on the MWCO of UF columns used. We found that when compared to SEC alone, the REIUS method reduced the presence of contaminating cytokines in isolated exosomes by more than 8-fold, in particular for IL-10 in 888-mel HMEX (97 pg/mL vs. 814 pg/mL for REIUS and SEC alone, respectively) and likewise for IL-8 (). These results highlight the importance of using a 100 kD MWCO UF as a pre-filter before SEC to minimize cytokine contamination in exosomes, as SEC alone cannot reliably reduce cytokines as effectively as pre-eliminating them through the use of UF columns.
Figure 5. Determining efficiency of REIUS method in removing cytokines. (a,b) comparison between REIUS and REIUS flow-through (REIUS FT). (c,d) direct comparison between SEC alone and REIUS method and the presence of representative soluble factors (IFN-γ, IL-7, IL-8 and IL-10) in either 888-mel or 2183-Her4 supernatant isolates. REIUS method is capable of removing more soluble factors than SEC alone (n = at least 6).
Next, we examined the concentration of cytokines detected when UC was used to isolate exosomes and found the UC isolations to contain several log10 higher concentrations compared to REIUS isolations, depending on the specific cytokine (Sup. Figure 3A and B). In 888-mel HMEX, a trace of IFN-γ (8.83 pg/mL) was present in UC but was reduced 9.6-fold to 0.92 pg/mL in REIUS, near the detection limit of most ELISA (but not luminex assay). IL-8 is not primarily an “exosome-associated” soluble factor since the REIUS method reduced the presence of contaminating IL-8 to less than 18 pg/mL, compared to 246 pg/mL in UC, which is a 13.5-fold reduction in cytokine co-elution in REIUS compared to UC. Similarly, IL-10 was present in nanogram quantities (1.43 ng/mL) in UC but 101.65 pg/mL in REIUS, which is a 14-fold decrease in IL-10 present as co-elute in REIUS when compared to UC. Since the number of cells that HMEX was isolated from is approximately the same for 888-mel and 2183-Her4 (1.5 × 10⁷ vs. 1.65 × 10⁷), but the number of HMEX produced differ between the two cell lines by more than tenfold, a better visualization of cytokine co-elution with HMEX can be attained through normalization of exosome numbers present together with cytokines. When corrected for number of exosomes isolated, UC has 73,640 pg/mL of IL-10 per 1012 exosomes (888-mel exosomes), while REIUS method had 88 pg/mL IL-10 per 1012 exosomes isolated, which translates to an 836-fold difference in IL-10 concentration (). This reduction by REIUS was consistent for almost all 13 cytokines examined, indicating that soluble factors, specifically T-cell immunomodulating cytokines examined here may not be associated with exosomes. Taken together, the data demonstrate that REIUS reduces non-exosomal soluble factors to a greater extent than SEC or UC even after correcting for the number of exosomes purified.
Figure 6. Ratio of soluble cytokine concentration to the number of exosomes isolated. When controlled for number of exosomes, cytokine profile per 1012 exosomes were up to 836 fold lower in REIUS compared to UC. A decrease was observed in both (a) 888-mel HMEX and (b) 2183-Her4 HMEX (n = at least 6).
To determine whether isolation technique directly affects immune properties of exosomes, the SPR assay was used to confirm if markers of immunomodulatory function, such as checkpoint inhibitor PD-L1, are present on the surface of HMEX, as was recently reported [Citation19]. Presence of PD-L1 is capable of suppressing T-cell activation. There at least five PD-L1 antibodies that are commercially available, with nearly identical specificity and activity towards PD-L1 [Citation29]. To re-validate that the SPR assay is unbiased towards any specific clones of PD-L1 antibody, two clones were examined, namely MIH1 and 28–8 (). There was no significant difference in PD-L1 detection using either clone (p-value > 0.05). MIH1 was chosen for the SPR assay as it had better signal-to-noise ratio than the 28–8 clone. To compare exosomes isolated from different techniques, relative PD-L1 levels can be measured using SPR if exosomal PD-L1 has a linear relationship with O.D. readings from the SPR assay. Three different concentrations of HMEX were examined (5, 50 and 500 × 109 exosomes). demonstrates that within the concentration range tested, the O.D. readings linearly increased with the number of exosomes (R2 = 0.9818), Using this method, the presence of surface PD-L1 was identified on HMEX from both 888-mel and 2183-Her4 ((c,d)). Interestingly, HMEX isolated by the REIUS method express more surface PD-L1 than the same HMEX isolated using UC. For 888-mel, there were 2.39-fold more PD-L1 expressing exosomes in REIUS isolated exosomes than in UC isolated exosomes, while for 2183-Her4 there were 2.69-fold more PD-L1 expressing exosomes in REIUS isolated exosomes than in UC isolated exosomes. Taken together, PD-L1 expressing exosomes can be isolated by both UC and REIUS, but REIUS yields a significantly higher concentration of these PD-L1 positive exosomes.
Figure 7. 15 ml of supernatant was isolated from 16.5 × 10⁶ cells and was processed for exosome isolation using various methods. Real-time assay measurement results for Compact Surface Plasmon Resonance Biosensor (SPR) detection of PD-L1. (a) The clone used, MIH1, is as effective as 28–8 for use in SPR assay when normalized by number of exosomes (1 × 10¹⁰). (b) Linear regression analysis of PD-L1 positive exosomes using MIH1 clone (R2 = 0.9818). When normalized by number of exosomes (1 × 10¹⁰), PD-L1 expression of exosomes in (c) 888-mel HMEX and (d) 2183-Her4 HMEX is as shown (n = at least 6).
Discussion
This study demonstrates how different conventionally applied exosome isolation methods can affect the presence of contaminating cytokines within exosome preparations. Exosome isolation techniques can be broadly classified into five categories: (1) ultracentrifugation (UC)-based techniques, (2) size-based techniques using ultrafiltration (UF) and size exclusion chromatography (SEC), (3) exosome precipitation techniques such as polyethylene-glycol (PEG) based techniques, (4) immunoaffinity capture-based techniques and (5) microfluidics-based techniques [Citation30]. As of 2016, UC methods for isolating exosomes were used in the vast majority of studies worldwide (81% according to Gheinani and colleagues [Citation31]), but have been under greater scrutiny for protein contamination. UC coupled with SEC has been suggested as a method to isolate exosomes, but exosomes isolated through UC appears to suffer high variability of yield [Citation32].
Our finding clarifies a fundamental association of exosomes with cytokines. It was previously unclear if these “co-enriched” immunomodulatory cytokines can be reduced significantly. Our results indirectly suggest that cytokine concentration does not correlate with exosome concentration, since the concentration of cytokines can be reduced by up to 836-fold while exosome yield is increased by 58-fold, depending on the isolation method. A limitation of this study is that it cannot distinguish whether or not the cytokines present with exosomes are physically associated with the exosomes.
A critical evaluation of the literature regarding the effects of different exosome isolation methods is compromised by the many different experimental model systems applied, the lack of methodological detail provided and in many occasions the disregard of potentially co-enriched factors in the exosome preparations. For example, a 100 kD UF alone has been used regularly as a pre-clearance step to UC [Citation33], and in some studies UF alone was proposed as an ideal method to isolate exosomes [Citation34–Citation36]. Our current study demonstrates that UF alone applied to melanoma cell culture supernatants results in significant contamination of the exosome preparation with soluble cytokines and thus we caution against the sole use of UF to isolate exosomes. The use of different MWCO of UF (e.g. 10, 30, 100 kD) has been shown not to alter the number of exosomes isolated [Citation37] and our group has previously reported that exosome yield is unaffected when pairing SEC to 100 kD MWCO UF, as in the REIUS method [Citation18]. These previous reports did not study the effect of using various MWCO on contaminating soluble factor concentrations [Citation37,Citation38]. The current results however demonstrate that combining UF of different MWCO with SEC can yield logarithmically different concentrations of soluble factors. In addition, there are also examples of reports in which UF is used in the context of 0.22 μm syringe-based filtration instead of 100 kD MWCO UF [Citation21] as well as reports in which the MWCO is not specified [Citation39]. The present results highlight the need for, and relevance of, providing the UF-related experimental details since the type of filtration applied affects the composition of the isolates. Some studies have attempted to combine SEC with UF for better purity [Citation37,Citation38] and more recent studies have proposed and highlighted that UF with 100 kD MWCO followed by SEC and liquid chromatography can yield higher quality exosomes than UC, and lower protein contamination [Citation40], but the presence of soluble factors was not specifically examined.
The present study used cell culture supernatant from two melanoma cell lines (888-mel and 2183-Her4) to detect for the presence of soluble factors in their exosome isolates. Exosome isolates from both melanoma cell lines show cytokines are isolated along with exosomes but their expression profiles depend on the cell line and exosome isolation method. The current data also demonstrate that UC can lead to co-isolation of cytokines as soluble factors present in the exosome liquid matrix. Specifically, for the cell line 888-mel, IL-8 and IL-10 are observed to be cytokines present in extremely high concentrations. In cancer, IL-8 expression correlates with angiogenesis, tumorigenicity and metastasis [Citation41], and IL-10 producing melanoma have greater tumour progression in patients [Citation42]. The high expression of IL-10 is consistent with induction of IL-10 by BRAF-MAPK signalling since IL-10 expression is only detected abundantly in V600E BRAF mutant 888-melanoma cells [Citation26]. These concentrations were significantly reduced following the REIUS isolation method. These observations imply that studies isolating cytokines from exosomes following UC should discriminate between cytokines present as exosome cargo and soluble cytokines co-isolated during the UC procedure. The observed IL-8 isolation in melanoma supernatant is consistent with previous reports on melanoma expressing substantial amounts of IL-8 [Citation43–Citation45], and reports associating UC-derived EV isolates (that include exosomes) from the NCI-60 melanoma cell line with IL-8 when using proteomic analysis [Citation46] as listed in the exosome proteomics database ExoCarta [Citation47].
SEC isolated exosomes have been reported to have improved biological function compared to their UC-derived counterparts [Citation48–Citation50]. This is consistent with the present result that REIUS isolated exosomes (which includes SEC) express more PD-L1 on their surface while exosomes isolated using UC contain very few exosomes expressing PD-L1.
PEG-based exosome isolation methods have gained popularity due to the speed and convenience of isolation but despite several attempted modifications, the purity of the exosome isolates following PEG-based methods remains a concern [Citation51,Citation52]. Our results obtained with the ExoQuick ULTRA kit demonstrates that this method may not provide sufficient numbers of exosomes for analysis when using cell culture supernatants as a source.
The immunoaffinity capture-based technique is an alternative exosome isolation technique that was not part of the current study. The immunoaffinity approach has the potential to identify specific subsets of exosomes for specific functions. For example, immunoaffinity with TIM-4 antibodies has been used to identify immunosuppressive EV [Citation53]. The caveat of this approach however is that the function of subsets of EV in isolation may be different from the overall function of the heterogeneous EV milieu they were derived from which will likely be dependent on the phenotype of each EV subset and their relative abundance.
Bioinformatics approaches have been attempted to better interpret exosome content based on the presence or absence of certain known contaminant proteins. There are currently three main depositories for exosome-related databases: ExoCarta, EVpedia and Vesiclepedia. ExoCarta has been focusing on updating the integrity of its exosome database by removing non-extracellular vesicle studies, and also using non-exosomal p96 as a signature for non-exosomal contamination to eliminate citations within linked references [Citation54]. Other approaches have been to use cell-line specific markers for the antibody-affinity purification of exosomes, but this has limited applicability to in-vivo systems [Citation55], or to use bind-elute columns of larger MWCO, up to 700 kDa followed by the use of 100 kDa UF columns. The latter approach would have likely reduced any trace of soluble factors but this has not yet been specifically investigated [Citation56]. These combined efforts are laudable and should continue to be examined to improve qualitative interpretation on exosome content. Despite such progress, these efforts also reveal the limitations of the current bioinformatic approaches as the presence of contaminating factors impacts the functional evaluation of exosomes after isolation.
There currently is no consensus on the best method to isolate exosomes [Citation57–Citation59]. Each of the many available techniques has benefits and limitations but lack of consideration of these benefits and limitations further confounds the literature regarding comparisons and conclusions [Citation60]. Although there is a greater determination in the exosome field to unify exosome isolation techniques, currently only the exosomal RNA extraction technique (that does not require functional exosomes) has reached a consensus to standardize the isolation method [Citation61,Citation62]. The present study also clearly confirms the presence of EVs without endosomal markers as is in the case of UC supernatants, and therefore many exosomal databases should be re-examined for the presence of exosome-specific endosomal markers to determine whether EVs or exosomes were isolated. A significant improvement can be made if the current EV databases could include the method of EV isolation as this study demonstrates the impact of method on the contamination of isolates and consequently the potential global function of exosome preparations. There is a limitation to this study as we cannot conclude whether exosomes can internally carry soluble cytokines. These results may also affect our understanding of the immunomodulatory activity of exosomes on immune cells, and warrant the study of how these differences in isolation may affect the functional activity of T-cell activation. However, the evidence is sufficient to suggest that at least externally, exosomes can be essentially segregated from the presence of external cytokines when the proper exosome isolation method is chosen.
This study has also demonstrated that despite extensive and repeated filtration and ultrafiltration done in the REIUS method, traditional exosome isolation techniques such as UC are just as capable of enriching for exosomes that are TSG101 positive, and with similar size profile (i.e. < 200 nm) as the REIUS method. UC supernatants contain EV but they are virtually TSG101 negative, indicating that UC has been able to enrich for exosomes in the pellet. While there may be significant amounts of cytokines co-eluted during the UC isolation method as we have shown here, UC was indeed able to segregate and enrich for exosomes. But the UC technique when used alone does not exclude the presence of vesicles that are larger than 200 nm that are obviously not created by MVB. Among the specific restrictions applied to the definition of “exosomes” by the ISEV 2018 positional paper [Citation63], there is no restriction of size on isolation techniques. The current results support the use of a filtration method with a size-cut-off at 200 nm to be included in the definition.
In conclusion, different exosome isolation methods yield different products and thus choosing and reporting the method for exosome isolation should be done with caution. Many factors reported as exosome payloads may instead be co-elutes specific to the isolation technique used. As functions of exosomes are still being elucidated, isolating and investigating functional, whole populations of exosomes with the least soluble factor contamination ought to be critical aspects to consider when choosing an exosome isolation method.
Author Contributions
S.S. and C.L.A. carried out the exosome isolation, molecular, biochemical and cell biology work; Y.Y. and Y.W. performed the nPLEX experiments; E.H. performed the TEM experiments; K.H.T., H.M. and Y.W. discussed the study and contributed to the experimental design; M.S.E. supervised the research, designed experiments, analysed data and contributed to the writing and revision of the paper; all authors contributed to manuscript editing.
Competing Interests
All authors (S.S., Y.Y., C.L.A., E.H, K.H.T., H.M., Y.W. and M.S.E.) declare no potential conflict of interest.
Supplemental Material
Download Zip (1.6 MB)Acknowledgments
We would like to thank Ju H. Joh, M.P.H., MD for his assistance in editing the manuscript. We would also like to thank Don McFarland from Electron Microscopy Lab, Department of Pathology and Anatomical Sciences, University of Buffalo for TEM images taken using Hitachi HT7800 High Resolution Transmission Electron Microscope. This work was supported by The Katherine Anne Gioia Endowed Chair in Cancer Medicine, Roswell Park Comprehensive Cancer Center; National Cancer Institute (NCI) grant P30CA016056 involving the use of Roswell Park Comprehensive Cancer Center’s Flow and Image Cytometry Shared Resources, Genomics and Biomedical Data Science Shared Resources; NIH grants 5R33CA191245 (Y.W.), 1R50CA211108 (H.M.) and S10OD018048 (H.M.)
Disclosure statement
No potential conflict of interest was reported by the authors.
Data Availability Statement
Data sharing not applicable to this article as no datasets were generated or analysed during the current study.
Supplementary material
Supplemental data for this article can be accessed here.
Additional information
Funding
References
- Psaila B, Lyden D. The metastatic niche: adapting the foreign soil. Nat Rev Cancer. 2009;9(4):285–15.
- Aubuchon MM, Bolt LJ, Janssen-Heijnen ML, et al. Epidemiology, management and survival outcomes of primary cutaneous melanoma: a ten-year overview. Acta Chir Belg. 2017;117(1):29–35.
- Peinado H, Zhang H, Matei IR, et al. Pre-metastatic niches: organ-specific homes for metastases. Nat Rev Cancer. 2017;17(5):302–317.
- Weidle UH, Birzele F, Kollmorgen G, et al. The multiple roles of exosomes in metastasis. Cancer Genomics Proteomics. 2017;14(1):1–15.
- Konadu KA, Chu J, Huang MB, et al. Association of cytokines with exosomes in the plasma of HIV-1-seropositive individuals. J Infect Dis. 2015;211(11):1712–1716.
- Fitzgerald W, Freeman ML, Lederman MM, et al. A system of cytokines encapsulated in extracellular vesicles. Sci Rep. 2018;8(1):8973.
- Wieckowski EU, Visus C, Szajnik M, et al. Tumor-derived microvesicles promote regulatory T cell expansion and induce apoptosis in tumor-reactive activated CD8+ T lymphocytes. J Immunol. 2009;183(6):3720–3730.
- Whiteside TL. Exosomes in cancer: another mechanism of tumor-induced immune suppression. Adv Exp Med Biol. 2017;1036:81–89.
- Yoshimura A, Sawada K, Kimura T. Is the exosome a potential target for cancer immunotherapy?. Ann Transl Med. 2017;5(5):117.
- Maia J, Caja S, Strano Moraes MC, et al. Exosome-based cell-cell communication in the tumor microenvironment. Front Cell Dev Biol. 2018;6:18.
- Wu Y, Deng W, McGinley EC, et al. Melanoma exosomes deliver a complex biological payload that upregulates PTPN11 to suppress T lymphocyte function. Pigment Cell Melanoma Res. 2017;30(2):203–218.
- Chen G, Huang AC, Zhang W, et al. Exosomal PD-L1 contributes to immunosuppression and is associated with anti-PD-1 response. Nature. 2018;560(7718):382–386.
- Pashoutan Sarvar D, Shamsasenjan K, Akbarzadehlaleh P. Mesenchymal stem cell-derived exosomes: new opportunity in cell-free therapy. Adv Pharm Bull. 2016;6(3):293–299.
- Kano A. Tumor cell secretion of soluble factor(s) for specific immunosuppression. Sci Rep. 2015;5:8913.
- Zamarron BF, Chen W. Dual roles of immune cells and their factors in cancer development and progression. Int J Biol Sci. 2011;7(5):651–658.
- Webber J, Clayton A. How pure are your vesicles?. J Extracell Vesicles. 2013;2:19861.
- Whiteside TL. Extracellular vesicles isolation and their biomarker potential: are we ready for testing?. Ann Transl Med. 2017;5(3):54.
- Shu S, Yang Y, Allen CL, et al. Metabolic reprogramming of stromal fibroblasts by melanoma exosome microRNA favours a pre-metastatic microenvironment. Sci Rep. 2018;8(1):12905.
- Liu C, Zeng X, An Z, et al. Sensitive detection of exosomal proteins via a compact surface plasmon resonance biosensor for cancer diagnosis. ACS Sens. 2018;3(8):1471–1479.
- Ansel N-TCKM. Improved exosome isolation by sucrose gradient fractionation of ultracentrifuged crude exosome pellets. Protoc Exch. 2016.
- Muller L, Hong CS, Stolz DB, et al. Isolation of biologically-active exosomes from human plasma. J Immunol Methods. 2014;411:55–65.
- Nolan J, Duggan E. Cell-specific EV tetraspanin expression.Proceedings of the 34th congress of the International Society for Advancement of Cytometry; 2019, Vancouver, BC, Canada, p369. ( #475/B337).
- Ringuette Goulet C, Bernard G, Tremblay S, et al. Exosomes induce fibroblast differentiation into cancer-associated fibroblasts through TGFbeta signaling. Mol Cancer Res. 2018;16(7):1196–1204.
- Kruger-Krasagakes S, Krasagakis K, Garbe C, et al. Production of cytokines by human melanoma cells and melanocytes. Recent Results Cancer Res. 1995;139:155–168.
- Castelli C, Sensi M, Lupetti R, et al. Expression of interleukin 1 alpha, interleukin 6, and tumor necrosis factor alpha genes in human melanoma clones is associated with that of mutated N-RAS oncogene. Cancer Res. 1994;54(17):4785–4790.
- Sumimoto H, Imabayashi F, Iwata T, et al. The BRAF-MAPK signaling pathway is essential for cancer-immune evasion in human melanoma cells. J Exp Med. 2006;203(7):1651–1656.
- Stranska R, Gysbrechts L, Wouters J, et al. Comparison of membrane affinity-based method with size-exclusion chromatography for isolation of exosome-like vesicles from human plasma. J Transl Med. 2018;16(1):1.
- Lane RE, Korbie D, Trau M, et al. Optimizing size exclusion chromatography for extracellular vesicle enrichment and proteomic analysis from clinically relevant samples. Proteomics. 2019;e1800156.
- Sunshine JC, Nguyen PL, Kaunitz GJ, et al. PD-L1 expression in melanoma: a quantitative immunohistochemical antibody comparison. Clin Cancer Res. 2017;23(16):4938–4944.
- Li P, Kaslan M, Lee SH, et al. Progress in exosome isolation techniques. Theranostics. 2017;7(3):789–804.
- Gardiner C, Di Vizio D, Sahoo S, et al. Techniques used for the isolation and characterization of extracellular vesicles: results of a worldwide survey. J Extracell Vesicles. 2016;5:32945.
- Gheinani AH, Vogeli M, Baumgartner U, et al. Improved isolation strategies to increase the yield and purity of human urinary exosomes for biomarker discovery. Sci Rep. 2018;8(1):3945.
- Yang L, Wu XH, Wang D, et al. Bladder cancer cell-derived exosomes inhibit tumor cell apoptosis and induce cell proliferation in vitro. Mol Med Rep. 2013;8(4):1272–1278.
- Cheruvanky A, Zhou H, Pisitkun T, et al. Rapid isolation of urinary exosomal biomarkers using a nanomembrane ultrafiltration concentrator. Am J Physiol Renal Physiol. 2007;292(5):F1657–1661.
- Heinemann ML, Ilmer M, Silva LP, et al. Benchtop isolation and characterization of functional exosomes by sequential filtration. J Chromatogr A. 2014;1371:125–135.
- Ramirez MI, Amorim MG, Gadelha C, et al. Technical challenges of working with extracellular vesicles. Nanoscale. 2018;10(3):881–906.
- Guerreiro EM, Vestad B, Steffensen LA, et al. Soland TM: efficient extracellular vesicle isolation by combining cell media modifications, ultrafiltration, and size-exclusion chromatography. PLoS One. 2018;13(9):e0204276.
- Benedikter BJ, Bouwman FG, Vajen T, et al. Ultrafiltration combined with size exclusion chromatography efficiently isolates extracellular vesicles from cell culture media for compositional and functional studies. Sci Rep. 2017;7(1):15297.
- Aqrawi LA, Galtung HK, Vestad B, et al. Identification of potential saliva and tear biomarkers in primary Sjogren’s syndrome, utilising the extraction of extracellular vesicles and proteomics analysis. Arthritis Res Ther. 2017;19(1):14.
- Nordin JZ, Lee Y, Vader P, et al. Ultrafiltration with size-exclusion liquid chromatography for high yield isolation of extracellular vesicles preserving intact biophysical and functional properties. Nanomedicine. 2015;11(4):879–883.
- Waugh DJ, Wilson C. The interleukin-8 pathway in cancer. Clin Cancer Res. 2008;14(21):6735–6741.
- Itakura E, Huang RR, Wen DR, et al. IL-10 expression by primary tumor cells correlates with melanoma progression from radial to vertical growth phase and development of metastatic competence. Mod Pathol. 2011;24(6):801–809.
- Danesh A, Inglis HC, Jackman RP, et al. Exosomes from red blood cell units bind to monocytes and induce proinflammatory cytokines, boosting T-cell responses in vitro. Blood. 2014;123(5):687–696.
- Bar-Eli M. Role of interleukin-8 in tumor growth and metastasis of human melanoma. Pathobiology. 1999;67(1):12–18.
- Luca M, Huang S, Gershenwald JE, et al. Expression of interleukin-8 by human melanoma cells up-regulates MMP-2 activity and increases tumor growth and metastasis. Am J Pathol. 1997;151(4):1105–1113.
- Hurwitz SN, Rider MA, Bundy JL, et al. Proteomic profiling of NCI-60 extracellular vesicles uncovers common protein cargo and cancer type-specific biomarkers. Oncotarget. 2016;7(52):86999–87015.
- Mathivanan S, Simpson RJ. ExoCarta: a compendium of exosomal proteins and RNA. Proteomics. 2009;9(21):4997–5000.
- Mol EA, Goumans MJ, Doevendans PA, et al. Higher functionality of extracellular vesicles isolated using size-exclusion chromatography compared to ultracentrifugation. Nanomedicine. 2017;13(6):2061–2065.
- Kim JW, Wieckowski E, Taylor DD, et al. Fas ligand-positive membranous vesicles isolated from sera of patients with oral cancer induce apoptosis of activated T lymphocytes. Clin Cancer Res. 2005;11(3):1010–1020.
- Boing AN, van der Pol E, Grootemaat AE, et al. Single-step isolation of extracellular vesicles by size-exclusion chromatography. J Extracell Vesicles. 2014;3.
- Rider MA, Hurwitz SN, Meckes DG Jr.. ExtraPEG: a polyethylene glycol-based method for enrichment of extracellular vesicles. Sci Rep. 2016;6:23978.
- Brown PN, Yin H. Polymer-based purification of extracellular vesicles. Methods Mol Biol. 2017;1660:91–103.
- Nakai W, Yoshida T, Diez D, et al. A novel affinity-based method for the isolation of highly purified extracellular vesicles. Sci Rep. 2016;6:33935.
- Keerthikumar S, Chisanga D, Ariyaratne D, et al. ExoCarta: a web-based compendium of exosomal cargo. J Mol Biol. 2016;428(4):688–692.
- Mathivanan S, Lim JW, Tauro BJ, et al. Proteomics analysis of A33 immunoaffinity-purified exosomes released from the human colon tumor cell line LIM1215 reveals a tissue-specific protein signature. Mol Cell Proteomics. 2010;9(2):197–208.
- Corso G, Mager I, Lee Y, et al. Reproducible and scalable purification of extracellular vesicles using combined bind-elute and size exclusion chromatography. Sci Rep. 2017;7(1):11561.
- Tauro BJ, Greening DW, Mathias RA, et al. Comparison of ultracentrifugation, density gradient separation, and immunoaffinity capture methods for isolating human colon cancer cell line LIM1863-derived exosomes. Methods. 2012;56(2):293–304.
- Greening DW, Xu R, Ji H, et al. A protocol for exosome isolation and characterization: evaluation of ultracentrifugation, density-gradient separation, and immunoaffinity capture methods. Methods Mol Biol. 2015;1295:179–209.
- Andreu Z, Rivas E, Sanguino-Pascual A, et al. Comparative analysis of EV isolation procedures for miRNAs detection in serum samples. J Extracell Vesicles. 2016;5:31655.
- Taylor DD, Shah S. Methods of isolating extracellular vesicles impact down-stream analyses of their cargoes. Methods. 2015;87:3–10.
- Rekker K, Saare M, Roost AM, et al. Comparison of serum exosome isolation methods for microRNA profiling. Clin Biochem. 2014;47(1–2):135–138.
- Ding M, Wang C, Lu X, et al. Comparison of commercial exosome isolation kits for circulating exosomal microRNA profiling. Anal Bioanal Chem. 2018;410(16):3805–3814.
- Thery C, Witwer KW, Aikawa E, et al. Minimal information for studies of extracellular vesicles 2018 (MISEV2018): a position statement of the international society for extracellular vesicles and update of the MISEV2014 guidelines. J Extracell Vesicles. 2018;7(1):1535750.