
 ?Mathematical formulae have been encoded as MathML and are displayed in this HTML version using MathJax in order to improve their display. Uncheck the box to turn MathJax off. This feature requires Javascript. Click on a formula to zoom.
ABSTRACT
Small extracellular vesicles (sEVs) are important mediators of cell–cell communication with respect to diverse physiological processes. To further understand their physiological roles, understanding blood sEV homoeostasis in a quantitative manner is desired. In this study, we propose novel kinetic approaches to estimate the secretion and clearance of mouse plasma–derived sEVs (MP-sEVs) based on the hypothesis that blood sEV concentrations are determined by a balance between the secretion and clearance of sEVs. Using our specific and sensitive sEV labelling technology, we succeeded in analysing MP-sEV clearance from the blood after intravenous administration into mice. This revealed the rapid disappearance of MP-sEVs with a half-life of approximately 7 min. Moreover, the plasma sEV secretion rate, which is presently impossible to directly evaluate, was calculated as 18 μg/min in mice based on pharmacokinetic (PK) analysis. Next, macrophage-depleted mice were prepared as a model of disrupted sEV homoeostasis with retarded sEV clearance. MP-sEV concentrations were increased in macrophage-depleted mice, which probably reflected a shift in the balance of secretion and clearance. Moreover, the increased MP-sEV concentration in macrophage-depleted mice was successfully simulated using calculated clearance rate constant, secretion rate constant and volume of distribution, suggesting the validity of our PK approaches. These results demonstrate that blood sEV concentration homoeostasis can be explained by the dynamics of rapid secretion/clearance.
Introduction
Small extracellular vesicles (sEVs) are cell-derived vesicles composed by lipid bilayers with a diameter around 100 nm [Citation1]. Since the discovery that sEVs contain RNA and proteins derived from sEV-producing cells and that sEVs are abundant in blood [Citation1–Citation3], the roles of blood sEVs have been attracting attention because secreted sEVs can enter circulation, reach the target site, and be taken up by recipient cells to release their cargos and induce cellular responses in the body.
Considering that sEVs in the blood circulate around the body to reach recipient cells, understanding the dynamics of blood sEV concentration is indispensable. As a reasonable hypothesis to explain the dynamics of blood sEV, we propose the “balance hypothesis” herein, in which sEVs are constantly secreted into and cleared from the blood, and that the balance between these two processes determines their concentration. However, due to technical hurdles in measuring sEV clearance and secretion rate in the blood, this hypothesis has never been evaluated.
To estimate the clearance rate of blood sEVs, we have to overcome two technological hurdles, specifically the isolation of intact blood sEVs and sEV-specific labelling with high sensitivity. The “gold standard strategy” for analysing the blood clearance of cell culture–derived sEVs starts with sEV isolation followed by sEVs labelling with a lipophilic fluorescent dye (e.g. carbocyanine dyes, such as DiO and DiI) [Citation4]. For the isolation step, physiochemically intact sEVs are desirable because this property is a critical determinant of nanoparticle clearance from blood circulation [Citation5]. However, due to the concurrent presence of lipoprotein particles and plasma proteins, isolation of physiochemically intact sEVs from blood is very challenging [Citation6]. Moreover, non-specific labelling of co-isolated lipoprotein particles in addition to blood sEVs by lipophilic fluorescent dye also hinders the use of the “gold standard strategy” [Citation7].
sEVs are secreted by diverse cells from different organs into blood with theoretically different secretion rate [Citation1–Citation3,Citation8]. Thus, it is very difficult to directly analyse sEVs secretion into blood. Recently, the secretion rate of cell culture–derived EVs has been proposed using a stable CD63-pHluorin–expressing cell line [Citation9]. However, such methodology cannot be applied to evaluate the sEV secretion rate in blood. In this study, we propose novel kinetic approaches to estimate the secretion/clearance rate of mouse plasma–derived sEVs (MP-sEVs) and validate the “balance hypothesis”.
To overcome the two hurdles to estimate MP-sEVs clearance rate, an isolation method based on size exclusion chromatography (SEC) was selected to obtain physiochemically intact sEVs and chimeric gLuc (Gaussia luciferase, a reporter protein) proteins were used to specifically label MP-sEVs [Citation10,Citation11]. After estimating the clearance rate, pharmacokinetic (PK) analysis was applied to indirectly calculate the total secretion rate of sEVs into blood assuming that they are produced and secreted at zero-order kinetics. We finally validated our hypothesis using a macrophage-depleted (MD) mouse model in which sEVs clearance is markedly disrupted [Citation11].
Materials and methods
sEV isolation from mouse plasma
Na/EDTA-treated mouse plasma from Balb/c mice (Lot: 22071, 24734) was obtained from Innovative Research (MI, USA). Plasma specimens were subjected to sequential centrifugation (2,000 × g for 10 min and 10,000 × g for 30 min). Clarified plasma was passed through a 0.22-μm filter to remove large microvesicles and large lipoproteins and used for subsequent sEV isolation [Citation1]. SEC-based isolation was conducted in reference to the previous paper with some modifications [Citation12]. In brief, sepharose 2B (Sigma-Aldrich, St. Louis, MO, USA) was packed into 1.5 cm × 12 cm mini-columns (Bio-Rad, Herculues, CA, USA; Econo-Pac columns) to make a 10-mL column bed. The column was blocked with 2% bovine serum albumin (BSA) solution and washed with phosphate saline buffer (PBS). Then, the filtered plasma sample (1 mL) was loaded onto the column and the eluate was collected (fraction 0). Subsequently, 1 mL of PBS was repeatedly subjected to collect the following fractions, which were sequentially numbered. For ultracentrifugation (UC)-based isolation, filtered plasma was spun at 100,000 × g for 1 h (Himac CP80WX ultracentrifuge, Hitachi Koki; P50AT2 angle rotor, Hitachi Koki) to obtain pellets. The pellets were then washed with PBS and recovered in PBS as the sEV-enriched fraction. For polyethylene glycol (PEG)-based isolation, filtered plasma was mixed with an equal volume of 16% PEG6000 (Wako, Osaka, Japan). The mixture was then incubated overnight at 4°C with gentle agitation. Then, the mixture was centrifuged at 4,000 × g for 1 h to obtain pellets. The pellets were resuspended in PBS and spun at 100,000 × g for 1 h. The fraction was then recovered in PBS as the sEV-enriched fraction. The number of isolated sEVs was measured based on protein content based on the Bradford assay.
Plasmid DNA (pDNA) encoding gLuc, gLuc-lactadherin (gLuc-LA), gLuc-perfringolysin-O (gLuc-PFG), and gLuc-lysenin (gLuc-Lys)
pDNA encoding gLuc and gLuc-LA was obtained as previously described [Citation10,Citation11,Citation13]. The coding sequence of perfringolysin-O (PFG; high affinity to cholesterol) and lysenin (Lys; high affinity to sphingomyelin) was synthesized by FASMAC (Kanagawa, Japan). The chimeric sequences of gLuc-PFG and gLuc-Lys were prepared by a 2-step PCR method as described previously [Citation10]. The sequences encoding fusion proteins were subcloned into the BamH1/Xba1 site of the pcDNA3.1 vector (Thermo Fisher Scientific) to construct pCMV vectors encoding corresponding fusion proteins.
sEV isolation from B16BL6 cells
B16BL6 murine melanoma cells were obtained and cultured as described previously [Citation10,Citation11,Citation13]. B16BL6 cells were transfected with pDNA using polyethylenimine (PEI) “Max” (Polysciences, Warrington, PA) in accordance with a previous report [Citation10]. After transfection, the medium was replaced with Opti-MEM (ThermoFisher Scientific, Waltham, MA, USA) and cultured for 24 h. The conditioned medium was collected and subjected to sequential centrifugation (300 × g for 10 min, 2,000 × g for 20 min, and 10,000 × g for 30 min) to remove cell debris and large vesicles. In addition, the medium was filtered with a 0.22-μm filter. The clarified medium was spun at 100,000 × g for 1 h (Himac CP80WX ultracentrifuge). The supernatant was then collected for subsequent experiments. The pellet was resuspended in PBS and spun again at 100,000 × g for 1 h. The sEVs were recovered in PBS.
Preparation of chimeric gLuc protein-enriched sample
The recovered supernatant during sEV isolation from B16BL6 cells, described previously herein, was passed through an Amicon Ultra 100K (Merck Millipore, Billerica, MA) to remove the remaining vesicles or protein aggregates. The flow-through medium was the concentrated by ultrafiltration (Amicon Ultra 10K for gLuc protein and Amicon Ultra 30 K for gLuc-LA, gLuc-PFG, and gLuc-Lys, respectively).
Chimeric gLuc-protein labelling of B16BL6/mouse plasma-sEVs
Clarified mouse plasma or concentrated B16BL6 condition medium was mixed with gLuc, gLuc-LA, gLuc-PFG, or gLuc-Lys. After the mixture was incubated under the indicated condition (incubation time and incubation temperature), samples were applied to SEC for the purification of labelled sEVs from unbound proteins. Labelled sEVs were mixed with a sea pansy luciferase assay reagent (Picagene Dual; Toyo Ink, Tokyo, Japan). The chemiluminescence was then measured with a luminometer (Lumat LB 9507; EG&G Berthold, Bad Wildbad, Germany). Labelling efficiency (RLU/s/μg) was calculated as luciferase activity (RLU/s/mL) divided by protein concentration (μg/mL).
Labelling stability of chimeric gLuc proteins to MP-sEV in mouse serum
sEVs labelled with chimeric gLuc proteins were incubated in 10% mouse serum in PBS solution at 37°C with gentle agitation. Samples were collected at the indicated time points. The stability of gLuc enzyme activity was evaluated by measuring gLuc enzyme activity in the collected samples. Samples were applied to SEC and the elute was collected in 14 sequential fractions of 1 mL. GLuc enzyme activity in each fraction was measured to evaluate the release of gLuc proteins from sEVs.
Characterization of MP-sEVs
Electron microscopy–based morphologies, vesicle sizes and surface charges of the sEV samples were evaluated as described previously [Citation10,Citation11,Citation13]. The morphology of sEV and LDL/VLDL was distinguished by referring to the reported morphology and size of MP-sEV [Citation12,Citation14,Citation15]. To analyse size distribution of the sEV samples, TEM images were analysed using ImageJ software (Rasband, W.S., U.S. National Institutes of Health, Bethesda, Maryland, USA). qNano instrument (Izon Science Ltd., Christchurch, New Zealand) was also used for size measuremt. NP150 nanopore was used according to the manufacturer’s instructions. All sEV samples and calibration particles (Izon Science Ltd.) were measured at 47.0 mm stretch with a voltage of 0.5-0.8 V. Collected data were processed by Izon Control Suite software version 3.3. For immunoelectron microscopy, gLuc-LA-labelled MP-EVs were fixed with 4% paraformaldehyde in PBS. Then, the sample was applied to a carbon formvar film-coated TEM grid (Alliance Biosystems, Osaka, Japan) and incubated for 20 min. The grid was washed with 50 mM glycine in PBS and blocked with 5% BSA in PBS. The grid was stained with rabbit anti-gLuc antibody (1:500 dilution, Lot; 0041211, Cat No; E89023S, New England Biolabs Inc., Madison, WI, USA) for 30 min. After washing with 0.5% BSA in PBS, the sample was incubated with a 10-nm protein A-gold conjugate (BB) Solution (Cardif, UK) for 20 min, followed by immerse fixation by 1% glutaraldehyde in PBS. Following washing with distilled water, the grid was stained with uranyl acetate and observed by TEM. For sodium dodecyl sulphate-polyacrylamide gel electrophoresis (SDS-PAGE) of sEVs samples was performed as described previously [Citation16]. For gLuc zymography, each sample was electrophoresed under nonreducing conditions on SDS polyacrylamide gels. The chemiluminescence was observed by LAS3000 instrument (Fujifilm, Tokyo, Japan). For protein staining, the gel was stained with LumiteinTM Protein Gel reagent (Biotium, Inc., Landing Parkway Fremon, CA, USA) according to the manufacturer’s protocol. The stained gel was observed using the LAS-3000 instrument (FUJIFILM, Tokyo, Japan). Western blotting analysis of sEV markers (CD63, Alix, HSP70) was conducted as described previously [Citation11,Citation13,Citation16]. The following antibodies were used; rabbit anti-mouse CD63 antibody (1:200 dilution, Lot; B0311, Cat No; sc-15363, Santa Cruz Biotechnology, Dallas, TX, USA), mouse anti-mouse Alix antibody (1:20,000 dilution, Lot; 35610, Cat No; 611620, BD Biosciences, San Jose, CA, USA), rabbit anti-mouse HSP70 antibody (1:1,000 dilution, Lot; 10/2017, Cat No; 4872S, Cell Signalling Technology, Danvers, MA, USA) and mouse anti-rabbit IgG-HRP (1:2,000 dilution, Lot; A0316, Cat No; sc-2357, Santa Cruz Biotechnology), rabbit anti-mouse IgG-HRP (1:2,000 dilution, Lot; 364278A Cat No; 61–0120, Thermo Fisher Scientific). For detection of surface markers of gLuc-LA-labelled-MP-sEVs (annexin V, CD63, Lamp2), protein A/G magnetic beads (2.5 µL, Lot; TJ273976, Cat No; 88802, Thermo Scientific, Waltham, MA, USA) was incubated with gLuc antibody at a 1:25 dilution for 1 h at room temperature with gentle agitation. After the beads were washed with PBS, the beads were resuspended in 50 µL of PBA with 2 µg of sEV sample for 1 h incubation. The sEVs captured on beads were magnetically separated, washed with PBS and resuspended in 500 µL of PBS. For detection of surface molecules of the sEV, 50 µL aliquots of sEVs captured on beads were incubated with the indicated fluorescent labelled protein or antibody for 1 h with gentle agitation. The used fluorescent labelled protein or antibody are as follow; FITC-labelled annexin V (1:25 dilution, Lot; B284572, Cat No; 640905, Biolegends; San Diego, CA, USA), Alexa fluor 488-labelled Lamp2 antibody (1:25 dilution, Lot; 1944990, Cat No; 53-1072-80, Thermo Fisher Scientific), PE-labelled CD63 antibody (1:25 dilution, Lot; B288704, Cat No; 143903, Biolegends). After the sEVs on beads were washed with PBS, the fluorescence was detected by GalliosTM flow cytometry (Beckman Coulter, Miami, FL, USA). Data were analysed using Kaluza software (version 1.0, Beckman Coulter).
Liposome preparation (PS, PG and clodronate liposomes)
Phosphatidylserine (PS)-rich liposomes and phosphatidylglycerol (PG)-rich liposomes were prepared by a thin film hydration method, as previously described [Citation13]. Liposomes containing disodium clodronate tetrahydrate (clodronate; Tokyo chemical industry Co., LTD, Tokyo, Japan) were prepared according to the previous report [Citation11]. Liposomes were stored at 4°C until use.
Immunoprecipitation
Coating an anti-ApoB antibody (Lot; 2007015, Cat No; NB200527, Novus Biologicals, Littleton, CO, USA) with magnetic beads was performed by mixing 10 μL of magnetic beads (pierceTM ProteinA/G magnetic beads; Thermo Scientific) with 10 μL the anti-ApoB antibody, which was then gently agitated on a shaker at room temperature for 1 h. Anti-ApoB antibody-coated magnetic beads were washed twice with PBS using a magnet and resuspended in EV samples (4 μg in 50 μL), which were then gently agitated on a shaker at room temperature for 1 h. Next, the beads were collected using a magnet and the supernatant (non-captured fraction) was harvested. The magnet beads were washed twice with PBS and resuspended in PBS (captured fraction). The captured fraction and non-captured fraction were used for downstream assays.
Concentration of gLuc-LA-labelled-MP-sEVs (gLuc-LAMP-sEVs) from the SEC eluate
Protein A/G magnetic beads (50 µL; Thermo Scientific Fisher) were incubated with gLuc antibody at a 1:25 dilution for 1 h at room temperature with gentle agitation. After the beads were washed with PBS, the beads were resuspended in 150 µL of PBS with 80 µg of gLuc-LAMP-sEV sample for 1 h incubation. The sEVs captured on beads were magnetically separated and washed with PBS. The sEV-beads complexes were treated with 100 mM glycine buffer (pH2.0) for 10 min with gentle agitation. Then the tubes were placed on a magnet and supernatants were carefully collected. Immediately after the supernatant collection, 250 mM NaOH was added for neutralization.
PKH26 labelling of gLuc-LAMP-sEV
For labelling of the indicated gLuc-LAMP-sEVs loaded onto gLuc antibody-conjugated magnetic beads, PKH26 dye (Sigma Aldrich, St. Louis, MO, USA) in a diluent C buffer (Sigma Aldrich) was added to the sEV-bead complexes and incubated for 5 min at room temperature. The sEVs on beads were washed with 5% BSA in PBS followed by PBS washing 3 times to remove the free dye. Then, gLuc-LAMP-sEV labelled with both PKH26 was eluted from the beads as described above.
Estimation of sEV clearance from blood
All protocols for animal experiments were approved by the Animal Experimentation Committee of the Graduate School of Pharmaceutical Sciences of Kyoto University. MD mice were prepared by intravenous injection of clodronate-encapsulated liposome and confirmed by methods described previously [Citation11]. Apparent worsening health status of mice was not observed after the treatment. The clearance of gLuc-LA-labelled MP-sEVs from blood, after their intravenous administration into the tail vein of mice (the indicated MP-sEV amount in 200 µL/dose), was measured based on a luciferase activity as described previously [Citation11,Citation13]. In brief, blood samples were collected at the indicated time points. Blood was centrifuged at 8,000 × g for 20 min to obtain serum. The gLuc enzyme activity of serum was measured as described above. The obtained data were analysed by two-compartment PK model. Compartment PK analysis is an established mathematical analysis widely used to kinetically simulate the in vivo behaviour of drug after administration [Citation17]. In two-compartment intravenous model, intravenously administered drug circulate around the body under several assumptions as follows; 1. The body is divided into central (blood circulation) and peripheral compartment; 2. Intravenously administered drug enters and instantaneously distributes to the central compartment; 3. Drug concentrations in the compartments equal to the amounts divided by volumes (i.e. concentration in the plasma ; Cc: concentration in the central compartment, Xc: drug amount in the central compartment, Vc: volume of distribution of central compartment); 4. Drug in the central compartment transfer to the peripheral compartment and vice versa with a first-order fractional constant k12: first-order rate constants for distribution from central compartment to peripheral compartment, and k21: first-order rate constants for distribution from peripheral compartment to central compartment. 5. Drug only in central compartment is eliminated with a rate constant kel, first-order elimination rate constants from the body. Mass balance in central and peripheral compartment can be described as follows:
Xp is drug amount in the peripheral compartment. The parameter Xc can be depicted by integrating the differential equation described above as follows:
where parameter α and β are defined as follows:
Drug concentration Cc(t) at time (t) can be defined as dividing Xc(t) by volume of distribution of the central compartment Vc.
where parameter A and B are defined as follows:
In the current study, Cc was defined as plasma sEV concentration (CsEV) and the parameters A, B, α and β were determined using the nonlinear least-squares programme MULTI [Citation18] to fit a calculated curve to the obtained blood concentration–time profile from 5 to 240 min.
Elimination half-time (t1/2el) is calculated as follow:
Estimation of sEV secretion into blood
To estimate the sEV secretion rate, a two-compartment PK model with intravenous infusion analysis was applied. Under this model, drug is constantly entering the central compartment at zero-order kinetics. Mass balance can be described as follows:
where parameter k0 is defined as first-order rate constants for infusion.
At a steady state, the rate of changes in parameters Xc and Xp are zero, hence
Cc was defined as plasma sEV concentration (CsEV) in this study. Hence, CsEV is defined as follows:
Biodistribution of gLuc-LA-labelled MP-sEV after intravenous administration
For the cellular uptake of gLuc-LAMP-sEV in the accumulated organs, mice received an intravenous injection of sEVs labelled with PKH26. Four hours after the injection, mice were sacrificed for liver collection. The harvested organs were frozen at −80°C, and the frozen sections were cut with a freezing microtome (Leica CM3050 S; Leica Biosystems, Germany). The sections were air dried and fixed with 4% paraformaldehyde in PBS. After washing with PBS, sections were stained with alexa fluor 488-labelled anti-mouse F4/80 Ab (1:50 dilution; Biolegends) for 1 h at 37. The specimens were washed 3 times with PBS and observed under a fluorescence microscope (Biozero BZ-8000; Keyence, Osaka, Japan).
Quantitation and characterization of steady state MP-sEVs
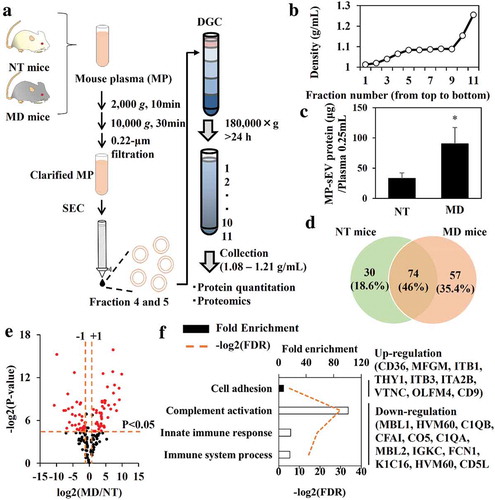
SEC was used to isolate the MP-sEV-enriched fraction from plasma. To remove LDL contaminants, fractions 4 and 5 of the SEC elute were subsequently subjected to OptiprepTM (Axis-Shield Poc, Oslo, Norway)-density UC. Briefly, 13%, 17%, 20%, 25% and 60% Optiprep solutions [13%; 1.060 g/mL (1 mL), 17%; 1.072 g/mL (2 mL), 20%; 1.081 g/mL (2 mL), 25%; 1.096 g/mL (2 mL) and 60%; 1.201 g/mL (2 mL), respectively] were sequentially layered in an UC tube to form the gradient. Then, samples (2 mL) were layered onto the top or bottom and UC was performed at 180,000 × g for more than 24 h. Samples were collected in 11 sequential fractions of 1 mL from top to bottom. Fractions corresponding to sEV density were collected for further protein quantitation and proteome analysis.
Affinity capture of MP-sEV using Tim4-conjugated beads
After Tim4-conjugated beads (30 µL, Lot, CAL1998, Cat No; 291–79721, Wako Fujifilm, Osaka, Japan) were washed with the wash buffer according to manufacturer’s instruction, the beads were incubated with 2 µg of sEV sample in 50 µL PBS for 1 h incubation with gentle agitation. The tubes were placed on a magnet and supernatants were carefully collected. After the beads were washed with PBS, the beads were assayed by flow cytometry or the sEVs on the beads were eluted by the elution buffer (20 mM Tris-HCl, pH 7.4, 150 mM NaCl, 2 mM EDTA) and used for the downstream assay.
sEV proteome analysis
Isolated sEV-related proteins were reduced with 10 mM dithiothreitol (Wako, Osaka, Japan) for 30 min, alkylated with 50 mM iodoacetamide (Sigma-Aldrich) for 30 min, and digested with Lys-C (Wako, 1:50 enzyme-to-protein ratio) for 3 h followed by trypsin (Promega, 1:50 enzyme-to-protein ratio) overnight in 50 mM ammonium bicarbonate (Wako). Digestion was stopped by the addition of trifluoroacetic acid to a final concentration of 0.5%. The peptide mixture solution was desalted with reversed-phase StageTips [Citation19] and 250 ng of peptides were injected onto a nanoLC/MS/MS system consisting of an Ultimate 3000 RSLCnano nanoLC pump and Q-Exactive tandem mass spectrometer (Thermo Fisher Scientific, Bremen, Germany). Peptides were separated by a self-pulled analytical column (150 mm length × 100 μm i.d.) packed with ReproSil-Pur C18-AQ materials (3 μm, Dr. Maisch GmbH, Ammerbuch-Entringen, Germany), using a 65-min gradient of 5–40% B (solvent A was 0.5% acetic acid and solvent B was 0.5% acetic acid in 80% acetonitrile) at a flow rate of 500 nL/min. The applied ESI voltage was 2.4 kV and the MS scan range were m/z 350–1500 at a resolution of 70.000 (at m/z 200) in the orbitrap using an AGC target value of 3 × 10⁶ charges. The top 10 precursor ions were selected for subsequent MS/MS scans in the HCD (higher-energy collision) cell and acquired at a resolution of 17.500 (at m/z 200) in the orbitrap using an AGC target value of 1 × 10⁵ charges and an underfill ratio of 1%. Dynamic exclusion was applied with an exclusion time of 30 s. Peptides were identified with Mascot version 2.6.1 (Matrix Science, London, UK) against the SwissProt Database (version 2017_04) with a precursor ion mass tolerance of 5 ppm and a product ion mass tolerance of 0.02 Da. Up to two missed trypsin cleavages were allowed. Cysteine carbamidomethylation was set as a fixed modification and methionine oxidation was allowed as a variable modification. Peptides were primarily considered identified if the Mascot score was greater than the 95% confidence limit based on the identity score of each peptide. False discovery rates less than 1% were estimated by searching against a randomized decoy database. The label-free quantification of peptides was based on the peak area on the extracted ion chromatograms.
Statistical analysis
Differences between two groups and multiple groups were evaluated using the student t-test and Tukey-Kramer test, respectively, and p < 0.05 was considered statistically significant.
Results
Characterization of MP-sEVs isolated by SEC
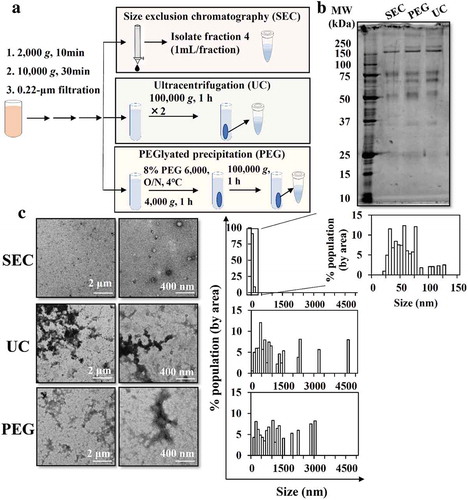
The separation of sEVs from soluble proteins by SEC was confirmed by the elution pattern of purified murine melanoma B16BL6-sEVs and soluble proteins (BSA and gLuc-LA protein) (Figure. S1A, S1B). B16BL6-sEVs were most abundant in fraction 4. Therefore, we decided to isolate fraction 4 as the sEV-enriched fraction and used it for downstream experiments unless otherwise mentioned. Physicochemical properties, as well as the protein composition, of MP-sEVs-enriched SEC eluate were characterized and compared with those of MP-sEVs-enriched pellets collected by UC and PEG-based methods (). SEC eluate sample appeared to be relatively free of albumin, ApoB, ApoE and apo A-I (band at approximately 70, above 240, 37 and 25 kDa, respectively) compared to those isolated by other methods (). Aggregation was observed in UC and PEG samples, as reflected by size histogram (), while SEC eluate was enriched in unclustered, morphologically intact membrane vesicles, which were probably MP-sEVs. Based on these results, SEC was chosen as an MP-sEV isolation method.
Figure 1. Comparison of methods to isolate sEVs from mouse plasma. (a) Scheme for sEV isolation from mouse plasma through SEC, UC, and PEG-based isolation. (b) Protein profiles were examined by SDS-PAGE (0.1 µg protein/lane). (c) Morphology was examined by TEM. TEM images in low (left) and high (right) magnification are shown. Representative TEM images were analysed by Image J software to measure the size histogram.
Preparation of gLuc-LA-labelled MP-sEVs
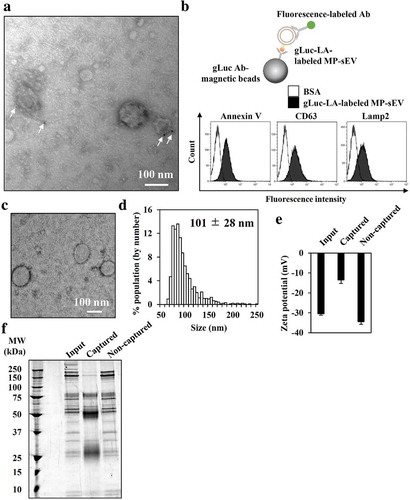
Next, we tried to optimize the protocol for labelling MP-sEVs using chimeric gLuc proteins (). Proteins that can bind target lipids, such as lactadherin (LA; high affinity to PS), perfringolysin-O (PFG; high affinity to cholesterol) and lysenin (Lys; high affinity to sphingomyelin), were used to prepare gLuc-LA, gLuc-PFG and gLuc-Lys, respectively (Figure. S1C–S1G). After incubating mouse plasma with the chimeric gLuc proteins followed by SEC, the gLuc enzyme activity per sEV-related protein content was 10-fold higher for gLuc-LA compared to that for gLuc-Lys or gLuc-PFG (). Next, labelling stability in mouse serum was examined (). For all the three chimeric gLuc proteins, approximately 80% of initial gLuc enzyme activity was retained after 4 h of incubation. SEC analysis revealed that gLuc-LA-labelled MP-sEVs (gLuc-LAMP-sEVs) were eluted at fraction 4, which corresponded to sEVs, irrespective of the incubation time. In contrast, gLuc enzyme activity was detected in fractions 8–11 after incubating gLuc-PFG- and gLuc-Lys-labelled MP-sEVs in mouse serum, suggesting the release of gLuc-PFG and gLuc-Lys from MP-sEVs. Based on these results, gLuc-LA was selected, and labelling conditions were optimized to prepare gLuc-LAMP-sEVs with high gLuc enzyme activity (Figure. S2, S3). For the final optimized conditions of labelling, gLuc-LA (> 5 × 10⁸ RLU/s) was incubated with mouse plasma (0.5 mL) for > 1 h at 4°C with gentle agitation. MP-sEV was successfully isolated regardless of gLuc-LA labelling based on the observation of similar sEV-like vesicle by TEM, detection of comparable protein profile and western blotting against EV markers (CD63, Alix, and HSP70) (Figure. S4). Figure. S5 indicates that gLuc-LA bound to sEVs through LA, which has high affinity for PS enriched on the surface membrane. Then, the possibility of gLuc-LA labelling to LDL/VLDL particles, which are expected to be contaminated in gLuc-LAMP-sEVs-enriched SEC eluate, was evaluated. Immunoprecipitation experiments revealed that gLuc-LA scarcely labelled LDL/VLDL particles (Figure. S6). Moreover, successful labelling of gLuc-LA to MP-sEVs was confirmed by the observed gLuc antibody-coated immunogold on the surface of MP-sEVs based on immunoelectron microscopy () as well as detection of sEV marker (CD63, Lamp2) of gLuc-LAMP-sEVs loaded on gLuc antibody-coated beads (gLuc Abbeads) by flow cytometry (). Then, gLuc-LAMP-sEVs in the SEC eluate sample was immunocaptured by gLuc Abbeads, followed by purification and elution in order to characterize sEVs labelled by gLuc-LA. shows that gLuc-LAMP-sEVs were spherical vesicle with approximately 100 nm in diameter and possessed negative charge (−13.5 ± 1.9 mV). The surface charge data of input (−30.5 ± 0.7 mV) and non-captured fraction (−34.5 ± 1.3 mV) is assumed to reflect the surface charge of the co-isolated molecules in the SEC eluate (Figure. S6). Protein staining result shows distinct protein composition of gLuc-LAMP-sEVs ().
Figure 2. MP-sEV labelling by chimeric gLuc proteins and stability in serum. (a) Schematic workflow of MP-sEV labelling with chimeric gLuc proteins. (b) The luciferase activity per sEV protein amounts of MP-sEV incubated with approximately 5–7 × 10⁹ RLU of gLuc-LA, gLuc-Lys or gLuc-PFG. The results are expressed as the percentage relative to gLuc-LA. (c) Time-course of gLuc activity for gLuc-LA-, gLuc-PFG- or gLuc-Lys-labelled MP-sEVs incubated with 10% mouse serum in PBS at 37°C. (d–f) SEC analysis of (d) gLuc-LA-, (e) gLuc-PFG- or (f) gLuc-Lys-labelled MP-sEVs incubated with 10% mouse serum in PBS at 37°C for the indicated time periods.
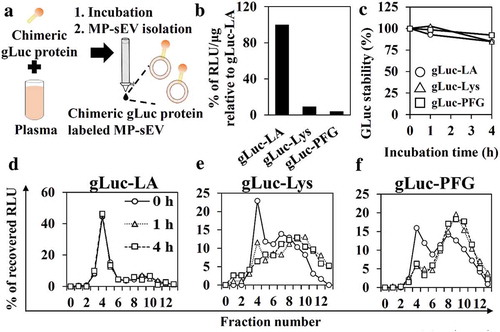
Figure 3. Characterization of gLuc-LA-labelled MP-sEVs (gLuc-LAMP-sEVs). (a) Transmission electron microscopy (TEM) observation of gLuc-LAMP-sEVs stained with protein A-gold nanoparticles (indicated by arrows) after reacting with an anti-gLuc antibody. (b–f) gLuc-LAMP-sEVs in the SEC eluate sample was immunocaptured by gLuc antibody-coated magnetic beads. (b) To confirm the sEV capturing by the beads, the sEVs-beads complexes were subsequently stained with the indicated FITC-annexin V (high affinity to PS), PE-anti-CD63 antibody, or alexa fluor 488-anti-Lamp2 antibody and analysed by flow cytometry. BSA was set as a control sample against the sEV. Then, the sEV was eluted from the beads and psychochemical properties as well as protein composition was identified as follow: (c) sEV morphology by TEM analysis, (d) Size histogram measured by qNano instrument, (e) Zeta potential of sEV, and (f) SDS-PAGE analysis (0.7 µg/lane). The input and non-captured fraction of the immunocapturing was simultaneously analysed for zeta potential and SDS-PAGE.
Macrophage-dependent rapid clearance of systemically injected MP-sEVs from the circulation of mice
Next, the serum concentration profile of gLuc-LAMP-sEVs after intravenous injection into mice was evaluated. GLuc enzyme activity in the mouse serum treated with gLuc-LAMP-sEVs quickly disappeared with a half-life of 7 min, almost irrespective of the investigated doses of MP-sEVs (approximately 3–25 μg MP-sEV protein/dose; ). As MP-sEVs are composed of a heterogenous population of particles with different physiochemical properties, PKs might differ depending on the subpopulation of MP-sEVs. To investigate this possibility, gLuc-LAMP-sEVs (total sEVs) were further fractionated into low-density (named “LD-sEV”; 1.00–1.07 g/mL) and high-density (“HD-sEV”; 1.07–1.21 g/mL) groups by density gradient centrifugation (DGC). Similar to the total sEVs fraction, LD-sEVs and HD-sEVs quickly disappeared from circulation after intravenous administration (Figure. S7).
Figure 4. Clearance of gLuc-LAMP-sEVs from circulation in NT and MD mice. (a) The dose effect on the time-course of serum concentrations of gLuc activity after the intravenous administration of gLuc-LAMP-sEVs into NT mice. The dose was expressed as gLuc activity per dose (RLU/10s/dose). Protein dose for 2.9 × 10⁸, 5.2 × 10⁹, 8.7 × 10⁸ and 3.5 × 10⁹ RLU/10s/dose are 3, 7.8, 8.5 and 25 μg/dose, respectively. Results are expressed as the mean of the percentage of the administered dose/mL (% ID/mL) ± SD (n = 3). (b) NT mice were treated with gLuc-LAMP-sEVs. The MP-sEVs were imaged 5 min after intravenous administration of MP-sEVs through a bolus intravenous administration of coelenterazine (a gLuc substrate). The chemiluminescence was detected. Left; chemiluminescence image. Right; bright field image. (c) Cellular uptake of gLuc-LAMP-sEVs in the liver. The MP-sEVs were labelled with PKH26, followed by intravenous administration into mice. Four hours after the injection, the liver was collected and cut into cryostat section. The section was stained with F4/80-specific antibody and observed by fluorescence microscopy. (d) Immunofluorescence staining of liver macrophages after clodronate-encapsulated liposome treatment. Upper images: the green channel corresponds to F4/80-specific antibody-derived signals. Lower images: bright field. (e) Time-course of serum concentrations of gLuc activity after the intravenous administration of gLuc-LAMP-sEVs (9.1 × 10⁸ RLU/10s/dose; approximately 1 μg MP-sEV protein/dose) into NT mice (open symbols) or MD mice (closed symbols). Results are expressed as the mean of the percentage of the administered dose/mL (% ID/mL) ± SD (n = 3). *p < 0.05 versus NT mice.
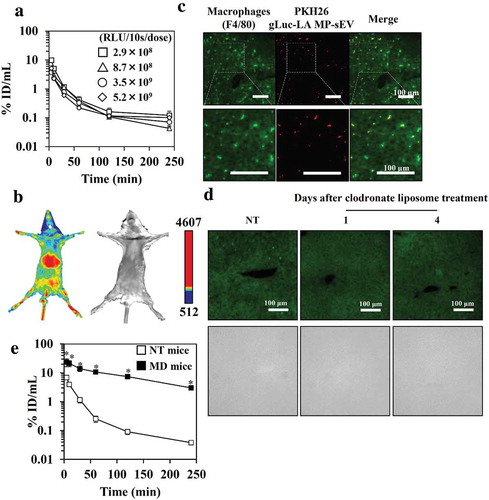
In vivo imaging showed that gLuc-LAMP-sEVs mainly distributed to the liver (). Moreover, immunostaining of macrophage (F4/80+ cells) in the liver and microscopic observation indicates that gLuc-LAMP-sEVs was taken up by macrophage in the liver (). To evaluate the role of macrophages in the blood clearance of MP-sEVs, MD mice were prepared via the administration of clodronate liposome. Macrophages were absent from the liver and this depletion was retained from at least day 1 to day 4 after this protocol (). Macrophage depletion retarded the rate of the decline in gLuc enzyme activity in the serum ().
Increased MP-sEV concentration after macrophage depletion
Next, we measured the MP-sEV concentration in non-treated (NT) and MD mice. As MP-sEV samples isolated by SEC were contaminated with LDL particles (Figure. S6A), we subjected these samples to DGC to remove LDL particles based on differences in density (LDL, 1.01–1.06 g/mL versus sEVs, 1.08–1.21 g/mL, ) [Citation12]. A typical density profile for each fraction after centrifugation is shown on . In this case, fractions 5–10 were collected for sEV-related protein analysis and quantitation. After successful depletion of LDL was confirmed (Figure. S8A–S8C), sEV was captured by Tim4 (high affinity to PS on the sEV membrane)-coated beads (Tim4beads) and protein amount as well as sEV marker of the sEV- Tim4beads complexes (captured fraction) were analysed. Figure. S8D–S8F indicates that more than 90% of the protein in the SEC+DGC treated sample was associated with sEVs interacted with Tim4beads, suggesting that the protein amount mostly reflected the sEV-related protein amount. After identification of sEV from NT and MD mice (Figure. S9A–S9D), it was revealed that macrophage depletion approximately tripled the amount of MP-sEV-related protein (). We then performed proteomic analysis of sEV-related proteins from of NT and MD mice. LC-MS/MS was performed in triplicate for each sample and commonly identified proteins were selected for downstream analysis (, Figure. S9E). Identified proteins were ranked based on a volcano plot according to their statistical p-value and their relative difference in abundance (). Eighty-one spots (half of the total identified proteins) were selected based on the magnitude of response (more than 2-fold) and the statistical significance (P < 0.05). The selected proteins were then analysed by clustering and gene ontology enrichment analysis to identify enriched biological process compared to the genome frequency (, S9F). The only up-regulated term was “Cell adhesion”, whereas the down-regulated terms included “Complement activation”, “Innate immune response” and “Immune system process”.
Figure 5. Quantitative and qualitative differences in MP-sEVs between NT mice and MD mice. (a) Scheme for the isolation of highly purified MP-sEVs from NT or MD mice. (b) Typical density profile of each fraction from top to bottom after density gradient centrifugation. (c) Quantification of sEV amounts isolated from NT and MD mice, as estimated by protein quantification. Results are expressed as the mean ± SD (n = 3). *p < 0.05 versus NT mice. (d–f) Proteomic analysis of MP-sEVs from NT and MD mice (n = 3). (d) Venn diagram of proteins detected in the two samples. (e) Identified proteins were ranked in a volcano plot according to their statistical P-value (y-axis) and their relative abundance ratios (log2 fold-change, x-axis) between MP-sEVs from NT and MD mice. Red dots indicate the proteins with both P value < 0.05 and log2 fold-change < −1 or > 1). (f) Gene ontology enrichment analysis for up-regulated (closed bar) and down-regulated proteins (open bar) after macrophage depletion. FDR values < 0.05 are listed. The related genes are listed to the right.
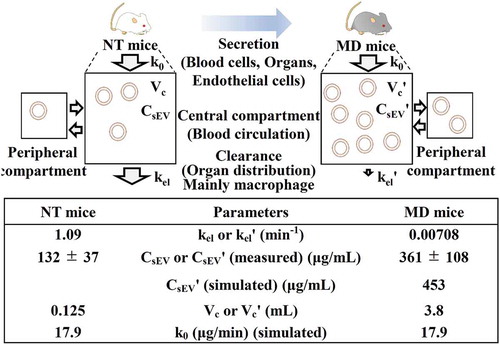
Pharmacokinetics of intravenous infusion in a two-compartment model
and 10S show the results of PK analysis based on intravenous infusion using a two-compartment model. The k0 value [MP-sEV secretion rate constant (µg/mL)] was calculated by substituting the experimental values [kel, MP-sEV clearance rate constant (min−1) in NT mice, CsEV, MP-sEV concentration in blood (μg/mL) in NT mice, and Vc, volume of distribution (mL) in NT mice] for EquationEquation (13)(13)
(13) described in materials and methods. The k0 value was 17.9 μg/min, which indicates that approximately 18 μg of MP-sEVs is secreted from various origins into the plasma per minute. Next, assuming that clodronate liposome treatment had little effect on sEV-producing cells except macrophages, k0 in addition to kelˊ [MP-sEV clearance rate constant (min−1) in MD mice] and Vcˊ [volume of distribution (mL) in MD mice] values were used to simulate the CsEVˊ value with an assumption that macrophage depletion did not change the sEV secretion rate as it was reported that most sEVs in the blood are derived from haematopoietic cells [Citation20]. The simulated value was 453 μg/mL, which was comparable to the experimental CsEVˊ value [MP-sEV concentration in blood (μg/mL) in MD mice, 361 ± 108 μg/mL].
Figure 6. PK analysis of the secretion/clearance balance of MP-sEVs based on intravenous infusion in a two-compartment model. The image above shows the schematic concept. MP-sEVs are secreted from various cells or organs. Under the assumption of this model, the MP-sEVs are secreted into plasma based on zero-order kinetics. MP-sEV clearance from circulation is assumed to follow first-order kinetics. kel or kelˊ: MP-sEV clearance rate constant (min−1). CsEV or CsEVˊ: MP-sEV concentration in blood (μg/mL). Vc or Vcˊ: volume of distribution (mL). k0: MP-sEV secretion rate constant (μg/min). The k0 value was assumed to be constant before and after macrophage depletion treatment. The table below summarizes the PK parameters based on experimental data from and .
Discussion
Unlike the supernatants of cultured cell lines, blood is a complex mixture of sEVs from various cells, as well as lipoprotein particles, and thus the isolation and labelling of blood sEVs is difficult [Citation6,Citation7,Citation21]. Therefore, estimating the blood clearance of MP-sEVs is very difficult. Our proposed method achieves isolation of morphologically intact MP-sEV and highly sensitive, stable, and specific MP-sEV labelling that enabled PK analysis (–, S1–S6). In this paper, we quantified sEV amount based on protein amount because measuring protein amount requires rapid and rigid sample processing [Citation22]. On the other hand, attention should be paid to a point that blood EV concentration estimation is dependent on the method of EV isolation and quantification method, i.e. protein quantification or particle number quantification as summarized by Johnsen et al. [Citation23].
In addition to gLuc-LA, both gLuc-PFG and gLuc-Lys were used to label MP-sEVs; however, these two probes were less sensitive than gLuc-LA and failed to result in stable labelling in the presence of serum (). As cholesterol and sphingomyelin are enriched in lipoprotein particles and that lipoproteins are 100-fold more abundant than sEVs in plasma [Citation6,Citation7,Citation21,Citation23], it is assumed that gLuc-PFG- and gLuc-Lys-labelled MP-sEVs were transferred to lipoprotein particles at the point of isolation. These results stress the importance of checking labelling stability before PK studies.
PK analysis clearly demonstrated that macrophages play an important role in the clearance of MP-sEVs from blood circulation (, S7). Because MP-sEVs are negatively charged () and the negative charge of PS in the sEV membrane could be involved in the recognition and clearance of intravenously administered cultured cell-derived sEVs by macrophages [Citation11,Citation13], MP-sEVs might also be recognized and taken up by macrophages through a PS-dependent mechanism. It is also considered that the PK properties might be different among subpopulations of MP-sEVs, as demonstrated previously for cultured cell-derived sEVs [Citation24]. This was partly denied by the results indicating that HD-sEVs and LD-sEVs, as well as total sEVs, are rapidly cleared from circulation (Figure. S7). Besides, more than 90% of MP-sEV-related protein was detected in Tim4-captured fraction, suggesting that majority of MP-sEV was PS-positive (Figure. S8D), which is in agreement with previous studies that showed most of sEVs in blood were positive for PS [Citation25,Citation26]. As gLuc-LA binds to PS-positive MP-sEV that consists majority of whole MP-sEV, we considered that the presented PK data are relevant for the whole MP-sEV population. On the other hand, attention should be paid to the point that MP-sEV population is dependent on the method of MP-EV isolation [Citation1,Citation23]. As a future study, fractionation of MP-sEVs based on other criteria such as surface markers followed by a PK study would be necessary [Citation27].
Most sEVs in the blood are derived from haematopoietic cells (CD45-positive vesicles) [Citation20]. Other sources would be vascular endothelial cells (CD31-positive) or organs with a discontinuous endothelium such as the liver, pancreas and bone marrow [Citation2,Citation3]. Measuring the secretion rate of each cell is technologically impossible at present. However, our simulation-based approach is unique in that the secretion rate can be calculated without information regarding the origins of MP-sEVs. Simulation results demonstrated that sEVs are secreted from these cells or organs into the blood at a rate of 18 μg/min (). This value appears to be larger compared to results from quantitative in vitro secretion analysis recently reported in several articles using a microfluidic device or single cell assay system [Citation9,Citation28]. Further, the secretion rate of MP-sEVs is approximately three-fold higher than that of cell culture-derived sEVs based on a calculation using reported values [Citation29–Citation31]; specifically, these values were reported as follows: sEV secretion rate from single cell = 100 sEV particles per hour, number of blood cells = 1 × 10⁷ cells per 1 μL of blood, number of sEV particles per sEV protein = 5 × 10⁹ sEV particles per 1 μg of sEV protein. As numerous cell types are involved in sEV secretion and have different secretion rates into the blood in vivo, this difference in the secretion rate might imply the limitation of in vitro secretion analysis for estimating the sEV secretion rate into blood. Our robust approach can overcome this limitation.
To simplify the simulation, we initially assumed that sEVs are secreted into the blood at the same qualitative level regardless of physiological conditions. Proteomic analysis revealed that 50% of the identified proteins were expressed at the same level, based on P-values and relative abundance ratios, suggesting that, in terms of protein, the quality of MP-sEVs is retained to some extent after macrophage depletion (), S8, S9). This might be the reason for the difference in the MP-sEV concentration in MD mice between calculated (453 μg/mL) and experimental values (361 ± 108 μg/mL). Further, the differentially expressed proteins might reflect population changes in sEVs, resulting in differences in some biological processes (). Interestingly, integrin proteins and complement-related proteins were found to be up-regulated and down-regulated in MP-sEVs from MD mice, respectively. Integrin proteins as well as PS are reported as key molecules for recognition by macrophages in the liver as a PS-independent manner [Citation4,Citation32]. Thus, macrophage depletion might prolong the blood retention time of the integrin-enriched MP-sEV subpopulation. Moreover, macrophages are partly responsible for complement secretion into the blood [Citation33]. Accordingly, the downregulation of complement activation due to macrophage depletion might protect sEVs from complement-mediated vesicle lysis [Citation34], which could also be related to the decreased clearance rate of MP-sEVs in MD mice. Thus, future challenges comprise validating the effects of such protein differences.
As our “balance hypothesis” was validated to some extent (, S10), it would be valuable to consider treatment strategies targeting sEVs. For example, in cancer patients, tumour-derived sEVs from various tumour types are known to enter the circulation, reach distant locations, and educate the pre-metastatic niche, which is associated with organotropic metastasis [Citation2,Citation32]. In addition, tumour-derived sEVs in blood circulation induce immune suppression through interaction with immune cells such as T cells in the blood or delivery of anticancer agents enhancing tumour associated immunoresponse [Citation35,Citation36]. Therefore, the removal of tumour-derived sEVs from circulation is expected to be a novel anti-cancer therapy. As such, adaptive dialysis-like affinity platform technology or the administration of antibody against sEVs to decrease tumour-derived sEVs concentrations in the blood have been proposed [Citation37,Citation38]. Based on simulation using parameters obtained in the current study, it was calculated that MP-sEV concentrations return to greater than 90% of steady state levels, from 0, within 30 min after the termination of treatment, suggesting that tumour-derived sEV concentrations in the blood might rapidly recover after such treatments. Thus, for successful treatment, intervention that enables the continuous removal of tumour-derived sEVs from the blood is required to maintain low concentrations. Therefore, removing these types of sEVs from circulation might be challenging as a therapeutic application. Rather, it would be much more reasonable to inhibit sEV secretion from the tumour. Several potent sEV secretion inhibitors have been discovered through cell-based drug screening [Citation39]. However, there are no available animal models to test the efficacy of such drugs in vivo. Our proposed simulation approach to estimate sEV secretion rates in vivo is highly reproducible and could be a valuable tool to validate the in vivo efficacy of candidate sEV secretion inhibitors.
In conclusion, we validated the “balance hypothesis” for the first time using a mouse model. To achieve this, we developed a novel protocol for MP-sEV preparation that is suitable for PK analysis and proposed a simple simulation method for sEV secretion analysis. These findings will help to integrate in vivo and in vitro knowledge to understand the biological role of sEVs.
Author contributions
Akihiro Matsumoto and Yuki Takahashi conceived the idea. Akihiro Matsumoto, Yuki Takahashi, Yasushi Ishihama and Yoshinobu Takakura wrote the manuscript. Hsin-Yi Chang, and Yi-Wen Wu performed the proteome experiments. Akihiro Matsumoto and Aki Yamamoto performed the biological experiments. Yuki Takahashi and Yoshinobu Takakura obtained funding for research.
Competing interests
All authors declare that they have no competing interests.
Supplemental Material
Download Zip (5.2 MB)Supplementary material
Supplemental data for this article can be accessed here.
Additional information
Funding
Related Research Data
References
- Thery C, Witwer KW, Aikawa E, et al. Minimal information for studies of extracellular vesicles 2018 (MISEV2018): a position statement of the international society for extracellular vesicles and update of the MISEV2014 guidelines. J Extracell Vesicles. 2018;7:1535750.
- Bakhshandeh B, Kamaleddin MA, Aalishah K. A comprehensive review on exosomes and microvesicles as epigenetic factors. Curr Stem Cell Res Ther. 2017;12:31–16.
- Wu M, Ouyang Y, Wang Z, et al. Isolation of exosomes from whole blood by integrating acoustics and microfluidics. Proc Natl Acad Sci USA. 2017;114:10584–10589.
- Morishita M, Takahashi Y, Nishikawa M, et al. Pharmacokinetics of exosomes-an important factor for elucidating the biological roles of exosomes and for the development of exosome-based therapeutics. J Pharm Sci. 2017;106:2265–2269.
- Blanco E, Shen H, Ferrari M. Principles of nanoparticle design for overcoming biological barriers to drug delivery. Nat Biotechnol. 2015;33:941–951.
- Karimi N, Cvjetkovic A, Jang SC, et al. Detailed analysis of the plasma extracellular vesicle proteome after separation from lipoproteins. Cell Mol Life Sci. 2018;75:2873–2886.
- Simonsen JB. Pitfalls associated with lipophilic fluorophore staining of extracellular vesicles for uptake studies. J Extracell Vesicles. 2019;8:1582237.
- Gudbergsson JM, Johnsen KB, Skov MN, et al. Systematic review of factors influencing extracellular vesicle yield from cell cultures. Cytotechnology. 2016;68:579–592.
- Verweij FJ, Bebelman MP, Jimenez CR, et al. Quantifying exosome secretion from single cells reveals a modulatory role for GPCR signaling. J Cell Biol. 2018;217:1129–1142.
- Takahashi Y, Nishikawa M, Shinotsuka H, et al. Visualization and in vivo tracking of the exosomes of murine melanoma B16-BL6 cells in mice after intravenous injection. J Biotechnol. 2013;165:77–84.
- Imai T, Takahashi Y, Nishikawa M, et al. Macrophage-dependent clearance of systemically administered B16BL6-derived exosomes from the blood circulation in mice. J Extracell Vesicles. 2015;4:26238.
- Hong CS, Funk S, Muller L, et al. Isolation of biologically active and morphologically intact exosomes from plasma of patients with cancer. J Extracell Vesicles. 2016;5:29289.
- Matsumoto A, Takahashi Y, Nishikawa M, et al. Role of phosphatidylserine-derived negative surface charges in the recognition and uptake of intravenously injected B16BL6-derived exosomes by macrophages. J Pharm Sci. 2017;106:168–175.
- Lauer ME, Graff-Meyer A, Rufer AC, et al. Cholesteryl ester transfer between lipoproteins does not require a ternary tunnel complex with CETP. J Struct Biol. 2016;194(2):191–198.
- Sodar BW, Kittel Á, Pálóczi K, et al. Low-density lipoprotein mimics blood plasma-derived exosomes and microvesicles during isolation and detection. Sci Rep. 2016;6:24316.
- Charoenviriyakul C, Takahashi Y, Morishita M, et al. Role of extracellular vesicle surface proteins in the pharmacokinetics of extracellular vesicles. Mol Pharm. 2018;15:1073–1080.
- Wagner JG. Linear PK equations allowing direct calculation of many needed PK parameters from the coefficients and exponents of polyexponential equations which have been fitted to the data. J Pharmacokinet Biopharm. 1976;4(5):443–467.
- Yamaoka K, Tanigawara Y, Nakagawa T, et al. A pharmacokinetic analysis program (multi) for microcomputer. J Pharmacobiodyn. 1981;4(11):879–885.
- Rappsilber J, Mann M, Ishihama Y. Protocol for micro-purification, enrichment, pre-fractionation and storage of peptides for proteomics using StageTips. Nat Protoc. 2007;2:1896–1906.
- Trubey CM, Chertova E, Coren LV, et al. Quantitation of HLA class II protein incorporated into human immunodeficiency type 1 virions purified by anti-CD45 immunoaffinity depletion of microvesicles. J Virol. 2003;77:12699–12709.
- Simonsen JB. What are we looking at? Extracellular vesicles, lipoproteins, or both? Circ Res. 2017;121:920–922.
- Hartjes TA, Mytnyk S, Jenster GW, et al. Extracellular vesicle quantification and characterization: common methods and emerging approaches. Bioengineering (Basel). 2019;6. DOI:10.3390/bioengineering6010007.
- Johnsen KB, Gudbergsson JM, Andresen TL, et al. What is the blood concentration of extracellular vesicles? Implications for the use of extracellular vesicles as blood-borne biomarkers of cancer. Biochim Biophys Acta Rev Cancer. 2019;1871:109–116.
- Zhang H, Freitas D, Kim HS, et al. Identification of distinct nanoparticles and subsets of extracellular vesicles by asymmetric flow field-flow fractionation. Nat Cell Biol. 2018;20:332–343.
- Wei H, Malcor JM, Harper MT. Lipid rafts are essential for release of phosphatidylserine-exposing extracellular vesicles from platelets. Sci Rep. 2018;8:9987-018-28363-4.
- Rak J. Extracellular vesicles - biomarkers and effectors of the cellular interactome in cancer. Front Pharmacol. 2013;4:21.
- Sharma P, Ludwig S, Muller L, et al. Immunoaffinity-based isolation of melanoma cell-derived exosomes from plasma of patients with melanoma. J Extracell Vesicles. 2018;7:1435138.
- Son KJ, Rahimian A, Shin D-S, et al. Microfluidic compartments with sensing microbeads for dynamic monitoring of cytokine and exosome release from single cells. Analyst. 2016;141:679–688.
- Chiu YJ, Cai W, Shih YR, et al. A single-cell assay for time lapse studies of exosome secretion and cell behaviors. Small. 2016;12:3658–3666.
- Nemzek JA, Bolgos GL, Williams BA, et al. Differences in normal values for murine white blood cell counts and other hematological parameters based on sampling site. Inflamm Res. 2001;50:523–527.
- Webber J, Clayton A. How pure are your vesicles? J Extracell Vesicles. 2013;2:19861.
- Hoshino A, Costa-Silva B, Shen T-L, et al. Tumour exosome integrins determine organotropic metastasis. Nature. 2015;527:329–335.
- Ezekowitz RA, Sim RB, Hill M, et al. Local opsonization by secreted macrophage complement components. Role of receptors for complement in uptake of zymosan. J Exp Med. 1984;159:244–260.
- Clayton A, Harris CL, Court J, et al. Antigen-presenting cell exosomes are protected from complement-mediated lysis by expression of CD55 and CD59. Eur J Immunol. 2003;33:522–531.
- Hong CS, Sharma P, Yerneni SS, et al. Circulating exosomes carrying an immunosuppressive cargo interfere with cellular immunotherapy in acute myeloid leukemia. Sci Rep. 2017;7:14684-017-14661-w.
- Lv LH, Wan Y-L, Lin Y, et al. Anticancer drugs cause release of exosomes with heat shock proteins from human hepatocellular carcinoma cells that elicit effective natural killer cell antitumor responses in vitro. J Biol Chem. 2012;287:15874–15885.
- Marleau AM, Chen CS, Joyce JA, et al. Exosome removal as a therapeutic adjuvant in cancer. J Transl Med. 2012;10:134-5876-10-134.
- Nishida-Aoki N, Tominaga N, Takeshita F, et al. Disruption of circulating extracellular vesicles as a novel therapeutic strategy against cancer metastasis. Mol Ther. 2017;25:181–191.
- Datta A, Kim H, McGee L, et al. High-throughput screening identified selective inhibitors of exosome biogenesis and secretion: a drug repurposing strategy for advanced cancer. Sci Rep. 2018;8:8161-018-26411-7.