
ABSTRACT
Mast cells (MCs) are known to participate in a variety of patho-physiological processes depending largely on the intragranular mediators and the production of cytokines and chemokines during degranulation. Recently, extracellular vesicles (EVs) have been implicated important functions for MCs, but the components of MC-derived EVs have not yet been well-characterized. In this study, we aimed to identify signatures of proteins, long non-coding RNAs (lncRNAs), and microRNAs (miRNAs) in EVs derived from resting (Rest-EV) and degranulated (Sti-EV) MCs by differential ultracentrifugation. Using tandem mass tag (TMT)-based quantitative proteomics technology and RNA sequencing, we identified a total of 1988 proteins, 397 lncRNAs, and 272 miRNAs in Rest-EV and Sti-EV. The proteins include common EVs markers (cytoskeletal proteins), MCs markers (FcεRI and tryptase), and some preformed MCs mediators (lysosomal enzymes) as well. The global expression profiles of lncRNAs and miRNAs identified, for the first time, from Rest-EV and Sti-EV, strongly suggest a potential regulatory function of MC-derived EVs. We have also performed Western blotting and qRT-PCR analysis to further verify some of the proteins, lncRNAs, and miRNAs identified from Rest-EV and Sti-EV. Our findings will help to elucidate the functions of MC-derived EVs, and provide a reference dataset for future translational studies involving MC-derived EVs.
KEYWORDS:
Introduction
Mast cells (MCs) are long-lived, tissue-resident, innate immune cells that localize at areas where the host interfaces with the external environment [Citation1]. They are key effectors of allergic reactions and participate in a wide variety of patho-physiological processes, including tissue damage repair, thrombosis and haemostasis, autoimmune injury, heart function and tumour progression. These functions of MCs are closely related to release of preformed mediators (i.e. histamine, prostaglandin D2 and platelet activating factor), and the production of cytokines and chemokines during degranulation. Recently, extracellular vesicles (EVs) have also been identified as important for the functions of MCs.
EVs have a lipid, membrane-bound nanoscale structure and carry a variety of biomacromolecules such as proteins, lipids, and nucleic acids [Citation2]. They are also known as exosomes, microvesicles (MVs), apoptotic bodies or nano-sized membrane vesicles. Almost all cell types release EVs, which are also present in plasma and other bodily fluids, including urine, saliva, semen and breast milk [Citation3]. They represent a potential means of distant cellular communication and are associated with an array of bioactive cargo derived from their parental cells.
MC-derived EVs have been shown to play important roles in diverse physiological and pathophysiological conditions. MC-derived EVs have been shown to exert immuno-stimulatory effects on B cells, T cells and dendritic cells [Citation4–Citation6]. In addition, MC-derived EVs containing the KIT protein promote the proliferation of recipient tumour cells [Citation7]. Recently, EVs proteins have been identified as novel diagnostic and prognostic indicators of cancers. For instance, Glypican-1 was found to be enriched in cancer cell-derived EVs and could serve as a biomarker for the diagnosis of early pancreatic cancer [Citation8]. However, whether or not MC-derived EVs proteomes could be used for disease diagnosis, in particular that of allergic diseases, remains to be elucidated.
MC-derived EVs can also transfer functional mRNAs and miRNAs to other MCs. This suggests that the EVs shuttle of RNA (esRNA) between cells, which may act as a unique means of cell-to-cell communication [Citation9]. In addition to mRNAs and miRNAs, long non-coding RNAs (lncRNAs) are also selectively sorted into EVs and have been found to regulate the onset and progression of cancer [Citation10]. LncRNAs are defined as transcripts longer than 200 nucleotides without evident coding potential. EVs lncRNAs derived from liquid biopsies could be exploited as non-invasive biomarkers for early detection of diseases [Citation11]. As such, RNA-sequencing (RNA-Seq) could be used to profile lncRNAs in MC-derived EVs and their expression signatures may be used to aid in disease diagnosis.
Recently, we showed that MC-derived EVs can bind to free IgE via the high-affinity IgE receptor (FcεRI), thereby modulating airway remodelling during airway inflammation and hyperresponsiveness, or even chronic asthma [Citation12]. MC-derived EVs also hold the potential to be developed as novel anti-IgE agents. Although EV-based therapeutics have clinical potential, establishing the profiles of EVs proteomes and transcriptomes for translational applications in the clinical settings remains a major challenge [Citation2]. Since allergic diseases are widely prevalent worldwide, there is an urgent need to develop reliable profiles for biomacromolecule that are carried by EVs derived from resting and degranulated MCs.
In this study, we compared the differences between the full spectrum of protein, lncRNA and miRNA expression signatures in resting and degranulated MC-derived EVs using liquid chromatography-tandem mass spectrometry (LC-MS/MS) quantitation and RNA-Seq techniques. We anticipate that our findings will have a far-reaching impact on the functions of MCs, including MC-derived EV-related clinical translational studies.
Materials and methods
Mice
Wild-type (WT) BALB/c mice (male, 4 weeks old) were purchased from Shanghai Sippr/BK Laboratory Animal Co. Ltd and housed in a specific pathogen-free environment. All animal experiments were carried out under the approval of the Animal Ethics Committee of Shanghai Jiaotong University School of Medicine and carefully conducted in accordance with local humane animal care standards.
Bone marrow-derived MCs culture
Bone marrow-derived MCs (BMMCs) were prepared and cultured as previously described [Citation12]. In brief, mice were sacrificed via neck dislocation. Bone marrow cells from the femurs and tibias of BALB/c mice were cultured for 6 weeks in RPMI-1640 medium supplemented with 10% heat-inactivated FBS (Gibco, CA, USA), 2 mM L-glutamine, 1 mM sodium pyruvate, 0.1 mM non-essential amino acids, 1% penicillin-streptomycin, IL-3 (10 ng/mL) and stem cell factors (20 ng/mL; PeproTech, Rocky Hill, NJ). The expression levels of c-Kit and FcεRI were detected by flow cytometry, which also provided additional information on the purity and maturity of the BMMCs.
Assays for MCs degranulation
The release of β-hexosaminidase (β-HEX) from stimulated BMMCs was used to evaluate MCs degranulation. In brief, BMMCs were sensitized overnight at 37°C with 1 μg/mL anti-DNP-IgE (Sigma-Aldrich) in complete RPMI 1640 medium. After 12 h, the cells were washed twice with Tyrode’s buffer and stimulated with DNP-HSA for different times (10, 20, 30, 60, and 90 min, respectively). The supernatants were collected. The cell pellets were lysed with an equal volume of 0.5% Triton-X 100 at 37°C for 30 min. Then, 50 µL of supernatants and cell lysis buffer were transferred into a 96-well plate containing 50 μL of 4-niroPheny 1-N-acety-β-D-glucosaminide in citrate buffer and incubated at 37°C for 1 h. The reaction was stopped by adding 150 μL 0.2 M glycine solution (pH = 10.4) into each well. The absorbance at 405 nm was measured using a microplate reader. The β-hexosaminidase release rate was calculated using the following formula: β-hexosaminidase release (%) = [S/(S + P)] × 100, where S and P denote the OD values of the supernatant and the cell lysis buffer, respectively. The experiment was repeated three times. Furthermore, after staining with toluidine blue, the morphology of the cells was observed using optical microscopy. Briefly, BMMCs were fixed with the immunostaining solution at 37°C for 1 h. The cells were washed with PBS and the cell suspension was dropped onto a slide and dried at 37°C. Then, the cells were stained with 1% pH 1.0 toluidine blue for 2 min and exposed to xylene for 2 min. Finally, the slide was sealed with neutral gum.
Isolation of EVs by differential centrifugation
EVs were isolated from the supernatants of resting and degranulated BMMCs by differential centrifugation, as previously described, with minor modifications [Citation7]. Briefly, exosome-depleted FBS was processed by ultracentrifugation at 120,000 × g for 18 h using a SW32 Ti rotor (Beckman Coulter, USA), followed by filtering of the supernatants through a 0.22 μm filter (Millipore, Germany). The BMMCs were adjusted to a concentration of 1 × 10⁶ cells/mL and cultured in 100 mL of RPMI-1640 medium supplemented with 10% exosome-depleted FBS. One half of the cells were cultured at 37°C in a humidified incubator containing 5% CO2 in RPMI-1640 medium supplemented with 10% exosomes-depleted FBS for 48 h. The other half of the cells were sensitized overnight at 37°C with 1 μg/mL anti-DNP-IgE. Resting MC-derived EVs (Rest-EV) were collected from culture supernatants using differential centrifugation, as described below. The cells and cellular debris from the supernatants were removed through sequential centrifugation steps at 300 × g for 10 min and 2,000 × g for 10 min. Then, the supernatants were spun at 10,000 × g for 30 min (Allegra X-30R, Beckman Coulter, USA), followed by filtration through 0.22 μm filter to eliminate the larger microvesicles. The final supernatants were ultracentrifuged at 100,000 × g for 90 min in a swinging bucket centrifuge (Optima XE-90, SW32 Ti rotor, κ-factor 256.8, Beckman Coulter, USA) to pellet EVs. The EVs were washed in a large volume of PBS to remove contaminated proteins and centrifuged at 100,000 × g for 90 min (Optima XE-90, SW32 Ti rotor, κ-factor 256.8, Beckman Coulter, USA). The EVs pellets were resuspended in 100 μL PBS and immediately stored at −80°C. All centrifugations were performed at 4°C. To analyse the EVs derived from degranulated MCs, the indicated concentration of DNP-HSA was used to stimulate the sensitized BMMCs for 90 min, and the supernatants were subsequently collected. The EVs were extracted from the supernatants according to the centrifugation steps described above, i.e. stimulated-EVs (Sti-EV).
Isolation of EVs by OptiPrepTM density gradient
A discontinuous iodixanol gradient (40% (w/v), 20% (w/v), 10% (w/v) and 5% (w/v) solutions of iodixanol) was prepared by diluting a 60% OptiPrepTM stock (Axis-Shield PoC, Norway) with appropriate amounts of PBS. The gradient was formed by layering 2 mL of 40%, 2 mL of 20%, 2 mL of 10% and 2 mL of 5% solutions on top of each other in a 14 × 95 mm polyallomer tube (Beckman Coulter). Concentrated conditioned medium (CCM) was harvested by successive centrifugations (10 min 750 × g, 10 min, 25°C; 2,000 × g, 20 min, 4°C; 10,000 × g, 30 min, 4°C; filtered through a 0.22 μm membrane; 10,0000 × g, 90 min, 4°C). 1 mL CCM sample was overlaid onto the top of the gradient which was then centrifuged for 18 h at 100,000 g and 4°C (SW 40 Ti rotor, Beckman Coulter). Resulting fractions were determined by visual inspection and removed sequentially from the top using a pipette. Each fraction was diluted to 50 mL in PBS to remove OptiPrepTM, and the resulting pellets were resuspended in 100 μL PBS and stored at −80°C. The fraction at the layer between 40% and 20% density from the OptiPrepTM density gradient was used for the experiments.
Transmission electron microscopy assay
The morphology of EVs was identified using transmission electron microscopy (TEM, FEI Tecnai 12, Philips, Netherlands). The Rest-EV and Sti-EV samples were prepared as described above and derived from the same number of parental cells. The specific steps carried out were as follows: 20 μL of freshly isolated Rest-EV and Sti-EV were adsorbed onto 200 mesh copper grids for 1 min and stained with 2% uranyl acetate solution for 1 min, followed by drying of the sample under a half-watt lamp. Images were taken with a pixel size of 0.3 nm and a direct magnification of 67,000× using a Gatan CCD camera.
ZetaView nanoparticle tracking analysis
Nanoparticle tracking analysis (NTA) was performed using the ZetaView PMX 110 (Particle Metrix, Meerbusch, Germany) and its corresponding software (ZetaView 8.03.04.01). The Rest-EV and Sti-EV samples, derived from the same number of parental cells, were prepared as described above. For each sample, 2 mL of the sample diluted in 1× PBS was loaded into the chamber. The NTA instrument was used to measure each sample at 11 different positions throughout the chamber, with one cycle of readings at each position. For each measurement, the instrument pre-acquisition parameters were set to 23°C, with a sensitivity of 85, a shutter speed of 100, 2 s per position, and a frame rate of 30 frames per second (fps). After acquisition, the parameters were set to a minimum brightness of 25, a maximum size of 200 pixels, and a minimum size of 5 pixels. After automatically analysing all 11 positions and removing any outlier positions, the mean, median and mode (represented as diameter) sizes and the concentrations of samples were calculated using the optimized machine software.
Western blotting
For Western blotting, 10 µg of protein from the cell lysates and EVs from each sample were separated by SDS-PAGE and transferred onto a PVDF membrane (Bio-Rad, Hercules, CA) at 100 V for 50–100 min. After blocking with 5% non-fat dry milk in TBS containing 0.01% Tween-20 (TBST) at room temperature for 1 h, the membrane was incubated with primary antibodies against FcεRI (Abcam, ab166812, 1:1000 dilution), tumour susceptibility gene 101 (TSG101, Abcam, ab125011, 1:1000 dilution), CD63 (Abcam, ab217345, 1:1000 dilution), CD81(Abcam, ab109201, 1:1000 dilution), cytochrome C (Abcam, ab13575, 1:1000 dilution), GAPDH (Abcam, ab9485, 1:2500 dilution), PLA2A7 (Proteintech, 15526-1-AP, 1:300 dilution), CCR1 (Abcam, ab19013, 1:500 dilution), ST2 (Abcam, ab25877, 1:500 dilution), and Tryptase (Abcam, ab2378, 1:200 dilution) overnight at 4°C. The membranes were washed three times before being incubated with HRP-conjugated secondary antibodies diluted in TBST at 37°C for 1 h. After washing with TBST three times, immunoreactive bands were detected using an ECL Kit (Millipore, USA) and then visualized using a ChemiDoc MP imager (Bio-Rad) according to the manufacturer’s instructions. The protein level of Sti-EV was compared with the Rest-EV group. The mean values of the Rest-EV group were set to 1; the values for Sti-EV were normalized to those for Rest-EV, and are presented as fold changes relative to the control values. All experiments were repeated three times independently.
Protein extraction, digestion, and TMT labelling
The Rest-EV and Sti-EV proteins were lysed using 4% SDS lysis buffer containing 1 mM dithiothreitol, a protease inhibitor, and homogenized using a small mortar and pestle set on ice. Then, the samples were centrifuged at 12,000 × g for 10 min to remove any insoluble material, and the supernatants were collected to be used for TMT labelling. The protein concentrations were determined using a tryptophan-fluorescence assay. For this, 100 μg of each sample was digested according to the filter-aided sample preparation (FASP) protocol. Briefly, each sample was transferred to a 10 kD filter (Millipore Corporation) and centrifuged at 12,000 × g for 40 min at 20°C. Then, 200 μL of urea buffer (8 M urea, 0.1 M Tris-HCl, pH 8.5) was added and followed by another centrifugation at 12,000 × g for 40 min. This process was repeated twice. The samples were alkylated by incubating with 100 μL of 50 mM iodoacetamide (IAA, Sigma-Aldrich, US) for 40 min at 37°C in the dark and centrifuged at 12,000 × g for 40 min. Next, the samples were diluted with 200 μL of urea buffer and centrifuged two more times. Then, 200 μL of 50 mM tetraethylammonium bromide (TEAB) was added and the samples were centrifuged at 12,000 × g for 40 min. This step was repeated twice. Finally, the samples were digested with trypsin (1:50, enzyme to protein in 50 mM TEAB) by incubating at 37°C for 16 h. Digestion was terminated via solid phase extraction, followed by vacuum-drying. Freeze-dried peptides were dissolved using 50 mM TEAB. Subsequently, the peptides were labelled with six-plex tandem mass tag (TMT, Thermo Scientific, USA) reagents according to the manufacturer’s protocol. To quantify six samples, one batch of TMT6-plex labelling experiments was performed. Each aliquot (50 μg of peptide equivalent) was reacted with one tube of TMT reagent. After the sample was dissolved in 100 μL of 0.1 M TEAB solution, and the TMT reagent was dissolved in 41 μL of acetonitrile, the mixture was incubated at room temperature for 1 h. The labelled samples in the same experimental branch were pooled together and lyophilized.
High pH reverse phase fractionation (hpRP)
TMT-labelled peptide mixtures were fractionated using a Waters XBridge BEH130 C18 3.5 μm 2.1 × 150 mm column on an Agilent 1260 HPLC operating at 0.2 mL/min. The peptides were separated in a binary buffer system of solution A (10 mM ammonium formate) and solution B (10 mM ammonium formate with 90% acetonitrile). A CBS-B programed multifunction automatic fraction collecting instrument (Huxi Instruments, Shanghai, China) was coupled to the HPLC and used to collect the eluted peptides. A total of 28 fractions were obtained and then concatenated to 14 (pooling equal interval RPLC fractions). The fractions were dried for nano LC-MS/MS analysis.
Nano LC-MS/MS
Peptides were separated by reverse-phase high-performance liquid chromatography (RP-HPLC) using the EASY-nLCnano-LC system (Thermo Fisher Scientific, Bremen, Germany) with a self-packed column (75 μm × 150 mm; 3 μm ReproSil-Pur C18 beads, 120 Å, Dr Maisch GmbH, Ammerbuch, Germany) at a flow rate of 300 nL/min. The RP-HPLC mobile phase A was 0.1% formic acid in water, and B was 0.1% formic acid in acetonitrile. Peptides were eluted over a 90 min period using a gradient (2–90% mobile phase B) into a nano-ESI orbitrap Elite mass spectrometer (Thermo Fisher Scientific). The mass spectrometer was operated in data-dependent mode with each full MS scan (m/z 300–1500) followed by MS/MS for the 12 most intense ions with following parameters: ≥+2 precursor ion charge, 2 Da precursor ion isolation window, 80 first mass, and 38 normalized collision energy of HCD. Dynamic Exclusion™ was set for 30 s. The full mass and the subsequent MS/MS analyses were scanned using an Orbitrap analyser with R = 60,000 and R = 15,000, respectively.
Proteomic data analysis
Three biological replicates were generated to increase the reliability and achieve an adequate predictive power for global TMT quantitative proteomics profiling. The MS data were analysed using the software MaxQuant (http://maxquant.org/, version 1.5.8.0). Carbamidomethyl (C) was set as a fixed modification, while oxidation (M) was set as a variable modification. Trypsin/P was selected as the digestive enzyme with two potential missed cleavages. MaxQuant software was used to calculate the TMT quantitation intensity for each protein. Protein abundance was calculated on the basis of the normalized spectral protein intensity. The differential expression threshold was defined as a 2-fold change and a p-value <0.05 for the down- and upregulation of expression, respectively. The differentially expressed proteins (DEPs) were annotated using the Database for Annotation, Visualization and Integrated Discovery (DAVID, https://david.ncifcrf.gov) with the whole murine genome as the background. In order to reveal the protein–protein interaction network (PPI) of DEPs, we made use of the STRING online database (http://string-db.org) [Citation13]. Integrated scores >0.7 were chosen for the PPI network construction. Constructed PPI networks were visualized using Cytoscape software [Citation14]. Interesting proteins (p < 0.05) involved in MC-derived EVs were selected for further validation by Western blotting. Functional enrichment analyses were carried out using web-based bioinformatics tools (Genemania [http://genemania.org/]) [Citation15]. The total number of proteins identified was compared with the results from the Exocarta database (http://www.exocarta.org, release date: 29 July 2015) of published exosomal proteins. To verify the reliability of the MS data, we compared the results with EVpedia (http://student4.postech.ac.kr/evpedia2_xe/xe/, release date: on 30 April 2018) and Vesiclepedia (http://www.microvesicles.org, version 3.1, release date: 20 December 2017) databases and analysed the functions of co-expressed proteins using the FunRich analysis tool [Citation16,Citation17].
RNA isolation, lncRNA library preparation, and sequencing
MC-derived EVs were treated with 0.4 μg/μL RNase (Fermentas) and 0.25% trypsin for 10 min at 37°C, respectively. Then, the total RNA of Rest-EV and Sti-EV were extracted using exoRNeasy Serum/Plasma Maxi Kit (Qiagen) following the manufacturer’s protocol. Subsequently, ribosome RNA (rRNA) was depleted from total RNA using the Ribo-Zero™ rRNA Removal kit (Epicentre, Illumina, WI, USA), and the remaining RNA was collected and purified. After strand-specific library construction and sequencing of paired-ends, 150-bp-long reads were performed by the Illumina HiSeq4000 platform at QIAGEN Translation Medicine Co., Ltd (Suzhou). RNA-seq was performed on three biological replicates of Rest-EV and Sti-EV, respectively.
LncRNA identification pipeline
A flowchart of lncRNA identification is shown in . In brief, the high-throughput sequencing reads from all three biological replicates were pre-processed. (1) Quality control of the RNA sequences was performed using FastQC software (http://www.bioinformatics.babraham.ac.uk/projects/fastqc/, version 0.10.1). Adaptors were filtered using Cutadapt (version 1.10). Reads were mapped to a reference genome (GRCm38.p5) using Tophat2 (version 2.0.13) [Citation18]. (2) Aligned reads were assembled and merged by Cufflinks [Citation19] and Cuffcompare [Citation20]. Transcripts shorter than 200 bp were filtered out. (3) We employed Coding Potential Calculator (CPC) software [Citation21] and Coding–non-coding Index (CNCI) software [Citation22] to assess the protein-coding potential of the remaining transcripts. (4) Transcripts not in any class code of “j, i, o, u, x” were filtered out. The assembled putative lncRNAs were classified into five categories, including antisense lncRNAs, intergenic lncRNAs (lincRNAs), processed transcript lncRNAs, sense intronic lncRNAs and sense overlapping lncRNAs. RPKM stands for “reads per kilobase of exon model per million mapped reads” and was used to quantify the transcript expression. LncRNA transcripts were considered to be differentially expressed (DE) if they met the criteria of RPKM > 10, absolute values of log2(fold change[FC]) > 1, and a false discovery rate (FDR, an adjusted p-value after multiple testing of Benjamini-Hochberg [Citation23]) less than 0.01.
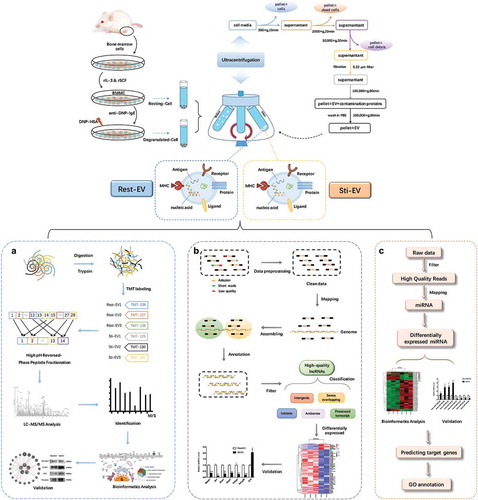
Figure 1. Schematic representation of BMMC-derived EVs isolation, and characterization. The TMT-labelling strategy elucidates the enrichment of proteins encapsulated in MC-derived EVs and RNA-seq to identify the expression profiles of lncRNAs and miRNAs. Murine bone marrow cells were induced to differentiate into MCs by rIL-3 and SCF in vitro. EVs released by resting and degranulated BMMCs (Rest-EV and Sti-EV) were isolated by successive differential centrifugation. (a) Flowchart of the TMT-labelling quantitative proteomic analysis of Rest-EV and Sti-EV. Proteins were extracted and digested by filter-aided sample preparation (FASP). The peptides were labelled with six-plex tandem mass tags (TMT) and analysed using EASY-nano-LC−MS/MS in MaxQuant software. The differentially expressed proteins (DEPs) were further analysed by bioinformatics tools and followed by biological validation using Western blotting. (b) Overview of the comprehensive scheme for the systematic identification of lncRNAs in Rest-EV and Sti-EV. The quality control of the RNA sequences was performed by the FastQC software. High-quality lncRNAs were obtained by a series of steps, such as mapping, assembling, annotation, and filtering. The assembled putative lncRNAs were classified into five categories, including antisense lncRNAs, intergenic lncRNAs (lincRNAs), processed transcript lncRNAs, sense intronic lncRNAs, and sense overlapping lncRNAs. The differentially expressed (DE) lncRNAs were further analysed by bioinformatics tools and followed by biological validation using qRT-PCR. (c) Flowchart of small RNA-seq data analysis. Preprocessing of the reads was accomplished through mapper.pl script of miRDeep2 software. Bowtie software was used to trim and align generated sequence reads; and mapping of the reads to miRBase was included. The DE miRNAs were investigated by the Bioconductor R packages and followed by biological validation using qRT-PCR. The miRTarBase database was used to analyse miRNA target interactions. Analysis of gene ontology annotation was performed by applying the DAVID functional annotation tool.
Small RNA sequencing and data analysis
Briefly, MC-derived EVs were treated with 0.4 μg/μL RNase (Fermentas) and 0.25% trypsin for 10 min at 37°C, respectively. Then, the total RNA was extracted from Rest-EV and Sti-EV using an exoRNeasy Serum/Plasma Maxi Kit (Qiagen) following the manufacturer’s protocol. Next, small RNA libraries were constructed using an Illumina TruseqTm Small RNA Preparation kit following the manufacturer’s recommendations. The cDNA library quality was evaluated using a Bioanalyzer 2100 system (Agilent Technologies, Santa Clara, USA). Then, the qualified libraries were sequenced on an Illumina HiSeqTM 2500 platform (Illumina, Inc., CA, USA).
The reads were preprocessed using a mapper.pl script of miRDeep2 software [Citation24]. Bowtie software was used to trim and align the generated sequence reads; and the reads mapped to miRBase were included. The DE miRNAs were investigated using Bioconductor R packages (Seattle, Washington, RUVSeq, version 1.0.0, http://www.bioconductor.org/packages/release/bioc/html/RUVSeq.html) if they met the criteria of log2(FC) >1 or <−1 and a false discovery rate (FDR) <0.001 [Citation25]. The miRTarBase database (Release 7.0, http://mirtarbase.mbc.nctu.edu.tw/php/index.php/) was used to analyse miRNA target interactions. Analysis of Gene Ontology (GO) annotation was performed using the DAVID functional annotation tool.
Validation of RNA-seq data
To validate the RNA-seq data, the expression profiles of randomly selected lncRNAs and miRNAs were analysed by quantitative real-time polymerase chain reactions (qRT-PCR). The sequences of the specific PCR primer (lncRNAs) sets used for qRT-PCR are listed in Supplementary Table 1. The lncRNA expression levels were normalized to the expression of the internal control gene, glyceraldehyde 3-phosphate dehydrogenase (GAPDH), using the 2–ΔΔCt method, as previously described [Citation26]. DE miRNAs were further assessed by miDETECT A TrackTM miRNA qRT-PCR according to the manufacturer’s protocol (RIBOBIO, Guangzhou, China). miRNA expression was quantified by normalizing them to the expression of cel-miR-39-3p (Qiagen). Samples were run in triplicate and at least three independent experiments were performed.
Statistical analysis
Statistical analyses were performed using SPSS 20.0 software (Chicago, IL). Data were analysed by Student’s t-test and are presented as the mean ± SEM. p < 0.05 was considered statistically significant.
Results
Identification and characterization of EVs
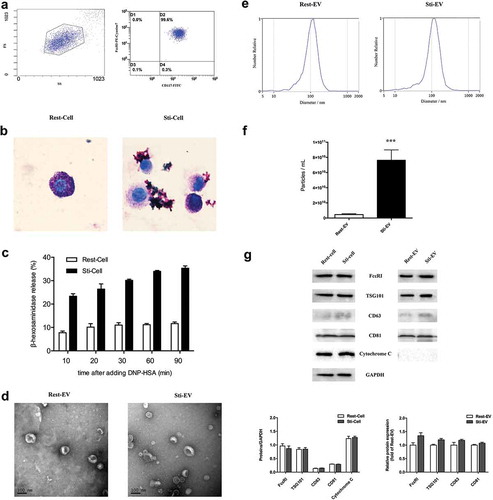
Bone marrow cells were induced to differentiate into MCs with rSCF and rIL-3 in vitro (). Flow cytometry analysis confirmed that the cells expressed both CD117 and FcεRI, which were characteristic of MCs ()). The resting cells were round or oval with intact plasma membrane and filled with purple granules in the cytoplasm by toluidine blue staining. For IgE-mediated MCs degranulation, a mass of mauve granules in the cytoplasm was released into the extracellular environment, suggesting the maturation of these cells ()). In addition, we induced MCs degranulation by incubating IgE-primed MCs with DNP-HSA for various periods ()). The highest release rate of β-hexosaminidase was observed at 90 min upon DNP-HSA stimulation as reported [Citation27]. Subsequently, the EV samples, with a size of approximately 30–150 nm cup-shaped structures, were visible under electron microscopy ()). We then measured the size distribution and quantity of EVs in each sample using NTA ()). Degranulated MCs released more EVs compared with the same number of resting MCs ()). As expected, the common EVs markers (CD63, CD81 and TSG101), and MC-specific receptor FcεRI (parental cells marker) were present in Rest-EV and Sti-EV as observed by Western blotting, but not cytochrome C (a negative control marker) ()). Taken together, these results indicate that resting and degranulated MCs can release EVs and the degranulated MCs released more EVs than the same number of resting MCs.
Figure 2. Identification and characterization of EVs secreted by resting and degranulated BMMCs. (a) Murine bone marrow cells were induced to differentiate into MCs by rSCF and rIL-3 in vitro, as shown in . CD117 and IgE high affinity receptor (FcεRI) on BMMCs were detected by flow cytometry, and 99.6% of all cells were double positive. (b) Toluidine blue staining for resting and degranulated BMMCs (1000×). The resting BMMCs were round, and the cytoplasm was filled with clearly visible purple-red granules. These mauve granules were released into the extracellular environment during IgE mediated MCs degranulation. (c) The release rate of β-hexosaminidase was assessed by incubating IgE-primed MCs with DNP-HSA for different times. Next, EVs were isolated from resting and degranulated MCs through differential centrifugation. The specific steps of centrifugation are shown in . (d) Transmission electron micrographs of the isolated EVs revealed cup-shaped structures with a diameter of approximately 30–150 nm. The scale bar indicates 100 nm. (e) The average size and quantity of EVs were measured by Nanoparticle Tracking Analysis (NTA). The results show that degranulated MCs released more EVs compared to the same number of resting MCs (f). (g) Western blotting analysis of the EVs show that Rest-EV and Sti-EV expressed traditional EVs markers CD63, CD81, and TSG101 and the MCs specific receptor, FcεRI. However, cytochrome C was highly enriched in the parental cells compared with corresponding EVs samples. Note: (* p < 0.05, ** p < 0.01 and *** p < 0.001).
Global proteome of EVs secreted by resting and degranulated MCs
The box plot, correlation coefficient, and density plots were verified as an accurate means of comparing differences in protein expression between Rest-EV and Sti-EV (Supplementary Figure 1). The resulting high-quality data sets were suitable for subsequent TMT analysis.
A total of 1988 proteins were identified in MC-derived EVs (Supplementary Table 2). There was an overlap of 516 Entrez Gene IDs in the Exocarta (http://www.exocarta.org, release date: 29 July 2015), EVpedia (http://student4.postech.ac.kr/evpedia2_xe/xe/, release date: 30 April 2018), and Vesiclepedia [Citation28,Citation29] (http://www.microvesicles.org, version 4.1, release date: 15 August 2018) databases as indicated by the Venn diagram ()). In addition, MS analysis of purified EVs confirmed the presence of common EVs markers, CD9, CD63, and TSG101, as well as specific MCs markers FcεRI, Kit, and Tryptase (Supplementary Table 2). These data indicate that the EVs from our preparations contain many homologues of common EVs markers [Citation30]. It was found that energy-generating enzymes are often associated with the fundamental structures and functions of EVs (e.g. phosphoglycerate kinase 1, pyruvate kinase, enolase, GAPDH), heat shock proteins (HSP), cytoskeletal protein (tubulin, actin), tetraspanin (CD9, CD63), translational elongation factor eEF1 and vesicular traffic proteins (e.g. clathrin, Rab proteins, ARFs). Their presence in the MC-derived vesicles provides further proof that these are EVs.
Figure 3. Global profiling of proteins encapsulated in MC-derived EVs using Mass spectrometry. (a) Venn diagrams of proteins identified in MC-derived EVs by mass spectrometry. The total number of proteins identified was compared with results from the Exocarta database of published EVs proteomics. Intracellular protein locations of differential expression proteins (DEPs) were assigned by the WoLF PSORT online tool (b) and Gene Ontology annotations (c). (d) Hierarchical clustering analysis of a heat map of the 415 DEPs was performed by the package “pheatmap” in R programme, revealing that the molecular profile of each group is unique, with the biological replicates being closest together. The red colour indicates increased protein abundances in Sti-EV, and the green colour indicates increased protein abundances in Rest-EV. The 10 most significantly enriched GO biological processes (−log10(p values), p < 0.05) in proteomic data of EVs secreted from resting (e) and degranulated MCs (f) were identified in this study. (g) Protein–protein interaction (PPI) network analysis of DEPs identified via proteomic approaches based on TMT labelling was performed by Cytoscape software. Red nodes represent upregulated DEPs, and green nodes represent downregulated DEPs. (h) Western blotting analysis of indicated proteins was performed to validate the MS results. *p < 0.05. (i) Functional enrichment analysis of hub proteins from MC-derived EVs were carried out with the Genemania online tool. Red lines indicate physical interactions between proteins, and blue lines denote co-localization between proteins. The inner circle (stripes) shows pasted hub proteins, and the outer circle shows relevant proteins inferred from the literature. Coloured circles refer to the five most significant functions associated with proteins. (j) Schematic diagram representation of subcellular distribution of proteins that were enriched in several significant pathways. The size of circles refers to the expression levels of proteins identified by mass spectrometry. The colour of circles represents the pathways that were enriched.
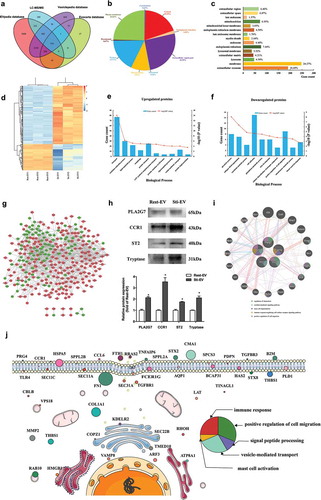
Based on the differential expression threshold given in the “Protein data analysis”, 415 DEPs were filtered from the results and the relative abundance of these DEPs are listed in Supplementary Table 3. The EVs samples were intriguingly classified into two respective clusters by hierarchical clustering analysis ()). Further analysis revealed that MC-derived EVs carried some preformed MCs mediators, including lysosomal enzymes (β-hexosaminidase, β-glucuronidase, cathepsin C), MC-specific proteases (tryptase, chymase, MCs carboxypeptidase A), non-MC-specific proteases (MMP9, granzyme, renin), cytokines (IL-4, stem cell factor) and others (peroxidase). However, some enzymes (tryptase, MCs carboxypeptidase A, IL-4) were highly expressed in Sti-EV. These results suggest a significant proportion of proteins in EVs secreted from degranulated MCs. Next, the subcellular localization of assigned DEPs, predicted using the WoLF PSORT online tool [Citation31], was found to be predominantly accumulated in the extracellular space ()). Of these proteins, 24.64% were predicted to be plasma membrane-associated proteins, while 19.19% and 17.77% were cytosol- and nucleus-associated proteins, respectively. A further 9.95% were identified as mitochondria-associated proteins. The results were consistent with those of the GO annotation ()).
To better investigate the function of DEPs, the proteome of EVs secreted by resting and degranulated MCs was analysed. In the biological process group, upregulated DEPs, highly expressed in Sti-EV, were enriched in the transport process, lipid metabolic process, signal peptide processing and vesicle-mediated transport processes (,)). This suggests that EVs may play a central role in the transportation of cellular information. The enriched results in the biological process of downregulated DEPs, highly expressed in Rest-EV, were also consistent with the known functions of EVs, with a significant enrichment in the categories of the glycolytic process, cell adhesion, glutathione metabolic process and the positive regulation of cell migration. To provide an insight into the biological pathways involved in the MC-derived EVs, KEGG pathway enrichment analysis was employed to map the DEPs (Supplementary Table 4). The DEP proteins were enriched in pathways associated with metabolic pathways, lysosome and neurodegenerative disease, such as Alzheimer’s or Parkinson’s disease, and protein processing in the endoplasmic reticulum. To obtain a better idea of the potential relationships between the proteins, protein–protein interaction network analysis was performed by Cytoscape software ()). Red nodes represent upregulated DEPs and green nodes represent downregulated DEPs. Furthermore, we chose four DEPs (Tryptase, ST2, CCR1 and PLA2G7) to validate the MS results by Western blotting. When compared with Rest-EV samples, the relative expression of these four DEPs was significantly increased in Sti-EV samples, consistent with the proteomics data ()). Similar trend of expression for DEPs was observed for MC-derived EVs by density gradient [Citation32] (Supplementary Figure 2A). Functional enrichment analysis of hub proteins from MC-derived EVs, demonstrated that the most significantly enriched pathways were the regulation of chemotaxis, cytokine-mediated signalling pathway, MCs degranulation, immune response-regulating cell surface receptor signalling pathway, and the positive regulation of cell migration ()). We further mapped the subcellular distribution of proteins that were enriched in several significant pathways, including the immune response, the positive regulation of cell migration, signal peptide processing, vesicle-mediated transport, and MCs activation. As shown in ), most of the molecules were membrane-associated proteins, the function of which can be clearly observed.
Comparison of proteomes of BMMC-derived EVs and published MC-derived EVs
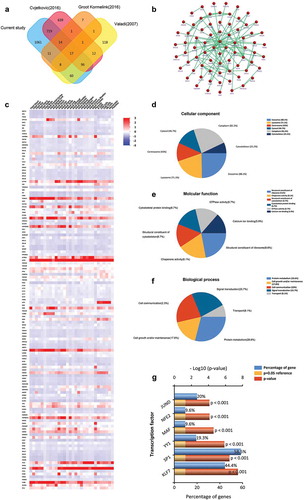
We compared the 1988 proteins identified in Rest-EV and Sti-EV with previously published MC-derived EVs data, including EVpedia (http://student4.postech.ac.kr/evpedia2_xe/xe/) and Vesiclepedia (http://www.microvesicles.org) databases. Based on our results, a total of 135 (14 + 17 + 96 + 8) proteins were co-expressed in more than two studies by the FunRich analysis tool () and Supplementary Table 5). Additionally, the PPI network of these overlapped proteins was constructed ()). ) represents the distribution of these molecules mapping to other cells. Moreover, significant associations with terms including the structural constituents of ribosome, chaperone activity, signal transduction and protein metabolism, among others, were found through functional enrichment analysis based on the 135 proteins ()). We also analysed the transcriptional factors associated with these overlapped proteins, including KLF7, SP1, YY1, MAF, NFE2 and JUND ()). This suggests that it is likely that the overlapping proteins have extensive transcriptional regulation.
Figure 4. Comparison of BMMC-derived EVs with published MCs EVs data in the proteome. (a) Venn diagram of total proteins from all identified BMMC-derived EVs proteins and the EVpedia and Vesiclepedia databases, showing common and unique proteins. (b) Enriched direct protein–protein interaction network from common proteins. (c) Distribution of these molecules mapping to other cells. Functional classification of the common exosomal proteins annotated by Gene Ontology. Pie charts represent the assigned classification of (d) cellular components, (e) molecular functions and (f) biological process. (g) The transcription factors associated with these overlapped proteins were analysed by FunRich. KLF7, SP1, YY1, MAF, NFE2 and JUND were significantly expressed among overlapped EVs proteins (p < 0.001).
Genome-wide identification and characterization of lncRNAs in MC-derived EVs
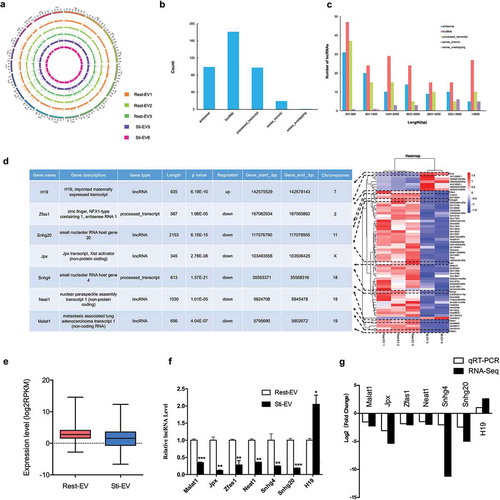
In our study, 110 G of raw data were generated from six EVs samples. Next, low-quality and short reads were filtered from the raw datasets, such that only valid reads were retained for further analysis, with an error rate of less than 0.08% in most samples (Supplementary Table 6). The results indicated a relatively high quality of sequencing data. The mean GC content of the Rest-EV samples was 51.89%, which was slightly higher than that of the Sti-EV samples (49.8%) (Supplementary Table 6; Supplementary Figure 3); this was consistent with the distribution ratio. Moreover, the mapping rate of reads was calculated to be between 53.65% and 76.35% using Tophat2 (version 2.0.13) [Citation18]. We found that the expression profile of the Sti-EV 4 sample was quite different from that of the other two samples of degranulated MC-derived EVs by a rigorous filtering pipeline (). Therefore, this sample was not used in the subsequent analysis. We identified 397 lncRNAs across the remaining 5 sample pools (Supplementary Table 7), including 99 antisense lncRNAs, 181 lincRNAs, 97 processed transcript lncRNAs, 19 sense intronic lncRNAs and 1 sense overlapping lncRNA ()). We then characterized the basic genomic features of these lncRNAs. When compared with the protein-coding genes, the MC-derived EVs lncRNAs were more evenly distributed with no obvious location preferences across chromosomes ()). The MC-derived EVs lncRNAs ranged from 201 to 84,395 bp in length with a median of 2317 bp ()). In-sense overlapping lncRNAs were of significantly shorter length (1360 bp) than lincRNAs (2147 bp), processed transcript lncRNAs (2193 bp), antisense lncRNA (2625 bp) or sense intronic lncRNAs (3018 bp). Interestingly, the lncRNAs of the Rest-EV showed a significantly higher expression level than those of the Sti-EV upon comparing the reads per kilobase of the exon model per million mapped reads (RPKM) ()). To summarize, the lncRNAs of the Rest-EV displayed a higher GC content and higher expression level compared to those of the Sti-EV.
Figure 5. Characteristics of lncRNAs encapsulated in MC-derived EVs. (a) Distribution of lncRNAs along each chromosome for each sample generated using Circos. (b) Distribution of five types of lncRNAs, including sense, antisense, intergenic, processed transcript, intronic and sense overlapping lncRNAs. (c) Length distribution of lncRNAs. (d) The heat map of differentially expressed (DE) lncRNAs between Rest-EV and Sti-EV groups, and the functional descriptions of 7 DE-lncRNAs of interest are shown (left panel). Each row represents a lncRNA, and each column represents a sample. Blue indicates downregulated and red indicates upregulated. (e) Expression levels of lncRNAs across the two groups. The expression levels are normalized to log2RPKM. (f) Expression analysis of DE-lncRNAs by qRT-PCR. The relative gene expression levels as expressed by 2–△△Ct were determined separately for each treatment as the mean ± SEM, *p < 0.05, **p < 0.01, and ***p < 0.001. (g) The validation of selected DE-lncRNAs indicated that the results from RNA sequencing in general agreed well with the qRT-PCR results.
Differential expression of lncRNAs
Based on the criteria of DE analysis, we identified 61 DE lncRNAs (8 upregulated and 53 downregulated ones) (). Hierarchical clustering showed distinguishable lncRNAs expression patterns among the samples ()). Moreover, qRT-PCR confirmed the expression of selected DE lncRNAs (Malat1, Jpx, Zfas1, Neat1, Snhg4, Snhg20 and H19) in vitro ()). The relative fold changes of these genes were consistent with the results of the RNA-seq ()). We also performed the validation experiments on MC-derived EVs by density gradient (Supplementary Figure 2B). A similar trend of expression for DE lncRNAs indicated that the RNA-seq analysis was reliable and stable. Overall, the global expression profiles of lncRNAs in MC-derived EVs were analysed for the first time by the Ribo-Zero RNA-Seq.
Table 1. Differential expressed lncRNAs identified in resting and degranulated mast cells derived extracellular vesicles.
Highly abundant miRNAs in MC-derived EVs
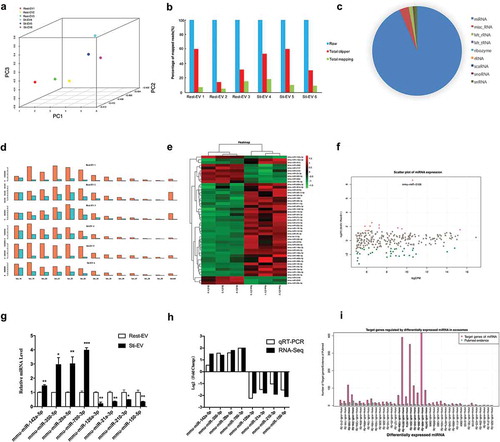
To investigate the miRNA expression pattern of Rest-EV and Sti-EV, next-generation small RNA-seq was carried out (). Bioanalyzer data revealed that EVs contain a broad range of small RNA sizes (0–349 nt) and have a very small amount of intact rRNA in EVs (Supplementary Figure 4) as reported [Citation33]. Interestingly, the average length of small RNA of Rest-EV was greater than 60 nt (0–349 nt), while the average length of small RNA of Sti-EV was less than 40 nt (0–303 nt), which suggests that the length of RNA in Sti-EV is short. Using principal component analysis, we found that the global miRNA expression patterns were strikingly different between Rest-EV and Sti-EV ()). Additionally, miRDeep2 software [Citation24] was used to count the mapped reads and preprocessing of the reads was accomplished through its mapper.pl script. The results showed a difference, in total mapping between samples ()), may come from the small RNA of EVs. These data can be standardized by RUVseq [Citation34], which revealed that 272 miRNAs were commonly expressed in MC-derived EVs (Supplementary Table 8). Furthermore, we presented the expression distribution of different types of small RNAs (i.e. misc_RNA, Mt_rRNA, ribosomal RNA (rRNA) and other non-coding RNA (ncRNA)) in MC-derived EVs ()). The size distribution of the reads was mainly concentrated at 18 to 25 nt ()), indicating that the small RNA-seq obtained the efficient expression information of miRNAs in MC-derived EVs.
Figure 6. Profiling of small RNAs in resting and degranulated MC-derived EVs (Rest-EV and Sti-EV) samples. (a) Principal components analysis of the total detected miRNAs in Rest-EV and Sti-EV. (b) A count of the mapped reads of small RNAs. (c) Pie charts of the expression distribution of different classes of sRNAs (miRNA, tRNA, snoRNA, snRNA, and rRNA) in MC-derived EVs. (d) Length distribution of detected small RNAs. Orange represents the raw reads, and light blue represents the mapped reads in the genome. (e) Heatmap generated by clustering of the differential expressed (DE) miRNAs in Rest-EV and Sti-EV. Red: up-regulation; purple: down-regulation (f) The scatter plot of miRNAs. (g) The expression levels for eight DE miRNAs were detected by qRT-PCR. *p < 0.05, **p < 0.01 and ***p < 0.001. Data are presented as mean ± SEM. (h) Comparison of different expression values detected by RNA-Seq and qRT-PCR for eight DE miRNAs. (i) Comparison of the number of DE miRNA-regulated target genes with evidence from PubMed. More than 50 target genes of miRNA (bold fonts).
DE miRNAs and their functions
Based on the criteria of FDR <0.001 and abs (fold change) >2, we identified 47 DE miRNAs between Rest-EV and Sti-EV (11 upregulated and 36 downregulated ones) (). Hierarchical clustering analysis revealed that the significantly altered miRNAs could be categorized into two groups ()). Moreover, the scatter plot of miRNAs expression showed that the DE miRNAs were mainly distributed within 2^11 (CPM <2048) ()), indicating that the components of miRNAs were changed in Sti-EV. Next, we performed qRT-PCR to validate the expression of DE miRNAs. Some of DE miRNAs (mmu-miR-142a-5p, mmu-miR-350-5p, mmu-miR-29a-5p and mmu-miR-700-3p) were highly expressed in Sti-EV, while others (mmu-miR-126a-3p, mmu-miR-21a-3p, mmu-miR-210-3p and mmu-miR-150-5p) were highly expressed in Rest-EV (p < 0.05) ()). ) demonstrates that the qRT-PCR results are consistent with the results of RNA-seq. Similar trend of expression for DE miRNAs was observed for MC-derived EVs by density gradient (Supplementary Figure 2C). Subsequently, we assessed the DE miRNA-target interactions using miRTarBase. The results revealed that 1828 genes were putatively targeted by the 40 DE miRNAs, except for 7 DE miRNAs. Some of the miRNAs, such as mmu-miR-301b-3p, mmu-miR-324-3p and mmu-miR-466i-5p were predicted to target over 300 genes (Supplementary Table 9). Studies on EVs miRNAs have increased; however, there is a limited evidence for EVs miRNAs-targeted genes by a PubMed search ()). Furthermore, the functional analysis of DE miRNAs in MC-derived EVs demonstrated that 21 GO categories were enriched (), including regulation of transcription, cell proliferation and signalling pathways. These data clearly show that MC-derived EVs are enriched in miRNAs that are highly relevant in gene transcriptional regulation.
Table 2. Differential expressed miRNAs identified in Rest-EV and Sti-EV.
Table 3. The functions of predicted gene targets of differentially expressed miRNAs in resting and degranulated mast cells derived extracellular vesicles.
Discussion
MCs are granulated tissue-resident cells, endowed with a unique phenotypic and functional plasticity. Due to receptors on the membrane surface of MCs, MCs degranulated when exposed to various stimuli, such as exposure to IgE and its antigenic ligands. The secretory granules released by MCs are strong inflammatory mediators, and the released cytokines and chemokines also have an effect on dual immunomodulation. EVs have been implicated important functions for MCs, however, reports on MC-derived EVs are limited. Therefore, an overall understanding of the expression profiles of proteome and transcriptome of MC-derived EVs may shed new light on the functions of MCs and MC-derived EVs.
Mouse bone marrow-derived MCs (BMMCs), as parental cells of resting and degranulated MC-derived EVs, have the following advantages. First, there is a lack of a suitable MCs line; commonly used MCs lines include HMC-1 (absence of the high-affinity IgE receptor on the cell surface), LAD2 (a very slow growth rate), MC/9 (for MCs signalling pathways), P815 (not expressing FcεRI receptor) and RBL-2H3 (for calcium influx, phospholipase activation and small G protein activation). In contrast, primary cultured BMMCs have low proliferation capacity and relatively stable cell population, which made them more suitable for this study. Second, the sources of MCs are often varied, and laboratories often adopt unstandardized EV-harvesting methods. These variables make it more difficult to comprehensively investigate MC-derived EVs. In this study, we extracted Rest-EV and Sti-EV by collecting the supernatants from BMMCs cultured for 48 h at rest and from those stimulated to undergo IgE-mediated degranulation, respectively. We presented a relatively specific isolation and identification process for MC-derived EVs.
We identified 1988 proteins in Rest-EV and Sti-EV using TMT-based MS, which offers the advantages of maximized protein coverage and precise quantification. Additionally, a large proportion of the proteins recovered from Rest-EV were metabolic enzymes, particularly enzymes associated with glycolysis ()). Glycolysis is a fundamental bioenergetic process mediated by a series of biochemical reactions and catalysed by well-characterized glycolytic enzymes. Interestingly, some of the glycolytic enzymes (phosphoglycerate kinase 1, enolase and pyruvate kinase) are among the 10 top proteins in most EVs [Citation35,Citation36]. It is reported that enolase 1 and calreticulin are important regulators of the differentiation and functions of BMMCs [Citation37]. The active metabolic state of MCs may provide energy for MCs degranulation.
MCs carry large amounts of preformed mediators in their secretory granules. Of note, we found that MC-derived EVs enwrapped several preformed MCs mediators by LC-MS/MS, including lysosomal enzymes (β-hexosaminidase, β-glucuronidase, cathepsin C), MC-specific proteases (tryptase, chymase, MCs carboxypeptidase A), non-MC-specific proteases (MMP9, granzyme, renin), cytokines (IL-4, stem cell factor) and peroxidase (Supplementary Table 2). Compared with Rest-EV, Sti-EV contained higher levels of tryptase, MCs carboxypeptidase A and IL-4. Wauben MH’s group also discovered that IgE-mediated MCs degranulation leads to a rapid release of high quantities of EVs, which is comparable to the release of preformed mediators. Such EVs were not only derived from the multivesicular bodies or plasma membrane [Citation38], but were also likely obtained from secretory granules [Citation39]. Although it is most likely that the EVs released upon MCs degranulation are derived from MCs secretory granules, we cannot fully exclude the possibility that the release of EVs and preformed mediators is coincident or independent. Accordingly, the distinction between EVs secretion and degranulation needs to be further studied.
Furthermore, 415 DEPs were identified, including proteins involved in metabolic pathways, lysosome activity, and protein processing in the endoplasmic reticulum (Supplementary Table 4). Besides, multilevel GO enrichment analysis for molecular function and biological processes revealed that MC-derived EVs enriched with hub proteins (ST2, CCR1, KIT and PLA2G7) were associated with the regulation of chemotaxis, cytokine-mediated signalling pathways, MCs degranulation, immune response-regulating cell surface receptor signalling pathways, and positive regulation of cell migration. Our previous findings showed that the CC chemokine receptor (CCR1) was upregulated in MC-derived EVs [Citation26], where the co-stimulation of FcεRI and CCR1 resulted in greater MCs degranulation than the stimulation of either receptor alone [Citation40]. These results provide insights into the potential functions of EVs in MC-mediated diseases.
Differences in cellular sources may affect the proteins composition of EVs. Cvjetkovic [Citation41], Kormelink [Citation27] and Valadi [Citation33] et al. analysed proteins of EVs from the HMC-1 cell line, upon IgE-mediated peritoneal MCs degranulation, and mouse MC/9 cells, respectively. We used the FunRich analysis tool to carry out a direct comparison of the above studies. Based on our results, a total of 135 (14 + 17 + 96 + 8) proteins were co-expressed in more than two studies ()). These proteins form BMMC-derived EVs highlight their important functions, as structural constituents of ribosomes and the cytoskeleton, in chaperone activity, and in cytoskeletal protein binding. In addition, Lässer et al. carried out an interesting study and concluded that the proteomes of the HD and LD exRNA-containing fractions were associated with EVs. Their electron microscopy results suggested that at least a part of the exRNA is associated with exosome-like EVs [Citation42]. Regrettably, we have not explored the correlation between proteins and RNAs encapsulated in MC-derived EVs, but this could be a very interesting topic for future study.
Accumulating studies have recognized lncRNAs as important molecules involved in growth, development, reproduction and even the regulation of disease. Currently, most of the studies on lncRNAs are mainly focused on tumours, but little is known about that of MC-related lncRNAs, not to mention MC-EV-encapsulated lncRNAs. Our study is the first exhaustive analysis of lncRNAs in Rest-EV and Sti-EV. Upon analysing the basic genomic features of the identified lncRNAs, we found that lncRNAs of Rest-EV had higher GC content and higher expression levels than the lncRNAs of Sti-EV. Compared to Rest-EV, more DE lncRNAs in Sti-EV were downregulated (). This result suggests that lncRNAs may be selectively sorted into EVs; however, exploring the functions of these lncRNAs individually will be a huge project. Notably, several DE lncRNAs (H19, ZFAS1, Neatl, Malat1) were identified in MC-derived EVs and may have critical roles in facilitating tumorigenesis by regulating angiogenesis, immunity and metastasis. For instance, H19 is a well-known proangiogenic factor that has been closely associated with inflammatory disorders [Citation43]. Similarly, elevated ZFAS1 expression correlated with tumour size, tumour-node-metastasis (TNM) stage and lymphatic metastasis (LNM) [Citation44]. Neat1 regulates the biological behaviour of tumours [Citation45,Citation46] and Malat1 controls the alternative splicing of various mRNA precursors and plays an important role in the pathogenesis resulting from metastasis and cell invasion [Citation47]. These lncRNAs are also involved in various other biological and pathological processes. At present, there are limited reports on EVs lncRNAs and our study provides a starting point for future more in-depth explorations of the lncRNAs in MC-derived EVs.
Since Valadi et al. [Citation33] first identified EV-mediated miRNA transfer between cells as a mechanism of intercellular signalling, EV-associated miRNAs have spawned great interest in these vesicles. When comparing miRNAs in Rest-EV and Sti-EV, we observed that the average length of the small RNAs in Rest-EV was more than 60 nt and that in Sti-EV was less than 40 nt. The variations in length observed in our study imply that the parent cells may possess a sorting mechanism that guides specific intracellular miRNAs to enter their EVs, which may influence their regulatory functions. In our study, 272 miRNAs were detected in MC-derived EVs, with mmu-miR-142a-5p and mmu-miR-142a-3p among the 15 most abundant miRNAs were significantly upregulated in Sti-EV. Studies have shown that miR-21, miR-142 and miR-146 form a core set of miRNAs that play an important role in allergic inflammation [Citation48]. miR-142-3p was found to enhance degranulation in an FcεRI-dependent manner in MCs [Citation49] and also increased in abundance in the sputum of patients with severe asthma [Citation50], suggesting that this miRNA contributes to the asthma inflammatory phenotype and may be as a potential therapeutic target in allergies or mastocytosis.
Our study has several limitations. First, only some of the molecules identified in the proteomic and RNA-seq data were verified. Second, BMMCs were used as the study model; despite the species-specific differences between mouse MCs and human MCs, these data provide a reliable basis for studying MCs. Third, functional validation will be the ultimate goal of omics research in MC-derived EVs.
Overall, we provided a comprehensive catalogue of protein, lncRNA and miRNA signatures of EVs derived from resting and degranulated MCs, which sets the stage for the future exploration of MC-derived EVs. Further characterization of the differentially expressed molecules between Rest-EV and Sti-EV will open up new avenues of research to improve our understanding of the function of MCs and their potential applications in disease diagnosis and therapy.
Supplemental Material
Download Zip (5.2 MB)Acknowledgments
We thank the families who participated in this research project. We also extend our gratitude to Chong Li (Shanghai-MOST Key Laboratory of Health and Disease Genomics, Chinese National Human Genome Center at Shanghai) for the RNA sequencing data analysis. We thank Dr Qingpeng Kong (the State Key Laboratory of Genetic Resources and Evolution, Kunming Institute of Zoology, Chinese Academy of Sciences, China) for the preprocessing of data analysis, and Dr Hu Zhou (Department of Analytical Chemistry and CAS Key Laboratory of Receptor Research, Shanghai Institute of Materia Medica, Chinese Academy of Sciences, China) for the proteome data analysis. We also thank Dr Jifu Wei (Research Division of Clinical Pharmacology, First Affiliated Hospital of Nanjing Medical University, China.) for his assistance with the analysis of the results.
Disclosure statement
No potential conflicts of interest were reported by the authors.
Supplementary Material
Supplemental data for this article can be accessed here.
Correction Statement
This article has been republished with minor changes. These changes do not impact the academic content of the article.
Additional information
Funding
References
- Li Z, Liu S, Xu J, et al. Adult connective tissue-resident mast cells originate from late erythro-myeloid progenitors. Immunity. 2018 Oct 16;49(4):640–653 e5. PubMed PMID: 30332630.
- Yanez-Mo M, Siljander PR, Andreu Z, et al. Biological properties of extracellular vesicles and their physiological functions. J Extracell Vesicles. 2015;4:27066. PubMed PMID: 25979354; PubMed Central PMCID: PMCPMC4433489.
- Robbins PD, Morelli AE. Regulation of immune responses by extracellular vesicles. Nat Rev Immunol. 2014 Mar;14(3):195–20. PubMed PMID: 24566916; PubMed Central PMCID: PMCPMC4350779.
- Merluzzi S, Betto E, Ceccaroni AA, et al. Mast cells, basophils and B cell connection network. Mol Immunol. 2015 Jan;63(1):94–103. PubMed PMID: 24671125.
- Li F, Wang Y, Lin L, et al. Mast cell-derived exosomes promote Th2 cell differentiation via OX40L-OX40 ligation. J Immunol Res. 2016;2016:3623898. PubMed PMID: 27066504; PubMed Central PMCID: PMCPMC4811108.
- Skokos D, Le Panse S, Villa I, et al. Mast cell-dependent B and T lymphocyte activation is mediated by the secretion of immunologically active exosomes. J Immunol. 2001 Jan 15;166(2):868–876. PubMed PMID: 11145662.
- Xiao H, Lasser C, Shelke GV, et al. Mast cell exosomes promote lung adenocarcinoma cell proliferation - role of KIT-stem cell factor signaling. Cell Commun Signal. 2014 Oct 14;12:64. PubMed PMID: 25311367; PubMed Central PMCID: PMCPMC4206705.
- Melo SA, Luecke LB, Kahlert C, et al. Glypican-1 identifies cancer exosomes and detects early pancreatic cancer. Nature. 2015 July 9;523(7559):177–182. PubMed PMID: 26106858; PubMed Central PMCID: PMCPMC4825698.
- Ekstrom K, Valadi H, Sjostrand M, et al. Characterization of mRNA and microRNA in human mast cell-derived exosomes and their transfer to other mast cells and blood CD34 progenitor cells. J Extracell Vesicles. 2012;1:18389. PubMed PMID: 24009880; PubMed Central PMCID: PMCPMC3760639.
- Sun Z, Yang S, Zhou Q, et al. Emerging role of exosome-derived long non-coding RNAs in tumor microenvironment. Mol Cancer. 2018 Apr 20;17(1):82. PubMed PMID: 29678180; PubMed Central PMCID: PMCPMC5909226.
- Barile L, Vassalli G. Exosomes: therapy delivery tools and biomarkers of diseases. Pharmacol Ther. 2017 June;174:63–78. PubMed PMID: 28202367.
- Xie G, Yang H, Peng X, et al. Mast cell exosomes can suppress allergic reactions by binding to IgE. J Allergy Clin Immunol. 2017 Sept 12. DOI:10.1016/j.jaci.2017.07.040. PubMed PMID: 28916187.
- Franceschini A, Szklarczyk D, Frankild S, et al. STRING v9.1: protein-protein interaction networks, with increased coverage and integration. Nucleic Acids Res. 2013 Jan;41(Database issue):D808–15. PubMed PMID: 23203871; PubMed Central PMCID: PMCPMC3531103.
- Spinelli L, Gambette P, Chapple CE, et al. Clust&See: a Cytoscape plugin for the identification, visualization and manipulation of network clusters. Biosystems. 2013 Aug;113(2):91–95. PubMed PMID: 23743336.
- Warde-Farley D, Donaldson SL, Comes O, et al. The GeneMANIA prediction server: biological network integration for gene prioritization and predicting gene function. Nucleic Acids Res. 2010 July;38(Web Server issue):W214–20. PubMed PMID: 20576703; PubMed Central PMCID: PMCPMC2896186.
- Pathan M, Keerthikumar S, Chisanga D, et al. A novel community driven software for functional enrichment analysis of extracellular vesicles data. J Extracell Vesicles. 2017;6(1):1321455. PubMed PMID: 28717418; PubMed Central PMCID: PMCPMC5505018.
- Pathan M, Keerthikumar S, Ang CS, et al. FunRich: an open access standalone functional enrichment and interaction network analysis tool. Proteomics. 2015 Aug;15(15):2597–2601. PubMed PMID: 25921073.
- Kim D, Pertea G, Trapnell C, et al. TopHat2: accurate alignment of transcriptomes in the presence of insertions, deletions and gene fusions. Genome Biol. 2013 Apr 25;14(4):R36. PubMed PMID: 23618408; PubMed Central PMCID: PMCPMC4053844.
- Trapnell C, Williams BA, Pertea G, et al. Transcript assembly and quantification by RNA-Seq reveals unannotated transcripts and isoform switching during cell differentiation. Nat Biotechnol. 2010 May;28(5):511–515. PubMed PMID: 20436464; PubMed Central PMCID: PMCPMC3146043.
- Trapnell C, Roberts A, Goff L, et al. Differential gene and transcript expression analysis of RNA-seq experiments with TopHat and Cufflinks. Nat Protoc. 2012 Mar 1;7(3):562–578. PubMed PMID: 22383036; PubMed Central PMCID: PMCPMC3334321.
- Kong L, Zhang Y, Ye ZQ, et al. CPC: assess the protein-coding potential of transcripts using sequence features and support vector machine. Nucleic Acids Res. 2007 July;35(Web Server issue):W345–9. PubMed PMID: 17631615; PubMed Central PMCID: PMCPMC1933232.
- Sun L, Luo H, Bu D, et al. Utilizing sequence intrinsic composition to classify protein-coding and long non-coding transcripts. Nucleic Acids Res. 2013 Sept;41(17):e166. PubMed PMID: 23892401; PubMed Central PMCID: PMCPMC3783192.
- Benjamini Y, Hochberg Y. Controlling the false discovery rate: a practical and powerful approach to multiple testing. J Royal Stat Soc Ser B (Methodological). 1995;57:289–300.
- Friedlander MR, Mackowiak SD, Li N, et al. miRDeep2 accurately identifies known and hundreds of novel microRNA genes in seven animal clades. Nucleic Acids Res. 2012 Jan;40(1):37–52. PubMed PMID: 21911355; PubMed Central PMCID: PMCPMC3245920.
- Benjamini Y, Drai D, Elmer G, et al. Controlling the false discovery rate in behavior genetics research. Behav Brain Res. 2001 Nov 1;125(1–2):279–284. PubMed PMID: 11682119.
- Liang Y, Qiao L, Peng X, et al. The chemokine receptor CCR1 is identified in mast cell-derived exosomes. Am J Transl Res. 2018;10(2):352–367. PubMed PMID: 29511430; PubMed Central PMCID: PMCPMC5835801.
- Groot Kormelink T, Arkesteijn GJ, van de Lest CH, et al. Mast cell degranulation is accompanied by the release of a selective subset of extracellular vesicles that contain mast cell-specific proteases. J Immunol. 2016 Oct 15;197(8):3382–3392. PubMed PMID: 27619994.
- Pathan M, Fonseka P, Chitti SV, et al. Vesiclepedia 2019: a compendium of RNA, proteins, lipids and metabolites in extracellular vesicles. Nucleic Acids Res. 2019 Jan 8;47(D1):D516–D519. PubMed PMID: 30395310; PubMed Central PMCID: PMCPMC6323905.
- Kalra H, Simpson RJ, Ji H, et al. Vesiclepedia: a compendium for extracellular vesicles with continuous community annotation. PLoS Biol. 2012;10(12):e1001450. PubMed PMID: 23271954; PubMed Central PMCID: PMCPMC3525526.
- Witwer KW, Soekmadji C, Hill AF, et al. Updating the MISEV minimal requirements for extracellular vesicle studies: building bridges to reproducibility. J Extracell Vesicles. 2017;6(1):1396823. PubMed PMID: 29184626; PubMed Central PMCID: PMCPMC5698937.
- Horton P, Park KJ, Obayashi T, et al. WoLF PSORT: protein localization predictor. Nucleic Acids Res. 2007 July;35(Web Server issue):W585–7. PubMed PMID: 17517783; PubMed Central PMCID: PMCPMC1933216.
- Van Deun J, Mestdagh P, Sormunen R, et al. The impact of disparate isolation methods for extracellular vesicles on downstream RNA profiling. J Extracell Vesicles. 2014;3:24858. PubMed PMID: 25317274; PubMed Central PMCID: PMCPMC4169610.
- Valadi H, Ekstrom K, Bossios A, et al. Exosome-mediated transfer of mRNAs and microRNAs is a novel mechanism of genetic exchange between cells. Nat Cell Biol. 2007 June;9(6):654–659. PubMed PMID: 17486113.
- Risso D, Ngai J, Speed TP, et al. Normalization of RNA-seq data using factor analysis of control genes or samples. Nat Biotechnol. 2014 Sept;32(9):896–902. PubMed PMID: 25150836; PubMed Central PMCID: PMCPMC4404308.
- Ronquist KG, Sanchez C, Dubois L, et al. Energy-requiring uptake of prostasomes and PC3 cell-derived exosomes into non-malignant and malignant cells. J Extracell Vesicles. 2016;5:29877. PubMed PMID: 26955882; PubMed Central PMCID: PMCPMC4783432.
- Garcia NA, Moncayo-Arlandi J, Sepulveda P, et al. Cardiomyocyte exosomes regulate glycolytic flux in endothelium by direct transfer of GLUT transporters and glycolytic enzymes. Cardiovasc Res. 2016 Mar 1;109(3):397–408. PubMed PMID: 26609058.
- Ryu SY, Hong GU, Kim DY, et al. Enolase 1 and calreticulin regulate the differentiation and function of mouse mast cells. Cell Signal. 2012 Jan;24(1):60–70. PubMed PMID: 21803152.
- Carroll-Portillo A, Surviladze Z, Cambi A, et al. Mast cell synapses and exosomes: membrane contacts for information exchange. Front Immunol. 2012;3:46. PubMed PMID: 22566928; PubMed Central PMCID: PMCPMC3342342.
- Raposo G, Tenza D, Mecheri S, et al. Accumulation of major histocompatibility complex class II molecules in mast cell secretory granules and their release upon degranulation. Mol Biol Cell. 1997 Dec;8(12):2631–2645. PubMed PMID: 9398681; PubMed Central PMCID: PMCPMC25733.
- Aye CC, Toda M, Morohoshi K, et al. Identification of genes and proteins specifically regulated by costimulation of mast cell Fcepsilon receptor I and chemokine receptor 1. Exp Mol Pathol. 2012 June;92(3):267–274. PubMed PMID: 22417871.
- Cvjetkovic A, Jang SC, Konecna B, et al. Detailed Analysis of protein topology of extracellular vesicles-evidence of unconventional membrane protein orientation. Sci Rep. 2016 Nov 8;6:36338. PubMed PMID: 27821849; PubMed Central PMCID: PMCPMC5099568 currently functioning as Chief Scientist at Codiak BioSciences, a company developing exosomes-based therapeutics.
- Lasser C, Shelke GV, Yeri A, et al. Two distinct extracellular RNA signatures released by a single cell type identified by microarray and next-generation sequencing. RNA Biol. 2017 Jan 2;14(1):58–72. PubMed PMID: 27791479; PubMed Central PMCID: PMCPMC5270547.
- Geng H, Bu HF, Liu F, et al. In inflamed intestinal tissues and epithelial cells, interleukin 22 signaling increases expression of H19 long noncoding RNA, which promotes mucosal regeneration. Gastroenterology. 2018 Apr 2;155:144–155. PubMed PMID: 29621481.
- Song W, Tian C, Zhang RJ, et al. Meta-analysis of the prognostic value of lncRNA ZFAS1 in patients with solid tumors. Oncotarget. 2017 Oct 27;8(52):90301–90307. PubMed PMID: 29163829; PubMed Central PMCID: PMCPMC5685750.
- Wedge DC, Gundem G, Mitchell T, et al. Sequencing of prostate cancers identifies new cancer genes, routes of progression and drug targets. Nat Genet. 2018 May;50(5):682–692. PubMed PMID: 29662167.
- Dhanoa JK, Sethi RS, Verma R, et al. Long non-coding RNA: its evolutionary relics and biological implications in mammals: a review. J Anim Sci Technol. 2018;60:25. PubMed PMID: 30386629; PubMed Central PMCID: PMCPMC6201556. eng.
- Jalali S, Jayaraj GG, Scaria V. Integrative transcriptome analysis suggest processing of a subset of long non-coding RNAs to small RNAs. Biol Direct. 2012 Aug 7;7:25. PubMed PMID: 22871084; PubMed Central PMCID: PMCPMC3477000. eng.
- Dissanayake E, Inoue Y. MicroRNAs in allergic disease. Curr Allergy Asthma Rep. 2016 Sept;16(9):67. PubMed PMID: 27585977.
- Yamada Y, Kosaka K, Miyazawa T, et al. miR-142-3p enhances FcepsilonRI-mediated degranulation in mast cells. Biochem Biophys Res Commun. 2014 Jan 17;443(3):980–986. PubMed PMID: 24361879.
- Maes T, Cobos FA, Schleich F, et al. Asthma inflammatory phenotypes show differential microRNA expression in sputum. J Allergy Clin Immunol. 2016 May;137(5):1433–1446. PubMed PMID: 27155035.