
ABSTRACT
Production of extracellular vesicles (EVs) involved in intercellular communication is a common capacity of most cell types. Upon encountering opsonized microorganisms, neutrophilic granulocytes release EVs that compromise bacterial growth. We carried out a systematic investigation of the involvement of potential opsonin receptors in EV-generation from human and murine neutrophils. Applying flow cytometric, proteomic and functional analysis as well as using genetically modified mice, we demonstrate that formation of antibacterial EVs depends upon stimulation of the multifunctional Mac-1 integrin complex, also called as complement receptor 3 (CR3), whereas activation of immunoglobulin binding Fc receptors or pattern recognition receptors alone or in combination is ineffective. Mac-1/CR3 stimulation and downstream tyrosine kinase signalling affect both the numbers, the cargo content and the antibacterial capacity of the produced vesicles. In contrast, Mac-1/CR3 signalling is not required for spontaneous EV formation, clearly indicating the existence of separate molecular pathways in EV biogenesis. We propose that EVs are “tailor-made” with different composition and functional properties depending on the environmental circumstances.
Introduction
Extracellular vesicles (EVs) represent a recently discovered channel of intercellular communication significantly affecting, among others immune cell functions [Citation1–Citation3]. Cells of evolutionarily very different species, such as mammals, plants or microorganisms were all shown to produce EVs spontaneously and/or upon stimulation [Citation4,Citation5]. However, the released EVs are heterogeneous both in size, composition and mechanism of generation [Citation6,Citation7]. Exosomes released from multivesicular bodies are small, have a diameter of (or less than) 100 nm, are sedimented by centrifugal force around 100,000g and they are enriched in certain endosome markers, such as CD63, CD9 and CD81 tetraspanins [Citation1,Citation7–Citation9]. EVs originating from the cell surface by budding or blebbing are often referred to as “microvesicles” or “ectosomes” [Citation4,Citation10]. This population may contain both small (d ˂100 nm), medium-size (d = 100 nm–1 µm) and large (d > 1 µm) vesicles that can be separated at different centrifugal forces [Citation7]. Composition of these vesicles reflects the composition of the parent cell, containing components both from the plasma membrane, cytosol and even certain subcellular organelles [Citation1].
There are several indications that EV production and/or composition depend on environmental factors. Stimuli, such as lipopolysaccharide for murine dendritic cells [Citation11], IgE for murine mast cells [Citation12] or T-cell receptor stimulation of CD4+ T-cells [Citation13] alter the size, floatation properties or protein composition of exosomes. In case of the larger-sized EV, population alteration of the composition and/or effects of the released EVs are triggered in neutrophilic granulocytes by chemotactic agent and adhesion [Citation14], in HUVEC cells by high glucose environment and angiotensin II [Citation15] or in rat basophil leukaemia cells by expression of proteinase-3 [Citation16]. However, the molecular mechanisms underlying these alterations are unknown.
In our previous work, we showed that stimulation of neutrophilic granulocytes (PMN) with opsonized particles (bacteria or zymosan A) triggered the formation of large amount of medium-sized EVs enriched in granule proteins. EVs issued from activated cells had a definitive dose-dependent antibacterial effect and were named “aEV”s [Citation17,Citation18]. Binding of bacteria and prevention of their proliferation were also observed with EVs derived from peripheral blood mononuclear cells upon bacterial stimulation [Citation19]. Prevalence of aEVs in the serum of septic patients suggested the in vivo relevance of the process [Citation18,Citation20], and measurement of “microvesicle–bacteria aggregation” was proposed as a diagnostic tool for sepsis [Citation21]. In detailed analysis of PMN-derived EVs, we demonstrated that aEVs present a protein distribution profile different both from spontaneously formed EVs (sEV) and EVs generated upon apoptosis of PMN [Citation22].
In the current study, we investigated EV biogenesis in human and in genetically modified murine neutrophils upon physiological stimuli. We revealed the role of the multifunctional molecule Mac-1/CR3 in triggering the release of antibacterial EVs and in altering cargo sorting. Our data provide an initial example for environmental factors selectively directing generation of EVs via specific cell surface receptors.
Materials and methods
Materials
Hanks' balanced salt solution (HBSS) with calcium, magnesium and glucose was from GE Healthcare Life Sciences (South Logan, UT, USA), zymosan A, ferricytochrome c (horse heart, type VI) and superoxide dismutase (SOD) were from Sigma-Aldrich (St. Louis, MO, USA), Ficoll-Paque and Percoll from GE Healthcare Bio-Sciences AB (Uppsala, Sweden), HEPES (pH 7.4) from Sigma. All other used reagents were of research grade. Green fluorescent protein (GFP) expressing and chloramphenicol resistant S. aureus (USA300) was a kind gift of Professor William Nauseef (University of Iowa). DNAse I was from Thermo Scientific (Waltham, MA, USA) and was used in 100 U/mL final concentration. Dasatinib (> 99% pure) was obtained from Selleck Chemicals and its purity and stability was confirmed by HPLC-MS analysis (Vichem, Hungary). Dasatinib was dissolved in DMSO. The final dasatinib-treated samples contained ≤0.002% DMSO and inhibitor-free controls contained 0.002% DMSO.
Preparation of human PMN and EV
Venous blood samples were drawn from healthy adult volunteers according to procedures approved by the National Ethical Committee (ETT-TUKEB No. BPR/021/01563-2/2015). Neutrophils were obtained by dextran sedimentation followed by a 62.5% (v/v) Ficoll gradient centrifugation (700g, 40 min, 22°C) as previously described [Citation22]. The preparations contained more than 95% PMN and less than 0.5% eosinophils. PMNs (typically 107 cell in 1 mL HBSS) were incubated with or without activating agent for 30 min at 37°C in a linear shaker (80 rpm/min). After activation, cells were sedimented (500g, Hermle Z216MK 45° fixed angle rotor, 5 min, 4°C). Upper 500 µL of the supernatant was filtered through a 5 µm pore sterile filter (Sterile Millex Filter Unit, Millipore, Billerica, MA, USA). The filtered fraction was sedimented (15,700g, Hermle Z216MK 45° fixed angle rotor, 5 min, 4°C) and the pellet was carefully resuspended in the original incubation volume. Where indicated, PMNs were pretreated with dasatinib in 200 nM final concentration for 10 min at room temperature. Protein concentration of EV was determined by the Bradford protein assay using bovine serum albumin as standard [Citation18].
Test of neutrophil extracellular trap (NET) formation and cell viability during activation of PMN
Viability and NET formation was controlled by confocal microscopy (Zeiss LSM710 confocal laser scanning microscope equipped with EC Plan-Neoflural, Zeiss 20x/0.5 M27 objective). Excitation and emission wavelengths were 514 and 534–709 nm, respectively. Similar to other experiments, 5 × 10⁶ PMNs in 500 µL HBSS were incubated on the cover slip at 37°C in the presence of the indicated stimuli and the nucleic acid stain propidium iodide (1 g/mL, Invitrogen, USA). PMA at a concentration of 100 nM was used as positive control. Samples were analysed at 20 and 180 min. Per sample six regions of interest were investigated with ZEN software (Zeiss). Parallel to microscopy, propidium iodide fluorescence of differently activated PMN (107/mL) was followed in a CLARIOstar microplate reader (BMG Labtech, Germany) at 535 nm excitation and 617 nm emission wavelength. Reaction volume was 200 µL at 37°C by a gentle linear shaking (80 rpm/min). FITC conjugated AnnexinV (BD Biosciences, USA) and propidium iodide positivity of PMNs was measured by flow cytometry after 20 min activation. Triton X-100 (0.1%) treated cells were used as positive control.
Transgenic mice
Used mice strains are described in detail in previous publications: CD18-deficient (Itgb2tm2Bay/tm2Bay, referred to as CD18−/−) [Citation23] were obtained from A. Beaudet (Baylor College of Medicine, Houston, TX). FcRγ-chain deficient (Fcer1gtm1Rav/tm1Rav, referred to as FcRγ−/−) mice were purchased from Taconic [Citation24]. CD11b-deficient (Itgamtm1Myd/tm1Myd, referred to as CD11b−/−) mice were purchased from The Jackson Laboratory. All transgenic mice were backcrossed to the C57BL/6J genetic background for at least six generations. All transgenic mice were 11–20 weeks old. Age- and sex-matched C57Bl/6J animals were used as controls. Genotyping was performed by allele-specific PCR. Wild type (WT) control C57BL/6J mice were purchased from Charles River or the Hungarian National Institute of Oncology. Mice were kept in sterile, individually ventilated cages (Tecniplast, Buguggiate, Italy) in a conventional facility. All animal experiments were approved by the Animal Care Committee of the National Authority for Animal Health (Budapest, Hungary).
Isolation of murine PMN and EV
Murine neutrophils were isolated from the bone marrow of the femurs, humeri and tibias of intact mice. Because of the smaller size, a different protocol was applied than for human PMN. Following hypotonic lysis, Percoll gradient centrifugation (62.5% v/v, 700g, 40 min, 22°C) was carried out, using sterile and endotoxin-free reagents as previously described [Citation25]. Cells were kept at room temperature in Ca2+ and Mg2+-free medium until use (usually less than 30 min) and pre-warmed to 37°C before activation. Neutrophil assays were performed at 37°C in HBSS supplemented with Ca2+ and Mg2+ and 20 mM HEPES, pH 7.4. PMNs (107 cell in 1 mL HBSS) were incubated with or without activating agent for 30 min at 37°C on a linear shaker (80 rpm/min). After incubation, PMNs were sedimented (1000g, Hermle Z216MK 45° fixed angle rotor, 5 min, 4°C) and the upper 800 μL of the supernatant was filtered through a 5 μm pore sterile filter. The filtered fraction was sedimented again (30,000g, Beckmann JA-17 fixed 25° angle rotor, 30 min, 4°C). The sediment was resuspended in HBSS at the original volume and used immediately for further analysis according to previous observations [Citation26].
Opsonization
Zymosan (5 mg in 1 mL HBSS) was opsonized with 500 μL pooled human or murine serum for 30 min at 37°C. For complement-free opsonization zymosan (5 mg in 1 mL PBS) was opsonized with 500 μL human serum pretreated with 20 mM EDTA. After opsonization, zymosan was centrifuged (2500g, 5 min, 4°C, Hermle Z216MK 45° fixed angle rotor), and washed once in HBSS.
Bacteria (OD600 = 1.0 in 800 μL HBSS) were opsonized with 200 μL pooled human serum for 30 min at 37°C. After opsonization, bacteria were centrifuged (5000g, 10 min, 4°C, Hermle Z216MK 45° fixed angle rotor), and washed once in HBSS.
Activation of adherent neutrophils
Selective activation of Mac-1 complex of adherent human neutrophils was performed in six well tissue culture plates (Biofil, Hungary) coated overnight with 0.2 mg/mL BSA or 50 μg/mL C3bi (both from Merck, Darmstadt, Germany) as previously described [Citation27]. To obtain immobilized immune complex–coated surfaces, human lactoferrin (20 μg/mL; Sigma-Aldrich, USA) was covalently linked to poly-l-lysine (Sigma-Aldrich, USA) coated six well plates and then treated with polyclonal anti-lactoferrin (LTF) IgG (1:400 dilution; Sigma-Aldrich, USA) or non-specific IgG (1:400 dilution; Sigma-Aldrich, USA) for 1 h as previously described [Citation28]. Unbound immunoglobulin was removed by washing the plate by HBSS three times. The isotype control serves to test the unspecific binding of applied antibodies. As a control of cell activation, measurement of ROS production was performed parallel to EV production [Citation29]. Briefly, cells (106/mL) were suspended in HBSS containing 100 μM cytochrome c. The cells were stimulated with the indicated stimuli. Control samples contained 20 μg/mL SOD. As positive control 100 nM PMA was used. Aliquots (200 μL) of the suspension were added into wells of a 96-well plate and prewarmed at 37°C for 5 min in a shaking ELISA-reader (Labsystems iEMS Reader MF). The changes in the absorption were recorded at 550 nm for 30 min with 1 measurement/min at 37°C with gentle shaking. After subtracting the background values, superoxide production was presented as OD changes (Figure S3n–o).
Measurement of IL-8 production
PMN were left unstimulated or were activated by 0.5 or 0.25 mg/mL serum opsonized zymosan A. After two hours, cells were pelleted with 500g for 10 min and in the supernatant IL-8 was measured by sandwich ELISA kit Human IL-8/CXCL8 DuoSet ELISA (R&D Systems, Minneapolis, MN, USA), according to the manufacturer’s protocol [Citation30].
EV analysis and quantification by flow cytometry
Human EVs were labelled with PE conjugated monoclonal anti-CD11b (1 μg/mL, Tonbo Biosciences, USA, Clone M1/70) [Citation31], or FITC conjugated AnnexinV (BD Biosciences) for 20 min at 37°C and then washed in HBSS. Murine EVs were labelled with PE conjugated monoclonal anti-CD11b (1 μg/mL, Tonbo Biosciences, USA, clone M1/70) [Citation32] or PE conjugated monoclonal anti-CD18 (1 μg/mL, BD Biosciences, clone C71/16) [Citation33] or PerCP-Cy 5.5 conjugated monoclonal anti-Ly6g (1 μg/mL, BD Biosciences, clone 1A8) [Citation34] or FITC conjugated AnnexinV (BD Biosciences) for 20 min at 37°C and then washed in HBSS. Isotype controls were from identical manufacturer, annexinV labelling was controlled in 20 mM EDTA containing medium.
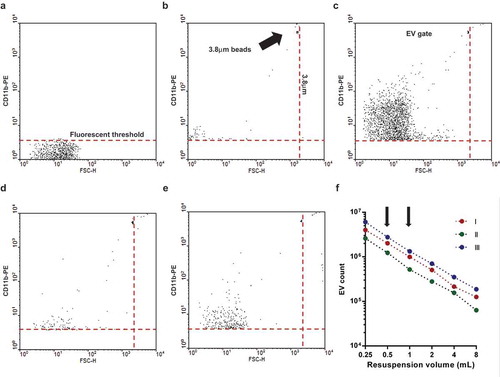
For flow cytometric detection, a Becton Dickinson FACSCalibur flow cytometer was used with the following settings (for PE labelled EV detection and S1): flow rate was held under 1000 events/s; FSC = E01 (log); SSC = 330V (log); 585/42 nm detector (Fl-2) = 550V (log). The procedure of measurement is summarized in . Pure HBSS medium was used for setting the threshold (typical value: 152) to eliminate instrumental noise (()). In the next step, fluorescent beads (3.8 μm SPHERO Rainbow Alignment Particles from Spherotech Inc., USA) were detected to set the upper size limit of EV detection range (()). The smallest fluorescent particles reliably detected by a conventional cytometer could be around 300 nm [Citation35]. After the measurement of an EV preparation (()) the number of isotype control events (()) and the 0.1% Triton X-100 detergent non-sensitive events (()) were subtracted to calculate the true EV number. To avoid swarm detection, the flow rate was held below 1000 events/s (3750 events/µL) during measurements. Samples were re-measured after a two-fold dilution which resulted in a mean ratio of 0.4977 (n = 292) as compared to the original sample, with 95% confidence intervals of 0.495–0.5003, indicating in a one-sample t test no significant difference from the hypothetical value of 0.5. Linearity of measurements was also controlled in a broader range () and S1, arrows in () indicate the two dilutions measured routinely). In all FC measurements 16 μL of sample was analysed and corrected to calculate the true EV count by subtracting the Triton X-100 resistent and the isotype antibody labelled events. The true EV count was multiplied by 62.5 or 125 (depending on the pellet resuspension volume of 0.5 resp. 1.0 mL) to calculate EV count in the whole 1000 μL volume that contained EVs derived from 107 PMNs. FC data were analysed with Flowing 2.5 Software (Turku Centre for Biotechnology, Finland).
Figure 1. Gating strategy of flow cytometric (FC) EV detection. Representative dot plots of FC measurements. a. Fluorescence threshold was set in pure HBSS in the yellow fluorescence channel (585 nm) against forward scatter plot. b. Spherotech beads (3.8 μm) were used to set the upper size limit of EV gate. c. Representative dot plot of CD11b PE labelled EV. d. Representative dot plot of isotype PE antibody labelled EV. e. Representative dot plot of 0.1% Triton X-100 treated CD11b PE labelled EV. f. Relation of EV count to serial dilution. The x axis indicates the final volume used for resuspension of the sedimented EVs. Three representative measurements. The arrows indicate the dilution used routinely.
Quality control of the EV preparation by size exclusion chromatography (SEC)
Following the principles of MISEV2018 [Citation36], the EV preparation was validated by size exclusion chromatography (SEC). Sepharose CL-2B (GE Healthcare; Uppsala, Sweden) was stacked in empty polypropylene columns containing 30 μm pore size porous polyethylene filter (ThermoFischer Scientific, USA). The prepared columns had 1.6 cm diameter and 6.5 cm height with 13 mL total bed volume. Neutrophils (107 cells/mL HBSS) were sedimented (500g, Hermle Z216MK 45° fixed angle rotor, 5 min, 4°C) and the supernatant was filtered through a 5 µm pore sterile filter onto the top of the SEC column. A maximal volume of 1.5 mL was loaded on the column, followed by elution with HBSS (pH 7.4). The eluate was collected in 22 sequential fractions of 0.5 mL. Each fraction was analysed by dynamic light scattering (DLS), flow cytometry and western blotting. For western blotting, fractions were centrifuged (15,700g, Hermle Z216MK 45° fixed angle rotor, 5 min, 4°C) and the pellet was carefully resuspended in 30 µL distilled water and 10 μL Laemmli sample buffer. Indicated fractions were resuspended in 50 μL distilled water for Bradford protein measurements and in 500 μL HBSS for bacterial survival assay. After every separation, SEC columns were regenerated [Citation37] and were not used more than 5 times.
As shown in Figure S2, fractions 8 through 12 contained EVs detectable by DLS both in the sEV (Figure S2a) and in the aEV (Figure S2b) preparations. In these fractions, EVs were detected also by flow cytometry and the number of aEVs was consistently higher than sEV numbers (Figure S2c). In the fractions SEC8-12 the major granule protein lactoferrin and in most of the fractions also actin could be revealed by western blotting. The increase of protein content observed in aEV preparation affected only the protein recovered in the vesicular (SEC8-12) fractions, whereas the amount of co-sedimented protein recovered in fractions SEC13-22 was not changed (Figure S2e).
Dynamic light scattering (DLS)
DLS measurements were performed at room temperature with an equipment consisting of a goniometer system (ALV GmbH, Langen, Germany), a diode-pumped solid-state laser light source (Melles Griot 58-BLS-301, 457 nm, 150 mW) and a light detector (Hamamatsu H7155 PMT module). The evaluation software yielded the autocorrelation function of scattered light intensity, which was further analysed by the maximum entropy method (MEM), from where the different contributions of this function were determined. The radius of the particles was calculated using sphere approximation [Citation22].
Transmission electron microscopy (TEM)
EV-containing pellets were processed as described in our previous papers [Citation18,Citation22]. Briefly, pelleted EVs were fixed with 4% paraformaldehyde at room temperature for 1 h, rinsed by PBS and postfixed in 1% osmium tetroxide (OsO4) for 20 min. After rinsing with distilled water, pellets were dehydrated by a series of increasing ethanol concentrations, including block staining with 1% uranyl-acetate in 50% ethanol for 30 min, finally embedded in Taab 812 (Taab; Aldermaston, UK). Following polymerization at 60°C for 12 h, 50–60 nm ultrathin sections were cut using a Leica UCT ultramicrotome (Leica Microsystems, UK) and examined using a Hitachi 7100 transmission electron microscope (Hitachi Ltd., Japan).
Electron micrographs were made by Veleta 2k × 2k MegaPixel side-mounted TEM CCD camera (Olympus). Contrast/brightness of electron micrographs was edited by Adobe Photoshop CS4 (Adobe Systems Incorporated, CA, USA). Analysis of micrographs was performed in ImageJ [Citation38] by two skilled persons independently. Data originate from 400 EVs pro samples mean diameter was calculated from measured area.
Immunoblotting
EVs were lysed in Laemmli sample buffer (252 mM Tris-HCl, 40% glycerine, 8% sodium dodecyl sulphate, 0.04% bromephenol blue, 4% β-mercaptoethanol, pH 6.8), boiled, run in 10% (w/v) polyacrylamide gels and transferred to nitrocellulose membranes. After blocking for 1 h in PBS containing 5% ovalbumin and 0.1% (w/v) Tween 20, blots were incubated with anti-lactoferrin polyclonal antibody [Citation39] in 1:1000 dilution or anti-β-actin mAb (clone AC-74, both from Merck, Darmstadt, Germany) in 1:10,000 dilution or with anti-MPO monoclonal antibody (clone 2C7, Cell Signalling Technologies, Leiden, The Netherlands) in 1:500 dilution in 5% ovalbumin. Bound antibody was detected with enhanced chemiluminescence using horseradish peroxidase linked whole anti-rabbit-IgG (from donkey) or anti-mouse-IgG (from sheep) secondary antibodies (both from GE Healthcare, Little Chalfont, Buckinghamshire, UK) used in 1:5000 dilution.
Proteomic analysis
Mass spectrometry based proteomics was carried out on EVs isolated in two biological replicates. In each case, the isolated vesicles were resuspended in 35 µL water. Protein concentration of each preparation was determined using the Bradford assay. Proteins were extracted using repeated freeze-thaw cycles [Citation40], and digested in solution using Trypsin/LysC mix (Promega, Madison, WI) at 1:100 ratio for 1 h, followed by Trypsin addition at 1:10 ratio for 2 h, both at 37°C. The resulting peptides were desalted using Pierce™ C18 spin columns (Thermo Fisher Scientific, Waltham, MA) and analysed on a Dionex Ultimate 3000 RSLCnano system (Thermo Fisher Scientific, Waltham, MA) coupled to a Bruker Maxis II Q-TOF mass spectrometer (Bruker, Bremen, Germany) equipped with a CaptiveSpraynanoBooster ionization source. A 2 cm 100 µm i.d. Nano Trap column packed with Acclaim PepMap100 C18 (Thermo Fisher Scientific, Waltham, MA) material was used for trapping. Separation of the peptides was achieved on an Acquity M-Class BEH130 C18 analytical column (1.7 µm, 75 µm × 250 mm Waters, Milford, MA, USA) using gradient elution (4–50% eluent B in 120 min). Solvent A was water + 0.1% formic acid, while solvent B was acetonitrile + 0.1% formic acid. Data were recalibrated using the Compass Data Analysis software 4.3 (Bruker Daltonics, Bremen, Germany) and processed with ProteinScape 3.0 software (Bruker Daltonik GmbH, Bremen, Germany). Protein identification was performed using the Mascot search engine version 2.5 (Matrix Science, London, UK) against the Swissprot database (2015_08) applying the following search parameters: trypsin enzyme, 7ppm peptide mass tolerance, 0.05 Da fragment mass tolerance, max. 2 missed cleavages. Carbamidomethylation of cysteines was set as fixed modification, while deamidation (NQ) and oxidation (M) as variable modifications. Proteins with a minimum of two identified, unique peptides were accepted. False discovery rate (FDR) was <1%. Gene ontology enrichment was performed using FunRich [Citation41]. Label-free quantification was performed using MaxQuant [Citation42] software version 1.5.3.30. Each LC-MS/MS run was aligned using the “match between runs” feature (match time window 0.8 min, alignment time window 15 min).
Bacterial survival assay
Opsonized bacteria (5 × 10⁷/50 μL HBSS) were added to 500 μL EV (derived from 5 × 10⁶ PMN) suspended in HBSS. During a 40 min coincubation step at 37°C, the bacterial count decreases or increases depending on the samples’ antibacterial effect and the growth of bacteria. At the end of the incubation, 2 mL ice‐cold stopping solution (1 mg/mL saponin in HBSS) was added to stop the incubation and lyse EVs. After a freezing step at −80°C for 20 min, samples were thawed to room temperature and inoculated into LB broth. Bacterial growth was followed as changes in OD using a shaking microplate reader (Labsystems iEMS Reader MF, Thermo Scientific) for 8 h, at 37°C, at 650 nm. After the end of growth phase, the initial bacterial counts were calculated indirectly using an equation similar to PCR calculation, as described previously [Citation17].
Peritonitis
Abdominal cavity of WT or CD11b˗/˗ mice was injected with zymosan dissolved in 500 μL PBS (0.2 μg/mL). Two hours later animals were sacrificed and the peritoneum was washed with 5 mL ice-cold PBS. Abdominal EVs were isolated as described above; cells were analysed from the pellet of the first centrifugation (1000g, Hermle Z216MK 45° fixed angle rotor, 5 min, 4°C). Abdominal cells were identified by FC using anti-Ly6g, FSC and SSC characteristics. EVs were stained with FITC labelled annexinV or PE labelled anti CD18 (1 μg/mL, BD Biosciences, clone C71/16) and enumerated with flow cytometry as described above.
Statistics
Comparisons between groups were analysed by two-tailed Student’s t tests or ANOVA. Exact statistical tests are indicated in the figure legends. All bar graphs show mean and ± s.e.m. Difference was taken significant if P value was <0.05. * represents P < 0.05; ** represents P < 0.01; *** represents P < 0.0001. Statistical analysis was performed using GraphPad Prism 6 for Windows (La Jolla, California, USA).
Results
Fc and complement receptors participate differently in initiation of aEV production
In our earlier experiments, we observed that opsonized particles initiated the formation of EVs which impaired bacterial growth. In contrast, soluble mediators such as FMLF, TNFα, CXCL12 or LPS had only weak effect on EV formation, and those vesicles were devoid of antibacterial effect [Citation18]. Our previous data thus indicated opsonin receptors as potential initiators of aEV formation [Citation43]. Therefore, we tested first the effect of stimulation of the receptors of the two major classes of opsonins present in blood plasma, immunoglobulins and complement components. Neutrophilic granulocytes express several types of Fcγ receptors which recognize immunglobulin G (IgG) [Citation28] and complement receptors CR1, CR3 and CR4 that recognize various complement fragments [Citation44, Citation45, Citation46].
EV formation in human PMNs was quantitatively followed by two parallel methods: number of vesicles detectable by flow cytometry and total protein content of the separated vesicle population. Similar to previous observations, stimulation of PMN with particles opsonized with full human serum induced a significant increase in EV production marked as “aEV” compared to sEV (()). We controlled that neutrophil extracellular trap (NET) formation did not occur and the viability of the cells did not deteriorate during the 20 min incubation period (Figure S3). PMN activated with opsonized zymosan were able to produce the soluble mediator IL-8 as well as superoxide (Figure S3m,n). It should also be recalled that in our previous study [Citation18] we did not observe any significant difference in the number, the proportion of erythrosin B positive cells, or in the ability of producing superoxide or kill bacteria between control and opsonized bacteria treated neutrophils.
Figure 2. Complement receptor activation induces aEV production in human PMN. a. Quantification of EV production by flow cytometry (FC, left axis) and protein amount measurement (right axis) after activation with non-opsonized (zEV), partially (abzEV) or completely (aEV) opsonized zymosan. Data were compared by using two-way ANOVA coupled with Tukey’s post hoc test; n = 22, 26. Level of significance is indicated by * for EV numbers and by # for protein amount. FC quantification of EV production by adherent PMN on immune complex (IC) surface (b.) and on C3bi or bovine serum albumin (BSA) surface (c.). C3bi or bovine serum albumin (BSA) surface. Data were compared using paired Student’s t-test, n = 8 and 4. d. Bacterial survival in the presence of different types of EVs released from 5 × 10⁶ PMN. Data were compared to sEV using RM one-way ANOVA coupled with Dunnett’s post hoc test; n = 11. e. Quantification of EV production (left axis) and protein amount measurement (right axis) from PMN pretreated without or with dasatinib. Data were compared by using two-way ANOVA coupled with Tukey’s post hoc test; n = 7,11. Level of significance is indicated by * for EV numbers and by # for protein amount. f. Quantification of bacterial survival in the presence of aEV from PMN preincubated without or with dasatinib. Data were compared to sEV using RM one-way ANOVA coupled with Dunnett’s post hoc test n = 5.
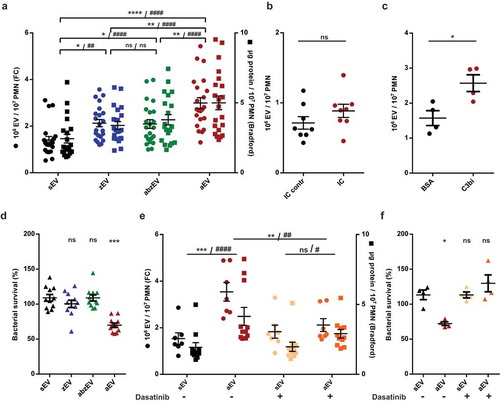
To assess the contribution of the different opsonin receptors and potential pattern recognition receptors (PRR), we measured EV formation upon stimulation of PMN with incompletely opsonized particles. As shown in (), non-opsonized zymosan induced slight but significant increase of EV production (marked “zEV”). Particles opsonized in complement-depleted serum – that contains only antibodies as functional opsonin – brought about an EV production (marked “abzEV”) that did not exceed the amount of zEV and remained definitely lower than initiated by fully opsonized particles. The detectable number and protein content of EVs increased proportionally, unlike in case of EV generation in apoptotic PMN, where abundant increase of EV number, but only slight increase of protein content was observed previously [Citation22]. These observations suggest that the two types of opsonin receptors may play different roles in aEV generation.
To test the involvement of the two opsonin receptor types separately and independently from phagocytosis, we used relevant adhesive surfaces. Participation of Fc receptors in EV formation was investigated on immune complex surface but we did not observe significant increase of EV generation as compared to the control where Fc receptors are not activated (()). In parallel experiments, we verified that neutrophils adherent to the immune complex surface were able to produce superoxide (Figure S3o), indicating that activation of the Fc receptors did take place and the lack of EV production increase was not the result of missing cell activation. Next we examined the potential role of complement receptors. On neutrophils the dominant complement receptors are CR3 and CR4, which belong to the family of β2 integrins and can be specifically activated by the complement fragment C3bi [Citation44]. As shown in (), adding human PMN on a C3bi surface resulted in a significant increase in the number of detectable EVs. Thus, activation of the complement receptors is effective in EV biogenesis also in the absence of phagocytosis.
Next we compared the antibacterial effect of EVs produced upon different stimulation (()). EVs produced spontaneously (sEV), or upon stimulation with non-opsonized zymosan (zEV) or with zymosan opsonized only by antibodies in complement-depleted serum (abzEV) had no effect upon bacterial growth. Only full serum opsonized zymosan evoked aEV were able to impair bacterial growth. In previous experiments, we showed that the difference between sEV and aEV in their effect on bacterial growth was significant both when EVs from equal cell number or of equal total protein were tested [Citation18]. Separation by SEC was applied to associate the antibacterial effect of aEVs to the vesicular fractions (Figure S2f). Impairment of bacterial growth in the presence of aEVs was not affected by DNAse treatment but it was lost upon treatment by Triton X-100 demonstrating that the antibacterial effect was dependent on intact vesicular structures (Figure S2g).
Tyrosine kinases are required for aEV formation from human PMN
Outside-in signalling via activated integrins proceeds via tyrosine kinases, predominantly via the Src family kinases and Syk tyrosine kinase [Citation47]. We assessed the role of these signalling elements in aEV formation by application of dasatinib, a tyrosine kinase inhibitor whose effects on human neutrophil functions were investigated in detail [Citation48]. Dasatinib did not change spontaneous EV formation from resting cells but significantly reduced aEV formation (()).
Dasatinib pretreatment also prevented the antibacterial effect of EVs produced upon stimulation with fully opsonized particles (()).
Receptor stimulation does not influence the size and morphology of produced vesicles
To characterize the effect of receptor stimulation on physical properties of the produced EV population, we investigated their size and electron microscopic appearance (). Size distribution was first analysed by DLS (()). In DLS two major populations of particles were revealed: one with a radius of 100 nm and a broader one with a radius of 200–700 nm. The latter size population contains the EVs enumerated by our flow cytometry technique. Importantly this population disappeared upon treatment with the detergent Triton X-100, confirming its vesicular nature [Citation49]. No significant size difference was detected between different EV populations by DLS (() shows the curves only for sEV and aEV).
Figure 3. Characterization of EVs derived of human PMN. a. Size distribution spectra of EVs measured by DLS. Broken line represents 0.1% Triton X-100 treated aEV. Signal above 1000 nm is due to zymosan contamination. Representative pictures of one out of three similar experiments. Representative electron microscopic images of human sEV (b.), zEV (c.), abzEV (d.), aEV (e.), and aEV prepared from dasatinib pretreated PMN (f.). Original magnification is 30,000×, representative pictures out of three similar experiments. g. Size distribution spectra of human EVs based on electron microscopy images of one representative experiment, data originate from 400 EVs pro samples. The dotted line represents the possible limit of detectability by flow cytometry.
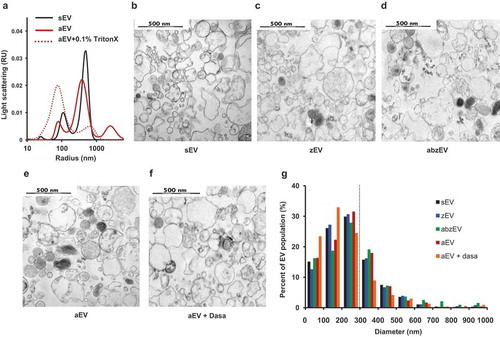
More detailed characterization was carried out by electron microscopy. As demonstrated in (–f), electron micrographs support the vesicular character of all EV populations, but present heterogeneous morphology and electron density. By measuring the area of 400 intact vesicles the calculated diameter distribution is typical for medium-size EVs (()). No remarkable differences could be revealed either in the morphological appearance or in size distribution of the different vesicle populations produced spontaneously (()) or initiated by different receptor stimulations (()).
Cargo sorting into aEV is dependent on complement receptor stimulation and signalling
Next we asked the question whether stimulation of the different receptors only determined the number and function of produced EVs or they also affect cargo sorting into the released vesicles. With this goal in mind, we investigated the protein composition of the separated EV populations by proteomic analysis. We could identify a total of 206 proteins with 1% FDR. The label-free quantitative investigation indicated that the largest fraction of the protein content originated from granules of neutrophils, whereby azurophilic and specific granules were more abundantly represented than gelatinase granules or secretory vesicles (()). The non-granule fraction of proteins consisted of cytoskeletal elements, cytosolic and mitochondrial proteins (Supplementary Table 1).
Figure 4. Complement receptor activation induces enrichment of granule proteins in EVs. a. Label-free quantitative analysis of granule protein presence in different EVs derived from human PMN. Analysis of one out of 2 similar experiments. b. Label-free quantitative analysis of proteomics data on typical granule proteins of sEV and aEV obtained from untreated or dasatinib pretreated human PMN. Dotted line represents sEV data as value 1; mean and individual values normalized to sEV; line represents mean ± SD. c. Representative Western blot of lactoferrin (LTF), myeloperoxidase (MPO) and actin in EVs. Representative images out of 11 or 6 independent experiments. d. Densitometric analysis of the Western blots. LTF and MPO were related to actin. Data were compared by using two-way ANOVA coupled with Tukey’s post hoc test; n = 11, 6. Level of significance is indicated by * for LTF and by # for MPO.

The ratio of granular to non-granular proteins in sEV, zEV and abzEV was around 50%. In contrast, additional stimulation of complement receptors (resulting in aEV) initiated a reproducible shift of the ratio to almost 60%. The increase of the granular fraction was mainly due to enrichment of proteins of azurophilic and specific granular origin (()). Importantly, treatment with dasatinib reduced the granule protein content of the generated EVs and diminished the proportion of proteins issued from azurophilic and specific granules to the values detected in sEVs.
We compared the amount of individual proteins in aEV released from PMN pretreated with dasatinib or only with vehicle (()). The amount of the most typical granule proteins was calculated from the label free quantitative proteomic analysis ((. With the exception of matrix metalloprotease 9, which is typically localized to gelatinase granules, all other granule proteins are enriched in aEV as compared to sEV (represented by the dotted line). Pretreatment of the cells with dasatinib decreases the prevalence in aEVs of all proteins issued from azurophilic or specific granules and in most cases the amount is reduced to the value obtained in sEVs. We investigated the enrichment of the two major granule proteins, lactoferrin (from specific granules) and myeloperoxidase (from azurophilic granules) separately, by Western blotting. Data shown in (,d) support data of the proteomic analysis.
Characterization of murine PMN derived EVs
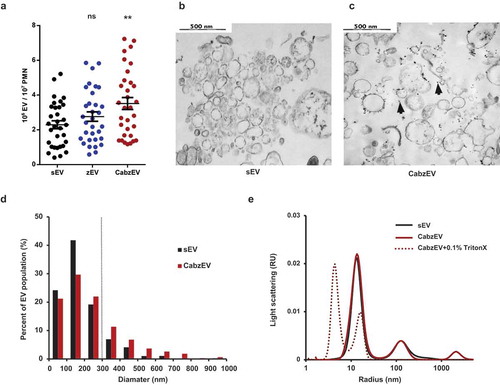
To elucidate the participation of specific molecules in EV biogenesis, we turned to a mouse model. We isolated neutrophils from bone marrows and triggered EV production. Similar to the data obtained with human PMN, non-opsonized particles initiated moderate EV-generation whereas particles fully opsonized with murine serum induced significant and consistent increase in EV production (()). Murine PMN-derived EVs were characterized by flow cytometry, electron microscopy and DLS (). They could be labelled both by annexinV and by antibodies against CD11b, CD18 and Ly6G, indicating that they are right-side out neutrophil derived vesicles. Staining intensity with annexinV or the antibodies against CD11b and CD18 was comparable but Ly6G staining was less apparent (Figure S4). Wherever it was possible, we used anti-CD11b labelling. Electron micrographs support the vesicular character of both the spontaneous and the activation induced EV populations (()) and also show the presence of lipophilic particles of 10–15 nm radius, but without distinguishable membrane and lumen structure ((), black arrowheads). Thus, EVs derived from murine PMN are smaller than their human counterparts (()), but present similar morphology in the electron micrographs. In DLS two major populations of particles were revealed (()): one with a radius of 10–15 nm and a broader one with a radius of 100–200 nm. Importantly, this population completely disappeared upon treatment with the detergent Triton X-100, confirming its vesicular nature [Citation49]. No size difference was detected between the different populations of EVs of murine neutrophils by DLS either. In the following studies on the different genetically modified mouse strains, EV production was triggered by fully opsonized particles and referred to as CabzEV (reflecting the coactivation by complement, antibody and zymosan).
Figure 5. Characterization of murine PMN derived EVs. a. Quantification of EVs produced spontaneously (sEV) and after activation with non-opsonized (zEV) or completely (CabzEV) opsonized zymosan. Data were compared to sEV using one-way ANOVA coupled with Dunnett’s post hoc test; n = 32. Representative electron microscopic images of sEV (b.) and CabzEV (c.) prepared from WT murine PMN. Original magnification is 30,000×. Representative pictures out of 3 similar experiments. d. Size distribution spectra of murine EVs based on electron microscopy images, data originate from 200 EVs pro samples. The dotted line represents the possible limit of detectability by flow cytometry. e. Size distribution spectra of EVs measured by DLS. Broken line represents 0.1% Triton X-100 treated aEV. Signal above 1000 nm is due to zymosan contamination. Representative results out of 3 independent experiments.
The complement receptor integrin Mac-1 but no Fc receptors are essential for CabzEV formation from murine neutrophils
First, we investigated the potential involvement of Fc receptors in animals lacking the common γ chain of Fc gamma receptors. This adapter molecule is required for signal transduction via all different types of activating Fc gamma receptors present on murine neutrophils [Citation28]. As shown in (), neutrophils from Fc receptor γ chain knock out-animals produced CabzEV similar to neutrophils from WT mice.
Figure 6. Mac-1/CR3 has a key role in CabzEV production in murine PMN. Comparison of sEV and CabzEV production of WT vs. FcRγ-chain KO (a.), CD18 KO (b.), and CD11b KO (c.) murine PMN. Labelling was carried out in the experiments of panels b. and c. with annexinV. Data were compared using one-way ANOVA coupled with Bonferroni’s post hoc test; n = 27, 22, 21.
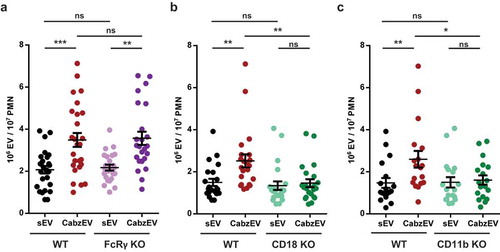
Next, we tested the potential role of neutrophil integrins in EV formation. All three integrins (Mac-1, LFA, gp150,95) identified in neutrophils are composed of the same β chain (CD18) complexed to a specific α chain [Citation31]. First, we tested neutrophils from animals deficient in the common β chain, CD18. As shown in (), genetic deletion of CD18 completely abolished CabzEV production, whereas release of sEV was not significantly altered. To decipher the participation of the three known integrins, we next investigated neutrophils from mice deficient in the specific α chain of Mac-1 (CD11b). Generation of CabzEV was decreased to a similar extent in CD11b deficient neutrophils (()) as it was observed in cells lacking CD18 (()). Thus, the integrin Mac-1, which also serves as CR3, the dominant complement receptor on neutrophils has the key role in CabzEV formation in vitro.
Mac-1 is also involved in production of activated EV in murine peritoneal cavity
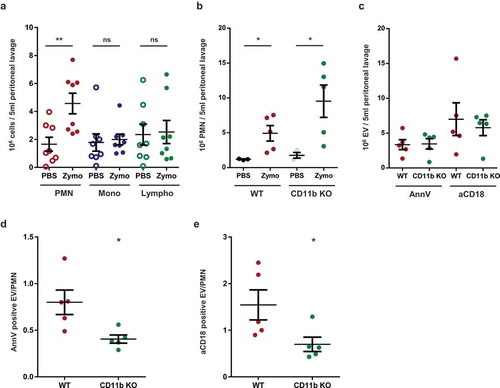
To obtain information on the in vivo relevance of our ex vivo data, we tested activated EV formation in a murine model of inflammation. Zymosan was injected intraperitoneally and cells and EVs were detected in the lavage fluid. Two hours after zymosan injection, a significant increase of the PMN number was observed in the lavage fluid, whereas the number of monocytes and lymphocytes remained unaltered (()). At a later time point (4 h) all leukocyte types were increased (not shown). Thus in the critical experiments lavage fluid was collected 2 h following zymosan injection. Next we compared the presence of neutrophils and EVs in the lavage fluid from WT and CD11b deficient animals (()). Mac-1 integrin was shown to play an important role in adherence of neutrophils to endothelial cells and other surfaces, but several previous studies reported that transvascular migration was – unexpectedly – enhanced in its absence [Citation50–Citation53]. In accordance with these findings, in the experiments presented in () migration of CD11b deficient neutrophils to the inflamed peritoneum was approximately twofold higher than the migration rate of WT cells. In the absence of CD11b, the specific α chain of Mac-1, CD18 is still expressed in complex with another α chain in LFA. CD18 was detected on neutrophils from CD11b KO mice, but its level was slightly lower than on cells from WT animals [Citation52]. In order to exclude any uncertainty due to altered CD18 expression in CD11b KO animals, we carried out the labelling of EVs harvested from the peritoneum parallel with anti-CD18 antibody or with annexinV. In (), we show both results. In spite of the higher PMN count in the peritoneum, activated EV production of CD11b deficient cells did not exceed that of WT neutrophils (()). The number of activated EVs produced per PMN upon zymosan triggering was approximately 50% lower in the CD11b-deficient animals than in the controls (()). Thus, Mac-1 seems to be implicated in activated EV generation also under in vivo conditions.
Figure 7. Mac-1/CR3 plays a crucial role in peritoneal EV production during zymosan induced peritonitis in mice. a. Absolute number of different leukocytes in the peritoneal lavage at 2 h after zymosan or PBS injection. Data were compared using paired Student’s t-test, n = 8 b. Absolute number of neutrophils in the peritoneal lavage at 2 h after zymosan or PBS injection. Data were compared using Student’s t-test; n = 5. c. Absolute number of annexinV or CD18 positive EVs in the peritoneal lavage at 2 h following zymosan injection; n = 5. AnnexinV (d.) or CD18 (e.) positive EV vs PMN ratio in the peritoneal lavage at 2 h after zymosan injection. Data were compared using Student’s t-test; n = 5.
Discussion
The presented experiments indicate the role of Mac-1/CR3 in initiating the formation of antibacterial EVs from neutrophilic granulocytes. In human neutrophils, only under conditions of costimulation of complement receptors could we observe the characteristic triad of (i) strong increase in the number and protein content of the produced EVs, (ii) reproducible enrichment of proteins issued from azurophilic and specific granules and (iii) appearance of the capability to impair bacterial growth. Similar to human neutrophils, significant increase of EV formation could be achieved upon stimulation with fully opsonized particles also in murine cells. Generation of these CabzEVs was completely blocked in the absence of either chain of the Mac-1 integrin. In contrast, stimulation of Fc receptors alone (on IC surface, ()) or in combination with PRR (in the soluble system, ()) did not result in generation of aEVs. In the murine system lack of signal transduction via Fc receptors did not affect CabzEV generation. Whereas our experiments do not formally exclude the possibility of participation of Fc receptors in triggering of aEV formation, they do not provide experimental support for it. Stimulation of unidentified PRRs did induce a slight increase in EV number, but these vesicles had no enrichment of granule proteins as compared to sEV and were devoid of antibacterial capacity; however, their costimulatory role cannot be excluded. Previous investigations showed that soluble proinflammatory mediators such as FMLF, TNFα, CXCL12 and LPS were not able to initiate aEV production either [Citation18].
Several lines of control experiments support that the antibacterial effect of aEVs can indeed be attributed to vesicles as opposed to aggregates of antibacterial proteins cosedimented with the aEVs. (i) Separation of vesicular from non-vesicular material by SEC indicated that antibacterial effect was only associated with the vesicular fraction (Figure S2f), (ii) in the aEV preparation protein content was increased only in the vesicular fraction (Figure S2e), (iii) the antibacterial effect was lost upon disruption of the vesicular structure by Triton X-100 (Figure S2g).
Neutrophils are short living cells which can die or form NETs upon stimulation [Citation43]. In control experiments, we verified that the stimulation applied in this study did not lead either to impairment of cell viability or to NET formation (Figure S3). In line with these results, the proteomic analysis indicated no or only inconsistent amount of histones in the EV preparations sedimented by centrifugation (Table S1). Last but not least the antibacterial effect of aEVs was not altered by DNAse treatment (Figure S2g) although PMA-induced NET formation was inhibited by DNAse (Figure S3g–h). All these data support that the observed impairment of bacterial growth is not the consequence of NET formation.
We applied zymosan induced peritonitis as an animal inflammation model to test the validity of our results obtained on isolated neutrophils. Only cell and EV numbers in the lavage fluid could be determined, hence factors such as adherence to the peritoneum or uptake of EVs into different cells could not be taken into account. Zymosan induces the transvascular migration of all leukocyte types, although in different time frame. We carried out peritoneal lavage two hours after zymosan injection, i.e. at a time point where neutrophils represent the dominant cell type. The poor detectability of the neutrophil-specific marker Ly6G on neutrophil-derived vesicles did not allow the unambiguous identification of the cellular origin of the harvested EVs. However, the significantly decreased proportion of EVs to PMN in the lavage fluid observed in CD11b (Mac-1) deficient animals is in agreement with our suggestion on the role of Mac-1 in enhanced release of EVs from zymosan-activated neutrophils.
It could be argued that opsonized particles represent a complex and very strong stimulus for neutrophils and it is the strength of the stimulus that alters vesicle formation similar to graded exocytosis that was shown to depend on the intensity of calcium signalling [Citation54]. In this respect, it should be considered that zymosan plus antibody opsonized particles represent as strong stimulus for superoxide production as are the fully opsonized particles (Figure S3n). Nevertheless, only fully opsonized particles induce the formation of aEV (()). Furthermore, we have investigated previously the properties of EVs triggered by the strongest, though pharmacological stimulus, phorbol-miristate-acetate (PMA) [Citation18]. The number and granule protein content of PMA-initiated EVs was lower than that of EVs triggered by opsonized particles, they did not form large aggregates with bacteria and did not significantly interfere with bacterial growth. We thus suggest that the Mac-1 initiated signalling pathway represents the major factor in antibacterial EV formation.
The fact that specific receptors can be pinpointed as triggers for aEV production demonstrates that aEV formation is an active and directed cellular process as opposed to random release of particles or decomposition of cells. It should however be noted that genetic deletion of specific molecules did not affect the spontaneous production of EVs (sEV) and the applied inhibitor was also not able to decrease aEV formation below the level of sEV. Apparently, there are two parallel processes: the spontaneous, constitutive production – by hitherto unidentified mechanism – of sEVs that do not interact with bacteria. On top of this, the process initiated by Mac-1 leads to generation of a large number of aEVs enriched in proteins originating from the primary and secondary granules of neutrophils and capable of impairing bacterial growth. In our earlier studies, we presented evidence that the antibacterial capacity of the EVs triggered by opsonized particles did not depend on the increased number of the produced vesicles, but on the altered properties of aEVs [Citation18,Citation22]. In the present work, we identified Mac-1 as a dominant cell surface receptor that is involved in biogenesis of distinct EV population with altered cargo and development of antibacterial capacity.
Mac-1 has over 40 identified ligands, structurally very different molecules present on the endothelial surface, on extracellular matrix proteins, on soluble plasma proteins or even on microorganisms [Citation55]. The binding sites for the complement factor C3bi, fibrinogen, neutrophil inhibitory factor, GPIbα and CD40L have been mapped in the ligand-binding I-domain of the LM chain. The binding sites for these ligands are overlapping but not identical and some ligands were shown to function as biased agonists [Citation55,Citation56]. Several ligands could potentially stimulate aEV production in addition to complement components. Mac-1 stimulation could thus alter the functional properties of EVs released from neutrophils under different conditions, where the involvement of the integrin has been already shown, such as adhesion, migration or phagocytosis. In fact, a previous publication [Citation14] reported that neutrophils adherent to HUVEC cells released higher number of EVs that were able to produce an elevated amount of leukotriene B4 as compared to EVs produced by suspended neutrophils. As multiple Mac-1 ligands have been described on endothelial cells [Citation56], adhesion of neutrophils to HUVEC cells could possibly involve Mac-1 activation. Potential antibacterial effect was not investigated in that study.
On the basis of our data we raise the concept that EVs are “tailor-made” whereby their cargo and functional properties are adapted to the prevailing conditions of the environment. In the presented case the primary event is the appearance of the foreign particles – e.g. bacteria – that become opsonized and the complement receptor initiates the generation of specialized EVs endowed with the capacity to impair the growth of the invader. In our view, Mac-1 represents the first example – followed probably by many others – as a specific cell surface molecule involved in selective generation of EVs to achieve optimal cellular responses to environmental cues.
Author contributions
Á.M.L. and E.L. conceived the study, designed experiments and prepared the manuscript, Á.M.L, B.B., D.Sz., Cs.I.T., F.K., V.Sz. carried out experiments on neutrophils, L.T. and L.D. did the proteomic analysis, Á.K. prepared electron micrographs, D.V. did the DLS measurements and consulted on statistical analysis, A.M. provided expertise on genetically modified animals.
Disclosure of interest
The authors report no conflicts of interest.
Supplemental Material
Download Zip (9.6 MB)Acknowledgments
The authors are indebted to Drs. Tamás Németh, Miklós Kovács, Zoltán Jakus, Gábor Sirokmány and Bence György for stimulating discussions and critical remarks, to Ms. Edina Simon for mouse genotyping and to Ms. Regina Tóth-Kun for expert technical assistance.
Supplementary material
Supplemental data for this article can be accessed here.
Additional information
Funding
Related Research Data
References
- Colombo M, Raposo G, Thery C. Biogenesis, secretion, and intercellular interactions of exosomes and other extracellular vesicles. Annu Rev Cell Dev Biol. 2014;30:255–17.
- Groot Kormelink T, Mol S, de Jong EC, et al. The role of extracellular vesicles when innate meets adaptive. Semin Immunopathol. 2018;40:439–452.
- Robbins PD, Morelli AE. Regulation of immune responses by extracellular vesicles. Nat Rev Immunol. 2014;14:195–208.
- Raposo G, Stoorvogel W. Extracellular vesicles: exosomes, microvesicles, and friends. J Cell Biol. 2013;200:373–383.
- Yanez-Mo M, Siljander PR, Andreu Z, et al. Biological properties of extracellular vesicles and their physiological functions. J Extracell Vesicles. 2015;4:27066.
- Gyorgy B, Szabo TG, Pasztoi M, et al. Membrane vesicles, current state-of-the-art: emerging role of extracellular vesicles. Cell Mol Life Sci. 2011b;68:2667–2688.
- Kowal J, Arras G, Colombo M, et al. Proteomic comparison defines novel markers to characterize heterogeneous populations of extracellular vesicle subtypes. Proc Natl Acad Sci U S A. 2016;113:E968–977.
- Hessvik NP, Llorente A. Current knowledge on exosome biogenesis and release. Cell Mol Life Sci. 2018;75:193–208.
- Kowal J, Tkach M, Thery C. Biogenesis and secretion of exosomes. Curr Opin Cell Biol. 2014;29:116–125.
- Sedgwick AE, D’Souza-Schorey C. The biology of extracellular microvesicles. Traffic. 2018;19:319–327.
- Nolte-’t Hoen EN, van der Vlist EJ, de Boer-brouwer M, et al. Dynamics of dendritic cell-derived vesicles: high-resolution flow cytometric analysis of extracellular vesicle quantity and quality. J Leukoc Biol. 2013;93:395–402.
- Groot Kormelink T, Arkesteijn GJ, van de Lest CH, et al. Mast cell degranulation is accompanied by the release of a selective subset of extracellular vesicles that contain mast cell-specific proteases. J Immunol. 2016;197:3382–3392.
- van der Vlist EJ, Arkesteijn GJ, van de Lest CH, et al. CD4(+) T cell activation promotes the differential release of distinct populations of nanosized vesicles. J Extracell Vesicles. 2012;1:18364.
- Dalli J, Montero-Melendez T, Norling LV, et al. Heterogeneity in neutrophil microparticles reveals distinct proteome and functional properties. Mol Cell Proteomics. 2013;12:2205–2219.
- Taguchi K, Hida M, Narimatsu H, et al. Glucose and angiotensin II-derived endothelial extracellular vesicles regulate endothelial dysfunction via ERK1/2 activation. Pflugers Arch. 2017;469:293–302.
- Martin KR, Kantari-Mimoun C, Yin M, et al. Proteinase 3 is a phosphatidylserine-binding protein that affects the production and function of microvesicles. J Biol Chem. 2016;291:10476–10489.
- Lorincz AM, Szeifert V, Bartos B, et al. New flow cytometry-based method for the assessment of the antibacterial effect of immune cells and subcellular particles. J Leukoc Biol. 2018;103:955–963.
- Timar CI, Lorincz AM, Csepanyi-Komi R, et al. Antibacterial effect of microvesicles released from human neutrophilic granulocytes. Blood. 2013a;121:510–518.
- Oehmcke S, Westman J, Malmstrom J, et al. A novel role for pro-coagulant microvesicles in the early host defense against streptococcus pyogenes. PLoS Pathog. 2013;9:e1003529.
- Nieuwland R, Berckmans RJ, McGregor S, et al. Cellular origin and procoagulant properties of microparticles in meningococcal sepsis. Blood. 2000;95:930–935.
- Herrmann IK, Bertazzo S, O’Callaghan DJ, et al. Differentiating sepsis from non-infectious systemic inflammation based on microvesicle-bacteria aggregation. Nanoscale. 2015;7:13511–13520.
- Lorincz AM, Schutte M, Timar CI, et al. Functionally and morphologically distinct populations of extracellular vesicles produced by human neutrophilic granulocytes. J Leukoc Biol. 2015;98:583–589.
- Scharffetter-Kochanek K, Lu H, Norman K, et al. Spontaneous skin ulceration and defective T cell function in CD18 null mice. J Exp Med. 1998;188:119–131.
- Mocsai A, Humphrey MB, Van Ziffle JA, et al. The immunomodulatory adapter proteins DAP12 and Fc receptor gamma-chain (FcRgamma) regulate development of functional osteoclasts through the Syk tyrosine kinase. Proc Natl Acad Sci U S A. 2004;101:6158–6163.
- Jakus Z, Simon E, Balazs B, et al. Genetic deficiency of Syk protects mice from autoantibody-induced arthritis. Arthritis Rheum. 2010;62:1899–1910.
- Lorincz AM, Timar CI, Marosvari KA, et al. Effect of storage on physical and functional properties of extracellular vesicles derived from neutrophilic granulocytes. J Extracell Vesicles. 2014;3:25465.
- Schneider AE, Sandor N, Karpati E, et al. Complement factor H modulates the activation of human neutrophil granulocytes and the generation of neutrophil extracellular traps. Mol Immunol. 2016;72:37–48.
- Jakus Z, Nemeth T, Verbeek JS, et al. Critical but overlapping role of FcgammaRIII and FcgammaRIV in activation of murine neutrophils by immobilized immune complexes. J Immunol. 2008;180:618–629.
- Rada BK, Geiszt M, Kaldi K, et al. Dual role of phagocytic NADPH oxidase in bacterial killing. Blood. 2004;104:2947–2953.
- Karmakar M, Katsnelson M, Malak HA, et al. Neutrophil IL-1beta processing induced by pneumolysin is mediated by the NLRP3/ASC inflammasome and caspase-1 activation and is dependent on K+ efflux. J Immunol. 2015;194:1763–1775.
- Sanchez-Madrid F, Nagy JA, Robbins E, et al. A human leukocyte differentiation antigen family with distinct alpha-subunits and a common beta-subunit: the lymphocyte function-associated antigen (LFA-1), the C3bi complement receptor (OKM1/Mac-1), and the p150,95 molecule. J Exp Med. 1983a;158:1785–1803.
- Sanchez-Madrid F, Simon P, Thompson S, et al. Mapping of antigenic and functional epitopes on the alpha- and beta-subunits of two related mouse glycoproteins involved in cell interactions, LFA-1 and Mac-1. J Exp Med. 1983b;158:586–602.
- Trowbridge IS, Omary MB. Molecular complexity of leukocyte surface glycoproteins related to the macrophage differentiation antigen Mac-1. J Exp Med. 1981;154:1517–1524.
- Fleming TJ, Fleming ML, Malek TR. Selective expression of Ly-6G on myeloid lineage cells in mouse bone marrow. RB6-8C5 mAb to granulocyte-differentiation antigen (Gr-1) detects members of the Ly-6 family. J Iimmunol. 1993;151:2399–2408.
- van der Pol E, van Gemert MJ, Sturk A, et al. Single vs. swarm detection of microparticles and exosomes by flow cytometry. J Thromb Haemost. 2012;10:919–930.
- Thery C, Witwer KW, Aikawa E, et al. Minimal information for studies of extracellular vesicles 2018 (MISEV2018): a position statement of the international society for extracellular vesicles and update of the MISEV2014 guidelines. J Extracell Vesicles. 2018;7:1535750.
- Monguio-Tortajada M, Moron-Font M, Gamez-Valero A, et al. Extracellular-vesicle isolation from different biological fluids by size-exclusion chromatography. Curr Protoc Stem Cell Biol. 2019;49:e82.
- Schneider CA, Rasband WS, Eliceiri KW. NIH Image to ImageJ: 25 years of image analysis. Nat Methods. 2012;9:671–675.
- Petheo GL, Orient A, Barath M, et al. Molecular and functional characterization of Hv1 proton channel in human granulocytes. PloS One. 2010;5:e14081.
- Turiak L, Misjak P, Szabo TG, et al. Proteomic characterization of thymocyte-derived microvesicles and apoptotic bodies in BALB/c mice. J Proteomics. 2011;74:2025–2033.
- Benito-Martin A, Peinado H. FunRich proteomics software analysis, let the fun begin! Proteomics. 2015;15:2555–2556.
- Cox J, Mann M. MaxQuant enables high peptide identification rates, individualized p.p.b.-range mass accuracies and proteome-wide protein quantification. Nat Biotechnol. 2008;26:1367–1372.
- Timar CI, Lorincz AM, Ligeti E. Changing world of neutrophils. Pflugers Arch. 2013b;465:1521–1533.
- Erdei A, Lukacsi S, Macsik-Valent B, et al. Non-identical twins: different faces of CR3 and CR4 in myeloid and lymphoid cells of mice and men. Semin Cell Dev Biol. 2019;85:110–121.
- Futosi K, Fodor S, Mocsai A. Neutrophil cell surface receptors and their intracellular signal transduction pathways. Int Immunopharmacol. 2013;17:638–650.
- Myones BL, Dalzell JG, Hogg N, et al. Neutrophil and monocyte cell surface p150,95 has iC3b-receptor (CR4) activity resembling CR3. J Clin Invest. 1988;82:640–651.
- Mocsai A, Ruland J, Tybulewicz VL. The SYK tyrosine kinase: a crucial player in diverse biological functions. Nat Rev Immunol. 2010;10:387–402.
- Futosi K, Nemeth T, Pick R, et al. Dasatinib inhibits proinflammatory functions of mature human neutrophils. Blood. 2012;119:4981–4991.
- Gyorgy B, Modos K, Pallinger E, et al. Detection and isolation of cell-derived microparticles are compromised by protein complexes resulting from shared biophysical parameters. Blood. 2011a;117:e39–48.
- Ding ZM, Babensee JE, Simon SI, et al. Relative contribution of LFA-1 and Mac-1 to neutrophil adhesion and migration. J Immunol. 1999;163:5029–5038.
- Li X, Utomo A, Cullere X, et al. The beta-glucan receptor Dectin-1 activates the integrin Mac-1 in neutrophils via Vav protein signaling to promote Candida albicans clearance. Cell Host Microbe. 2011;10:603–615.
- Lu H, Smith CW, Perrard J, et al. LFA-1 is sufficient in mediating neutrophil emigration in Mac-1-deficient mice. J Clin Invest. 1997;99:1340–1350.
- Prince JE, Brayton CF, Fossett MC, et al. The differential roles of LFA-1 and Mac-1 in host defense against systemic infection with Streptococcus pneumoniae. J Immunol. 2001;166:7362–7369.
- Sengelov H, Kjeldsen L, Borregaard N. Control of exocytosis in early neutrophil activation. J Immunol. 1993;150:1535–1543.
- Simon DI. Opening the field of integrin biology to “biased agonism”. Circ Res. 2011;109:1199–1201.
- Wolf D, Anto-Michel N, Blankenbach H, et al. A ligand-specific blockade of the integrin Mac-1 selectively targets pathologic inflammation while maintaining protective host-defense. Nat Commun. 2018;9:525.