
ABSTRACT
Rapid identification of patients suffering from cerebral ischaemia, while excluding intracerebral haemorrhage, can assist with patient triage and expand patient access to chemical and mechanical revascularization. We sought to identify blood-based, extracellular microRNAs 15 (ex-miRNAs) derived from extracellular vesicles associated with major stroke subtypes using clinical samples from subjects with spontaneous intraparenchymal haemorrhage (IPH), aneurysmal subarachnoid haemorrhage (SAH) and ischaemic stroke due to cerebral vessel occlusion. We collected blood from patients presenting with IPH (n = 19), SAH (n = 17) and ischaemic stroke (n = 21). We isolated extracellular vesicles from plasma, extracted RNA cargo, 20 sequenced the small RNAs and performed bioinformatic analyses to identify ex-miRNA biomarkers predictive of the stroke subtypes. Sixty-seven miRNAs were significantly variant across the stroke subtypes. A subset of exmiRNAs differed between haemorrhagic and ischaemic strokes, and LASSO analysis could distinguish SAH from the other subtypes with an accuracy of 0.972 ± 0.002. Further analyses predicted 25 miRNA classifiers that stratify IPH from ischaemic stroke with an accuracy of 0.811 ± 0.004 and distinguish haemorrhagic from ischaemic stroke with an accuracy of 0.813 ± 0.003. Blood-based, ex-miRNAs have predictive value, and could be capable of distinguishing between major stroke subtypes with refinement and validation. Such a biomarker could one day aid in the triage of patients to expand the pool eligible for effective treatment.
Introduction
Brain injury resulting from stroke is the leading cause of morbidity in the USA and despite significant efforts the development of neuroprotectants against stroke has largely failed [Citation1]. The only efficacious treatment for ischaemic stroke is revascularization using clot-busting agents such as tissue plasminogen activator (tPA) [Citation2,Citation3], or endovascular mechanical thrombectomy for patients with proximal large vessel occlusions [Citation4–Citation6]. Haemorrhagic stroke represents a subset of stroke cases (~15%), yet can greatly confound stroke care as it is an absolute contraindication for the administration of chemical thrombolytics. The time required for diagnosis, triage and workup often results in delay in the administration of tPA, or missing the therapeutic window of an efficacious treatment altogether. While medical imaging remains the gold-standard for stroke diagnosis and management and these modalities are largely accurate and effective; there remain inherent limitations of these techniques around cost, length of procedure, varied interpretation, challenges to imaging certain brain regions (e.g. cerebellum and brainstem) and most importantly the lack of availability in prehospital settings [Citation7]. In theory, a blood-based biomarker that could rapidly discriminate between stroke subtypes would be clinically valuable, and open the future development of a point-of-care (POC) tool, broadening access to effective therapeutics.
More than 10 years ago, it was recognized that RNAs were contained within and could be shuttled between cells in extracellular vesicles, such as exosomes [Citation8,Citation9]. Extracellular RNAs (ex-RNAs) are typically carried within vesicles or associated with RNA-binding proteins or lipoproteins [Citation10,Citation11]. After discovery of RNA within extracellular vesicles, the detection and expression of these circulating RNA species were correlated with different disease subtypes as well as disease progression [Citation12–Citation14]. These ex-RNAs can be taken up by cells, functionally regulate cellular processes and impact tissue microenvironments[Citation9,Citation15]. The detection of miRNAs in circulation has been associated with a host of CNS diseases including neurogenerative diseases and brain cancer, making them attractive biomarkers for inaccessible tissues and disease regions [Citation16]. The abundance and stability of circulating miRNAs, due to inherent structure and packaging within vesicles, makes them even more ideal candidates for biomarker discovery and development. Our lab showed in a recent study of Alzheimer’s and Parkinson’s disease patients, detectable ex-miRNA changes in blood were found to be associated with disease pathology [Citation17]. Extracellular RNA expression levels can change rapidly and have enough discriminative power to act as sensitive biomarkers in a short time period.
There have been a number of studies to examine differentially expressed miRNAs associated with intracerebral haemorrhage or ischaemic stroke in blood samples, using microarrays or qRT-PCR [Citation18–Citation23], or sequencing [Citation24,Citation25]. Most studies were restricted to the probes used for arrays or qRT-PCR-based assessments, compared stroke to control, lacked classification accuracy and used small patient cohorts. Both animal and human studies have identified specific miRNAs associated with ischaemic stroke [Citation26]. Leung et al. showed that miR-124-3p was elevated in haemorrhagic strokes compared to ischaemia [Citation21]. Not only are miRNAs being used in diagnostic settings, but also being explored as therapeutic targets. In animal models, miRNAs associated with ischaemic stroke are being targeted by therapeutic antagomirs [Citation27]. To date, no studies have employed next-generation sequencing to comprehensively profile miRNAs expressed in extracellular vesicles across clinically relevant stroke subtypes to provide improved molecular classifiers.
Herein we demonstrate the efficacy of plasma-derived ex-miRNAs to serve as potential biomarkers that allow for differentiation between major stroke subtypes; intraparenchymal haemorrhage (IPH), subarachnoid haemorrhage (SAH) and ischaemic stroke. These data serve as an initial comparison of these stroke types, as well as a miRNA catalogue collected from extracellular vesicles for future studies involving these stroke subtypes.
Methods
Anonymized data and materials have been made publicly available at the NCATS Extracellular RNA Communications Consortium’s exRNA Atlas (exRNA-atlas.org).
Patient sample collection
This study was approved by the institutional review boards of St. Joseph’s Hospital and Medical Centre (13BN094) and WIRB (#20120512). All patients or their surrogates provided written informed consent for participation in this study. Some study subjects did not consent to providing the raw genetic information in a public database. All aggregated sequencing data, including counts for individual RNAs, can be found at accession #EXR-KJENS10lPClY-AN (exrna-atlas.org). All procedures followed were in accordance with institutional guidelines.
All patients were evaluated by a neurosurgeon, a neurologist, or both, and underwent complete neurological examination (including assignment of the National Institute of Health Stroke Scale score, intracerebral haemorrhage score, Hunt and Hess and Fisher scores), vascular imaging (using computed tomographic angiography) and magnetic resonance imaging studies with diffusion-weighted sequences. All imaging studies were evaluated by an independent neuro-radiologist to characterize stroke subtypes as ischaemic, SAH or spontaneous IPH. Patient characteristics are provided in . Basic demographic data, as well as information on participants’ current medications, laboratory tests, family, social and medical and surgical histories were collected. Daily physical examinations were conducted and standard-of-care followed for all subjects.
Table 1. Clinical characteristics across stroke subtypes.
Blood (6-8 ml) was collected in EDTA tubes as recommended by MISEV [Citation28,Citation29] from subjects with ischaemic and haemorrhagic strokes (21 ischaemic strokes, 17 aneurysmal SAH and 19 spontaneous IPHs without underlying vascular malformation) upon admission and within 24 h of last known normal. Blood samples were processed within 4 h of collection, spun for 10 min at 706 rcf at 4°C in an eppendorf 5804 R centrifuge using an A-4-44 rotor to remove cells and debris. The supernatant (plasma) was collected, and stored in 1 mL aliquots at – 80°C for RNA isolation and sequencing.
Extracellular vesicle collection and RNA isolation
Once all samples were collected, they were processed simultaneously to eliminate batch effect variability due to sample preparation and sequencing. Extracellular vesicles were isolated from the plasma samples using the exoRNeasy Serum/Plasma kit from Qiagen, which has been shown to have high yield and reproducibility [Citation30,Citation31]. A total of 10 ng of isolated RNA was prepared for sequencing using the Illumina TruSeq Kit [Citation32,Citation33]. We followed the protocol in the Qiagen exoRNeasy Serum/Plasma kit (Cat No./ID: 77044) to capture extracellular vesicles on an affinity membrane, and then to lyse the vesicles and isolate the extracellular RNA. Briefly, 1 mL plasma samples were thawed at room temperature and centrifuged at 3000 ×g for 5 min at 4°C to remove debris. Samples were then applied to the column following the manufacturer instructions.
RNA quantification
RNA was quantified in triplicate using Quant-iT Ribogreen RNA Assay kit, Low-Range protocol (R11490; ThermoFisher). A total of 10 ng of RNA from each sample was used for small RNA library preparation for sequencing.
Library preparation and sequencing
Library construction for sequencing was performed as previously described [Citation17,Citation33]. Briefly, we used the TruSeq small RNA sample preparation kit (RS-200-0048; Illumina) with half the reaction volume and reagents. RNA adaptors (3′ and 5ʹ) are specifically ligated to small RNAs, and the resulting construct is reverse transcribed. The construct is then enriched by PCR (16 cycles) during which a unique barcode was added to the sequence. The libraries were then run on a 6% TBE Gel for 55 min at 140 V and the product between 140 to 160 bp were excised from the gels. These gel pieces were fractured into smaller pieces and allowed to incubate on a rotator overnight in water. An ethanol precipitation was performed to precipitate the RNA and the resulting pellet of RNA was resuspended in 11 ul of ultra-pure water. Samples were quantified with the Agilent High Sensitivity DNA Kit (5067–4626; Agilent). The peak for the sample was integrated from 120 bp to 160 bp to get the pMolarity. Samples with similar pMolarity were grouped on the same lane and pooled together to create a total of 8 unique pools containing 15 samples with different barcodes. These pools were then quantified with the Agilent High Sensitivity DNA Kit to get the final pMolarity for the pool. The pools were then denatured and clustered on a single read Illumina V3 flowcell (GD-401-3001; Illumina). Illumina HiSeq 2500 next-generation sequencing platform was used for all sequencing experiments. All samples were sequenced to approximately the same depth/number of reads so that quantitative comparisons can be made between samples.
RNA-sequencing data analysis
The raw sequence image files from the Illumina HiSeq in the form of .bcl were converted to the fastq format using bcltofastq v. 2.19.1.403 and checked for quality to ensure the quality scores did not deteriorate at the read ends. The TruSeq adapters from the 3′ end were clipped using cutadapt v.1.14. Reads shorter than 15 nts were discarded and after adapter trimming, the 3′ bases below a quality score of 30 were also trimmed.
The reads are first mapped to a library of UniVec contaminants, a collection of common vector, adapter, linker and PCR primer sequences collated by the NCBI. They are then mapped to human rRNA sequences obtained from NCBI. The reads are mapped to the rRNA and UniVec sequences using Bowtie2, reads that map are removed from the analysis. The alignment to the human genome and transcriptome takes place in two stages. First, the rRNA and UniVec free reads are mapped to the human genome (hg19) using STAR. The reads that map to the genome are then mapped to the human transcriptome. The reads that are not mapped to the human genome are also mapped to the human transcriptome. The library for the human transcriptome was built by concatenating miRNAs and hairpins from miRBase 21, tRNAs from gtRNAdb, piRNAs from piRBase v1.0, protein-coding, non-coding and other RNA sequences (such as antisense and pseudogenes) from ENSEMBL 75. The STAR alignment was performed end-to-end with no mismatch allowed while mapping and each read is allowed to multimap to at most 40 RNA annotations.
Differential expression analysis
Differential expression was conducted using the DESeq2 package (version 1.20.0) in R (version 3.5.0) for all miRNAs that had expression levels >25 read counts in at least 50% of samples in one of the groups [Citation34]. The raw read counts for the samples were normalized with miRNA raw counts using the median ratio method (default in DESeq2). The top 20 most significant differentially expressed ex-miRNAs (by Benjamini-Hochberg adjusted p-value < 0.05) are reported in the paper, the full table can be found as Supplemental Table 1.
Classification analysis by L1-penalized regression analysis (LASSO)
Lasso is a regularized linear model with L1-penalty to control the complexity of the model, thus reducing the risk of over-fitting the training data [Citation35]. Lasso analysis was performed using the normalized counts for miRNA from DESeq2. Following differential expression analysis, miRNAs with unadjusted p-values < 0.05 between sample groups (see above) were used in the glmnet package (version 2.0.16) in R. A series of loops were implemented to (1) identify the optimal lamda value for lasso model, (2) select the best lasso model and (3) estimate performance metrics (for example, prediction accuracy and AUC) for the selected model (Supplemental Figure 1). In the first loop, we performed a series of 1000 iterations of cv.glmnet using random 80/20 training/test set splits. For each iteration the predict() function was used to calculate the accuracy for predicting the test set and the lambda.min that corresponded to the iteration with the highest accuracy, and was subsequently selected as the optimal lambda value for our model. In the second loop, we performed a series of 1000 iterations of glmnet using random 80/20 training/test set splits, but with a constant lambda, to determine our best lasso model (the miRNAs found to be most important in the iterations with the best predictive value). The iteration with the highest accuracy was called our best lasso model and the ex-miRNA feature set corresponding to this model was selected for classification. In the third and the last loop, we performed a final series of 1000 iterations of glmnet using random 80/20 training/test set splits, but kept the lambda and miRNA feature set constant. This allowed average accuracy to be calculated from the average prediction accuracy of the test sets of the 1000 iterations, as the samples contained in the training/test sets were randomly selected. AUCs were determined from cv.glmnet() using type.measure = ”auc” using the best lasso model.
Results
We collected samples from subjects suffering from haemorrhagic stroke SAH (n = 17) or IPH (n = 19) or ischaemic stroke (stroke, n = 21). Samples were collected at the time of admission to the emergency room. Samples were processed to plasma within 4 h of the event and stored for future evaluation. Clinical characteristics by stroke subtype can be found in . While age did not statistically differ between groups, the SAH subgroup consisted of ~75% female, consistent with published reports of the more common occurrence of SAH in females [Citation36], whereas the other stroke subtypes were close to a 50:50 male to female ratio.
Several papers have already examined miRNAs associated with stroke [Citation19], and in this work we focused on the discriminative power of ex-miRNA derived from extracellular vesicles with specific stroke subtypes. There are many ways in which we could isolate exRNA from our samples. For these clinical samples, our goal was to identify a robust and reproducible miRNA signal that could have potential diagnostic value. We chose to isolate exRNA from plasma samples using the Qiagen exoRNeasy kit. This kit uses a membrane-affinity capture for extracellular vesicle isolation first, and then uses phenol/guanidine-based lysis and silica-membrane based RNA purification [Citation37]. We chose to use this kit for several reasons: (1) the first CLIA-validated extracellular vesicle-based liquid biopsy test, ExoDx™ Lung (ALK), uses exoRNeasy for RNA isolation from plasma, (2) in a recent large multi-site assessment of ex-RNA isolation methods in plasma [Citation31], investigators found that the exoRNeasy kit had the highest reproducibility in replicates across multiple labs, suggesting that the technical protocol is easily replicated and (3) in a study testing several different extracellular vesicle isolation kits on serum samples, they also reported the highest and most uniform yield to come from the exoRNeasy kit [Citation38]. Reproducible results with low variability were important criteria for us to consider in our sample isolations, therefore, we also compared data from the exoRNeasy kit to cell-free RNA isolations in our samples (). We compared the sequencing results from plasma samples isolated using the exoRNeasy kit and using cell-free total RNA with miRVana. In total, 20 plasma samples from subjects with a SAH were used for the testing; 10 plasma samples were isolated using the exoRNeasy kit and 10 plasma samples were isolated using cell-free total RNA with miRVana. Previous experiments comparing cell-free RNA isolation methods in our laboratory found that miRVana provided us with high yield RNA isolations from biofluids [Citation39,Citation40].
Figure 1. Comparison of cell-free and exoRNeasy RNA isolation on miRNA detection and variability. The number of miRNA detected is higher in the samples isolated using exoRNeasy (a) and the coefficient of variation for miRNAs across the 10 samples is lower (b).
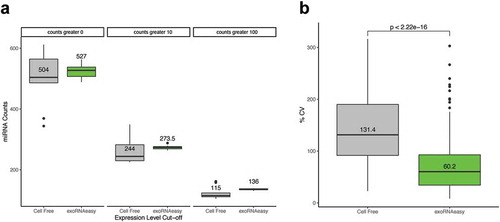
We found that when comparing the sequencing results from total cell-free RNA to RNA isolated using exoRNeasy for these 20 samples, there was an increased number of miRNA detected ()) and a reduced coefficient of variation of detected miRNAs across samples isolated by exoRNeasy ()). The exoRNeasy kit is currently used in clinical testing, was found to be less variable across multiple users and sites in other studies, and had less variability and yielded a higher diversity of miRNA in our samples, we proceeded with using this kit for our plasma isolations.
The total usable reads (defined as reads mapping to the transcriptome) were as follows across the groups: ischaemic stroke (12,219,438 median, 9,747,058 IQR), SAH (8,214,214 median, 5,806,412 IQR), and IPH (9,438,557 median, 3,779,541 IQR). Supplemental Table 1 shows a more detailed sequencing metrics per stroke subtype and Supplemental Figure 2 shows the range of small RNA lengths detected in the study. Ex-miRNAs were included for further analyses if expressed at more than 25 counts in at least 50% of samples of any stroke subgroup. A total of 243 miRNAs were detected at this stringent cut-off, with 214, 207, and 240 miRNAs detected in IPH, SAH and ischaemic stroke, respectively.
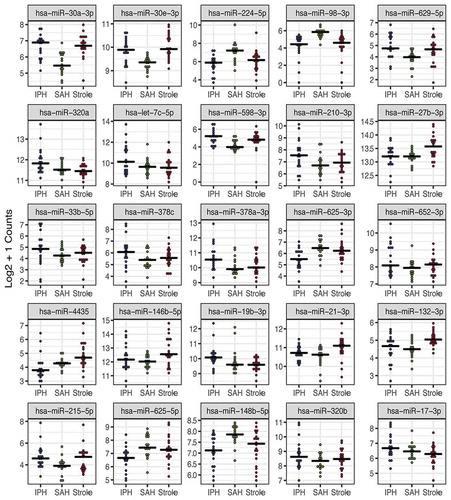
We first identified differentially expressed ex-miRNAs between each of the stroke types using the Likelihood Ratio Test [Citation34]. In , we show the top 25 miRNAs by smallest adjusted p-value that differ between the three stroke groups. A total of 67 miRNAs were found to be significantly different across the stroke subtypes, and the full list can be found in Supplemental Table 2.
Figure 2. Extracellular miRNAs are differentially expressed across three stroke subtypes. The top 25 ex-miRNAs by likelihood ratio test are displayed. Only miRNAs with expression levels >25 counts in at least 50% of one subgroup were included in the analysis. Each dot represents the mean count for the given miRNA in designated stroke subgroup (IPH-blue, SAH-green and ischaemic stroke-red).
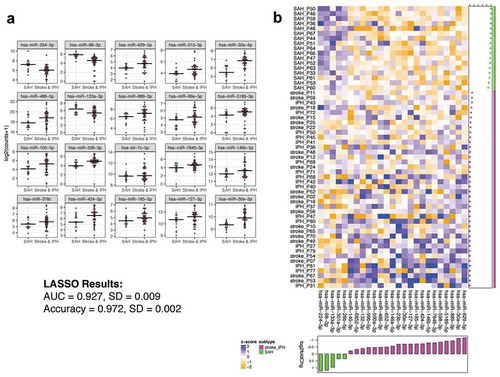
In the 25 miRNAs with the largest fold change, SAH tended to be the most divergent subgroup. The clinical presentation of SAH is distinct from ischaemic stroke and IPH, which more often have lateralizing signs upon presentation. We therefore sought to identify ex-miRNAs that best distinguished SAH from IPH and ischaemic strokes combined, as both the phenotype and data from suggested a measurable difference. ) depicts the 20 miRNAs (16 of which remain statistically significant with multiple comparison adjustment) that most distinguish SAH from the other two stroke subtypes combined (IPH and ischaemic stroke) by lowest p-value. The full list of miRNAs differentially expressed between SAH and IPH + ischaemic stroke can be found in Supplemental Table 3. Employing the differentially expressed miRNAs, LASSO analysis predicted a 25-miRNA classifier with an AUC 0.927 ± 0.009 (standard error of the mean) and accuracy of 0.972 ± 0.002 ()) for discriminating SAH from the other stroke subtypes. We also determined the ex-miRNAs that best distinguished SAH from IPH (Supplemental Table 4) and ischaemic stroke (Supplemental Table 5), respectively. Supplemental Figure 3 depicts the 20 miRNAs that best distinguish SAH from IPH (a total of 68 ex-miRNAs were significant by adjusted p-value), and Supplemental Figure 4 depicts the 20 miRNAs that best distinguish SAH from ischaemic stroke (a total of 52 ex-miRNAs were significant by adjusted p-value). LASSO analyses predicted a 24-miRNA classifier with an AUC of 0.977 and accuracy of 0.944 (Supplemental Figure 3) and 21-miRNA classifier (AUC of 0.895 and accuracy of 0.968 (Supplemental Figure 4) for discriminating SAH from IPH and ischaemic stroke, respectively. We also compared the miRNA data to LASSO results employing tRNA fragments or Gencode. The miRNA consistently produced classifiers with better discriminative power in this dataset (Supplemental Table 6), and thus we focused on the miRNA.
Figure 3. Ex-miRNAs can accurately distinguish SAH from other stroke subgroups. (a) The top 20 miRNAs by lowest p-value are shown in the dot-plots. Dots represent mean counts for the given miRNA per patient across the stroke subgroups. Statistical significance was determined by DESeq 2 with Benjamini–Hochberg method employed to adjust for multiple comparisons. (b) The heatmap depicts the ex-miRNAs selected by LASSO analysis with best discriminatory power. The graph below the heatmap displays the direction of regulation of the miRNA selected by LASSO.
As SAH is more common in women than men, we sought to determine the impact of sex on ex-miRNA expression. We compared men (n = 20) and women (n = 20) in terms of ex-miRNAs. Only six ex-miRNAs were significantly different by adjusted p-value (Supplemental Table 7) between men and women, and none of those were found differentially expressed between SAH and any other stroke subtype.
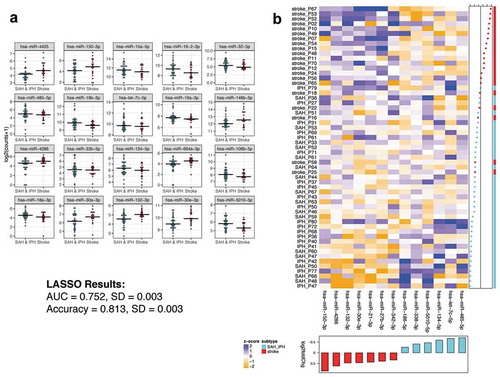
We next sought to determine ex-miRNAs that could distinguish between ischaemic and haemorrhagic strokes, a critical distinction for therapeutic decision-making [Citation3]. The top 20 differential ex-miRNAs ()) by lowest p-value between ischaemic stroke patients and those with either SAH or IPH were determined. The full list of differential miRNAs can be found in Supplemental Table 8. Again, employing those ex-miRNAs found to be differentially expressed between the ischaemic and haemorrhagic stroke patients, LASSO analysis determined the best classifier to distinguish the groups. ) shows a heat map with a 13 ex-miRNA classifier, determined by LASSO, that distinguishes ischaemic from haemorrhagic stroke with an AUC 0.752 ± 0.003 and accuracy of 0.813 ± 0.003. Thus, while only one ex-miRNA in this comparison was significant after adjusting for multiple comparisons, the LASSO analysis still identified a classifier with better than 80% accuracy.
Figure 4. Ex-miRNAs can distinguish ischaemic from haemorrhagic stroke types. (a) The top 20 miRNAs by lowest p-value are shown in the dot-plots. Dots represent mean counts for the given miRNA per patient across the stroke subgroups. Statistical significance was determined by DESeq2 with Benjamini–Hochberg method employed to adjust for multiple comparisons. (b) The heatmap depicts the ex-miRNAs selected by LASSO analysis with best discriminatory power. The graph below the heatmap displays the direction of regulation of the miRNA selected by LASSO.
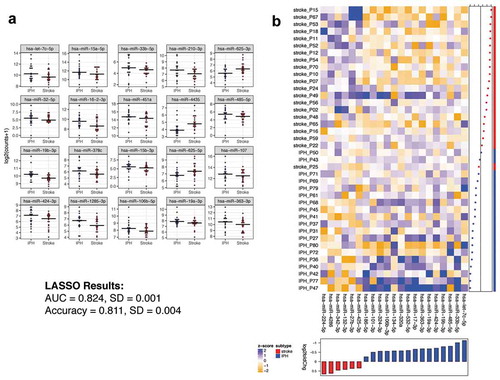
An unmet clinical need is the ability to accurately distinguish whether a stroke is IPH or ischaemic due to the difference in therapeutic options. As such, we compared those ex-miRNAs significantly different between these stroke subgroups. ) shows the top 20 differentially expressed ex-miRNAs by smallest p-value. The complete list of differential miRNAs between these groups is shown in Supplemental Table 9. The differentially expressed miRNAs between IPH and ischaemic stroke were then used to determine an optimal classifier with LASSO. The LASSO analysis determined a 21 ex-miRNA classifier with an AUC of 0.824 ± 0.001 and accuracy of 0.811 ± 0.004 ()). Again, while individual miRNAs tended to lose statistical significance post adjusting for multiple comparisons, a LASSO classifier discriminated the subtypes with 81% accuracy.
Figure 5. Ex-miRNAs can distinguish IPH from ischaemic stroke. (a) The top 20 miRNAs by lowest p-value are shown in the dot-plots. Dots represent mean counts for the given miRNA per patient across the stroke subgroups. Statistical significance was determined by DESeq2 with Benjamini-Hochberg method employed to adjust for multiple comparisons. (b) The heatmap depicts the ex-miRNAs selected by LASSO analysis with best discriminatory power. The graph below the heatmap displays the direction of regulation of the miRNA selected by LASSO.
Discussion
The rapid and accurate diagnosis of stroke subtype directly impacts the administration of effective therapeutics such as tPA and mechanical revascularization. A major challenge in caring for patients suffering from stroke is arriving at a timely and correct diagnosis of ischaemic versus haemorrhagic stroke so that patients with vascular occlusion may be revascularized. Despite the accuracy of medical imaging to diagnose and manage stroke, limitations remain around cost, variability in interpretation and a lack of access outside of hospitals. While mobile stroke units and portable imaging can improve time to diagnosis and therapeutic delivery, these options are costly and impractical to date in rural areas. As such, there is an unmet need to develop biomarkers that could rapidly distinguish stroke subtypes towards therapeutic decision-making.
In this work we demonstrate the potential utility of extracellular miRNAs derived from extracellular vesicles to distinguish between stroke subtypes. Differences between ischaemic and haemorrhagic strokes can be accurately depicted by ex-miRNAs, and difficult to discern phenotypes such as ischaemic stroke versus IPH can be stratified by a set of ex-miRNAs at an AUC of 0.824 and accuracy of 0.811. However, this level of sensitivity still requires improvement in order to be clinically actionable. We need a larger cohort of subjects from which we will continue to sequence the RNA cargo, to discover and validate miRNA, as well as other RNA fragments and biotypes that may provide additional detail and accuracy to the signal.
A number of miRNAs have been associated with stokes and stroke subtypes [Citation19]. Our analysis showed elevated expression of miR-27b-3p in ischaemic stroke compared to haemorrhagic stroke types. Cheng et al. previously detected miR-27b-3p at elevated levels in ischaemic stroke patients compared to controls [Citation41]. miR-146b-5p has also been shown at higher levels in ischaemic stroke patients compared to controls [Citation42], while we observed this miRNA elevated in ischaemic stroke patients compare to the SAH subtype. While several miRNAs detected in our study have been previously implicated with strokes our study determined several miRNAs not previous identified in stroke patients, and especially those capable of deciphering specific stroke subtypes. The SAH subtype was discerned from other stroke subtypes by a subset of ex-miRNAs with an AUC of 0.927 and accuracy of 0.972. As SAH is phenotypically distinct from other stroke subtypes, our data suggest a subset of circulating miRNAs associated with this type of insult. Though more difficult to distinguish, a classifier of ex-miRNAs could distinguish IPH from ischaemic stroke, a stratification with therapeutic significance. The abundance and inherent stability of circulating miRNAs make them ideal biomarkers in biofluids, such as plasma, serum, cerebrospinal fluid and saliva [Citation10].
One challenge of utilizing nucleic acids (including miRNAs) in a POC therapeutic setting is detection in small volumes without the use of time-intensive sequencing platforms. We are not advocating NGS for patient triage at this time, merely using it for classifier development, which after validation could be pursued in a POC test. New technologies are currently being developed that are poised to make POC detection feasible. Using a power-free microfluidic device, Arata et al. detected 0.5 picomolar miRNA in 0.5 uL [Citation43]. Alternative technologies in amplification, such as isothermal, paper-based or nanobead-based [Citation44], are all making the field use of miRNAs as biomarkers a realistic endeavour. Understanding those ex-miRNAs with the most discriminative power with regard to stroke subtypes and clinical outcomes will propel these innovative techniques to clinical utility.
We recognize some challenges inherent to this study. First, the clinical sample size is small per stroke subgroup. We also recognize that the timing of blood collection in relation to disease progression can introduce variability, variance we are evaluating in studies where progressive blood samples are taken from the same stroke patient. We aim to validate these findings in larger cohorts across institutions. Without external validation and using a small number of ex-miRNA features to input into LASSO, we recognize that overfitting is a possibility. We further recognize that the miRNAs detected in circulation are only a portion of the small RNA cargo in extracellular vesicles that can be detected by next-generation sequencing. Though, beyond the scope of this manuscript, we aim to determine the full RNA cargo detectable in circulation. Recently discovered RNA species such as isomiRs, piRNA, tRNA fragments, lncRNA, rRNA and Y RNA fragments have been detected in biofluids and may also be used in the stratification of disease subtypes [Citation45]. We also purposefully did not validate these findings by q-RT-PCR as the sensitivity of next-generation sequencing is often not validated by probe-based techniques, as demonstrated by Beck et al. with regard to variant calling and Sanger sequencing [Citation46]. While we chose expression thresholds that were conservative (>25 counts), RNAs with low abundance are more difficult to validate across platforms. We, and others, have demonstrated that small RNAs with high expression are reliably validated on several platforms, but as the expression levels get lower, each validation platform demonstrated weaknesses [Citation33,Citation47]. It still remains controversial, what are the appropriate normalizing RNAs for extracellular experiments [Citation48]. We will continue to identify and test validation tools for sequencing. Also, we are unable to determine the cell of origin for the EVs collected, or if the collection protocols impact EV secretion from cell types, such as platelets.
This work demonstrates the potential of ex-miRNAs derived from extracellular vesicles as biomarkers for differentiating between major stroke subtypes. The utility of this class of biomarker to differentiate between ischaemic and haemorrhagic stroke subtypes suggests that they could be developed into a POC test that can be administered in the field to assist with diagnosis and patient triage. Further clinical testing of these panels can enhance care of patients suffering from stroke.
Author Contributions
Study Design: MYSK, PN, EA, SK, KVKJ
Data Collection and Interpretation: MYSK, EA, BM, TB, KA, MH, RFS, PN, SK, KVKJ
Writing: MYSK, EA, TGW, SK, KVKJ
Figures: EA, TGW, SK, KVKJ
Declaration of Interest
KVKJ is a member of the scientific advisory board at Dyrnamix
Supplemental Material
Download MS Word (836.5 KB)Acknowledgments
We would like to thank the NCATS Extracellular RNA Communication Consortium (ERCC) for their efforts in supporting projects like these, as well as the Barrow Neurological Institute for their support.
Supplementary material
Supplemental data for this article can be accessed here.
Additional information
Funding
References
- Tymianski M. Stroke in 2013: disappointments and advances in acute stroke intervention. Nat Rev Neurol. 2014;10(2):66–12.
- Kwiatkowski TG, Libman RB, Frankel M, et al. Effects of tissue plasminogen activator for acute ischemic stroke at one year. national institute of neurological disorders and stroke recombinant tissue plasminogen activator stroke study group. N Engl J Med. 1999;340(23):1781–1787.
- National Institute of Neurological D, Stroke rt PASSG. Tissue plasminogen activator for acute ischemic stroke. N Engl J Med. 1995;333(24):1581–1587.
- Albers GW, Marks MP, Kemp S, et al. Thrombectomy for stroke at 6 to 16 hours with selection by perfusion imaging. N Engl J Med. 2018;378(8):708–718.
- Dmytriw AA, Zhang Y, Mendes Pereira V. Mechanical thrombectomy and the future of acute stroke treatment. Eur J Radiol. 2019;112:214–221.
- Nogueira RG, Jadhav AP, Haussen DC, et al. Thrombectomy 6 to 24 hours after stroke with a mismatch between deficit and infarct. N Engl J Med. 2018;378(1):11–21.
- Saenger AK, Christenson RH. Stroke biomarkers: progress and challenges for diagnosis, prognosis, differentiation, and treatment. Clin Chem. 2010;56(1):21–33.
- Hunter MP, Ismail N, Zhang X, et al. Detection of microRNA expression in human peripheral blood microvesicles. PLoS One. 2008;3(11):e3694.
- Valadi H, Ekstrom K, Bossios A, et al. Exosome-mediated transfer of mRNAs and microRNAs is a novel mechanism of genetic exchange between cells. Nat Cell Biol. 2007;9(6):654–659.
- Li M, Zhang J. Circulating microRNAs: potential and emerging biomarkers for diagnosis of cardiovascular and cerebrovascular diseases. Biomed Res Int. 2015;2015:730535.
- Zhang J, Li S, Li L, et al. Exosome and exosomal microRNA: trafficking, sorting, and function. Genomics Proteomics Bioinformatics. 2015;13(1):17–24.
- Rosell R, Wei J, Taron M. Circulating microRNA signatures of tumor-derived exosomes for early diagnosis of non-small-cell lung cancer. Clin Lung Cancer. 2009;10(1):8–9.
- Skog J, Wurdinger T, van Rijn S, et al. Glioblastoma microvesicles transport RNA and proteins that promote tumour growth and provide diagnostic biomarkers. Nat Cell Biol. 2008;10(12):1470–1476.
- Vaksman O, Trope C, Davidson B, et al. Exosome-derived miRNAs and ovarian carcinoma progression. Carcinogenesis. 2014;35(9):2113–2120.
- Fabbri M, Paone A, Calore F, et al. MicroRNAs bind to toll-like receptors to induce prometastatic inflammatory response. Proc Natl Acad Sci U S A. 2012;109(31):E2110–6.
- De Smaele E, Ferretti E, Gulino A. MicroRNAs as biomarkers for CNS cancer and other disorders. Brain Res. 2010;1338:100–111.
- Burgos K, Malenica I, Metpally R, et al. Profiles of extracellular miRNA in cerebrospinal fluid and serum from patients with Alzheimer’s and Parkinson’s diseases correlate with disease status and features of pathology. PLoS One. 2014;9(5):e94839.
- Dewdney B, Trollope A, Moxon J, et al. Circulating microRNAs as biomarkers for acute ischemic stroke: a systematic review. J Stroke Cerebrovasc Dis. 2018;27(3):522–530.
- Eyileten C, Wicik Z, De Rosa S, et al. MicroRNAs as diagnostic and prognostic biomarkers in ischemic Stroke-A comprehensive review and bioinformatic analysis. Cells. 2018;7(12):249.
- Gui Y, Xu Z, Jin T, et al. Using extracellular circulating microRNAs to classify the etiological subtypes of ischemic stroke. Transl Stroke Res. 2018;10(4):352–361.
- Leung LY, Chan CP, Leung YK, et al. Comparison of miR-124-3p and miR-16 for early diagnosis of hemorrhagic and ischemic stroke. Clin Chim Acta. 2014;433:139–144.
- Liu DZ, Tian Y, Ander BP, et al. Brain and blood microRNA expression profiling of ischemic stroke, intracerebral hemorrhage, and kainate seizures. J Cereb Blood Flow Metab. 2010;30(1):92–101.
- Modak JM, Roy-O’Reilly M, Zhu L, et al. Differential microribonucleic acid expression in cardioembolic stroke. J Stroke Cerebrovasc Dis. 2019;28(1):121–124.
- Mick E, Shah R, Tanriverdi K, et al. Stroke and circulating extracellular RNAs. Stroke. 2017;48(4):828–834.
- Tiedt S, Prestel M, Malik R, et al. RNA-Seq identifies circulating miR-125a-5p, miR-125b-5p, and miR-143-3p as potential biomarkers for acute ischemic stroke. Circ Res. 2017;121(8):970–980.
- Martinez B, Peplow PV. Blood microRNAs as potential diagnostic and prognostic markers in cerebral ischemic injury. Neural Regen Res. 2016;11(9):1375–1378.
- Ouyang YB, Stary CM, Yang GY, et al. microRNAs: innovative targets for cerebral ischemia and stroke. Curr Drug Targets. 2013;14(1):90–101.
- Lotvall J, Hill AF, Hochberg F, et al. Minimal experimental requirements for definition of extracellular vesicles and their functions: a position statement from the international society for extracellular vesicles. J Extracell Vesicles. 2014;3:26913.
- Thery C, Witwer KW, Aikawa E, et al. Minimal information for studies of extracellular vesicles 2018 (MISEV2018): a position statement of the international society for extracellular vesicles and update of the MISEV2014 guidelines. J Extracell Vesicles. 2018;7(1):1535750.
- Saugstad JA, Lusardi TA, Van Keuren-Jensen KR, et al. Analysis of extracellular RNA in cerebrospinal fluid. J Extracell Vesicles. 2017;6(1):1317577.
- Srinivasan S, Yeri A, Cheah PS, et al. Small RNA sequencing across diverse biofluids identifies optimal methods for exRNA isolation. Cell. 2019;177(2):446–62 e16.
- Giraldez MD, Spengler RM, Etheridge A, et al. Comprehensive multi-center assessment of small RNA-seq methods for quantitative miRNA profiling. Nat Biotechnol. 2018;36(8):746–757.
- Yeri A, Courtright A, Danielson K, et al. Evaluation of commercially available small RNASeq library preparation kits using low input RNA. BMC Genomics. 2018;19(1):331.
- Love MI, Huber W, Anders S. Moderated estimation of fold change and dispersion for RNA-seq data with DESeq2. Genome Biol. 2014;15(12):550.
- Goeman JJ. L1 penalized estimation in the Cox proportional hazards model. Biom J. 2010;52(1):70–84.
- Reeves MJ, Bushnell CD, Howard G, et al. Sex differences in stroke: epidemiology, clinical presentation, medical care, and outcomes. Lancet Neurol. 2008;7(10):915–926.
- Enderle D, Spiel A, Coticchia CM, et al. Characterization of RNA from exosomes and other extracellular vesicles isolated by a novel spin column-based method. PLoS One. 2015;10(8):e0136133.
- Tang YT, Huang YY, Zheng L, et al. Comparison of isolation methods of exosomes and exosomal RNA from cell culture medium and serum. Int J Mol Med. 2017;40(3):834–844.
- Burgos KL, Javaherian A, Bomprezzi R, et al. Identification of extracellular miRNA in human cerebrospinal fluid by next-generation sequencing. RNA. 2013;19(5):712–722.
- Burgos KL, Van Keuren-Jensen K. RNA isolation for small RNA next-generation sequencing from acellular biofluids. Methods Mol Biol. 2014;1182:83–92.
- Cheng X, Kan P, Ma Z, et al. Exploring the potential value of miR-148b-3p, miR-151b and miR-27b-3p as biomarkers in acute ischemic stroke. Biosci Rep. 2018;38(6):BSR20181033
- Liao J, Liu Y, Wang J. Identification of more objective biomarkers for blood-stasis syndrome diagnosis. BMC Complement Altern Med. 2016;16(1):371.
- Arata H, Hosokawa K, Maeda M. Rapid sub-attomole microRNA detection on a portable microfluidic chip. Anal Sci. 2014;30(1):129–135.
- Dave VP, Ngo TA, Pernestig AK, et al. MicroRNA amplification and detection technologies: opportunities and challenges for point of care diagnostics. Lab Invest. 2018;99(4):452–469.
- Godoy PM, Bhakta NR, Barczak AJ, et al. Large differences in small RNA composition between human biofluids. Cell Rep. 2018;25(5):1346–1358.
- Beck TF, Mullikin JC, Program NCS, et al. Systematic evaluation of Sanger validation of next-generation sequencing variants. Clin Chem. 2016;62(4):647–654.
- Mestdagh P, Hartmann N, Baeriswyl L, et al. Evaluation of quantitative miRNA expression platforms in the microRNA quality control (miRQC) study. Nat Methods. 2014;11(8):809–815.
- Mateescu B, Kowal EJ, van Balkom BW, et al. Obstacles and opportunities in the functional analysis of extracellular vesicle RNA - an ISEV position paper. J Extracell Vesicles. 2017;6(1):1286095.