
ABSTRACT
Combining proteomics and systems biology approaches, we demonstrate that neonatal microglial cells derived from two different CNS locations, cortex and spinal cord, and cultured in vitro displayed different phenotypes upon different physiological or pathological conditions. These cells also exhibited greater variability in terms of cellular and small extracellular vesicles (sEVs) protein content and levels. Bioinformatic data analysis showed that cortical microglia exerted anti-inflammatory and neurogenesis/tumorigenesis properties, while the spinal cord microglia were more inflammatory. Interestingly, while both sEVs microglia sources enhanced growth of DRGs processes, only the spinal cord-derived sEVs microglia under LPS stimulation significantly attenuated glioma proliferation. These results were confirmed using the neurite outgrowth assay on DRGs cells and glioma proliferation analysis in 3D spheroid cultures. Results from these in vitro assays suggest that the microglia localized at different CNS regions can ensure different biological functions. Together, this study indicates that neonatal microglia locations regulate their physiological and pathological functional fates and could affect the high prevalence of brain vs spinal cord gliomas in adults.
Introduction
Myeloid cells residing in the central nervous system (CNS) are key players in the crosstalk between the nervous and immune system. Recent studies have shown that the CNS hosts diverse populations of myeloid cells that include parenchymal microglia, macrophages and dendritic cells that are located in the leptomeninges, perivascular space and choroid plexus [Citation1–Citation3]. Experimental studies involving novel transgenic mouse models have clearly shown that, unlike brain cell types of neuroectodermal origin, microglia and their non-parenchymal counterparts originate exclusively from yolk sac haematopoietic stem cells (HSCs) at E7.5-E8, before the blood brain barrier (BBB) is fully formed [Citation1–Citation7]. During the course of neurodevelopment, neuron and glial cell crosstalk leads to the formation of the microglia machinery with its specific functions within the mature neuroimmune system [Citation8,Citation11–Citation17]
Among the glia cells, microglia may vary in number and morphology, depending on their location. Thus, recent data suggests that microglia might be a heterogeneous population of cell subtypes that are able to acquire multiple phenotypes, thereby fulfiling variable functions [Citation18]. The density of microglia/total CNS cells in the mouse brain ranges from 5% (in the cerebral cortex and corpus callosum) to 12% (in the substantia nigra), with higher ratios occurring in grey vs. white matter [Citation3,Citation19–Citation21]. Analyses of the rat prefrontal cortex indicated cell size variability, while the morphology of microglia was homogenous between cortical layers [Citation22]. However, human studies using different microglial markers detected higher regional density spreads, ranging from 0.5% (grey matter of the cerebellum) to 16.6% (medulla oblongata) of all CNS cells. Furthermore, significantly more microglia in white rather than in grey matter was identified in the human brain parenchyma, in contrast to what was observed in the mouse brain [Citation23].
During development, microglial cells migrate into the early brain (E9.5), where they then establish [Citation5,Citation19]. Recently, the role of microglia in the development of the cerebellum has been explored. The McCarthy group has demonstrated a continuous process of microglial maturation and a non-uniform distribution of microglia within the cerebellar cortex [Citation24].
In this context, it is important to understand whether microglia cells migrating into other CNS regions, i.e. to the neocortex or to the spinal cord, are subjected to the same maturation processes and share similar functional roles. Furthermore, most of the parenchymal microglia and their counterpart-macrophages receive no contribution from bone marrow or liver progenitors, which further indicates the importance of the surrounding microenvironment in that specific anatomical CNS area during development and adulthood [Citation5,Citation25–Citation30]. Despite this fact, these immunocompetent and phagocytic cell populations in the CNS interfaces represent long-lived cells with a considerable self-renewal capacity [Citation31].
As in the brain, the spinal cord microglial (SpC-M) cells: (i) infiltrate the embryonic parenchyma through the peripheral vasculature; (ii) are gradually aggregated in the dorsolateral ventral regions and in the lateral motor columns; (iii) are randomly distributed within the parenchymal space [Citation19]. Indeed, all these myeloid populations exhibit an intimate relationship within the CNS, where they support tissue homoeostasis during neuronal development, synaptic remodelling and have important pathophysiological roles in immune and neuronal functions during adulthood [Citation7,Citation19].
CNS myeloid cells are classified according to their anatomical localization, morphological features and surface-marker expression such as Iba-1, F4/80, CD11b and the fractalkine receptor CX3CR1 [Citation30,Citation32]. Microglial cells harbour a characteristic molecular content, defined as a biomolecular signature, which can be transferred from one cell to another via small extracellular vesicles (sEVs). Microglial sEVs indeed play an important role in communication between microglia and neurons as well as with other glial cell such as astrocytes and oligodendroglia cells [Citation33–Citation35]. Based on recent studies, it is believed that engineering microglia cells will render possible the hijack of their sEVs, inducing e.g. a neuroprotective phenotype in neurodegenerative diseases associated with neuroinflammatory processes [Citation11,Citation17,Citation36,Citation37]. However, to develop microglia-derived sEVs-based drug delivery systems, it is important to fully characterize sEVs and their cargo in the different brain and spinal cord regions.
Currently, it is well established that the microglial transcriptome is modulated during different developmental stages in the brain, when environmental factors drive growth and functional specialization [Citation38,Citation39]. These findings suggest that microglial heterogeneity correlates with: (i) spatial distribution within the adult brain; (ii) different developmental stages; and (iii) pathological conditions [Citation38–Citation42].
Here, we focused our work on spatially driven functional specialization of microglia obtained from 3-day old neonatal rats. Through a combination of proteomic-system biology approaches combined with neurobiological assays, we have investigated the differences in secreted sEVs obtained from in vitro cortex microglia (Cx-M) vs. SpC-M under both resting and pro-inflammatory conditions.
Materials and methods
Chemicals
All chemicals used were purchased with the highest purity available. The formic acid (FA), trifluoroacetic acid (TFA), acetonitrile (ACN), methanol (MeOH) and water were purchased from Biosolve B.V. (Valkenswaard, Netherlands). Thiourea, DL-dithiothreitol (DTT) and iodoacetamide (IAA) were purchased from Sigma (Saint-Quentin Fallavier, France). The Trypsin/Lys-C Mix, Mass Spec Grade was obtained from Promega (Charbonnieres, France).
Experimental design and statistical rational
All experiments were conducted with biological replicates (n = 3). A total of 90 rat pups were included in the study for isolation of SpC-M and Cx-M, treated with lipopolysaccharide (LPS) for the experimental group. The multiple sample ANOVA test was carried out for microglia grown ± LPS, with a significance threshold of p < 0.01. Proteomic analyses were performed on microglia cells and microglia released sEVs, using the Student’s T-test with a p-value<0.05. Normalization was achieved by using the Z-score. Data analysis was carried out on Perseus Software.
Animals
All animal studies were performed with the approval of the Institutional Animal Care and Use Committee (IACUC) of the Slovak Academy of Sciences, and in line with the guidelines of the European Communities Council Directive (2010/63/EU), Slovak Law for Animal Protection No. 377/2012, 436/2012 and animal protocol approval Ro-4081/17-221.
Cells and culture conditions
Primary microglia cultures
Primary microglia cells were isolated according to our previously published procedure [Citation43]. Briefly, neural cells (NCs) were dissociated from the cortex and spinal cord of Wistar rat pups (P3), by the Papain Dissociation System (Worthington Biochem. Corp., NJ, USA). Microglia cells were separated from neural cell suspension using CD11b/c (Microglia) MicroBeads (Miltenyi Biotec Inc., CA, USA) following manufacturer’s instructions and according to previous protocols. The isolated microglia were cultured in Dulbecco’s Modified Eagle Medium/Ham’s Nutrient Mixture F-12 (DMEM/F12, 1:1) (BIO SERA, BioTech, Bratislava, SK) supplemented with 10% foetal bovine serum (FBS) (GE Healthcare, Biowest, South America), 0.1% antibiotics (gentamicin 50 mg/mL, Sigma-Aldrich), 1% ultraglutamine (200 mM, Lonza), 10% B27 Supplement (Gibco), 10% N2 Supplement (Gibco). The cells were plated for 7 days in cell culture plates pre-coated with poly-L-lysine 50 µg/mL (Sigma) and then incubated in humidified atmosphere with 5% CO2, 37°C.
Efficacy of microglia separation: immunocytochemistry analyses
Cells were fixed with 4% paraformaldehyde (PFA) for 10 min at 37°C, blocked and permeabilized with 5% BSA and PBS 0.1% Triton-X100 for 60 min at room temperature (RT), were washed three times and incubated O/N with primary antibody anti-Iba1 (1:500, rabbit polyclonal antibody; Wako Pure Chemical Industries, Osaka, Japan) and anti-GFAP (1:200, mouse monoclonal antibody, ab 10,062, Abcam) in 5% BSA 0.1% Triton-X100 PBS. Slides were washed three times and incubated with the secondary fluorescent antibodies, Alexa Fluor 488 goat anti-rabbit IgG (Invitrogen) and Alexa Fluor 546 goat anti-mouse IgG (Invitrogen), both diluted 1:2000 in 5% BSA 0.1% Triton-X100 PBS, for 2 h at room temperature (RT) in the dark. The slides were mounted using Fluoroshield medium with DAPI (Sigma). Labelled cells were analysed with fluorescence microscope Zeiss LSM710. The microscope pictures were processed with Zen10 software (Zeiss).
Microglia derived sEVs isolation
Confluent primary microglia cultures (≈5×10⁵ cells) at day 7 were incubated for 24 h in serum-free DMEM/F12 ± 500 ng/mL lipopolysaccharide (LPS, Invivogen, Toulouse, FR). Afterwards conditioned medium was removed and was cleared of debris by centrifugation 350 × g, 10 min at 4°C and filtration by 0.20 µm filter. The method of sEVs isolation implies differential steps of centrifugation and ultracentrifugation. Supernatants were cleared by centrifugation for 30 min at 2,000 × g at 4°C. Next step was centrifugation at 10,000 × g, 30 min, at 4°C to remove ectosomes and larger vesicles. To obtain sEVs pellet, the supernatant was ultracentrifuged (Beckman Optima TLX Ultracentrifuge, USA) at 100,000 × g for 70 min, 4°C. To eliminate contaminating proteins, the sEVs pellet was washed with 10 mL PBS and re-ultracentrifuged at 100,000 × g for 120 min, 4°C. For the spheroid invasion assay, one part of the sEVs pellet was resuspended and placed on the top of a size exclusion chromatography column (SEC). The SEC column was prepared with sepharose 2B to create a stationary phase and rinsed with 50 mL of 0.2 µm filtered PBS. Fifteen sequential fractions of 500 µL were collected. The sEVs positive fractions were determined with Nanosight and pooled together. The sEVs negative fractions were also pooled together.
Nanoparticle Tracking Analysis (NTA)
Isolated vesicles were analysed using the NanoSight LM 10 instrument (Merkel technologies LTD., UK) to characterize size and concentration. After the last ultracentrifugation step, the pellet obtained was diluted in particle-free PBS (1:100). To analyse the particles, five videos of 60 s for each sample were recorded. A monochromatic laser beam at 488 nm was used for analyses. Particle movement was investigated with NTA software (version 3.2, NanoSight). NTA post-acquisition settings were kept constant between samples. Each sample was analysed in triplicate (n = 3).
Functional analyses of microglia sEVs
ND7/23 cell line (Sigma, neural/neuroblastoma, hybrid rat/mouse, DRG) were used to analyse the neurite outgrowth in vitro influenced by sEVs released by Cx-M or SpC-M cells. DRGs cells were cultivated at 50 000 cells/per well, 12 h before treatment in DMEM medium enriched with 2% foetal bovine serum (FBS) for starvation +1% antibiotics (10,000 units/mL penicillin, 10,000 μg/mL streptomycin, Invitrogen, Thermo Fisher Scientific) + 1% L-Glutamine (Sigma). Afterwards, cells were washed twice with PBS to remove residual FBS and treated with microglia sEVs (1.5 × 10⁸ particles/mL) in a medium without serum for 24 and 48 h. The measurements for neurite outgrowth were performed using ImageJ software. For statistical significance evaluation, the One-Way ANOVA by GraphPad PRISM software was applied.
C6 rat glioma cells were used to form 3D glioma spheroids [Citation44,Citation45]. In brief C6 cells were resuspended in complete DMEM to obtain 12 500 cells in 200 μL. In brief C6 cells were resuspended in complete DMEM to obtain 12 500 cells in 200 μl and distributed in drops on low attachment surface plates which were incubated at 5% CO2, 37°C for 96h to form cell spheroids . Once formed, the spheroids were transferred to a 24-well plate, one spheroid per well in 400 μL of 2.2 mg/mL collagen mixture as described previously [Citation45]. The sEVs positive and/or negative fractions were added directly in the collagen mixture (5.105 sEVs per condition). After the spheroids were embedded, cell invasion out of the spheroid was monitored by digital photography using an inverted light microscope. Images were acquired every day (day 0 = time of embedding in collagen; picture taken immediately after embedding) using a 4×/0.10 objective. Image processing and quantification of spheroids and of invasion areas was performed using in-house software. This in-house software considers cell density and not the (observer-dependent) limits of cell migration in the collagen matrix. The implemented algorithm uses local fluctuations of the image intensity for an automated estimation of the invasion magnitude. It is robust enough to handle micrographs of different generation methods and various qualities without the concept of an invasive front of the spheroids [Citation46]. Invasion and spheroid areas are normalized for each day to the invasion and spheroid areas measured at day 0. These normalized data are reported as relative size to day zero.
Proliferation assay of 3D glioma spheroids in presence of microglia-derived spinal cord sEVs
The spheroids were prepared as described above. The proliferation of the cells inside the spheroid was examined by the CellTiter-Glo assay (Promega, Wisconsin, USA) according to the manufacturer’s instructions. Two spheroids per condition were cultured in a well of a 96 well plate in 2% matrigel in complete medium (serum depleted of sEVs) for 7 days. The sEVs positive and negative fractions from SpC-M treated or not with LPS were added directly into the medium (5.105 sEVs per condition). After 7 days, the cell proliferation assay was performed and the luminescence was quantified.
Microglia cells: proteins isolation and identification
Protein extraction was performed by adding 50 µL of extraction buffer (4% SDS, Tris 0.1M, pH 7.8) to each sample. After mixing each well, the samples were heated to 95°C for 15 min followed by a sonication step for 15 min. Samples were then centrifuged at 16,000 g for 10 min at 20°C. Finally, the supernatant (containing extracted proteins) was collected. Following the extraction process, all protein samples were quantified using the Bradford quantification method and the concentration of samples was then normalized.
Filter-Aided Sample Preparation (FASP)
For protein processing, a shotgun bottom-up approach was applied. In summary, a 30 µL volume of each sample was prepared after the normalization in the previous step to obtain a final concentration of 1.5 µg/µL per sample. An equal volume of reduction solution (DTT 0.1 M) was added to each sample and then incubated for 40 min at 56°C. Using the FASP method [Citation47], the samples were processed. This technique utilizes a filter with a nominal molecular weight limit of 30,000 (Amicon Ultra-0.5 30 k, Millipore). After transferring the samples into the FASP filters, alkylation step was done using IAA solution (0.05 M) for 20 min in the dark at room temperature. Digestion was then carried overnight at an incubation temperature of 37°C using LysC/trypsin (40 µg/mL in 50 mM Tris-HCL solution at pH 8). The filters containing the digests were then rinsed using 50 µL of saline solution (0.5 M) and the enzyme activity was stopped with 10 µL of TFA 5% for each tube. Enrichment and desalting were then performed for each sample with a ZipTip C-18 (Millipore) before undergoing LC-MS/MS analysis.
MS data acquisition
The analyses were carried out by an Easy-nLC 1000 nano-UPLC chromatography (Thermo Scientific) interfaced with a Q-Exactive Orbitrap mass spectrometer (Thermo Scientific) with a nano-electrospray ion source. The analysis was performed in reverse phase and the sample was loaded into a pre-concentration column (75 μm DI × 2 cm, 3 μm, Thermo Scientific). Using an analytical column (Acclaim PepMap C18, 75 μm ID × 50 cm, 2 μm, Thermo Scientific) by applying a linear gradient of acetonitrile in 0.1% formic acid (5% to 35%, for 2 h) at 300 nL/min flow rate the peptides were separated. MS analysis was performed by Orbitrap mass analyser with a resolution of 70,000 FWHM, a mass range of m/z 300–1600, an AGC of 3e6 ions and a maximum injection time of 120 ms. The MS/MS was performed in dependent data mode, defined to analyse the ten most intense ions of MS analysis (Top 10). For MS/MS parameters, the resolution is set to 17,500 FWHM, a mass range of 200–2000 m/z, an AGC of 5e4 ions, and a maximum injection time of 60 ms. The isolation window is set at 4.0 m/z.
Data processing
All data were analysed by MaxQuant software version 1.5.8.3 [Citation47]. Proteins were identified by comparing all the spectra with the proteome reference database of Rattus norvegicus (Uniprot, release April 2017, 7983 entries). The digestion enzyme used was LysC/trypsin and the maximum of missed cleavages allowed was two, in addition to oxidation of methionine and N-terminal protein acetylation selected as variable modifications. Carbamidomethylation of cysteine was selected as fixed modifications. For protein identification, a minimum of 2 peptides of which 1 was unique was defined. In MS mode, an initial mass tolerance of 6 ppm was selected, and the MS/MS tolerance was set to 20 ppm for fragmentation data. The false discovery rate (FDR) was specified to 0.01 for protein and peptide. The label-free quantification (LFQ) has been realized with keeping the default parameters of MaxQuant. The statistical analysis of identified proteins was performed by Perseus software version 1.5.2.6. The matrix was filtered by removing the potential contaminant reverse and only identified by site. Then, the samples were grouped into four categories: Cortex Control, Cortex LPS, Spinal Cord Control and Spinal Cord LPS. Statistical analysis was performed by ANOVA test with a p-value of 5%. Hierarchical clustering and profile plot were performed and visualized by Perseus. The data sets used for analysis were deposited at the ProteomeXchange Consortium via the PRIDE partner repository with the data identifier: PXD016093.
Microglia derived sEVs: protein isolation and identification
Microglial sEV proteins were extracted with RIPA buffer and prepared for LC MS/MS analysis using the FASP protocol described previously. For MS data acquisition, the same instruments and methods were used as for microglial protein preparation.
Using MaxQuant (version 1.5.1.2) with Andromeda search engine, all MS data obtained were analysed. The proteins were identified by comparing all the spectra with the proteome reference database of Rattus norvegicus (Uniprot, published in June 2014, with 33,675 entries), merged with commonly detected 262 contaminants [Citation48–Citation50]. The same digestion enzyme used for sEV samples, so for protein identification the same methods as for microglia proteins were applied.
Results
Different origins of microglia do not exhibit morphological differences among these cells
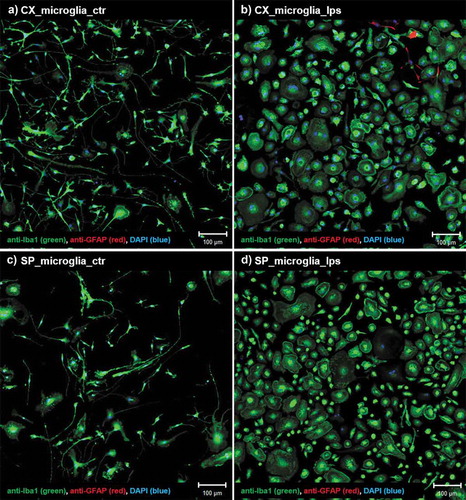
Neural cells (NCs) were isolated from postnatal day 3 (P3) rat pups (n = 90) using Worthington’s Papain Dissociation System for NCs (containing purified Papain, DNase, Ovomucoid inhibitor, single density gradient for cell purification). This system provides consistently high yield and preserves neural cell viability [Citation51]. Combining this method with CD11b/c microbead microglia isolation procedure [Citation43], we obtained 10.10% SpC-M and 11.88% Cx-M (Supp. )). The CD11b/c antibody recognizes a common epitope known as integrin alpha M and X, which is expressed not only on microglia but also on macrophages, monocytes, granulocytes, NK and dendritic cells. Implementing these two purification procedures was therefore fundamental. The first step isolated neurons, microglia, astrocytes and oligodendroglia and depleted other cellular components, such as macrophages, monocytes and granulocytes. The CD11b/c microbead procedure thus isolated microglia, leading to high yields of primary microglia purified from both tissues [Citation43,Citation52]. After purification, microglia cells were cultured for 7 days in vitro before further analyses was carried out. The immunocytochemistry using primary antibody anti-Iba1 and anti-GFAP confirmed that CD11b/c microBead procedure was highly efficient, providing more than 90% microglial cells (). Untreated microglia cells, from both cortex and spinal cord, displayed a branched and filament-shape morphology ()). Incubation with 500 ng/mL LPS for 24 h induced persistent activation of microglia, as reflected by morphological changes, where cells retract their processes and exhibit an occasionally ramified structure of amoeboid shape ()). However, there were no morphological differences between Cx-M and SpC-M under control conditions or when subjected to LPS treatment (comparing ).
Figure 1. Morphological changes of microglia after LPS treatment. (a) Cx-M non-treated (control) and (b) treated with 500ng/mL LPS for 24h. (c) SpC-M non-treated (control) and (d) treated with 500ng/mL LPS for 24 h. Immunostaining using anti-Iba1 antibody (green), marker for microglia cells, anti-GFAP antibody (red), marker for astrocytes and DAPI (blue) stain for cell nucleus. Scale bars: 100 µm.
Proteomic studies established territory-specific microglial proteome profiles
Cx-M and SpC-M treated with or without LPS were subjected to protein extraction followed by shotgun proteomic analyses. Firstly, we compared the proteomic profiles of freshly isolated microglia versus in vitro microglia after 7 days in culture. We found 76% similarity between the proteomes of in vitro Cx-M and fresh Cx-M while 78% similarity was observed between in vitro SpC-M and fresh SpC-M (Supp. Figure 2(a)). The proteomes of microglia were therefore well conserved under our culture conditions. The unique proteins found in cultured in vitro microglia were mainly involved in immune activation as shown Supp. Figure 2(b) which has been prescribed described. However, even if the activation state differs between fresh and in vitro cultured microglia, we were still able to identify known microglia markers in both cell populations such as Itgam, Aif1, Lgmn, C1qa, Hexb, Ctss and Csf1r ().
Table 1. List of known microglia proteins markers identified in fresh and in vitro microglia.
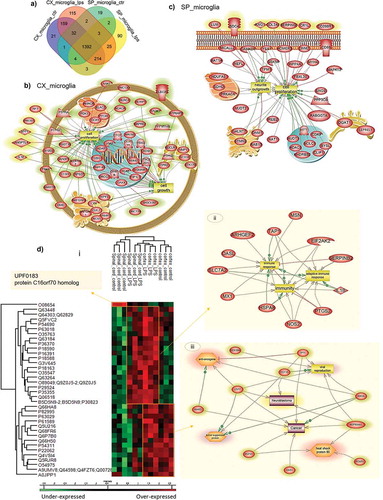
We then compared the proteomes of in vitro Cx-M and SpC-M. We identified 2034 significant protein groups (Supp. data 1) with 295 unique from Cx-M (21 unique for control, 115 unique for LPS treated cells and 159 common for both conditions) and 111 from SpC-M (19 unique for control, 90 unique for LPS treated cells and 2 common for both conditions) ()).
Figure 2. Shot gun analyses of proteins isolated from cortex or spinal cord microglia cells. (a) Venn diagram of the unique protein of microglia cells. Pathway analyses of specific proteins isolated from (b) Cx-M and (c) SpC-M, after treatment 500 ng/mL LPS for 24 h. (d) Representative Heat map of the common proteins, quantified by label free and analyses by MaxQuant with a P value = 0.05 (i), and pathways obtained from each cluster: pathway analyses of cluster 2, common to spinal cord and Cx-M after LPS treatment (ii), and pathway analyses of cluster 3, containing only Cx-M (iii). The analyses were performed in triplicate (n=3)
Cortex microglia
Pathway enrichment analyses based on the identified proteins suggested that Cx-M are more involved in neuronal migration, exogenesis and monocyte recruitment under basal conditions. Among the differential proteins, we identified Mark2, Alcam and Rhob. However, post-LPS stimulation, the protein pathways identified with the highest p-value corresponded to cell proliferation and cellular growth ()). The specific proteins identified are listed in .
Table 2. List of microglia cell proteins identified in function of tissue origin.
Comparison of spinal cord microglia vs. cortex microglia
Similarly, pathway enrichment analysis revealed that the SpC-M specific proteins are mostly involved in Na+/H+ antiporter nerve degeneration and lipid degradation regulated via Nr3c1, Gnat3 and Lipa proteins (). In LPS-treated SpC-M, proteome profiling highlighted pathways that are more related to inflammation, including the complement pathway as well as macrophage activation (Cd59, Cd200rl or Cdk9 and cell proliferation () and ). Common pathways between SpC-M under basal and LPS stimulation are linked to hyperalgesia after injury. In contrast, the common pathways found with Cx-M cells are related to cancer and cell differentiation ( and Supp. data 2).
To better understand the proteome modulation between cortex and SpC-M and the impact of LPS treatment, ANOVA tests were performed with non-supervised clustering of samples. Two main clusters were highlighted. The first cluster represented overexpressed proteins in both cortex and spinal cord after LPS stimulation, while the second cluster represented overexpressed proteins only in Cx-M cells () and ). A single protein was detected to be overexpressed solely in spinal cord under basal conditions: the UPF0183 protein C16orf70 homolog. It is reported to bind to the glutamate receptor. Pathways for each cluster have been analysed using pathway Studio for systems biology analyse ( and ). Cluster 1 is enriched in proteins involved in inflammation and the adaptive immune response () whereas, cluster 2 contains proteins related to neuroblastoma and cancer (). All these proteins are under-expressed in SpC-M. We focused our interest on the proteins involved in inflammation and neurogenesis ().
Table 3. List of microglia cell proteins identified in the three representative clusters after ANOVA with a Statistical analysis with p-value = 0.05.
Table 4. LFQ value of the identified proteins involved in immune response or neurogenesis from microglia isolated from two different territories (cortex or spinal cord). For each condition, an average of the LFQ values of the three replicates was performed.
Label-free quantification values clearly revealed that proteins involved in inflammation-like processes (caspases, NLRC4, interleukin 18) are over-expressed in Cx-M stimulated by LPS, whereas IL-1β was the major cytokine identified in the control Cx-M cells. Only a few proteins involved in inflammation are overexpressed significantly in SpC-M treated with LPS (IL1β, Mepg1, MX1, MX2, CCL7, Capg, Mpcg1, Aim, Caspase 8, Plec). Several immune protein receptors such as CD4, CD36, CD38 and CD48 were overexpressed in the Cx-M after LPS treatment, whereas the neonatal Fc receptor subunit 51 was shown to be decreasing (). Low antibodies affinity receptors (CD16, CD32) were increased in LPS stimulated Cx-M and downregulated in SpC-M.
It is worth noting that the CD4, CD44 and CD48 receptors were either not detected or decreased in the SpC-M, whereas they were over-expressed in the Cx-M after LPS stimulation. Several factors involved in inflammation regulation have been identified in SpC-M, e.g. CD59, CD63 and CD200 were only detected or increased in SpC-M. CD200 is known to modulate neuroinflammation during spinal cord injury [Citation53]. CD59 is modulating the complement response and CD63 is a marker of sEVs. Osteoclast-stimulating factor-1 (Ostf1) was detected in SpC-M and not in Cx-M, whereas secreted phosphoprotein 1 (Spp1) was only identified in the Cx-M. These two proteins are known to be involved in the process of neurogenesis [Citation17,Citation54].
Proteomic analyses of sEVs released by microglia cells
The isolation procedure of microglia-derived sEVs was performed using serial centrifugations (see methods). Quality control was performed using NanoSight quantification. Data showed that sEVs derived from Cx-M are more homogenous than those from spinal cord ().
Figure 3. Microglia sEVs quantification. (a) NanoSight nanoparticle tracking analysis for sEVs of cortex and SpC-M control and treated with 500 ng/mL LPS. (b) Statistical analysis of NanoSight results for concentration, mean and mode analyses. The analyses were performed in triplicate (n = 3).
Firstly, we compared the protein profiles of SpC-M and Cx-M vs their corresponding sEVs. Around 500 proteins were found to be common between microglia and derived sEVs. As shown in Suppl. Figure 3, overexpressed and unique proteins found in sEVs were mainly enriched in the extracellular matrix and in the extracellular exosomes components, which supports our sEVs isolation procedure efficiency.
Proteomic studies also confirmed the changes between the proteins identified in the microglial sEVs derived from different sources in resting conditions. Microglial sEVs have been subjected to shotgun proteomic analyses, identifying a total of 382 proteins (Supp. data 3–6). A total of 116 proteins were shown to be exclusive to the Cx-M-derived sEVs, 28 of the SpC-M-derived EVs. Thirty-four proteins were specific for untreated microglia-derived sEVs, and 76 proteins were specific for LPS-treated microglia-derived sEVs. Fifty proteins corresponded for sEVs derived from control SpC-M and 52 proteins for sEVs derived from SpC-M treated with LPS ()).
Figure 4. Systems biology analysis of proteins identified by Shot-gun proteomic derived from microglia sEVs. (a) Venn diagram of proteins of sEVs released by microglia. (b) Proteins identified in proteomics data (Cx-M sEVs and SpC-M sEVs) also listed in top 50 proteins that are often identified in EVs. Pathway analyses of (c) common protein from sEVs of Cx-M treated or not with 500 ng/mL LPS for 24 h (d) specific proteins from sEVs of Cx-M cells treated with 500 ng/mL LPS for 24 h (e) common protein from sEVs of SpC-M treated or not with 500 ng/mL LPS for 24 h and (f) common protein of sEVs released cortex and SpC-M treated with LPS. (g) Heatmap from shot proteomic analysis using MaxQuant after ANOVA with a p value > 0.05 for sEVs released by microglia isolated from two different sources, cortex and spinal cord, and pathways issued from systemic biology analyses of cluster 1a,1b, 2 and 3 from the heatmap. The analyses were performed in replicate (n = 3).
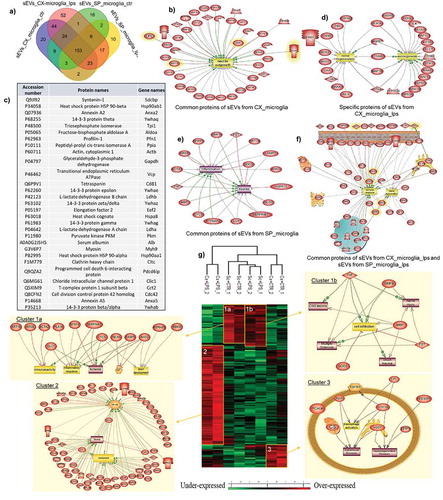
In our protein lists from both sEVs sources (Cx-M and SpC-M, Supp. Data 7–8), we identified 30 of the 50 most abundant EVs proteins ()), according to Vesiclepedia Version 4.1. This included proteins considered as sEVs markers such as tetraspanin CD81, transmembrane protein Anxa2, or cytosolic protein S100 [Citation55–Citation57].
Identified proteins as Lgals1 (axonal growth promoter), associated with Gpnmb (neuroprotective factor), Gpx1 (promotor of neurites outgrowth) with Vim, Fabp5 and Spp1 (implicated in neurodevelopment processes), are markers of neonatal microglia [Citation17]. Proteome analysis revealed enrichment in neurite outgrowth, nerve regeneration and axonogenesis pathways (,)). By contrast, pathway analysis of SpC-M-derived sEVs showed enrichment of inflammation and injury categories ()). Global analyses of exclusive sEVs proteins from the two microglial sources highlighted this dichotomy, i.e. inflammation (spinal cord origin) vs. nerve regeneration (cortex origin) ()).
Exosomal proteome quantitative assessment was computed using the MaxQuant software and Perseus operating system. As a criteria for statistical significance, the ANOVA test was used with a significance threshold of P < 0.05 defined. Statistical analyses were plotted on heatmaps () and Supp. data 9–12). The main heatmap segregates two main branches, one for cortex LPS stimulation and the second one related to spinal cord and the cortex under basal conditions. This latter branch is subdivided between spinal cord and cortex. Three over-expressed clusters could be retrieved from this analysis ()). Enriched pathways were analysed from the significantly abundant proteins present in each cluster ()). Cluster 1 encompassed 57 proteins which are related to the ones isolated from the spinal cord. It is subdivided in two branches which separate control and LPS-treated microglia. Some of the identified proteins are involved in inflammation (Cfh, mrc2, C4a, Lgal3bp, Lgals1, C1S and Cfhr1) or in neurogenesis (Spp1, Spon1, Sned1, Srpx, Hspg2, Fstl1 and Olfml3) (Supp. Data 8). In cluster 2, corresponding to the LPS-treated Cx-M, proteins are mostly involved in chemotaxis, NFĸB pathway and present in glioma. Several of the identified proteins are implicated in metabolic processes. Importantly, 27 of the 136 proteins have already been reported as markers of sEVs (Supp. Data 8). The last cluster, which is specific to control Cx-M, is highly connected to neurodegenerative or autoimmune disease. It contains 35 proteins where we detected markers of sEVs, such as CD9, Mug2 Actn4 or Gdl2 (Supp. Data 7–8). Among the proteins identified in cluster 3, some are known to be involved in neurite outgrowth modulation (CspG4, Bcan, ApoE, Sparcl1, Chadl) and others are associated with glioma proliferation (Cd9, Igfbp2, Hyou1, Ldhb, LdhA, LdhC, Acly, Calu).
In vitro biological activities of microglia sEVs
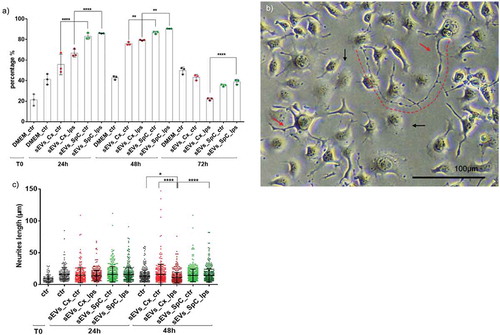
To confirm such differences among the microglia-derived sEVs isolated from the two anatomical regions (cortex or spinal cord), several biochemical and functional tests were conducted in vitro. The first test performed compared the impact of sEVs released in vitro by Cx-M and SpC-M on dorsal root ganglion (DRG) neurite outgrowth (). SEVs were added to the DRG culture medium and the percentage of neurite emergence was measured at 24, 48 and 72 h after sEVs treatment. As presented in ), sEVs derived from both microglia sources under control and LPS conditions, significantly stimulated neurite outgrowth already at 24 h when compared to media only controls. A difference was noted for Cx-M-derived sEVs and SpC-M-derived EVs effect, which enhanced DRG neurite growth by 60–70% and by 80–85%, respectively ()). At 48 h, the neurite outgrowth simulative effect of the sEVs slightly progressed, while at 72 h it decreased, although significant differences between cortex and SpC-M-derived sEVs efficiency remained. Similar results were obtained for the neurite lengths ()), where cortex and SpC-M-derived sEVs stimulated neurite outgrowth within range of 60–90 µm, and 50–65 µm, respectively ()). Surprisingly, the longest neurites were documented after incubation with sEVs derived from control Cx-M (60−150 µm). Moreover, sEVs purified from LPS-treated microglia reduced the length of the neurites compared to those purified from untreated microglia ()). This can be explained by the presence of pro-inflammatory chemokines (CXCL1, CXCL2, CXCL3, CCl2, CCL7) as well as the presence of IL-6 and TNF-alpha in LPS stimulated microglia. Taken together, these biological effects are partially in line with the enriched pathways reflecting the ability of sEVs to stimulate neurite outgrowth (from Cx-M) and inflammation (from SpC-M). In this biological test, time is a key parameter. SEVs could stimulate neurite outgrowth, with the highest activity emerging from cells derived from spinal cord sEVs at 24 and 48 h.
Figure 5. Microglia-derived sEVs modulate neurites outgrowth in DRG cell line (ND7/23). (a) Time course (24, 48 and 72 h) analyses of the number of neurites per cells (percentage) that emerged after treatment with microglia sEVs. (b) Explicit image of DRGs cells neurites outgrowth after sEVs treatment. Red arrows indicate DRGs neurites that occurred after incubation with microglia sEVs. Black arrows indicate DRG cells that do not present any neurite. Scale bars: 100 µm. (c) Box plot representation of a time course (24 h, 48 h) of the neurite lengths growth after treatment with sEVs (equal quantity for each group of cells – 1.5E+08particles). (n = 3).
The second biological assay was based on glioma invasion using 3D spheroid cultures as described in previous studies [Citation44,Citation45]. In these conditions, the sEVs were placed in the collagen matrix in order to be in contact with 3D glioma C6 spheroids. We also performed a time course for glioma cell invasion into a collagen matrix based assay and monitored invasion until day 6 ()). In this setting, the highest anti-invasive effect was observed at 24 and 48 h with sEVs released from LPS-treated SpC-M ()). Around 50% inhibition was induced by these sEVs. In contrast, the sEVs derived from the Cx-M stimulated glioma proliferation, as predicted by pathway enrichment analysis ().
Figure 6. Impact of microglia derived sEVs on glioma spheroids. (a) Representative images of the invasion of C6 spheroids in the collagen matrix at day 0, 1 and 5. Spheroids are in the absence or in the presence of sEVs released by SpC-M and Cx-M not treated or treated with 500 ng/mL LPS for 24h. All images were acquired with an inverted light microscope at 5× magnification. Scale bar: 500 μm. Insets represent spheroid at day 5 at a higher magnification. The results obtained are depicted through a box plot figure (b). Significant differences were identified using Tukey’s multiple comparisons test. (c) Quantification of proliferation of C6 glioma spheroids in presence of sEVs isolated from the CM of control and LPS stimulated SpC-M compared to control C6 spheroids without sEVs. The analyses were performed in replicate (n = 3).
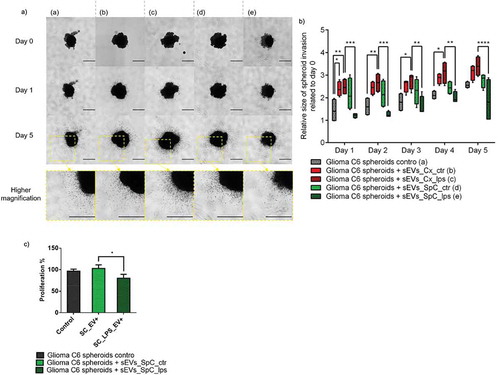
To validate the fact that the effect observed is indeed related to sEVs and not to protein aggregates, we purified sEVs by size exclusion chromatography after ultracentrifugation. We then collected the fractions enriched in sEVs+ and the negative fractions (sEVs−). The results obtained are in accordance with ) (Supplementary Figure 4). Hence, we can conclude that only sEVs derived from LPS treated SpC-M prevent glioma cell invasion. We next wanted to know if these sEVs could impact glioma cells proliferation. To test this hypothesis, we isolated sEVs from SpC-M conditioned medium by ultracentrifugation followed by size exclusion chromatography. We cultured glioma spheroids in presence of spinal cord sEVs control vs. LPS for 7 days. A 20% decrease of proliferation was measured with the CellTiter-Glo 3D kit in the presence of LPS sEVs compared to control sEVs ()). Beyond their anti-invasive properties, sEVs isolated from SpC-M treated with LPS also show slight anti-proliferative effects on glioma cells.
Discussion
As previously established, microglia ontogeny and morphology are different from other glial and neural cells [Citation58]. These brain resident macrophages are important residents and ensure first line response to injury, infection or inflammatory processes. They constantly interact with other brain cells, regulating neural circuits and synaptic transmission [Citation3,Citation59]. Furthermore, tissue environment represents an important determinant of microglial identity, as demonstrated in this study through a combination of proteomic and biological assays.
In the current study, we performed a complete proteomic comparison of Cx-M and SpC-M. Before detailed analysis, we demonstrated that in vitro cultured microglia keep a similar proteome profile compared to fresh microglia. However, proteins involved in the immune response were more represented in in vitro microglia. Previous studies already demonstrated that cultured microglia were more activated due to the absence of the CNS environment [Citation60]. Microglial cells are able to rapidly adapt to their environment. The plasticity of these cells is therefore very interesting to study in different pathological contexts such as bacterial infection triggered by LPS stimulation as demonstrated here. Moreover, proteomic data uncovered striking proteome variations between in vitro cortex and SpC-M, under physiological conditions and following LPS stimulation. We therefore demonstrated that even cultured in vitro, microglia cells coming from different CNS locations keep a specific protein signature of the region from which they are derived. Identified proteins were enriched in specific biological pathways and molecular functions, suggesting that resting Cx-M are important for neurogenesis, while stimulated microglia may contribute to cell proliferation and growth. These results are in line with previous findings in the mouse and human brain, demonstrating high proliferative activity of short-lived microglia, with varied functions relating to proliferation and apoptosis across different brain regions [Citation61]. Interestingly, human microglia in the subventricular zone and thalamus showed higher expression of proliferative markers (Ki-67, cyclin A, B) compared to other brain regions [Citation62]. Whether increased proliferation patterns within brain specific regions correlates with tumorigenicity remains to be investigated. On the contrary, the control spinal cord proteome and corresponding enriched pathways seem to be associated with nerve and lipid degenerative processes, while under stimulation they are linked to inflammation including the complement pathway. It is well documented that the pro-inflammatory processes in the brain lead to neurodegenerative changes and cognitive decline [Citation62]. Neuroinflammation is a complex process in terms of microglia activation, which is thought to encompass heterogeneous resident immune cells [Citation62]. Although microglia functions are still unclear in amyotrophic lateral sclerosis (ALS), a recent study described that tissue-specific microglia represent a pathological hallmark in ALS [Citation63]. Indeed, a stronger pro-inflammatory response was measured in wild-type spinal vs cortical microglia, suggesting that spinal microglia are more reactive in the context of ALS, which is also in line with our proteomic and bioinformatics data. Here, we have shown that neonatal microglia derived from different anatomical CNS regions have an anatomical territory-specific phenotype, i.e. Cx-M play a key role in neuronal migration and exogenesis while SpC-M are involved in inflammatory processes [Citation64]. Thus, the tissue microenvironment during development can contribute to microglia specific molecular patterns within distinct CNS regions. It is now accepted that Cx-M are derived from the yolk sac macrophages which are seeding the brain during early foetal development [Citation65]. On the other hand, the SpC-M are still controversial in terms of origin and function [Citation3,Citation7].
SEVs can also be characterized by proteomics to find sEVs markers [Citation56,Citation66]. In fact, sEVs released from Cx-M display specific markers (Olfml3, Hexb, Fabp5, Cspg4, Fam3, Lgals1), which allows for the establishment of their cellular origin [Citation4,Citation17,Citation32]. Moreover, these sEVs reveal their neonatal nature by presenting neuroectodermal markers (Spp1, Lgals1, Gpx1) [Citation17] associated with other proteins involved in brain development such as the metalloproteases (Mmp2 and Mmp9), which are required for tissue remodelling [Citation67], C1q and C3 needed for pruning axons, and CCL2 and CCL7 proteins involved in midbrain dopaminergic neuron differentiation [Citation68]. The presence of the protein NOV homolog (CCN3) is also important since it plays a role in various cellular processes including proliferation, adhesion, migration, differentiation and survival. Furthermore, the matrix cellular protein CCN (CYR61/CTGF/NOV) is a member of a large family including SPARC (secreted protein acidic and rich in cysteine), Hevin/SC1 (SPARC-like 1), TN-C (Tenascin C), TSP (Thrombospondin), which are secreted by astrocytes during development [Citation69,Citation70] and are also implicated in tumorigenesis [Citation63]. These factors show specific spatio-temporal expression patterns during brain development (Supp. data 13). By contrast, pathways associated with SpC-M’s sEVs show correlation to inflammatory processes which correlate also with the cellular–based proteome of SpC-M detected in the present study. In addition, proteins identified in SpC-M sEVs (Cfh, GPR77, C4a, Lgal3bp, Lgals1, C1S and Cfhr1) are also produced by bone marrow-derived monocytes/macrophages [Citation9,Citation10,Citation71,Citation72] reinforcing the hypothesis of a different origin of the SpC-M than the one present in the brain. Furthermore, functional biological tests with DRGs cell lines showed that sEVs derived from microglial cultures stimulate neurite outgrowth, with slight variations. These data are consistent with other studies documenting that altered microglia-derived sEVs (miR-124-3p) promote neurite outgrowth after scratch injury or in vivo following brain trauma [Citation34,Citation73].
It is noteworthy that in our glioma invasion assay using 3D spheroid cultures, we have identified an altered microglia behaviour, while the SpC-M-derived sEVs treated with LPS revealed anti-invasive and anti-proliferative effects, the Cx-M-derived sEVs stimulated glioma growth. The presence of TNF-alpha and IL-6 in the LPS-stimulated Cx-M associated with metalloproteases (Mmp2, Mmp9) can drive proliferation instead of inhibition [Citation74,Citation75]. Moreover, presence of SPARC, thrombospondin 1, tenascin C, osteopontin, Thrombospondin 2 and tenascin X proteins seed the tumour microenvironment [Citation76]. Furthermore, in Cx-M, the over-expression of CD44 and CD63 was observed, which are known to be involved in tumour metastasis, whereas they were absent in SpC-M. This can also sustain the tumour proliferation inhibition registered with the sEVs isolated from LPS stimulated SpC-M.
Conclusions
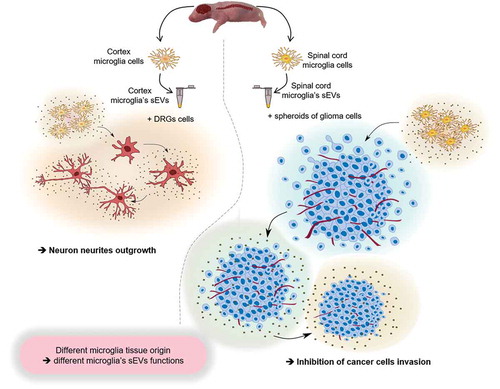
Taken together, these results clearly demonstrate that sEVs produced by two different sources of microglia neither have the same molecular pattern nor the same biological properties (). Thus, microglia function is dependent on the cellular microenvironment dictating its phenotype. In the pathological context, such as in glioma, this microglia phenotype can explain some territory tumour proliferation preference. Our results may indicate why glioma is more prevalent in the brain compared to the spinal cord, as suggested by the selective biological activity of each microglial group obtained from different anatomical areas of the CNS. While, such a hypothesis requires further investigation, it nevertheless highlights the importance of considering different therapeutic strategies related to tumour localization as well as microglia expression patterns.
Figure 7. General summary. The scheme represents the impact on biological function i.e. neurites outgrowth or glioma proliferation inhibition of microglia derived sEVs upon their original localization (cortex or spinal cord).
Author Contributions
Conceptualization, M.S. and D.C.; methodology, A.N.M., A.R.R., M.D., M.Z., D.M.; software, A.N.M., F.K., S.A., K.M.; writing – original draft preparation, A.N.M., D.C., M.S., C.L., K.M., F.K., M.C.; writing – review and editing, A.N.M., D.C., M.S., M.D., A.R.R.; funding acquisition, M.S., D.C. and I.F.; All authors reviewed, read and approved the manuscript.
Conflicts of Interest
The authors declare no conflict of interest.
The authors have declared no competing financial interests in this work.
Data and software availability
Spatially resolved microproteomics, datasets including MaxQuant files and annotated MS/MS datasets, were uploaded to ProteomeXchange Consortium via the PRIDE database, and was assigned the dataset identifier.
Supplemental Material
Download Zip (2 MB)Correction Statement
This article has been republished with minor changes. These changes do not impact the academic content of the article.
Additional information
Funding
References
- Chan WY, Kohsaka S, Rezaie P. The origin and cell lineage of microglia—new concepts. Brain Res Rev. 2007;53(2):344–18.
- Conde JR, Streit WJ. Microglia in the aging brain. J Neuropathol Exp Neurol. 2006;65(3):199–203.
- Prinz M, Erny D, Hagemeyer N. Ontogeny and homeostasis of CNS myeloid cells. Nat Immunol. 2017;18(4):385–392.
- Bennett ML, Bennett FC, Liddelow SA, et al. New tools for studying microglia in the mouse and human CNS. Proc Natl Acad Sci U S A. 2016;113(12):E1738–1746.
- Ginhoux F, Greter M, Leboeuf M, et al. Fate mapping analysis reveals that adult microglia derive from primitive macrophages. Science. 2010;330(6005):841–845.
- Hoeffel G, Ginhoux F. Ontogeny of tissue-resident macrophages. Front Immunol. 2015;6:486.
- Tay TL, Hagemeyer N, Prinz M. The force awakens: insights into the origin and formation of microglia. Curr Opin Neurobiol. 2016;39(August):30–37.
- Dalmau I, Vela JM, González B, et al. Dynamics of microglia in the developing rat brain. J Comp Neurol. 2003;458(2):144–157.
- Devaux S, Cizkova D, Mallah K, et al. RhoA inhibitor treatment at acute phase of spinal cord injury may induce neurite outgrowth and synaptogenesis. Mol Cell Proteomics. 2017;16(8):1394–1415.
- Devaux S, Cizkova D, Quanico J, et al. Proteomic analysis of the spatio-temporal based molecular kinetics of acute spinal cord injury identifies a time- and segment-specific window for effective tissue repair. Mol Cell Proteomics. 2016;15(8):2641–2670.
- Hagemeyer N, Hanft K-M, Akriditou M-A, et al. Microglia contribute to normal myelinogenesis and to oligodendrocyte progenitor maintenance during adulthood. Acta Neuropathol. 2017;134(3):441–458.
- Michell-Robinson MA, Touil H, Healy LM, et al. Roles of microglia in brain development, tissue maintenance and repair. Brain. 2015;138(Pt 5):1138–1159.
- Safaiyan S, Kannaiyan N, Snaidero N, et al. Age-related myelin degradation burdens the clearance function of microglia during aging. Nat Neurosci. 2016;19(8):995–998.
- Sheffield LG, Berman NE. Microglial expression of MHC class II increases in normal aging of nonhuman primates. Neurobiol Aging. 1998;19(1):47–55.
- Streit WJ. Microglia as neuroprotective, immunocompetent cells of the CNS. Glia. 2002;40(2):133–139.
- Varol D, Mildner A, Blank T, et al. Dicer deficiency differentially impacts microglia of the developing and adult brain. Immunity. 2017;46(6):1030–1044.e8.
- Wlodarczyk A, Holtman IR, Krueger M, et al. A novel microglial subset plays a key role in myelinogenesis in developing brain. Embo J. 2017;36(22):3292–3308.
- Stratoulias V, Venero JL, Tremblay M-È, et al. Microglial subtypes: diversity within the microglial community. Embo J. 2019 August;e101997. DOI:10.15252/embj.2019101997.
- Frost JL, Schafer DP. Microglia: architects of the developing nervous system. Trends Cell Biol. 2016;26(8):587–597.
- Keller D, Erö C, Markram H. Cell densities in the mouse brain: a systematic review. Front Neuroanat. 2018;12:83.
- Lawson LJ, Perry VH, Dri P, et al. Heterogeneity in the distribution and morphology of microglia in the normal adult mouse brain. Neuroscience. 1990;39(1):151–170.
- Kongsui R, Beynon SB, Johnson SJ, et al. Quantitative assessment of microglial morphology and density reveals remarkable consistency in the distribution and morphology of cells within the healthy prefrontal cortex of the rat. J Neuroinflammation. 2014;11(October). DOI:10.1186/s12974-014-0182-7
- Mittelbronn M, Dietz K, Schluesener HJ, et al. Local distribution of microglia in the normal adult human central nervous system differs by up to one order of magnitude. Acta Neuropathol. 2001;101(3):249–255.
- Perez-Pouchoulen M, VanRyzin JW, McCarthy MM. Morphological and phagocytic profile of microglia in the developing rat cerebellum. ENeuro. 2015;2(4):ENEURO.0036–15.2015.
- Ginhoux F, Guilliams M. Tissue-resident macrophage ontogeny and homeostasis. Immunity. 2016;44(3):439–449.
- Ginhoux F, Merad M. Microglia arise from extra-embryonic yolk sac primitive progenitors. Med Sci. 2011;27(8–9):719–724.
- Greter M, Merad M. Regulation of microglia development and homeostasis. Glia. 2013;61(1):121–127.
- Lavin Y, Mortha A, Rahman A, et al. Regulation of macrophage development and function in peripheral tissues. Nat Rev Immunol. 2015;15(12):731–744.
- Lavin Y, Winter D, Blecher-Gonen R, et al. Tissue-resident macrophage enhancer landscapes are shaped by the local microenvironment. Cell. 2014;159(6):1312–1326.
- Yamasaki R, Haiyan L, Butovsky O, et al. Differential roles of microglia and monocytes in the inflamed central nervous system. J Exp Med. 2014;211(8):1533–1549.
- Schulz C, Perdiguero EG, Chorro L, et al. A lineage of myeloid cells independent of myb and hematopoietic stem cells. Science. 2012;336(6077):86–90.
- Butovsky O, Jedrychowski MP, Moore CS, et al. Identification of a unique TGF-β-dependent molecular and functional signature in microglia. Nat Neurosci. 2014;17(1):131–143.
- Brites D, Fernandes A. Neuroinflammation and depression: microglia activation, extracellular microvesicles and MicroRNA dysregulation. Front Cell Neurosci. 2015;9:476.
- Paolicelli RC, Bergamini G, Rajendran L. Cell-to-cell communication by extracellular vesicles: focus on microglia. Neuroscience. 2018 April. DOI:10.1016/j.neuroscience.2018.04.003.
- Bavisotto C, Celeste FS, Gammazza AM, et al. Extracellular vesicle-mediated cell−cell communication in the nervous system: focus on neurological diseases. Int J Mol Sci. 2019;20(2). DOI:10.3390/ijms20020434
- Norden DM, Godbout JP. Review: microglia of the aged brain: primed to be activated and resistant to regulation. Neuropathol Appl Neurobiol. 2013;39(1):19–34.
- Perry VH, Holmes C. Microglial priming in neurodegenerative disease. Nat Rev Neurol. 2014;10(4):217–224.
- Matcovitch-Natan O, Winter DR, Giladi A, et al. Microglia development follows a stepwise program to regulate brain homeostasis. Science. 2016 June;353:aad8670. .
- Thion MS, Low D, Silvin A, et al. Microbiome influences prenatal and adult microglia in a sex-specific manner. Cell. 2018;172(3):500–516.e16.
- de Haas AH, Boddeke HWGM, Biber K. Region-specific expression of immunoregulatory proteins on microglia in the healthy CNS. Glia. 2008;56(8):888–894.
- Scheffel J, Regen T, Van Rossum D, et al. Toll-like receptor activation reveals developmental reorganization and unmasks responder subsets of microglia. Glia. 2012;60(12):1930–1943.
- Silvin A, Ginhoux F. Microglia heterogeneity along a spatio–temporal axis: more questions than answers. Glia. 2018;66(10):2045–2057.
- Murgoci A-N, Cizkova D, Majerova P, et al. Brain-cortex microglia-derived exosomes: nanoparticles for glioma therapy. Chemphyschem. 2018 January;19:1205–1214. .
- Cisneros Castillo LR, Oancea A-D, Stüllein C, et al. Evaluation of consistency in spheroid invasion assays. Sci Rep. 2016a;6(June). DOI:10.1038/srep28375
- Duhamel M, Rose M, Rodet F, et al. Paclitaxel treatment and PC1/3 knockdown in macrophages is a promising anti-glioma strategy as revealed by proteomics and cytotoxicity studies. Mol Cell Proteomics. 2018 March. DOI:10.1074/mcp.RA117.000443.
- Cisneros Castillo LR, Oancea A-D, Stüllein C, et al. A novel computer-assisted approach to evaluate multicellular tumor spheroid invasion assay. Sci Rep. 2016b;6(October). DOI:10.1038/srep35099
- Wiśniewski JR, Zougman A, Nagaraj N, et al. Universal sample preparation method for proteome analysis. Nat Methods. 2009;6(5):359–362.
- Cox J, Mann M. MaxQuant enables high peptide identification rates, individualized p.p.b.-range mass accuracies and proteome-wide protein quantification. Nat Biotechnol. 2008;26(12):1367–1372.
- Cox J, Neuhauser N, Michalski A, et al. Andromeda: a peptide search engine integrated into the MaxQuant environment. J Proteome Res. 2011;10(4):1794–1805.
- UniProt Consortium. Reorganizing the protein space at the universal protein resource (UniProt). Nucleic Acids Res. 2012;40(Database issue): D71–75. .
- Cizkova D, Cizek M, Nagyova M, et al. Enrichment of rat oligodendrocyte progenitor cells by magnetic cell sorting. J Neurosci Methods. 2009;184(1):88–94.
- Sarkar S, Malovic E, Plante B, et al. Rapid and refined CD11b magnetic isolation of primary microglia with enhanced purity and versatility. J Visualized Exp. 2017;122(13). DOI:10.3791/55364
- Lago N, Pannunzio B, Amo-Aparicio J, et al. CD200 modulates spinal cord injury neuroinflammation and outcome through CD200R1. Brain Behav Immun. 2018 June;73:416–426. .
- Rogall R, Pikhovych A, Bach A, et al. P 4 bioluminescence imaging visualizes osteopontin-induced neurogenesis and neuroblasts migration in the mouse brain after stroke. Clin Neurophysiol. 2017;128(10):e327–e328.
- Cañas JA, Sastre B, Rodrigo-Muñoz JM, et al. Exosomes: a new approach to asthma pathology. Clin Chim Acta. 2019;495(August):139–147.
- Kowal J, Arras G, Colombo M, et al. Proteomic comparison defines novel markers to characterize heterogeneous populations of extracellular vesicle subtypes. Proc Nat Acad Sci. 2016;113(8):E968–E977.
- Théry C, Witwer KW, Aikawa E, et al. Minimal information for studies of extracellular vesicles 2018 (MISEV2018): a position statement of the international society for extracellular vesicles and update of the MISEV2014 guidelines. J Extracell Vesicles. 2018;7(1). DOI:10.1080/20013078.2018.1535750
- Ginhoux F, Prinz M. Origin of microglia: current concepts and past controversies. Cold Spring Harb Perspect Biol. 2015;7(8):a020537.
- Li Q, Barres BA. Microglia and macrophages in brain homeostasis and disease. Nat Rev Immunol. 2018;18(4):225–242.
- Bohlen CJ, Bennett FC, Tucker AF, et al. Diverse requirements for microglial survival, specification, and function revealed by defined-medium cultures. Neuron. 2017;94(4):759–773.e8.
- Askew K, Li K, Olmos-Alonso A, et al. Coupled proliferation and apoptosis maintain the rapid turnover of microglia in the adult brain. Cell Rep. 2017;18(2):391–405.
- Böttcher C, Schlickeiser S, Sneeboer MAM, et al. Human microglia regional heterogeneity and phenotypes determined by multiplexed single-cell mass cytometry. Nat Neurosci. 2019;22(1):78–90.
- Frakes AE, Ferraiuolo L, Haidet-Phillips AM, et al. Microglia induce motor neuron death via the classical NF-ΚB pathway in amyotrophic lateral sclerosis. Neuron. 2014;81(5):1009–1023.
- Nikodemova M, Small AL, Smith SMC, et al. Spinal but not cortical microglia acquire an atypical phenotype with high VEGF, galectin-3 and osteopontin, and blunted inflammatory responses in ALS rats. Neurobiol Dis. 2014;69(September):43–53.
- Ginhoux F, Lim S, Hoeffel G, et al. Origin and differentiation of microglia. Front Cell Neurosci. 2013;7:45.
- Jeppesen DK, Fenix AM, Franklin JL, et al. Reassessment of exosome composition. Cell. 2019;177(2):428–445.e18.
- Grabert K, Michoel T, Karavolos MH, et al. Microglial brain region-dependent diversity and selective regional sensitivities to aging. Nat Neurosci. 2016;19(3):504–516.
- Edman LC, Mira H, Arenas E. The Beta-Chemokines CCL2 and CCL7 are two novel differentiation factors for midbrain dopaminergic precursors and neurons. Exp Cell Res. 2008;314(10):2123–2130.
- Jones EV, Bouvier DS. Astrocyte-secreted matricellular proteins in CNS remodelling during development and disease. Neural Plast. 2014;2014:321209.
- Malik AR, Liszewska E, Jaworski J. Matricellular proteins of the Cyr61/CTGF/NOV (CCN) family and the nervous system. Front Cell Neurosci. 2015;9:237.
- Cizkova D, Le Marrec-Croq F, Franck J, et al. Alterations of protein composition along the rostro-caudal axis after spinal cord injury: proteomic, in vitro and in vivo analyses. Front Cell Neurosci. 2014;8:105.
- Norden DM, Faw TD, McKim DB, et al. Bone marrow-derived monocytes drive the inflammatory microenvironment in local and remote regions after thoracic spinal cord injury. J Neurotrauma. 2018 October. DOI:10.1089/neu.2018.5806.
- Huang S, Ge X, Yu J, et al. Increased MiR-124-3p in microglial exosomes following traumatic brain injury inhibits neuronal inflammation and contributes to neurite outgrowth via their transfer into neurons. Faseb J. 2017;32(1):512–528.
- Gayle D, Ilyin SE, Miele ME, et al. Modulation of TNF-alpha MRNA production in rat C6 glioma cells by TNF-alpha, IL-1beta, IL-6, and IFN-alpha: in vitro analysis of cytokine-cytokine interactions. Brain Res Bull. 1998;47(3):231–235.
- Wang M, Wang T, Liu S, et al. The expression of matrix metalloproteinase-2 and −9 in human gliomas of different pathological grades. Brain Tumor Pathol. 2003;20(2):65–72.
- Framson PE, Sage EH. SPARC and tumor growth: where the seed meets the soil? J Cell Biochem. 2004;92(4):679–690.