
ABSTRACT
Identification of extracellular vesicle (EV) subpopulations remains an open challenge. To date, the common strategy is based on searching and probing set of molecular components and physical properties intended to be univocally characteristics of the target subpopulation. Pitfalls include the risk to opt for an unsuitable marker set – which may either not represent the subpopulation or also cover other unintended subpopulations – and the need to use different characterization techniques and equipment. This approach focused on specific markers may result inadequate to routinely deal with EV subpopulations that have an intrinsic high level of heterogeneity. In this paper, we show that Fourier-transform Infrared (FT-IR) spectroscopy can provide a collective fingerprint of EV subpopulations in one single experiment. FT-IR measurements were performed on large (LEVs, ~600 nm), medium (MEVs, ~200 nm) and small (SEVs ~60 nm) EVs enriched from two different cell lines medium: murine prostate cancer (TRAMP-C2) and skin melanoma (B16). Spectral regions between 3100–2800 cm−1 and 1880–900 cm−1, corresponding to functional groups mainly ascribed to lipid and protein contributions, were acquired and processed by Principal Component Analysis (PCA). LEVs, MEVs and SEVs were separately grouped for both the considered cell lines. Moreover, subpopulations of the same size but from different sources were assigned (with different degrees of accuracy) to two different groups. These findings demonstrate that FT-IR has the potential to quickly fingerprint EV subpopulations as a whole, suggesting an appealing complement/alternative for their characterization and grading, extendable to healthy and pathological EVs and fully artificial nanovesicles.
Introduction
The terms “exosomes”, “microvesicles” and “apoptotic bodies” have been traditionally applied for classification of the three main extracellular vesicle (EV) subpopulations [1]. According to the most recent papers and guidelines [2–4], these traditional definitions are too rigid, and do not take into account the overlapping size range, similar morphology and variable composition of EV subpopulations. Hence, current attempts to devise a more precise nomenclature for EVs are now emerging in literature, together with a huge effort to classify EVs in different subpopulations according to multiple parameters, such as size, density, protein composition, lipid content, RNA and DNA cargo, morphology, description of conditions and cell origin [3–5]. EV classification parameters are based on a set of molecular components and physical properties intended to be univocally characteristics of the target subpopulation. However, focusing on specific markers cannot give a comprehensive view of samples, defined by a high level of heterogeneity. In addition to the biological variability, pre-analytical and analytical variables in EV subtypes separation (starting source, starting volumes, lab routine) may increase the complexity of EV subpopulation classification.
Figure 1. Imaging of different EV subpopulations. (a) Atomic Force Microscopy (AFM) topography image of the large EV (LEVs), medium EV (MEVs) and small EV (SEVs) preparations adsorbed onto mica (scale bars as indicated; colorimetric scale indicates the maximum height detected in each image). (b) Size distribution obtained from analysis of AFM images such as in (a). A total of 513 (TRAMP), 433 (B16) objects were analysed for LEVs, more than 2000 objects for MEVs and SEVs. Numbers on graphs indicate the diameter, in nm, of each peak indicated for LEVs, MEVs and SEVs from TRAMP and B16, respectively.
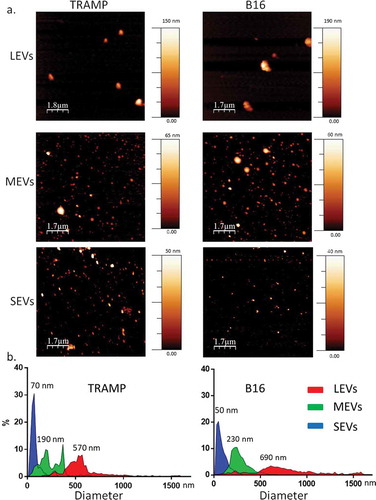
Figure 2. (a) EV populations purity assessment from protein contaminants with CONAN assay. Normalized Aggregation Index (AI) of AuNPs (disperse gold nanoparticles), AuNPs + PBS (aggregated gold nanoparticles), Large EVs (LEVs), Medium EVs (MEVs), Small EVs (SEVs) are showed in the graph. AI decreases along with the change of the solution colour from red to blue (as indicated by the colour scale), and is inversely proportional to the preparation purity. (b) LEV, MEV and SEV biochemical characterization with Western Blot (WB) analysis. Equal volume (20 µL) of LEVs, MEVs, SEVs, 30 µg of cell homogenate (H) both for TRAMP and B16 were loaded. Samples were electrophoresed on SDS-PAGE gel and analysed for the antibodies described in the figures. Un-cropped WB is available in the Supplemental Material.
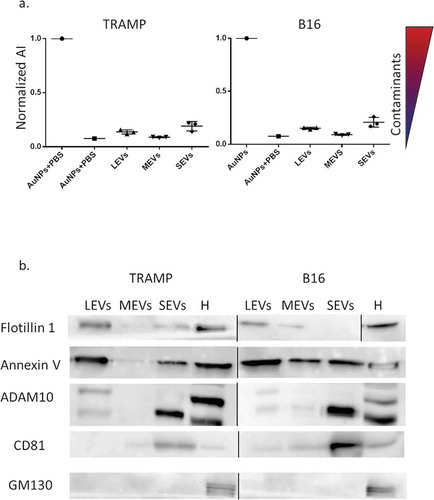
Figure 3. Representative FT-IR spectra of LEVs (red curve), MEVs (green curve), and SEVs (blue curve) derived from (a) TRAMP cell line, and (b) B16 cell line. Characteristic absorption bands of lipids and proteins are highlighted in the plots. Peaks at 2940 cm−1 and 2860 cm−1 correspond to the absorption of the lipid acyl chains. The amide I absorption band, around 1650 cm−1, is due to the carbonyl stretching vibration, and the amide II absorption band, around 1540 cm−1, is due primarily to N-H bending vibrations. Peak at 1740 cm−1 is characterized by the absorption of the ester carbonyl groups.
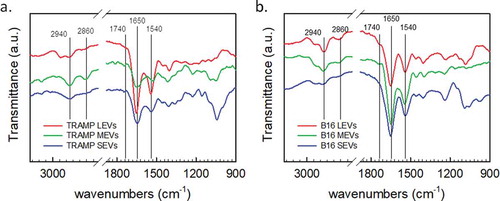
Figure 4. PCA analysis of the different EV subpopulations derived from TRAMP and B16 cell line visualized in Score plot. Left panels display the schemes of the datasets used to derived the principal components (a, TRAMP EV subpopulations, orange arrow; c, B16 EV subpopulations, light blue arrow). Score plots of the different EV subpopulations are showed in the right panels (b, TRAMP EV subpopulations; d, B16 EV subpopulations). LEVs are depicted in red circles, MEVs in green circles and SEVs in blue circles. Each colour-coded symbol indicates the average of three technical replicates of a biological replicate.
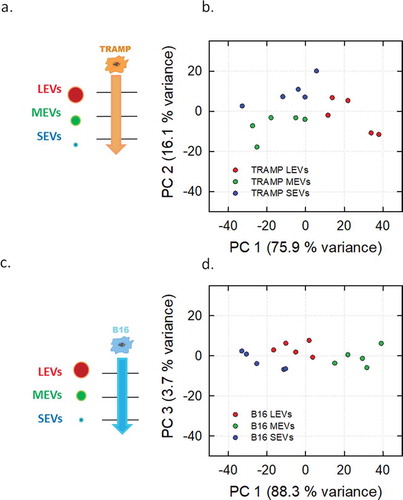
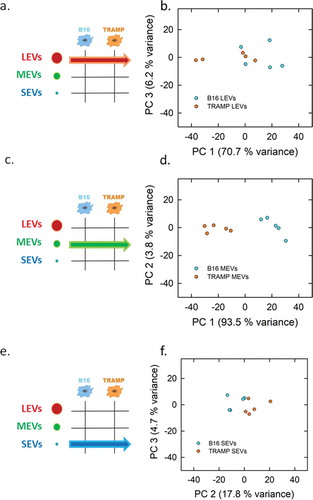
Figure 5. PCA analysis of the LEVs, MEVs and SEVs derived from TRAMP and B16 cell line visualized in Score plot. Left panels display the schemes of the datasets used to derived the principal components (a, LEVs from TRAMP and B16 cell lines; c, MEVs from TRAMP and B16 cell lines; e, SEVs from TRAMP and B16 cell lines). Score plots of LEVs (b), MEVs (d), SEVs (f) from TRAMP and B16 cell line are showed in the right panels. Each colour-coded symbol indicates the average of three technical replicates of a biological replicate (B16 in light blue circles, and TRAMP in orange circles).
In this scenario, EV collective characterization of a subpopulation is highly desirable. Fourier-transform Infrared (FT-IR) spectroscopy is a comprehensive technique that can be alternatively exploited to address this unsolved challenge. FT-IR spectroscopy is a non-destructive method that can investigate solid tissues, fluids and cells [6]. It is a vibrational spectroscopic method physically based on the change in the dipole moment in a molecule. It acts on the principle of vibrating molecular bonds and the resulting absorption wavelengths, which depend on the involved atoms and strength of intermolecular interactions, determine the chemical profile of a specific material [6]. IR active molecules exhibit a variation in the molecular bonds by atomic displacements owing natural vibrations that provide a rapid and label-free tool to interrogate molecular composition of biological materials [7–10].
FT-IR spectroscopy is amenable to an accurate collective fingerprint of EV subpopulations in one single experiment, grading the intrinsic high level of heterogeneity of different EV subtypes. Only an attempt to exploit FT-IR spectroscopy to distinguish EV subtypes from one cell line has been reported [11].
Complementary spectroscopic approaches, such as Raman spectroscopy, have already been reported to distinguish EVs [12–14]. However, Raman Spectroscopy suffers from very low sensitivity. This drawback is often circumvented by coupling the analytes with plasmonic nanoparticles (SERS) [15,16], by labelling them with organic dyes (Raman reporters), or immune-labelling with nanoprobes [17]. These strategies allowed to distinguish EVs from various sources, disease contexts [18,19] and single-vesicle analysis [20–22]. SERS-active nanostructures can enhance the Raman signals of target molecules by several orders of magnitude, but can have problems in stability, poor reproducibility, and sample damaging according to their material composition and architecture [23,24]. Those approaches might introduce pitfalls in data analysis, which might strongly affect the classification of EV subpopulations. Moreover, commercially available instrumentation for Raman spectroscopy is typically more complex and expensive than the corresponding FT-IR spectrometers. For these reasons, we decided to focus our study on FT-IR.
In the present work, we challenged FT-IR spectroscopy to fingerprint EV subpopulations separated using differential centrifugation steps, a widely adopted technique [4,20,25,26]. We enriched for large (LEVs), medium (MEVs) and small (SEVs) EVs from murine prostate cancer (TRAMP-C2) and murine skin melanoma (B16) cell culture media according to their different sedimentation properties. We combined FT-IR spectroscopy and spectral exploration by means of chemometric tools (Principal Component Analysis, PCA) and we were able to fingerprint the EV subpopulations both vertically (deriving from the same cell line) and horizontally (among different cell lines) with different degrees of accuracy.
Materials and methods
All data were acquired and described following the MIRABEL [27] and MISEV 2018 [3] international guidelines. We have submitted all relevant data of EV samples to the EV-TRACK knowledge base (EV-TRACK ID: EV180079) [28].
Chemicals and reagents
All reagents were purchased from Sigma-Aldrich (St. Louis, MO, USA) unless otherwise specified.
Cell lines
Murine cell line TRAMP-C2 (ATCC CRL-2731, Mus musculus, mouse, tissue: prostate cancer) were grow in supplemented DMEM as described in Busatto et al. [29]. Murine cell line B16 (B16-F10, ATCC CRL-647; Mus musculus, mouse; tissue: melanoma skin) were grown in DMEM as described in Montis et al. [30]. Cells were myco-free tested and used at passage 2–20. Cells (1.700.000 each dish) were seeded on at least five 150 Petri dish and maintained at 37°C at 5% CO2 until 80% of confluency in their medium supplemented with 10% Foetal Bovine Serum (FBS) (Lonza) depleted from SEVs. FBS complement inactivation was performed at 56°C for 30 min prior usage. SEVs depleted FBS was obtained diluting FBS 1:4 and centrifuging it at 100,000 g (Type 45i rotor, ultracentrifuge XP80, Beckman) for 18 h. Supernatant was filtered with 0.22 µm filter (Filtropur V50, 500 mL, Sarstedt), aliquoted and kept at −20°C until use [31]. Fresh prepared complete medium was filtered again with 0.22 µm filter. Before EV recovery, cells were washed twice with PBS 1X and incubated for 24 h with 17 mL of serum-free DMEM each dish.
Different EV subpopulations enrichment from cell culture medium
Medium was collected from Petri dishes in 50 mL tubes and processed with serial centrifugation steps as previously described [32,33]. Briefly, 85 mL of medium were centrifuged at 800 g for 30 min (5804R Eppendorf centrifuge, A-4-44 rotor, 50 mL 174 × 22 mm polypropylene tube Sarstedt, 42.5 mL each tube). Supernatant of 42.5 mL was centrifuged at 16,000 g for 45 min (Avanti J25, rotor ja20, polycarbonate tubes 357003 Beckman, 21.25 mL each tube). Finally, 42.5 mL were centrifuged at 100,000 g for 4 h (Optima XP80, TY45i rotor, polycarbonate tubes 355622 Beckmann). The 800 g centrifugation step allows sedimentation of cell debris and LEVs, the 16,000 g step allows us to pellet MEVs, while the final 100,000 g ultracentrifugation enriches SEVs. Pellets were washed with 1 mL sterile H2O (Milli-Q, Merck Millipore) and re-pelleted at the same g force and time in a 5417C Eppendorf centrifuge (45-30-11 rotor,) except SEVs, pelleted at 100,000 g 2 h (TLA-55 rotor, Optima MAX, Beckman). All steps were performed at 4°C, centrifugations speed decreased with max brake on.
Atomic Force Microscopy (AFM) imaging and size distribution
Atomic Force Microscopy (AFM) imaging and image analysis were performed adapting the protocols we developed in previous works [34,35]. Briefly, pellets were resuspended in 100 μL sterile H2O (Milli-Q, Merck Millipore) and diluted 1:10 in H2O. Five microliters of sample were then spotted onto freshly cleaved mica sheets (Grade V-1, thickness 0.15 mm, size 15 × 15 mm2). The samples were then allowed to dry at room temperature. They were finally imaged with a NaioAFM (Nanosurf AG) equipped with Multi75-AI-G tip (Budget Sensors). Images were acquired in tapping mode, with a scan size ranging from 1.5 to 25 µm and a scan speed of 1 s per scanning line. EV size distributions were obtained by image analysis of at least five representative AFM images with a scan size of 8.7 μm × 8.7 μm. Image analysis was performed using WSxM version 5.0 [36] and Image J.
EV subpopulations purity assessment
EV subpopulations were checked for purity from protein contaminants applying the COlorimetric NANoplasmonic (CONAN) assay, which exploits the nanoplasmonic properties of colloidal gold nanoparticles (AuNPs) and their peculiar interaction with proteins and lipid bilayers [37,38].
SDS−PAGE and Western blot
SDS−PAGE and Western blot were performed by standard procedures [39] on the total cell homogenate [40] (30 µg, protein content determined by Bradford assay), LEVs, MEVs and SEVs population separated as described above. Samples were electrophoresed and analysed by Western Blot with the following antibodies (at dilution 1:500)[25]: mouse anti-Flotillin 1 (Santa Cruz, clone C-2, sc-74566) mouse anti-Annexin V (Santa-Cruz, clone H-3, sc-74438), rabbit anti-ADAM10 (Origene, AP05830PU-N), mouse anti-CD81 (Santa Cruz, clone B11, sc-166029). Mouse anti-GM130 Cis-Golgi protein was diluted 1:250 (BD Transduction, clone 35/130, 610822) (see Supplemental Material for more details).
FT-IR measurements
FT-IR measurements were performed with an Equinox 55 spectrometer (Bruker) operating in transmission mode. The broadband infrared source is modulated by an interferometer and all the wavelengths are simultaneously analysed. LEVs, MEVs and SEVs pellets were re-suspended in 30 µL of milliQ water. From each sample a drop of 2 μL was deposited onto a diamond window and gently dried under a stream of nitrogen. Spectra were acquired from multiple dried EVs simultaneously. The thickness of the sample did not cause obvious saturation, and in order to avoid artefacts due to thicker regions all spectra were recorded in three technical replicates from five different biological replicates (parallel measurements of biologically distinct samples that capture random biological variation) [41] and averaged. Measurements were performed in the range of 4000–400 cm−1 at nominal 4 cm−1 resolution and, to increase the signal-to-noise ratio, 128 scans per samples were co-added without change the position of the sample between each scan (time per scan 0.9 seconds, included dead time). Serum-free DMEM was also measured in triplicate as control experiment (see Supplemental Material). For all spectra manipulations OPUS software 5.0 was used.
Statistical analysis
For statistical analysis the spectral regions between 3100–2800 cm−1 and 1880–900 cm−1 were considered, covering the principal spectral features common for all EV subpopulations, as lipids and proteins contributions. PCA was performed by the R-based software CAT, Chemometric Agile Tool (http://gruppochemiometria.it, 2018).
Before PCA analysis, all spectra were centred (mean subtraction) and scaled to a unit vector, with values ranging between 0 and 1, in order to prevent artefacts due to the variation in the spectral intensity.
Results and discussion
Large, medium, small EV subpopulations separation and characterization
We separated different subpopulations of EVs from TRAMP-C2 (TRAMP) and B16 culture medium via a differential centrifugation protocol (800 g for 30 min, 16,000 g for 45 min and 100,000 g for 4 h). This protocol allowed the EV separation on the basis of their different density and diameter. Dry AFM analysis of EV subpopulations was applied to check morphological properties and differences in size among all samples. All the preparations analysed were composed of round-shaped objects and the size distribution for each population was estimated ( and S7). AFM analysis confirmed that, both from TRAMP and B16 cell line, three different-sized EV subpopulations were obtained. We could observe a LEV population pelleted at 800 g that presented a diameter distribution from 450 to 1000 nm with a peak at 570 nm from TRAMP and 690 nm from B16; a MEVs population pelleted at 16,000 g with a diameter distribution from 100 to 450 nm and a peak at 190 nm (TRAMP) and 230 nm (B16); and a SEVs population pelleted at 100,000 g with a diameter distribution from 30 to 150 nm and a peak at 70 nm (TRAMP) and 50 nm (B16) (). The black background in all AFM images indicates the absence of residual protein contaminants from the separation procedure (with reference to the colour code bar). Purity from protein contaminants was also checked with the nanoplasmonic colorimetric (CONAN) assay () [42]. The assay consists of an aqueous solution of bare gold nanoparticles (AuNPs) at 6 nM concentration. When mixed with pure EV formulations, the AuNPs cluster on the EV membrane, whereas in EV formulations which contain exogenous protein contaminants (EPCs) the AuNPs are preferentially cloaked by such EPCs (an AuNP-EPC corona forms), which prevents AuNPs from clustering to the EV membrane. When AuNPs cluster (are in tight proximity), their localized surface plasmon resonance (LSPR) red shifts and broadens, resulting in a colour change of the AuNP solution from red to blue, which can be accurately monitored through UV−Vis spectroscopy. The assay red shift is therefore directly related to the purity grade of the added EV formulation and can be conveniently quantified by describing the AuNP UV-Vis absorption spectra with the nanoparticle Aggregation Index (AI), defined as the ratio between the absorbance intensity at the LSPR peak and the intensity at 650 nm [29]. For all the analysed formulations, the mean AI values resulted equal or lower than 0.2 of the reference AI (i.e. the dispersed AuNPs solution, AI normalized at 1). This proves the EV formulations contained negligible amounts of EPCs. In order to biochemically characterize the LEV, MEV and SEV subpopulations, we performed a Western Blot analysis for EV markers, compared to the cellular homogenate (H) (). Since there are no universal markers of one EV subtype, markers choice was made according to MISEV 2018 guidelines [3] and recent papers that compared the protein composition of different EV subtypes from other cell sources [25,43]. In our experimental conditions and using our cell models, we found an enrichment of Flotillin1, a protein involved in the vesicular trafficking [3,44], in LEVs from B16 and TRAMP, in SEVs from TRAMP and MEVs from B16. We could observe the presence of the cytosolic protein with membrane binding ability Annexin V [3] in LEVs, SEVs from both cell lines and in MEVs from B16. In this case, Annexin V represents an example of an endogenous cellular protein, which is unrelated to the use of exogenous Annexin V as a probe detecting phosphatidylserine exposed on the plasma membrane of cells and EVs. ADAM10, a membrane protein belonging to the family of matrix metalloproteinases (MMPs) involved in several biological events [45] and the tetraspanin CD81 [25], was enriched in the SEVs fractions from both cell lines. The cis-Golgi marker GM130 [46] was visible only in the cellular homogenate (H), indicating an undetectable presence of intracytoplasmic membranous components in all subpopulations. See Supplemental Material (Figures S1–S3) for uncut Western Blots.
Fourier-transform Infrared (FT-IR) spectra of LEV, MEV, SEV subpopulations
Representative IR spectra of different EV subpopulations derived from TRAMP and B16 cell lines are shown in . IR spectrum of serum-free DMEM as control experiment is reported in Supplemental Material (Figure S4) showing different IR features in comparison with those ascribed to EVs. FT-IR spectroscopy of biological systems provides simultaneously information on the main biomolecules contained in a sample, such as lipids, proteins, nucleic acids and carbohydrates [47]. In this work, we limit the spectral regions of interest to the characteristic absorption bands of lipids and proteins, as biological features immediately associated to all EV subpopulations. In particular, the amide I absorption band, around 1650 cm−1, is due to the carbonyl stretching vibration, and the amide II absorption band, around 1540 cm−1, is due primarily to N–H bending vibrations [48]. Moreover, in the range between 3050–2800 cm−1 and 1500–1350 cm−1 the absorption of the lipid acyl chains occurs, while around 1740 cm−1 the spectrum is characterized by the absorption of the ester carbonyl groups [49]. These molecular vibrations are in agreement with those previously reported for EV samples [6,11]. Detailed analysis of the selected spectral regions reveals variations in the shape and relative intensity of the absorption bands. Subtle changes of the protein absorption region and of the CH2 and CH3 acyl chain stretching modes were observed, suggesting that lipid and protein modifications occur in the different EV subpopulations. Nevertheless, the spectra are very complex and they result from the overlapping absorption of the main biomolecules. For this reason, it is necessary to implement an appropriate multivariate approach, in order to reveal underlying spectral information.
Principal Component Analysis (PCA)
PCA is a multivariate statistical analysis that allows to study multiple parameters in one-step and it is applied to collective characterization, when the parameters to evaluate are numerous and various [50]. PCA is widely used in pattern recognition and spectroscopy, allowing a broader approach compared to take into account only the position and intensity of spectral features such as the conventional protein-to-lipid ratio that moreover requires a higher data manipulation [11].
PCA extracts few variables from a high dimensional data set and visualizes them in a dimensional space of uncorrelated variables that are linear combinations of the original variables, named Principal Components (PCs). The values that IR spectra take in the PC-coordinate systems are represented in the scores plot, in which each dot represents a spectrum with reduced dimension. The loadings plots of PCA analyses, which represent how each variable influences a PC, are reported in Supplemental Material, showing the variables (and in turn the wavenumbers) responsible for differentiation of the subpopulations, being assigned to lipids and proteins spectral regions (Figures S5 and S6). In all the analyses performed, the first three PCs reveal the trends of the dataset and the choice of the PC is made in order to maximize the variance that allows separation in the data. shows schemes of the datasets analysed and PCA scores plots of IR spectra (three technical averaged replicates from five different biological replicates) collected for TRAMP cell line () and B16 cell line (). In both cases, it is possible to sort the different EV subpopulations of the considered cell lines (LEVs represented by red, MEVs by green and SEVs by blue circles). The distinction between LEVs, MEVs and SEVs of TRAMP cell line () is made on the basis of the separation along the first component axis (75.9% of variance) and the second component axis (16.1% of variance). shows a clear separation of the B16 subpopulations on the basis of first component axis that accounts for the 88.3% of variance. Taken together these data show that our approach can fingerprint the three EV subpopulations vertically (deriving from the same cell line) with a high degree of accuracy. We then tested if FT-IR can be applied to fingerprint a determined EV subpopulation horizontally, that is EV subpopulations of the same size from different cell sources, as schematized in the left panels of . In the right panels of , the related PCA scores plots of LEVs, MEVs and SEVs are shown (, respectively). The MEV scores plot in shows a clear separation of the two subpopulations. In this case, the first component axis explains 93.5% of the total variance. shows the scores plot comparing LEVs, reporting a lower separation, with a PC1 variance of 70.7% of the total variance. Scores plot of SEVs population () shows that samples from each cell line are close to each other with PC2 and PC3 total variance of 22.5%.
LEVs and SEVs clustering of data points visualized in the PCA scores plots resulted not clearly separated. In order to better interpret these data we used a PCA followed by a further chemometric tool: Discriminant Analysis (DA) [51].
We then tested the ability of this method to distinguish between LEVs reaching 50% of total correct prediction in cross-validation, confirming that the discrimination between the two LEVs groups has no high accuracy. This value increased up to 90% in case of SEVs from B16 and TRAMP cell lines showing a good ability of the model to distinguish these two groups (refer to Supplemental material section S4 and Table S1). These data indicate the capability of FT-IR combined with PCA to fingerprint EV subpopulations horizontally at different degree of accuracy. MEVs showed the highest degree and confirmed the feasibility of our approach. SEVs resulted good discriminated, while LEVs presented the lower degree of accuracy.
Conclusions
EV subtype classification is an emerging topic in EV field and it is usually performed on the basis of EV physical characteristics and biological functions [52]. Different subpopulations can have different properties and, despite a first focusing on SEV (“exosome”) studies, the field is now evolving to systematically compare the nature and the functions of all secreted EVs [53].
Data acquired with collective approaches will make possible to identify general features shared between several EV subtypes or specific to one sub-type of EVs [53] to better understand and exploit EV potential both as diagnostic and therapeutic tools [4].
In this work, we wanted to test the ability/possibility of FT-IR spectroscopy combined with multivariate tools (PCA) to collectively fingerprint EV subpopulation. The proof-of-concept experiments were conducted on LEVs, MEVs and SEVs originating from two different murine (TRAMP and B16) cell lines and differentiated in size by following a differential centrifugation protocol. Formulations showed a level of purity from EPCs that does not inhibit the aggregation of AuNPs and we characterized the biochemical profile and the morphological aspect of the subpopulations.
PCA analysis of the recorded FT-IR spectra distinguished among LEVs, MEVs and SEVs of the same cell line. In addiction spectra of MEV subpopulation deriving from the two different murine cell lines can be strongly discriminated. LEVs and SEVs from different cell line can be also separated, even if with different degree of accuracy, as confirmed from PCA followed by a DA analysis. We can speculate that differences in scores plot results among EV subpopulations mirror differences (or similarities) in their lipid, protein composition (as seen by Western Blot), cargo and biogenesis [54].
FT-IR combined with PCA analysis requires basic training of the operator and short time for data acquisition, together with low cost of equipment. Nevertheless, EV separation protocol using matrixes that can interfere with infrared signal arising from EVs can be a limitation to data interpretation.
Our work wants to reveal the versatility of this approach that can be applied and turn useful to a wide range of cases: to distinguish different EVs subpopulations form healthy and pathological subjects [55]; support “omics” profiling, like proteomics [4], lipidomics [56] and genomics[57]; to characterize EVs obtained from different biological fluids [58,59] or tissues [60]. Furthermore, it could be extended to other classes of biological or artificial nanovesicles [18,61].
FT-IR candidates to be an alternative and/or a complement (depending on the target subpopulation and information needed) to other methods used for fingerprinting EV subpopulations, including other spectroscopic methods, such as Raman spectroscopy [62] and SERS [17], biosensors [63–65] and highly adopted techniques like immunosorbent assays and flow cytometry [66].
Disclosure of interest
No potential conflict of interest was reported by the authors.
Author contributions
Conceptualization, L.P., S.F., and P.B.; Investigation, L.P., S.F., A.R., G.C., D.A., I.A.; Writing – Original Draft, L.P., S.F.; Writing – Review & Editing, L.P., S.F., A.R., G.C., D.A., I.A., P.B.; Funding Acquisition, P.B., A.R., I.A.; Resources, P.B., I.A.; Supervision, L.P., S.F., P.B.
Please turn to the CRediT taxonomy for the term explanation.
Supplemental Material
Download MS Word (793.8 KB)Acknowledgments
We thank the anonymous referees for their useful suggestions.
Supplemental material
Supplemental data for this article can be accessed here.
Additional information
Funding
References
- Van Niel G, D’Angelo G, Raposo G. Shedding light on the cell biology of extracellular vesicles. Nat Rev Mol Cell Biol. 2018;19(4):213–11.
- Tkach M, Kowal J, Théry C. Why the need and how to approach the functional diversity of extracellular vesicles. Philos Trans R Soc B Biol Sci. 2018;373(1737). DOI:10.1098/rstb.2016.0479
- Minimal Information for Studies of Extracellular Vesicles 2018 (MISEV2018), Théry C, Witwer KW, Aikawa E, et al. A position statement of the international society for extracellular vesicles and update of the MISEV2014 guidelines. J Extracell Vesicles. 2019;8(1):1535750.
- Lässer C, Jang SC, Lötvall J. Subpopulations of extracellular vesicles and their therapeutic potential. Mol Aspects Med. 2018;60:1–14.
- Salvi A, Vezzoli M, Busatto S, et al. Analysis of a nanoparticle‑enriched fraction of plasma reveals MiRNA candidates for down syndrome pathogenesis. Int J Mol Med. 2019;43(6):2303–2318.
- Zlotogorski-Hurvitz A, Dekel BZ, Malonek D, et al. FTIR-based spectrum of salivary exosomes coupled with computational-aided discriminating analysis in the diagnosis of oral cancer. J Cancer Res Clin Oncol. 2019;145(3):685–694.
- Griffiths PR, De Haseth JA, Winefordner JD. Fourier transform infrared spectrometry. Wiley: Chemical Analysis: A Series of Monographs on Analytical Chemistry and Its Applications; 2007.
- Parker F. Applications of infrared spectroscopy in biochemistry, biology, and medicine. Springer: US; 2012.
- Baker MJ, Trevisan J, Bassan P, et al. Using Fourier transform IR spectroscopy to analyze biological materials. Nat Protoc. 2014;9(8). doi:10.1038/nprot.2014.110
- Martin FL, Kelly JG, Llabjani V, et al. Distinguishing cell types or populations based on the computational analysis of their infrared spectra. Nat Protoc. 2010;5(11):1748–1760.
- Mihály J, Deák R, Szigyártó IC, et al. Characterization of extracellular vesicles by IR spectroscopy: fast and simple classification based on amide and C[Sbnd]H stretching vibrations. Biochim Biophys Acta - Biomembr. 2017;1859(3):459–466.
- Gualerzi A, Alexander S, Kooijmans A, et al. Journal of extracellular vesicles Raman spectroscopy as a quick tool to assess purity of extracellular vesicle preparations and predict their functionality. J Extracell Vesicles. 2019;8(1). doi:10.1080/20013078.2019.1568780
- Lee W, Nanou A, Rikkert L, et al. Label-free prostate cancer detection by characterization of extracellular vesicles using Raman spectroscopy. Anal Chem. 2018;90(19):11290–11296.
- Gualerzi A, Niada S, Giannasi C, et al. Raman spectroscopy uncovers biochemical tissue-related features of extracellular vesicles from mesenchymal stromal cells. Sci Rep. 2017;7(1):1–11. .
- Kwizera EA, O’Connor R, Vinduska V, et al. Molecular and analysis of exosomes using surface-enhanced Raman scattering gold nanorods and a miniaturized device. Theranostics. 2018;8(10):2722–2738.
- Tian YF, Ning CF, He F, et al. Highly sensitive detection of exosomes by SERS using gold nanostar@Raman reporter@nanoshell structures modified with a bivalent cholesterol-labeled DNA anchor. Analyst. 2018;143(20):4915–4922.
- Merdalimova A, Chernyshev V, Nozdriukhin D, et al. Analysis of exosomes by surface-enhanced Raman spectroscopy. Appl Sci. 2019;9(6):1135.
- Rojalin T, Phong B, Koster HJ, et al. Nanoplasmonic approaches for sensitive detection and molecular characterization of extracellular vesicles. Front Chem. 2019;7(279):0–24.
- Shin H, Jeong H, Park J, et al. Correlation between cancerous exosomes and protein markers based on Surface-Enhanced Raman Spectroscopy (SERS) and Principal Component Analysis (PCA). ACS Sens. 2018;3(12):2637–2643.
- Kruglik SG, Royo F, Guigner JM, et al. Raman Tweezers microspectroscopy of: circa 100 Nm extracellular vesicles. Nanoscale. 2019;11(4):1661–1679.
- Kim SY, Khanal D, Kalionis B, et al. High-fidelity probing of the structure and heterogeneity of extracellular vesicles by resonance-enhanced atomic force microscopy infrared spectroscopy. Nat Protoc. 2019;14(2):576–593.
- Chiang CY, Chen C. Toward characterizing extracellular vesicles at a single-particle level Tse-Hua Tan. J Biomed Sci. 2019;26(1):1–10.
- Alessandri I, Depero LE. All-oxide Raman-active traps for light and matter: probing redox homeostasis model reactions in aqueous environment. Small. 2014;10(7):1294–1298.
- Alessandri I, Lombardi JR. Enhanced Raman scattering with dielectrics. Chem Rev. 2016;116(24):14921–14981.
- Kowal J, Arras G, Colombo M, et al. Proteomic comparison defines novel markers to characterize heterogeneous populations of extracellular vesicle subtypes. Proc Natl Acad Sci U S A. 2016;113(8):E968–77.
- Livshts MA, Khomyakova E, Evtushenko EG, et al. Isolation of exosomes by differential centrifugation: theoretical analysis of a commonly used protocol. Sci Rep. 2015;5(October):1–14.
- Faria M, Björnmalm M, Thurecht KJ, et al. Minimum information reporting in bio–nano experimental literature. Nat Nanotechnol. 2018;13(9):777–785. .
- Van Deun J, Mestdagh P, Agostinis P, et al. EV-TRACK: transparent reporting and centralizing knowledge in extracellular vesicle research. Nat Methods. 2017;14(3):228–232. .
- Busatto S, Giacomini A, Montis C, et al. Uptake profiles of human serum exosomes by murine and human tumor cells through combined use of colloidal nanoplasmonics and flow cytofluorimetric analysis. Anal Chem. 2018;90(13):7855–7861.
- Montis C, Zendrini A, Valle F, et al. Size distribution of extracellular vesicles by optical correlation techniques. Colloids Surf B Biointerfaces. 2017;158:331–338.
- Shelke GV, Lässer C, Gho YS, et al. Importance of exosome depletion protocols to eliminate functional and RNA-containing extracellular vesicles from fetal bovine serum. J Extracell Vesicles. 2014;3(1):1–8.
- Paolini L, Orizio F, Busatto S, et al. Exosomes secreted by hela cells shuttle on their surface the plasma membrane-associated sialidase NEU3. Biochemistry. 2017;56(48):6401–6408.
- Vescovi R, Monti M, Moratto D, et al. Collapse of the plasmacytoid dendritic cells compartment in advanced cutaneous melanomas by components of the tumor cell secretome. Cancer Immunol Res. 2019;7(1): 12–28.
- Radeghieri A, Savio G, Zendrini A, et al. Cultured human amniocytes express HTERT, which is distributed between nucleus and cytoplasm and is secreted in extracellular vesicles. Biochem Biophys Res Commun. 2017;483(1):706–711.
- Berardocco M, Radeghieri A, Busatto S, et al. RNA-seq reveals distinctive RNA profiles of small extracellular vesicles from different human liver cancer cell lines. Oncotarget. 2017;8(47):82920–82939.
- Horcas I, Fernández R, Gómez-Rodríguez JM, et al. WSXM: a software for scanning probe microscopy and a tool for nanotechnology. Rev Sci Instrum. 2007;78(1):013705.
- Montis C, Gerelli Y, Fragneto G, et al. Nucleolipid bilayers: a quartz crystal microbalance and neutron reflectometry study. Colloids Surf B Biointerfaces. 2016;137:203–213.
- Zendrini A, Paolini L, Busatto S, et al. Augmented COlorimetric NANoplasmonic (CONAN) method for grading purity and determine concentration of EV microliter volume solutions. Front Bioeng Biotechnol. 2020;7(452):1–10. .
- Paolini L, Radeghieri A, Civini S, et al. The Epsilon Hinge-Ear region regulates membrane localization of the AP-4 complex. Traffic. 2011;12(11):1604–1619.
- Alvisi G, Paolini L, Contarini A, et al. Intersectin goes nuclear: secret life of an endocytic protein. Biochem J. 2018;475(8):1455–1472. .
- Robasky K, Lewis N, Church G. The role of replicates for error mitigation in NGS. Nat Rev Genet. 2014;15(1):56–62.
- Maiolo D, Paolini L, Di Noto G, et al. Colorimetric nanoplasmonic assay to determine purity and titrate extracellular vesicles. Anal Chem. 2015;87(8):4168–4176.
- Jeppesen DK, Fenix AM, Franklin JL, et al. Reassessment of exosome composition. Cell. 2019;177(2):428–445.e18.
- Meister M, Tikkanen R. Endocytic trafficking of membrane-bound Cargo: a flotillin point of view. Membranes (Basel). 2014;4(3):356–371.
- Gutwein P, Mechtersheimer S, Riedle S, et al. ADAM10-mediated cleavage of L1 adhesion molecule at the cell surface and in released membrane vesicles. Faseb J. 2003;17(2):292–294.
- Wei J-H, Zhang ZC, Wynn RM, et al. GM130 regulates golgi-derived spindle assembly by activating TPX2 and capturing microtubules. Cell. 2015;162(2):287–299.
- Ollesch J, Drees SL, Heise HM, et al. FTIR spectroscopy of biofluids revisited: an automated approach to spectral biomarker identification. Analyst. 2013;138(14):4092–4102.
- Barth A. Infrared spectroscopy of proteins. Biochim Biophys Acta - Bioenergy. 2007;1767(9):1073–1101.
- Casal HL, Mantsch HH. Polymorphic phase behaviour of phospholipid membranes studied by infrared spectroscopy. BBA - Rev Biomembr. 1984;779(4):381–401.
- Wold S, Esbensen K, Geladi P. Principal component analysis. Chemom Intellignet Lab Syst. 1987;2(1–3):37–52. June 2001. .
- Thalib L, Kitching RL, Bhatti MI. Principal component analysis for grouped data—a case study. Environmetrics. 1999;10(5):565–574.
- Paolini L, Zendrini A, Radeghieri A. Biophysical properties of extracellular vesicles in diagnostics. Biomark Med. 2018;12(4):383–391.
- Tkach M, Kowal J, The C. Why the need and how to approach the functional diversity of extracellular vesicles. Philos. Trans. R. Soc. B Biol. Sci. 2017;373(1737):20160479.
- Shen B, Wu N, Yang M, et al. Protein targeting to exosomes/microvesicles by plasma membrane anchors. J Biol Chem. 2011;286(16):14383–14395.
- Minciacchi VR, Freeman MR, Di Vizio D. Extracellular vesicles in cancer: exosomes, microvesicles and the emerging role of large oncosomes. Semin Cell Dev Biol. 2015;40(41–51). DOI:10.1016/j.semcdb.2015.02.010
- Brzozowski JS, Jankowski H, Bond DR, et al. Lipidomic profiling of extracellular vesicles derived from prostate and prostate cancer cell lines. Lipids Health Dis. 2018;17(1):1–12.
- Crescitelli R, Lässer C, Szabó TG, et al. Distinct RNA profiles in subpopulations of extracellular vesicles: apoptotic bodies, microvesicles and exosomes. J Extracell Vesicles. 2013;2(1):20677.
- Conley A, Minciacchi VR, Lee DH, et al. High-throughput sequencing of two populations of extracellular vesicles provides an MRNA signature that can be detected in the circulation of breast cancer patients. RNA Biol. 2017;14(3):305–316. .
- Vagner T, Spinelli C, Minciacchi VR, et al. Large extracellular vesicles carry most of the tumour DNA circulating in prostate cancer patient plasma. J Extracell Vesicles. 2018;7(1):1505403.
- Vella LJ, Scicluna BJ, Cheng L, et al. A rigorous method to enrich for exosomes from brain tissue. J Extracell Vesicles. 2017;6(1):1348885.
- Fernandez-Trillo F, Grover LM, Stephenson-Brown A, et al. Vesicles in nature and the laboratory: elucidation of their biological properties and synthesis of increasingly complex synthetic vesicles. Angew Chemie Int Ed. 2017;56(12):3142–3160.
- Lee W, Lenferink ATM, Otto C, Offerhaus HL. Classifying Raman spectra of extracellular vesicles based on convolutional neural networks for prostate cancer detection. J Raman Spectrosc. 2020; 51: 293–300.
- Picciolini S, Gualerzi A, Vanna R, et al. Characterization of different brain-derived subpopulations of plasma exosomes by surface plasmon resonance imaging. Anal Chem. 2018;90(15):8873–8880.
- Di Noto G, Bugatti A, Zendrini A, et al. Merging colloidal nanoplasmonics and surface plasmon resonance spectroscopy for enhanced profiling of multiple myeloma-derived exosomes. Biosens Bioelectron. 2016;77:518–524.
- Daaboul GG, Gagni P, Benussi L, et al. Digital detection of exosomes by interferometric imaging. Sci Rep. 2016;6(1):1–10. .
- Hartjes TA, Mytnyk S, Jenster GW, et al. Extracellular vesicle quantification and characterization: common methods and emerging approaches. Bioengineering. 2019;6(1):7.