
ABSTRACT
The aim of this study was to investigate cell source-dependent nucleic acids repertoire of diverse subpopulations of plasma extracellular vesicles (EVs). Blood plasma from nine healthy volunteers was used for the analysis. Samples of EVs were obtained by differential centrifugation of plasma. The application of high-sensitivity fluorescence-activated vesicles sorting (hs-FAVS) using fluorophore-conjugated anti-CD41-FITC (Fluorescein isothiocyanate) and anti-CD235a-PE antibodies allowed the isolation of three subpopulations of EVs, namely CD41+ CD235a-, CD41-CD235a+ and CD41-CD235a dim. The high purity (>97%) of the sorted subpopulations was verified by high-sensitivity flow cytometry. Presence of nanosized objects in sorted samples was confirmed by combination of low-voltage scanning electron microscopy and dynamic light scattering. The amount of material in sorted samples was enough to perform Quantitative polymerase chain reaction (qPCR)-based nucleic acid quantification. The most prominent differences in the nucleic acid repertoire were noted between CD41+ CD235- vs. CD41-CD235a+ vesicles: the former contained significantly (p = 0.004) higher amount of mitochondrial DNA, and platelet enriched miR-21-5p (4-fold), miR-223-3p (38-fold) and miR-199a-3p (187-fold), but lower amount of erythrocyte enriched miR-451a (90-fold). CD41-CD235a+ and CD41-CD235a dim vesicles differed in levels of miR-451a (p = 0.016) and miR-21-5p (p = 0.031). Nuclear DNA was below the limit of detection in all EV subpopulations. The hs-FCM-based determination of the number of sorted EVs allowed the calculation of per single-event miRNA concentrations. It was demonstrated that the most abundant marker in CD41+ CD235a- subpopulation was miR-223-3p, reaching 38.2 molecules per event. In the CD41-CD235+ subpopulation, the most abundant marker was miR-451a, reaching 24.7 molecules per event. Taken together, our findings indicate that erythrocyte- and platelet-derived EVs carry different repertoires of nucleic acids, which were similar to the composition of their cellular sources.
Introduction
Extracellular vesicles (EVs) in physiological fluids represent a heterogeneous mixture of bilayer membranous structures, with a broad range of sizes, molecular compositions and cell sources [Citation1]. Significantly, even vesicles originating from the same cell type may demonstrate a marked diversity, primarily with respect to nucleic acid (DNA and RNA) profiles [Citation2–Citation4]. Notably, miRNA represents one of the major RNA classes found within vesicles and miRNA-bearing EVs are involved in cell-cell communication, regulating gene expression inside target cells [Citation5]. In addition, it has been shown that the miRNA repertoire may change in various tissues and cell types [Citation6]. However, despite an evident need and rationale to examine miRNA profiles in vesicles subpopulations, this aim remains hardly achievable [Citation7].
Due to the heterogeneity of their molecular contents and functions, the necessary step for a more informative analysis of EVs is the isolation of their individual subpopulations. To this end, various approaches for isolation of EVs have been described [Citation7,Citation8]. Some, e.g. differential centrifugation and gel filtration allow the isolation of particles based on physical properties (size, density etc.), while others rely on separating objects according to their biomolecular composition. A particular vesicle population may be isolated by antibody-based assays using properly chosen biomarker expressed on the surface of vesicles released by specific cell types [Citation7,Citation9]. However, it should be noted that a number of drawbacks are associated with such approaches. Particularly, they neither allow the isolation of vesicles bearing two or more surface protein markers nor the determination of objects size ranges. Isolation via sequential immunocapture using magnetic beads is available but also has limitations. For instance, it does not allow to separate objects with different levels of marker expression [Citation10,Citation11]. High-sensitivity flow cytometry-based methods using fluorescently labelled antibodies against vesicle surface markers are proposed as the most promising approaches for sorting of EVs subpopulations for subsequent analysis of their molecular content [Citation12–Citation14].
High sensitivity flow cytometry (hs-FCM) enables the detection of 100‒200 nm polystyrene beads [Citation15–Citation17] or even 40‒80 nm Au and Ag particles [Citation17]. Moreover, previously van der Pol stated that the minimum detectable vesicle size could be as small as 150‒190 nm for hs-FCM [Citation16], providing new possibilities for deeper analysis of EVs heterogeneity. Multi-colour analysis, positive and negative gating controls as well as evaluation of fluorescence intensity enable experimenters to substantially expand the number of isolatable vesicle subpopulations. Recently, attempts to purify EVs subsets have been made by applying high-sensitivity fluorescence-activated vesicle sorting (hs-FAVS) approaches based on optical processing similar to the hs-FCM approach [Citation18]. In particular, it was used for isolation of apoptotic bodies [Citation19], as well as vesicles bearing on their surface СD9 and epidermal growth factor receptor isoforms [Citation20]. Similarly, a sorting technique was applied to vesicles released by bone marrow mast cells using fluorescently labelled anti-CD9 and anti-CD63 antibodies [Citation12]. Moreover, intracellular vesicles obtained from cerebrospinal fluid, tears [Citation21] or mechanically disrupted MDCK cells were sorted for proteomics analysis [Citation3,Citation22–Citation24]. However, to the best of our knowledge, the nucleic acid repertoire of vesicle subpopulations obtained by hs-FAVS has not been studied previously.
Blood plasma extracellular vesicle sorting has been described in few studies [Citation20]. However, the isolation of EVs from such multi-component physiological fluids remains a challenging task [Citation7] due to the presence of a great number of other nanosized particles that mask the EVs, i.e. lipoproteins, chylomicrons and complexes of antibodies [Citation25]. Moreover, vesicles secreted by diverse cell types are found in the plasma and their number varies considerably. In particular, it was demonstrated that 80% of plasma EVs are derived from platelets [Citation26–Citation28], although erythrocytes being the dominant cell type in the blood.
The development of approaches for targeted isolation of EVs is of special importance, as it will provide an opportunity to investigate subpopulation-specific nucleic acid repertoires and their significance in regulating pathological and physiological processes [Citation2,Citation29].
Objective
To investigate the cell source-dependent nucleic acid repertoires of selected subpopulations of plasma extracellular vesicles isolated using high-sensitivity fluorescence activated vesicle sorting.
Methods and materials
Blood samples
The study was approved by the local Ethics Committee of the Almazov National Medical Research Centre. All volunteers enrolled in the study provided a written informed consent.
Nine volunteers (five males and four females) aged 20–40 years were enrolled. Inclusion criteria were CBC (complete blood count) parameters within reference ranges. Exclusion criteria were acute or exacerbated chronic somatic or infectious diseases.
Fasting peripheral blood samples (8 ml) were collected from the cubital veins of emotionally and physically relaxed volunteers into vacuum tubes containing K3EDTA (Vacutest, KIMA, Italy). Haematological parameters were determined using a Cell-DYN Rudy Haematology Analyser (Abbot, USA) ().
Table 1. Haematological parameters of the volunteers.
Isolation of extracellular vesicles fraction
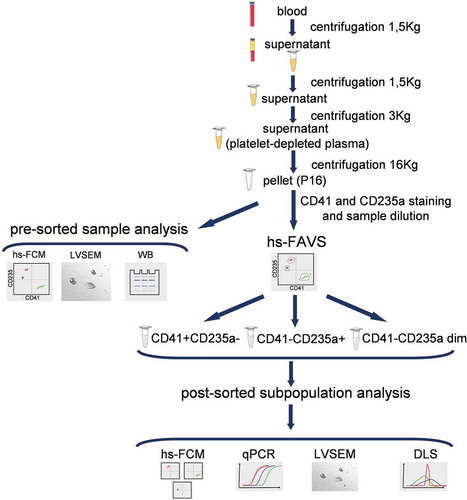
Fraction of EVs was isolated from whole blood by differential centrifugation. A scheme for sample preparation and analysis is shown in . Whole blood samples were centrifuged at 1,500 g for 10 min, followed by transfer of plasma to a new tube that was centrifuged twice – first at 1,500 g for 10 min and then the obtained supernatant was centrifuged at 3,000 g for 10 min. An aliquot of the resulting platelet-depleted plasma (1.5 ml) was used for sedimentation of EVs by centrifugation at 16,000 g for 10 min. The obtained pellet (fraction P16) was resuspended in either 15 µl of phosphate buffered saline (PBS) for examination by immunoblotting and low-voltage scanning electron microscopy (LVSEM) or in 100 µl of PBS for hs-FAVS. Supernatants obtained after centrifugation of platelet-depleted plasma at 16,000 g for 10 min (fraction S16) or at 100,000 g for 120 min (fraction S100) were used as negative controls ().
Figure 1. Study design. hs-FCM – high-sensitivity flow cytometry, LVSEM – low-voltage scanning electron microscopy, WB – Western blot, hs-FAVS – high-sensitivity fluorescence activated vesicle sorting, qPCR – quantitative polymerase chain reaction, DLS – dynamic light scattering.
Low-voltage scanning electron microscopy
The P16 fraction was examined using a Zeiss Merlin electron microscope, according to the method described previously by Kondratov et al. [Citation30].
Immunofluorescence staining
Phenotyping of cell-derived EVs was carried out using CD41 and CD235a as platelet and erythrocyte specific markers, respectively. A 100 μl of P16 fraction was stained with 1 μl anti-CD41-FITC (platelet glycoprotein IIb, F7088, Dako) (100 mg/L) and 1 μl anti-CD235a Glycophorin A RPE (glycophorin A, R7078, Dako) (100 mg/L) antibodies for 20 min in the dark at room temperature. The final concentration of each antibody type was 1 ng/μl.
High-sensitivity fluorescence-activated vesicle sorting
High-sensitivity fluorescence-activated vesicle sorting (hs-FAVS) was performed using a MoFlo Astrios EQ cell sorter (Beckman Coulter, USA) equipped with 200 mW 488 nm, 55 mW 405 nm, and 100 mW 645 nm lasers, as well as a standard filter set optimized for each laser type. Setup and further sorting were performed using a Jet-in-air 70 μm nozzle, pressure 59.7‒60 psi for IsoFlow sheath fluid (Beckman Coulter, USA) and 60.9‒61.1 psi for sample streaming, resulting in no doublets, swarming, or coincidence at a sorting rate of 3,000–8,000 events/s.
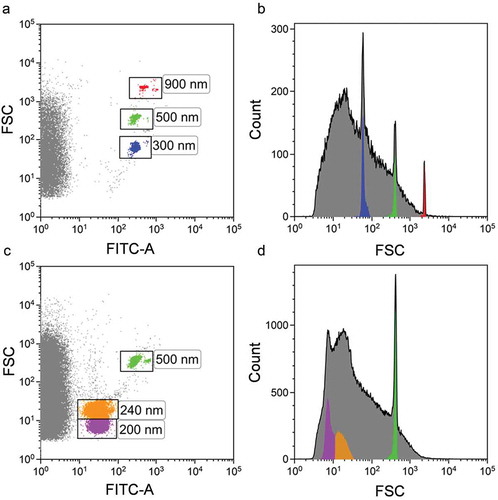
The forward scatter from the 488 nm laser was used as trigger signal to discriminate the noise. Megamix-Plus FSC (100, 300, 500 and 900 nm) (Ref.7802, BioCytex, France) () and Megamix-Plus SSC (160, 200, 240 and 500 nm) (Ref.7803BioCytex, France) () containing FITC-labelled reference beads of various diameters were used for a preliminary setup. FSC and FITC fluorescence channel gains were set so that the beads were visible (). The smallest beads from both kits, 100 nm and 160 nm, could not be visualized. A two-photo amplifier optical electronic processing system measuring FSC1 and FSC2 parameters allowed the detection of polystyrene beads as small as 200 nm. The FSC threshold was set below the 200 nm bead population.
Figure 2. MoFlo Astrios EQ instrumental setup based on Megamix-plus FSC and Megamix-plus SSC reference beads. (a) Megamix-plus FSC reference beads. Dot plot FSC vs. FITC-A. (b) FSC Megamix-plus FSC histogram plot. (c) Megamix-plus SSC reference beads. Dot plot FSC vs. FITC-A. (d) FSC Megamix-plus SSC histogram plot. Beads of specific diameter are highlighted in different colours.
In P16 samples stained with a mixture of anti-CD41-FITC and anti-CD235a-PE antibodies, three subpopulations of events were revealed: CD41+ CD235a-, CD41-CD235a+, and CD41-CD235a dim.
Gates for sorting and analysis of EVs were constructed as follows: lower limits of gates for CD41+ CD235a- and CD41-CD235a dim subpopulations were set above the FITC and PE discriminators, which were determined in the control experiments, described in the control samples and detergent treatment section and presented on Sup. The upper limit of gate for CD41-CD235a dim events was set to distinguish between CD41-CD235a dim and CD41-CD235a+ subpopulations. The upper limits of gates for CD41+ CD235a- and CD41-CD235a+ subpopulations were set just above the distributions of CD41+ CD235a- and CD41-CD235a+ events, respectively.
These subpopulations were sorted into individual tubes, until 40,000 events per sample for each subpopulation were collected. The sorting rate was 400–600/s for CD41+ CD235a- and 15‒30/s for CD41-CD235a+ and CD41-CD235a dim subpopulations. Each sorted sample was resuspended in 200 μl of PBS followed by aliquoting into two 100-μl portions and freezing at −80°С for DNA and RNA isolation.
High-sensitivity flow cytometry
Analysis of EVs was performed using Cytoflex S (Beckman Coulter, USA) flow cytometer equipped with 405 nm (violet), 488 nm (blue), 638 nm (red) and 561 nm (yellow-green) lasers. The flow cytometer instrument setup was performed as described previously [Citation31,Citation32]. The use of a side scatter at the shorter wavelength of 405 nm remarkably lowered the size-specific sensitivity limit for polystyrene beads compared to that of the 488 nm light scatter which signal was attenuated by a neutral density filter in the CytoFlex S.
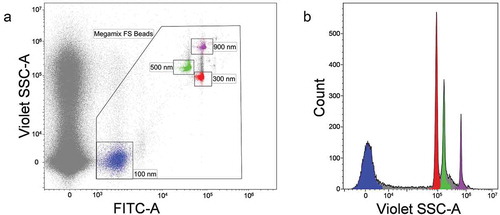
The same Megamix-Plus FITC-labelled beads, as mentioned above, were used for instrument setup (), allowing clear identification of all bead subsets, including those with a 100-nm diameter. The violet SSC was used as a trigger signal to discriminate the noise. Violet SSC and FITC fluorescence channel gains were set so that the 100 nm polystyrene beads were visible as depicted in ). The violet SSC threshold was set below the 100 nm bead population. For the better discrimination of the Megamix-Plus beads gate was constructed to exclude the background noise ()).
Figure 3. Cytoflex S flow cytometer setup based on violetSSC using Megamix-Plus FSC reference beads. (a) FITC-A vs. VioletSSC-A dot plot. Events corresponding to calibration beads are gated within the “Megamix FS Beads” region. Beads of specific diameter are highlighted in different colours. (b) VioletSSC-A histogram plot. Only events from “Megamix FS Beads” region are presented. Violet SSC is presented in the logical scale.
Due to its lower limit of detection, the Cytoflex S flow cytometer and not the MoFlo Astrios EQ cell sorter was used to adjust the dilution factor for preparing samples to avoid particle coincidence [Citation25,Citation33] (Supplementary Materials, Figure 1 Sup), as well as comparing the light scattering intensity for sorted EVs.
The data obtained were analysed using CytExpert v.2.3 (Beckman Coulter, USA) and Kaluza 2.1 (Beckman Coulter, USA) software.
Control samples and detergent treatment
FITC and PE discriminators for both Mo-Flo Astrios EQ and Cytoflex S instruments were determined in the control experiments. Unstained PBS, PBS stained with anti-CD41-FITC and anti-CD235a PE antibodies, donor plasma stained with appropriate fluorophore-conjugated isotype control antibodies and supernatant fraction S100 stained with anti-CD41-FITC and anti-CD235a PE antibodies were used as controls. Control samples were stained as described above and analysed on the MoFlo Astrios EQ and Cytoflex S using the same instrument settings as for the EV samples. Results are presented in the Supplementary Materials, Figure 2 Sup. The gates for positive events for both Mo-Flo Astrios EQ and Cytoflex S were set according to the controls to ensure that no target events were cut off.
To prove that sorted samples contained EVs, additional controls with detergent treatment were performed. Fraction P16 as well as each of the sorted subpopulations was stained with anti-CD41-FITC and anti-CD235a-PE antibodies and phenotyped after incubation at room temperature for 10 min with equal volume of either PBS or 2% Triton X100 in PBS. Results are presented in .
Fluorescence calibration and quantification
PE MESF (Molecules of Equivalent Soluble Fluorophore) beads (cat. 340495, lot. 91367, QuantiBRITETM PE, BD Bioscience, USA) and AlexaFluor 488 MESF beads (cat. 488A, lot 13852, QuantumTM MESF Kits, Quantum AlexaFluor 488, Bangs Laboratories, Inc., USA) with known absolute appropriate fluorescence values for each peak from the respective bead subset were measured. A linear regression analysis of measured mean intensity fluorescence (MIF) and MESF values was performed to determine the best-fit lines and coefficients of determination (R2). The resulting equations were used to convert observed anti-CD235a-PE and anti-CD41-FITC fluorescence into MESF values, respectively. All measurements and calculations were performed according to manufacturers’ recommendations.
Dynamic light scattering (DLS)
A Zetasizer Nano S (Malvern Panalytical, UK) was used to investigate size distribution of objects in sorted samples. Quality of PBS prepared with Milli-Q water was also tested using the instrument. Sorted CD41+ CD235a-, CD41-CD235a+ and CD41-CD235a dim EVs were analysed using standard operation procedures: measurement position – 5.50 mm, attenuator – 11, system temperature – 25ºC, sample equilibration time 60 s. Each sample was measured at three replicates.
The Malvern Zetasizer software v7.13 was used to collect and analyse data with a general-purpose model. Observed populations of particles were characterized by the Z-average (d.nm), polydispersity index (PdI), Peak size (d.nm), % intensity and St. deviation (d.nm).
Immunoblotting
Presence of specific protein markers in fractions P16, S16 and plasma samples was determined using immunoblotting. Sample aliquots were mixed with Laemmli’s buffer and incubated at 100°С for 10 min. Protein concentration was measured by the RC DC Protein Assay (Bio-Rad Laboratories, USA). Equal amounts of proteins for each sample were loaded onto 4–17% gradient polyacrylamide gel. Following electrophoresis, proteins were electro transferred onto nitrocellulose membrane and stained with antibodies against the vesicle marker CD9 (ab65230, Abcam, UK), mitochondrial protein Mitofusin 2 (ab56889, Abcam, UK), and miRNA binding protein Ago2 (ab32381, Abcam, UK). The membrane was then incubated with corresponding secondary antibodies conjugated with horseradish peroxidase (Cell Signalling, USA). Detection was performed using a SuperSignal Substrate (Thermo Fisher Scientific, USA). The signal was registered by the Fusion FX (Vilber, France) imaging system.
DNA isolation
Total DNA was isolated from 100 μl aliquots of the samples using a QIAamp DNA Mini Kit (Qiagen, Germany), according to the manufacturer’s recommendations. DNA was eluted in 100 μl of AE buffer. Prior to isolation, each sample was spiked with an external DNA standard MW2060 as previously described [Citation34].
RNA isolation
Total RNA was isolated using a Trizol LS reagent (ThermoFisher Scientific, USA), according to manufacturer’s recommendations. Aliquots (100 μl) of the samples were mixed with 300 μl of Trizol LS containing carrier (Escherichia coli tRNA E. coli, 3 μg/ml, Sigma R1753) and an external RNA control synth-cel-miR-39-3p (5′-ucaccggguguaaaucagcuug-3′) (synthetic RNA oligonucleotide, which is identical to mature Caenorhabditis elegans microRNA cel-miR-39-3p, 5 fmol/ml, Syntol, Russia). The samples were incubated at room temperature for 10 min followed by addition of chloroform (80 μl). Samples were shaken vigorously for 2 min, and then centrifuged as 16 kg for 10 min. The supernatants were mixed with 200 μl of isopropanol and 0.5 μl of GlycoBlue™ Coprecipitant (AM9516, Invitrogen, USA). After incubation for 10 min, the samples were centrifuged at 16 kg for 30 min. The RNA pellet was washed twice with 1 ml of ice-cold 70% ethanol, air-dried and dissolved in 20 μl of deionized water treated with DEPC (diethyl pyrocarbonate) (D5758, Sigma Aldrich, USA).
Reverse transcription and qPCR quantification
Hydrolysis probe–based TaqMan MicroRNA Assays (Life Technologies, USA) were used to detect target microRNAs: miR-21-5p (Assay ID: 000397), miR-223-3p (Assay ID: 002295), miR-199a-3p (Assay ID: 002304), miR-451a (Assay ID: 001141), and miR-39-3p (Assay ID: 000200). Reverse transcription was performed using TaqMan MicroRNA Reverse Transcription Kit (Life Technologies; catalogue no 4,366,596), according to the manufacturer’s recommendations. Each reverse transcription reaction (total volume 5 μl) contained 2.33 μl of master mix (0.05 μl dNTP Mix 100 mM, 0.33 μl Multi Scribe Reverse Transcriptase (50 U/μl), 0.063 μl RNase Inhibitor 20 units/μl, 0.5 μl 10× RT Buffer, 1.386 μl deionized water), 1.66 μl of RNA solution and 1 μl of miR-specific loop primer.
Reverse transcription of miRNAs was performed in Veriti 96-Well Thermal cycler (Applied Biosystems, USA) by incubating the reaction at 16°C for 30 min, followed by 42°C for 30 min and 80°C for 5 min. MiRNA qPCR amplification was performed using TaqMan Universal Master Mix II (Life Technologies, USA; catalogue no 4440040), and mixture of forward and reverse primers and hydrolysis probe from the corresponding TaqMan MicroRNA Assay (Life Technologies, USA) according to the manufacturer’s recommendations. Amplification of both miRNA and DNA targets was performed using the 7500 Real-Time PCR System (Life Technologies, USA), using the following programme: 95°C for 10 min, followed by 40 cycles of 95°C for 15 s and 60°C for 1 min The specificity of target detection was checked in the control experiments where the reverse transcription step was omitted and no reporter fluorescence above the threshold was registered until cycle 40 of qPCR.
All miRNA Cq data were normalized to the added external synthetic RNA oligonucleotide synth- miR-39-3p. Each normalized Cq was calculated using the formula: CqmiR_norm = CqmiR – (CqmiR-39 – CqmiR-39_median), where CqmiR – represents the target miRNA Cq in this sample, CqmiR-39 – represents miR-39-3p Cq in this sample, and CqmiR-39_median – represents median miR-39-3p Cq across all samples.
Finally, the absolute levels of endogenous target miRNAs were determined by interpolation of normalized Cq values using calibration curves. To construct calibration curves, synthetic RNA oligonucleotides (Syntol, Russia), identical to mature target miRNAs were serially diluted in RNase-free water containing 10 ng/µL of Escherichia coli tRNA (Sigma-Aldrich; catalogue no R1753).
The sequences of synthetic RNA oligonucleotides were as follows: synth-hsa-miR-21-5p (5′-uagcuuaucagacugauguuga-3′), synth-hsa-miR-223-3p (5′-ugucaguuugucaaauacccca-3′), synth-hsa-miR-199a-3p (5′-acaguagucugcacauugguua-3′), synth-hsa-miR-451a (5′-aaaccguuaccauuacugaguu-3′). Calibration curves were constructed by plotting the Cq values versus the logarithm of the total RNA amount loaded in the reverse transcription reaction. Amplification efficiencies of assays were within the acceptable range of 90–110% and Cq values of experimental samples were within the linear ranges of calibration curves.
DNA qPCR amplification was carried out using qPCRmix-HS SYBR+ROX (Evrogen, Russia), and a mixture of forward and reverse primers (Syntol, Russia) according to the manufacturer’s recommendations. For DNA targets, each qPCR amplification reaction (total volume 25 μl) contained 10 μl of DNA. Cytochrome C oxidase subunit 3 (CO3) gene and high-copy repetitive sequence Alu were selected as markers of mitochondrial and nuclear DNA, respectively. Sequences of primers to detect mitochondrial and nuclear DNA markers as well as external DNA standard MW2060 are listed in Supplementary Table 1. All DNA Cq data were normalized to the added external DNA standard MW2060 as described above for miRNA Cq normalization. Relative levels of target DNA were calculated according to the formula: 2(Cq no_template – Cq sample), where Cq no_template – Cq represents the condition where no template was added to the amplification reaction, and Cq sample – Cq represents the condition where sample DNA was added to the amplification reaction.
Calculation of per-event target miRNA amount
We calculated per-event target miRNA amount according to the known number of events in sorted samples (40,000 events/sample). Given that half of the sample (20,000 events) was used for RNA isolation, and the RNA was dissolved in 20 µl of water, with each 1 μl of RNA sample containing RNA isolated from about 1,000 events. Accordingly, qPCR amplification was performed from about 1,660 events, since 1.66 μl of RNA was used for the reverse transcription reaction. Thus, to calculate the per-event amount of each miRNA, the absolute amount in the amplification reaction was divided by 1,660.
Statistical analysis
Statistical analysis of the data was carried out using Statistica 7.0 and GraphPad Prism 5 software. The data are presented as median (Ме) values and interquartile range (25;75%). Statistical analysis of unmatched data was performed with U-Mann-Whitney test. Statistical analysis of matched data was performed with W-Wilcoxon test. Two-sided p values < 0.05 were considered statistically significant.
Multivariate comparison was performed using a discriminant functional analysis followed by a forward stepwise method. A stepwise analysis enumerating steps, p value significance level and F-test was performed. A discrimination level was evaluated by assessing Wilks’ lambda. Significance criteria were determined by generating scatterplots based on canonical values and calculating a classification value as well as the Mahalanobis squared distance.
Results
Isolation of EV fraction from whole blood
EVs were isolated from healthy volunteers’ blood by differential centrifugation procedure shown in . Fraction P16, used as input sample for vesicle sorting, was characterized in more detail. LVSEM confirmed the presence of near-spherical objects with diameters ranging from 10 to 500 nm (), arrowheads, arrows). Control PBS buffer did not contain such near-spherical objects ()).
Figure 4. P16 fraction analysis. (a) Visualization of nanosized objects in P16 fraction and control PBS buffer using low-voltage scanning electron microscopy (LVSEM). Arrowheads and arrows indicate nanosized near-spherical objects in P16 fraction. (b) Immunoblotting based detection of CD9, Mitofusin2 and Ago2 proteins in platelet-depleted plasma and its fractions S16 and P16.
Immonoblotting demonstrated that the P16 fraction contained the vesicular marker CD9, microRNA binding protein Ago2 [Citation35,Citation36], and mitochondrial outer membrane integral protein Mitofusin 2 ()). CD9 protein was also present in S16 fraction and platelet-depleted plasma.
Isolation and characterization of erythrocyte- and platelet- derived EV subpopulations
Staining of P16 fraction with anti-CD41-FITC and anti-CD235a-PE antibodies enabled the identification of three subpopulations of EVs: CD41+ CD235a-, CD41-CD235a+, and CD41-CD235a dim (), presort sample). Sorting gates were set to isolate these subpopulations using hs-FAVS.
Figure 5. Purity and detergent sensitivity of extracellular vesicle populations performed using MoFlo Astrios EQ sorter. (a) Presort (first column) and post-sort phenotyping of CD41+ CD235a- (second column), CD41-CD235a+ (third column) and CD41-CD235a dim (forth column) EV subpopulations without (top row) and with Triton X100 treatment (bottom row). To make the figures more representative, all coupled pictures (before and after Triton X100) were normalized to the number of displayed events. (b) Values of the sorting purity and detergent sensitivity of EV subpopulations.
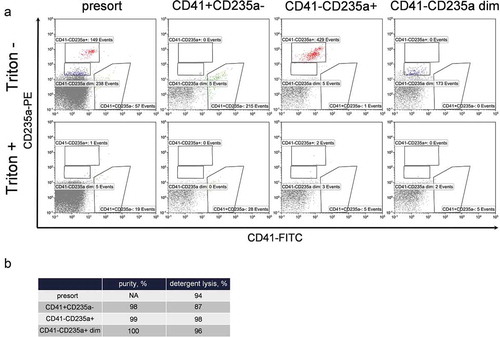
Analysis of the sorted samples using hs-FCM demonstrated that CD41+ and CD235a positive events were clearly separated (), top row), ensuring the high purity (>97%) of the isolated subpopulations ()). Treatment with Triton X100 demonstrated that the majority of the gated events in the presort sample as well as in sorted subpopulations were sensitive to detergent, confirming their membranous nature ()).
hs-FCM was used to determine light scatter characteristics of the identified vesicle subpopulations. The CD41-CD235a+ subpopulation had a much narrower side scatter intensity distribution compared to CD41-CD235a dim and CD41+ CD235a- subpopulations. Moreover, the CD41-CD235a+ subpopulation had a higher mean side scatter intensity compared to CD41-CD235a dim subpopulation ()). Notably, the differences described above were not detected in the analysis of forward scatter characteristics ().
Figure 6. Characterization of vesicle subpopulations in P16 fraction and sorted samples. (a) Dot plot of side scatter versus forward scatter intensity of vesicles subpopulation in P16 fraction. (b) Corresponding violet SSC intensity histogram. (c) Corresponding FSC intensity histogram. CD41-CD235a+ is highlighted in red, CD41+ CD235a- in green, CD41-CD235a dim in blue. (a, b, c) Subfigures demonstrate data obtained using Cytoflex S cytometer. (d) Plot of size distributions of objects in sorted subpopulations and (e) values of corresponding parameters determined by DLS. (f). Visualization of nanosized objects in sorted subpopulations using low-voltage scanning electron microscopy.
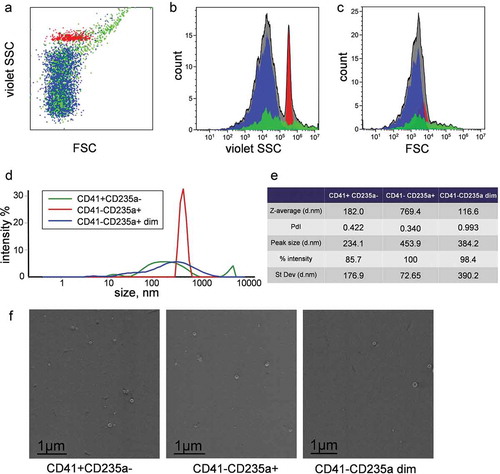
DLS analysis showed that the CD41-CD235a+ subpopulation was characterized by relatively low overall polydispersity (PdI = 0.340) (), while the size distribution of sorted CD41+ CD235a- and CD41-CD235a dim EVs was broader (PdI = 0.422 and 0.993, respectively) (). The presence of nanosized objects in all sorted subpopulations was confirmed by LVSEM ()).
Determination of absolute numbers of fluorophore molecules per labelled extracellular vesicle
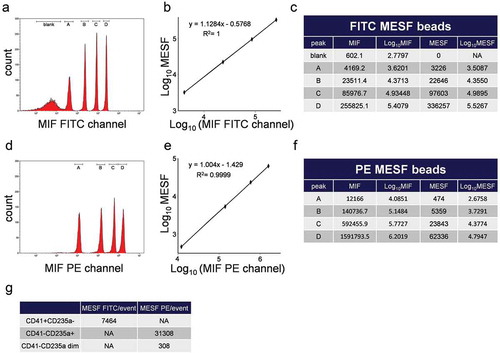
The use of MESF beads allows the quantification of the number of fluorophore molecules being detected per vesicle [Citation37]. Using the same Cytoflex S settings as for EV analysis we measured two sets of MESF beads – AF 488 (five bead subsets) using FITC detection channel ()) and PE (four bead subsets) using PE detection channel ()). MIF of MESF beads was measured, and linear regression analysis of the obtained data () was applied to convert the observed fluorescence from fluorophore-conjugated anti-CD41 and anti-CD235a antibodies into MESF values. These calculations led to the following results: CD41+ CD235a-, CD41-CD235a+ and CD41-CD235a dim EV subpopulations containing, on average, ~7,464, ~31,308 and ~308 molecules of fluorophore per event, respectively ()).
Figure 7. Calculation of MESF values for subpopulations CD41+ CD235a-, CD41-CD235a+ and CD41+ CD235a dim events produced using Cytoflex S cytometer. (a) MIF of each peak of calibration beads detected in FITC channel. (b) A linear regression analysis of Log10 MIF and Log10 MESF values for beads detected in FITC channel. (c) Calculation of Log10 of the MIF and FITC MESF values. (d) MIF of each peak of calibration beads detected in PE channel. (e) A linear regression analysis of Log10 MIF and Log10 MESF values for beads detected in PE channel. (f) Calculation of Log10 of the MIF and PE MESF values. (g) Calculations of the number of MESF per event for each of the investigated subpopulations.
Quantification of nucleic acids in sorted EV subpopulations
Total DNA and RNA were isolated from sorted EV subpopulations. Nucleic acid levels were quantified by qPCR.
The most prominent differences in the nucleic acid repertoire were noted between CD41+ CD235- and CD41-CD235a+ EVs (): the former contained significantly (p = 0.004) higher amounts of miR-21-5p (4-fold), miR-223-3p (38-fold) and miR-199a-3p (187-fold), but a lower amount of miR-451a. CD41-CD235a+ and CD41-CD235a dim vesicles differed in levels of miR-451a (p = 0.016) and miR-21-5p (p = 0.031) ()). Nuclear DNA (Alu) was below the limit of detection in almost all sorted samples ()). In contrast, mitochondrial DNA (CO3) was detectable, being the highest in the CD41+ CD235- subpopulation. Levels of mitochondrial DNA in CD41-CD235a+ and CD41-CD235a dim subpopulations were 29-fold (p = 0.004) and 16-fold (p = 0.03) lower, respectively ().
Figure 8. A comparison of the miRNA and DNA repertoire in sorted extracellular vesicles. Plots show absolute levels of (a) MiR-451a, (b) MiR-21-5p, (c) MiR-223-3p and (d) MiR-199a-3p per 1000 events. Plots show relative quantity of (e) nuclear DNA (Alu) and (f) mitochondrial DNA (CO3).
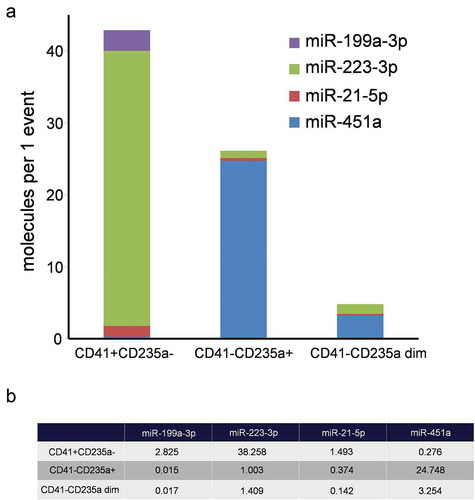
Per-event miRNA concentration analysis demonstrated that the most abundant marker in the CD41+ CD235a- subpopulation was miR-223-3p reaching 38.2 molecules per event. In the CD41-CD235+ and CD41-CD235 dim subpopulations the most abundant marker was miR-451a, reaching 24.7 and 3.3 molecules per event, respectively ().
Figure 9. A comparative characterization of per-event miRNA levels of sorted EVs. (a). Structural histogram of CD41+ CD235a-, CD41-CD235a+ and CD41-CD235a dim EV miRNA repertoires. (b) Per-event miRNA levels.
Statistical analysis of differences between sorted EV subpopulations
A stepwise discriminant analysis was performed to characterize the separation of the sorted EV subpopulations. Measured levels of four miRNAs and mitochondrial DNA were included in the analysis as variables, and the significant differences between the groups of sorted samples were demonstrated (). The characteristics of the individual nucleic acid markers are presented in . The overall Wilks’ Lambda was 0.04624 implying a strong discrimination between EV subpopulations.
Table 2. A stepwise discriminant analysis data.
Figure 10. Stepwise discriminant analysis of sorted CD41+ CD235a-, CD41-CD235a+, and CD41-CD235a dim subpopulations of extracellular vesicles based on their miRNA repertoires.
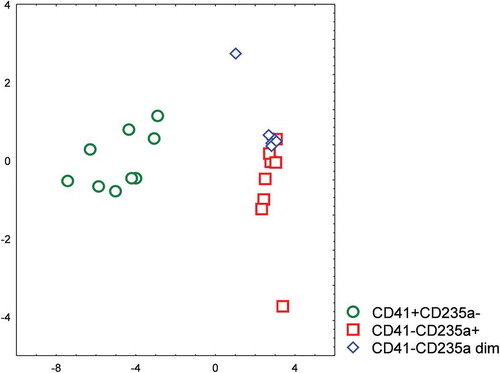
In particular, it was shown that CD41+ CD235a- and CD41-CD235a+ populations differed markedly, whereas lower differences were observed between CD41-CD235a dim and CD41-CD235+ vesicles.
Discussion
Knowledge about EVs continues to grow, and it is increasingly becoming evident that they exhibit a high level of heterogeneity [Citation2,Citation3]. In this study, we describe the application of hs-FCM and hs-FAVS in combination with LVSEM and DLS for phenotyping, enumeration, isolation and characterization of platelet- and erythrocyte-derived subpopulations of EVs from human blood. Subpopulation-specific differences in the levels of selected microRNA and DNA markers were determined by qPCR.
According to the intensity of fluorescence from anti-CD41 and anti-CD235a antibodies, three subpopulations of vesicles were revealed in P16 fraction by hs-FCM. It is likely that the CD41+ CD235a- subpopulation was derived from platelets, while the CD41-CD235a dim was derived from erythrocytes [Citation38,Citation39] or reticulocytes [Citation40] and CD41-CD235a+ subpopulation could represent erythrocyte ghosts or large fragments of erythrocyte membranes [Citation38,Citation39].
Besides the intensity of anti-CD235a fluorescence, the CD41-CD235a+ subpopulation differed from the CD41-CD235a dim events by having a narrower side scatter intensity distribution and higher mean side scatter intensity. These differences may result from parameters such as size, shape, or refractive index of the CD41-CD235a+ and CD41-CD235a dim events. Differences in the size of particles between these two subpopulations were supported by the DLS data, which showed that CD41-CD235a+ events had larger mean particle diameter and lower overall polydispersity.
It should be noted that CD41+ CD235a- subpopulation demonstrated large range of light scatter intensity, which may reflect high heterogeneity of shape, size and content of platelet-derived vesicles [Citation4,Citation38,Citation41–Citation44].
Analysis of MESF beads revealed the number of antibody-conjugated fluorophore molecules per event. We then used these data to estimate the number of surface antigens CD41 and CD235a on the vesicles of each subpopulation. Assuming fluorophore:antibody and antibody:surface antigen ratios of 1:1, respectively, suggested that CD41+ CD235a- vesicles carried ~7,000 molecules of CD41 receptor, while CD41-CD235a+ and CD41-CD235a dim vesicles carried ~30,000 and ~300 molecules of CD235a receptor, respectively. Unfortunately, only the PE:antibody ratio is known to be 1:1, according to manufacturer’s specifications. Considering the DLS data on diameters of the sorted vesicles, we estimated the mean surface receptor density in each subpopulation. These calculations led to the following results: surface density of CD41 on CD41+ CD235a- vesicles was ~44 molecules per 1,000 nm2, surface densities of CD235a on CD41-CD235a+ and CD41-CD235a dim vesicles were ~49 and ~0.7 molecules per 1,000 nm2, respectively, indicating that the density of CD235a on the surface of CD41-CD235a dim vesicles was ~70 times lower than that in the CD41-CD235a+ subpopulation. It corresponds to the results of Brisson et al. [Citation38,Citation41] who showed that smaller EVs express less surface receptors than larger ones and that the expression level on smaller EVs may be lower than the detection limit. Previously, Arraud et al [Citation38]. estimated that a 200 nm platelet-derived vesicle and a 100 nm erythrocyte-derived vesicle might carry about 1,000 antigens of CD41 and CD235a, respectively. This assessment corresponds to the following receptor densities: ~8 molecules per 1,000 nm2 for CD41 on platelet-derived vesicles and ~32 molecules per 1,000 nm2 for CD235a on erythrocyte-derived vesicles. Notably, that these estimates and our calculations for CD41+ CD235a- and CD41-CD235a+ subpopulations give values of approximately the same order for surface receptor density.
The amount of RNA and DNA isolated from sorted vesicle subpopulations was enough to perform qPCR-based nucleic acid quantification, making it possible to study the heterogeneity of the nucleic acid composition of the sorted vesicle subpopulations. The most prominent differences in the nucleic acid repertoire were noted between CD41+ CD235- and CD41-CD235a+ vesicles. The CD41+ CD235- subpopulation contained a higher amount of the microRNAs miR-199a-3p, miR-223-3p and miR-21-5p,which are known to be expressed at higher levels in platelets than in erythrocytes [Citation45–Citation47], while the CD41CD235+ subpopulation contained a higher amount of erythrocyte enriched miR451a [Citation45–Citation47]. A heterogeneity at the miRNA level was also found in the two subpopulations of erythrocyte-derived vesicles. Particularly, the levels of miR-451a and miR-21-5p, were 7.6-fold and 2.4-fold lower in CD41-CD235a dim vesicles than in CD41-CD235a+ vesicles. This difference in miRNA level cannot be due to only the difference in vesicle size, since the volume of CD41-CD235a dim was only 1.7 times less than that of CD41-CD235a+ vesicles. Analysis of DNA levels supported the miRNA data on cell type-specific repertoire of nucleic acids in different subpopulations of EVs. Platelets, but not erythrocytes [Citation48], contain mitochondria, however, both cell types lack a nucleus. Moreover, platelets were shown to release mitochondrial DNA in EVs [Citation43]. Here, detection of the mitochondrial marker Mitofusin 2 revealed that the presort plasma fraction P16 contained mitochondria. hs-FAVS followed by qPCR analysis enabled the isolation of a particular vesicle subpopulation, CD41+ CD235a-, enriched with the mitochondrial DNA marker.
To achieve high sensitivity for the detection of nuclear DNA, primers specific to Alu-elements comprising hundreds of thousand copies per human genome were applied [Citation49]. The lack of a detectable level of Alu elements in the majority (22 of 27) of the analysed samples is a strong evidence of the absence of nuclear DNA in the three subpopulations of extracellular vesicles derived from a-nucleated cells. However, in few samples, nuclear DNA was detected, which may be explained by the aggregation of the investigated vesicles with nuclear DNA containing structures such as apoptotic bodies.
In summary, nucleic acid quantification demonstrated that the sorted vesicle subpopulations were characterized by distinct nucleic acid repertories, which well correlated with the nucleic acids profiles of the source cell types. Taking into account the differential expression of miR451a between the two subpopulations of erythrocyte-derived vesicles, we hypothesize that at least two distinct mechanisms are involved in the packing of nucleic acids into vesicles in erythrocytes and platelets: (i) miRNAs are transported into vesicles at a concentration similar to their intracellular amount and (ii) the vesicle miRNA level is either enriched or depleted relative to the intracellular level.
To investigate the localization of miRNA within vesicles, aliquots of sorted subpopulations were treated with proteinase and RNAse prior to RNA isolation. Preliminary data indicated that only a portion of vesicle-associated miRNA was protected from RNAse and thus localized inside the phospholipid bilayer membrane. The other portion may have been attached to the vesicle surface in the form of a miR-protein complex. Since the localization of nucleic acids within extracellular carriers affects their regulatory properties, further detailed analysis of the organization of these structures is required.
The collection of equal number of events for each EV population and precise measurement of the absolute miRNA concentration in the samples allowed the assessment of the mean miRNA level for a single vesicle (). In particular, it was found that the CD41+ CD235a- subpopulation contained up to 38 molecules of platelet enriched miR-223-3p per event and CD41-CD235a+ subpopulation contained up to 25 molecules of erythrocyte enriched miR-451a per event.
It should be noted that the number of molecules per vesicle has been previously estimated in several works. Thus the level of miR-1246 in exosomes derived from human neural stem cells was measured [Citation50] using two independent quantification procedures – NTA (nanoparticle tracking analysis) and the qNano system, showing that the level of miRNA-1246 in one exosome was equal to 63 molecules quantified by NTA and equal to 12 molecules by the qNano system.
Investigating human glioma stem cells, Krichevsky et al. came to the conclusion that one copy of miRNA can be found in ~10 EVs [Citation51]. Tewari et al. almost came to the same result investigating EVs from healthy donors derived from plasma, dendritic, mast and ovarian carcinoma cells [Citation52]. The discrepancies with our results can be explained by a number of reasons. The principal difference lies in the methods of EV isolation. Ultracentrifugation at 120 kg [Citation50,Citation52] led to isolation of a very small EVs in contrast to our 16 kg centrifugation, which resulted in EVs with wide size distributions.
Another reason may be the lack of the application of enrichment methods or sorting of target EVs. EV sorting increased the specificity of the study; however, we are aware that in some cases events may not be single EVs but aggregates.
The large differences between procedures observed in the assessment of the number of miRNAs per event could make the presented method preferable for determining EV amount. In the aforementioned publications, NTA was the method for quantification of EV. However, it is known that this method allows the inclusion of EVs that are much smaller than those selected by flow cytometry [Citation53]. Thus, a combination of factors could be responsible for the discrepancies observed in the results.
The question of how many miRNA molecules can be packed into one vesicle can also be raised. It was shown previously, that inside the vesicle, miRNA is present in the form of a protein complex [Citation35], which can be approximated as a sphere with a diameter equal to the miRNA length. If the length of one RNA nucleotide is 0.34 nm, and miRNA consists of 22 nucleotides, the miRNA length will be ~7.5 nm and the volume calculated using the formula V = 4πr3/3 will be ~221 nm3. For a spheroid 100 nm vesicle with a lipid bilayer of 5 nm thickness [Citation54], the internal volume is approximately ~382,000 nm3. Then the problem of determining the maximum number of miRNAs that can be placed in a vesicle corresponds to the mathematical problem of packing equal spheres into three-dimensional space. In the case of random packing, the density of the filled volume is 64% [Citation55]. Thus, the available volume of a 100 nm vesicle is equal to ~244,000 nm3 and its capacity is more than 1,000 miRNA-protein complexes. These calculations support the credibility of our results concerning the miRNA repertoire of a single EV.
A stepwise discriminant analysis was applied to assess the differences between EV subpopulations based on their nucleic acid profiles. It was found that the CD41-CD235a+ and CD41+ CD235a- subpopulations differed markedly. Moreover, it was confirmed that the CD41-CD235a dim subpopulation very distinct, albeit it barely differed from the CD41-CD235a+ subpopulation. Both subpopulations were erythrocyte-derived and had rather similar sizes; however, the differences in the expression levels of CD235a and miR-451a between them indicate potential functional differences between vesicles of the same cell origin.
Our study provides evidence that hs-FAVS represents a useful approach for analysing heterogeneous populations of EVs, because it facilitates enumeration and accurate isolation of specific subpopulations of EVs in amounts sufficient for subsequent nucleic acid profiling. The application of hs-FAVS made it possible to reveal that erythrocyte- and platelet-derived EVs from blood plasma carry different repertoires of DNA and microRNA.
Limitations
The approach we used has the following limitations, which should be taken into consideration when drawing conclusions from the data:
Samples purity: the pre-sort sample may contain traces or residual platelets; the post-sort sample may be contaminated with traces of non-target events.
Particle aggregation: may lead to the formation of particles bearing combination of different cell-type specific markers, which lowers yield of target events and results in the contamination of the sorted sample with non-target events.
Conclusions
The application of hs-FAVS allowed to isolate different EV subpopulations of high purity.
The amount of sorted EVs was enough to isolate RNA\DNA and perform qPCR-based nucleic acid quantification.
The hs-FAVS-based determination of the number of sorted EVs allowed the calculation of per single event miRNA concentrations.
Erythrocyte- and platelet-derived EVs carry different repertoires of nucleic acids.
Supplemental Material
Download Zip (776.7 KB)Acknowledegments
Low-voltage scanning electron microscopy was performed at the facility of the Interdisciplinary Resource Center for Nanotechnology, Saint-Petersburg State University, Russia.
Dynamic light scattering was performed at KDSI, Saint Petersburg, Russia. The authors are grateful to Sergey Vasin who kindly helped to perform this analysis.
Disclosure statement
The authors declare no conflict of interest.
Supplementary material
Supplemental data for this article can be accessed here.
Additional information
Funding
References
- van Niel G, D’Angelo GRG. Shedding light on the cell biology of extracellular vesicles. Nat Rev Mol Cell Biol. 2018;19(4):213–17.
- Tkach M, Kowal J, Théry C. Why the need and how to approach the functional diversity of extracellular vesicles. Philos Trans R Soc Lond B Biol Sci. 2018;373(1737):20160479.
- Ferguson SW, Nguyen J. Exosomes as therapeutics: the implications of molecular composition and exosomal heterogeneity. J Control Release. 2016;228:179–190.
- Boilard E, Duchez AC, Brisson A. The diversity of platelet microparticles. Curr Opin Hematol. 2015;22(5):437–444.
- O’Brien J, Hayder H, Zayed Y, et al. Overview of MicroRNA biogenesis, mechanisms of actions, and circulation. Front Endocrinol (Lausanne). 2018;9(402). DOI:10.1097/IJG.0b013e31815a343b
- Sood P, Krek A, Zavolan M, et al. Cell-type-specific signatures of microRNAs on target mRNA expression. Proc Natl Acad Sci. 2006;103(8):2746–2751.
- Mateescu B, Kowal EJK, van Balkom BWM, et al. Obstacles and opportunities in the functional analysis of extracellular vesicle RNA – an ISEV position paper. J Extracell Vesicles. 2017;6(1):1286095.
- Yu LL, Zhu J, Liu JX, et al. A comparison of traditional and novel methods for the separation of exosomes from human samples. Biomed Res Int. 2018;2018. DOI:10.1155/2018/3634563.
- Pugholm LH, Revenfeld ALS, Søndergaard EKL, et al. Antibody-based assays for phenotyping of extracellular vesicles. Biomed Res Int. 2015;2015. DOI:10.1155/2015/524817.
- Mathias RA, Simpson RJ, Tauro BJ, et al. Two distinct populations of exosomes are released from LIM1863 colon carcinoma cell-derived organoids. Mol Cell Proteomics. 2012;12(3):587–598.
- Ji H, Chen M, Greening DW, et al. Deep sequencing of RNA from three different extracellular vesicle (EV) subtypes released from the human LIM1863 colon cancer cell line uncovers distinct mirna-enrichment signatures. Chen C, ed. PLoS One. 2014;9(10):e110314.
- Kormelink TG, Arkesteijn GJAA, Nauwelaers FA, et al. Prerequisites for the analysis and sorting of extracellular vesicle subpopulations by high-resolution flow cytometry. Cytom Part A. 2016;89(2):135–147.
- Goldenring JR, Jerome WG, Li C, et al. Use of fluorescence-activated vesicle sorting for isolation of Naked2-associated, basolaterally targeted exocytic vesicles for proteomics analysis. Mol Cell Proteomics. 2008;7(9):1651–1667.
- McConnell RE, Higginbotham JN, Shifrin DA, et al. The enterocyte microvillus is a vesicle-generating organelle. J Cell Biol. 2009;185(7):1285–1298.
- Camacho V., Toxavidis V., Tigges JC. Characterization of extracellular vesicles by flow cytometry. In book:Lobb, R., & Mo, A. (2017). Extracellular Vesicles. (W. P. Kuo & S. Jia, Eds.), Extracellular Vesicles (Vol. 1660). New York, NY: Springer New York. https://doi.org/10.1007/978-1-4939-7253-1.
- van der Pol E, Coumans FAWW, Grootemaat AE, et al. Particle size distribution of exosomes and microvesicles determined by transmission electron microscopy, flow cytometry, nanoparticle tracking analysis, and resistive pulse sensing. J Thromb Haemost. 2014;12(7):1182–1192.
- Welsh JA, Kepley J, Rosner A, et al. Prospective use of high-refractive index materials for single molecule detection in flow cytometry. Sensors (Switzerland). 2018;18(8). DOI:10.3390/s18082461
- Weiss R, Gröger M, Rauscher S, et al. Differential interaction of platelet-derived extracellular vesicles with leukocyte subsets in human whole blood. Sci Rep. 2018;8(1):1–11.
- Atkin-Smith GK, Paone S, Zanker DJ, et al. Isolation of cell type-specific apoptotic bodies by fluorescence-activated cell sorting. Sci Rep. 2017;7(August2016):1–7.
- Higginbotham JN, Zhang Q, Jeppesen DK, et al. Identification and characterization of EGF receptor in individual exosomes by fluorescence-activated vesicle sorting. J Extracell Vesicles. 2016;5(1). DOI:10.3402/jev.v5.29254
- Pieragostino D, Lanuti P, Cicalini I, et al. Proteomics characterization of extracellular vesicles sorted by flow cytometry reveals a disease-specific molecular cross-talk from cerebrospinal fluid and tears in multiple sclerosis. J Proteomics. 2019;204:103403.
- Cao Z, Li C, Higginbotham JN, et al. Use of fluorescence-activated vesicle sorting for isolation of Naked2-associated, basolaterally targeted exocytic vesicles for proteomics analysis. Mol Cell Proteomics. 2008;7(9):1651–1667.
- Turchinovich A, Drapkina O, Tonevitsky A. Transcriptome of extracellular vesicles: state-of-the-art. Front Immunol. 2019;10. DOI:10.3389/fimmu.2019.00202.
- Kim KM, Abdelmohsen K, Mustapic M, et al. RNA in extracellular vesicles. Wiley Interdiscip Rev RNA. 2017;8(4):e1413.
- Nolan JP, Jones JC. Detection of platelet vesicles by flow cytometry. Platelets. 2017;7104(March). DOI:10.1080/09537104.2017.1280602
- Avenue G. Cell-derived microparticles in the pathogenesis of. Arterioscler Thromb Vasc Biol. 2011;31(1):4–9.
- Azevedo LCP. Microparticles and exosomes: are they part of important pathways in sepsis pathophysiology? Sev Sepsis Septic Shock a Serious Kill InTech. 2012. DOI:10.5772/32009.
- de Vooght KMK, Lau C, de Laat PPM, et al. Extracellular vesicles in the circulation: are erythrocyte microvesicles a confounder in the plasma haemoglobin assay? Biochem Soc Trans. 2013;41(1):288–292.
- Willms E, Johansson HJ, Mäger I, et al. Cells release subpopulations of exosomes with distinct molecular and biological properties. Sci Rep. 2016;(February):1–12. DOI:10.1038/srep22519.
- Kondratov KA, Petrova TA, Mikhailovskii VY, et al. A study of extracellular vesicles isolated from blood plasma conducted by low-voltage scanning electron microscopy. Cell Tissue Biol. 2017;11(3):181–190.
- Fedorov A, Kondratov K, Kishenko V, et al. Application of high-sensitivity flow cytometry in combination with low-voltage scanning electron microscopy for characterization of nanosized objects during platelet concentrate storage. Platelets. 2019;1–10. DOI:10.1080/09537104.2019.1599337.
- Wisgrill L, Lamm C, Hartmann J, et al. Peripheral blood microvesicles secretion is influenced by storage time, temperature, and anticoagulants. Cytom Part A. 2016;89(7):663–672.
- Nolan JP. Flow cytometry of extracellular vesicles: potential, pitfalls, and prospects. Curr Protoc Cytom. 2015;2015(July):13.14.1–13.14.16.
- Baysa A, Fedorov A, Kondratov K, et al. Release of mitochondrial and nuclear DNA during on-pump heart surgery: kinetics and relation to extracellular vesicles. J Cardiovasc Transl Res. 2019;12(3):184–192.
- Li L, Zhu D, Huang L, et al. Argonaute 2 complexes selectively protect the circulating MicroRNAs in cell-secreted microvesicles. PLoS One. 2012;7(10):e46957.
- Laffont B, Corduan A, Pĺe H, et al. Activated platelets can deliver mRNA regulatory Ago2•microRNA complexes to endothelial cells via microparticles. Blood. 2013;122(2):253–261.
- Görgens A, Bremer M, Ferrer-Tur R, et al. Optimisation of imaging flow cytometry for the analysis of single extracellular vesicles by using fluorescence-tagged vesicles as biological reference material. J Extracell Vesicles. 2019;8(1). DOI:10.1080/20013078.2019.1587567
- Arraud N, Gounou C, Turpin D, et al. Fluorescence triggering: A general strategy for enumerating and phenotyping extracellular vesicles by flow cytometry. Cytom Part A. 2016;89(2):184–195.
- Arraud N, Linares R, Tan S, et al. Extracellular vesicles from blood plasma: determination of their morphology, size, phenotype and concentration. J Thromb Haemost. 2014;12(5):614–627.
- Griffiths RE, Kupzig S, Cogan N, et al. Maturing reticulocytes internalize plasma membrane in glycophorin A–containing vesicles that fuse with autophagosomes before exocytosis. Blood. 2012;119(26):6296–6306.
- Brisson AR, Tan S, Linares R, et al. Extracellular vesicles from activated platelets: a semiquantitative cryo-electron microscopy and immuno-gold labeling study. Platelets. 2017;28(3):263–271.
- Marcoux G, Duchez AC, Cloutier N, et al. Revealing the diversity of extracellular vesicles using high-dimensional flow cytometry analyses. Sci Rep. 2016;6(October):1–13.
- Boudreau LH, Duchez AC, Cloutier N, et al. Platelets release mitochondria serving as substrate for bactericidal group IIA-secreted phospholipase a to promote inflammation. Blood. 2014;124(14):2173–2183.
- Marcoux G, Duchez AC, Rousseau M, et al. Microparticle and mitochondrial release during extended storage of different types of platelet concentrates. Platelets. 2017;28(3):272–280.
- Teruel-Montoya R, Kong X, Abraham S, et al. MicroRNA expression differences in human hematopoietic cell lineages enable regulated transgene expression. PLoS One. 2014;9(7). DOI:10.1371/journal.pone.0102259
- Juzenas S, Venkatesh G, Hübenthal M, et al. A comprehensive, cell specific microRNA catalogue of human peripheral blood. Nucleic Acids Res. 2017;45(16):9290–9301.
- Max KEA, Bertram K, Akat KM, et al. Human plasma and serum extracellular small RNA reference profiles and their clinical utility. Proc Natl Acad Sci. 2018;115(23):E5334–E5343.
- Snyder GK, Sheafor BA. Red blood cells: centerpiece in the evolution of the vertebrate circulatory system. Am Zool. 1999;39(2):189–198.
- Wang C, Huang S. Nuclear function of Alus. Nucl (USA). 2014;5(2):131–137. .
- Stevanato L, Thanabalasundaram L, Vysokov N, et al. Investigation of content, stoichiometry and transfer of miRNA from human neural stem cell line derived exosomes. PLoS One. 2016;11(1):1–13.
- Wei Z, Batagov AO, Schinelli S, et al. Coding and noncoding landscape of extracellular RNA released by human glioma stem cells. Nat Commun. 2017;8(1). DOI:10.1038/s41467-017-01196-x
- Chevillet JR, Kang Q, Ruf IK, et al. Quantitative and stoichiometric analysis of the microRNA content of exosomes. Proc Natl Acad Sci. 2014;111(41):14888–14893.
- Kondratov KA, Golovkin AS, Fedorov AV. Methods for investigation of extracellular vesicle subpopulations. Tsitologiya. 2018;60(7):487–497.
- Finean JB, Coleman R, Green WG, et al. Low-angle x-ray diffraction and electron-microscope studies of isolated cell membranes. J Cell Sci. 1966;1(3):287–296.
- Coxeter HSM, Conway JH, Sloane NJA. Sphere packings, lattices and groups. Vol. 96, New York, NY: Springer New York; 2006. DOI: 10.2307/2323992.