
 ?Mathematical formulae have been encoded as MathML and are displayed in this HTML version using MathJax in order to improve their display. Uncheck the box to turn MathJax off. This feature requires Javascript. Click on a formula to zoom.
ABSTRACT
Extracellular vesicles (EVs) have been showcased as auspicious candidates for delivering therapeutic cargo, including oncolytic viruses for cancer treatment. Delivery of oncolytic viruses in EVs could provide considerable advantages, hiding the viruses from the immune system and providing alternative entry pathways into cancer cells. Here we describe the formation and viral cargo of EVs secreted by cancer cells infected with an oncolytic adenovirus (IEVs, infected cell-derived EVs) as a function of time after infection. IEVs were secreted already before the lytic release of virions and their structure resembled normally secreted EVs, suggesting that they were not just apoptotic fragments of infected cells. IEVs were able to carry the viral genome and induce infection in other cancer cells. As such, the role of EVs in the life cycle of adenoviruses may be an important part of a successful infection and may also be harnessed for cancer- and gene therapy.
Introduction
Cells secrete small membranous particles termed extracellular vesicles (EVs) into their environment with a plethora of biological activities, including cell-to-cell communication and disposal of harmful molecules [Citation1,Citation2]. As EVs are emerging as a novel mode of intercellular cargo delivery, increasingly more roles have become associated with them in health and disease. Viral infection of the host cells has been shown to alter the EVs they secrete, which we refer to as infected cell-derived EVs (IEVs) in this article. These IEVs can carry stress signals and molecules of viral origin that may facilitate or even directly mediate the spread of the infection [Citation3–Citation10]. Previous work on EVs and viruses has mostly focused on enveloped viruses, such as Epstein-Barr viruses, HIV, hepatitis B virus and others [Citation3,Citation5,Citation8–Citation13]. Certain enveloped viruses are known to use mechanisms similar to the EV biogenesis for the production of new virions from infected cells [Citation5,Citation14]. This has led to the hypothesis that these viruses may hijack the EV secretion pathway for the purpose of creating viral particles resembling EVs, undetectable by the host immune system [Citation15]. IEVs have also been shown to play roles in the dispersal and possibly pathogenesis of non-enveloped virusus of the Picornaviridae and Reoviridae families [Citation16–Citation21]. IEVs carrying these viruses (either whole virions or viral RNA) are somethimes referred as “quasi-enveloped viruses” and they can target immune cells in addition to their common hosts, hence assisting the virus to evade immune responses [Citation22].
Viruses have emerged as therapeutic tools in gene- and cancer therapy due to their efficiency in delivering cargo to target cells. Yet, they are susceptible to eradication by the immune system and/or may cause a severe immune response. As such, reducing the negative effects of immunity may play a crucial step in the advancement of viral therapeutics. To achieve this, IEVs could be utilized to protect the virus from the immune system [Citation23,Citation24]. Furthermore, like EVs, IEV-hidden viruses could be more specific in targeting certain tissues [Citation25–Citation29] and acquire multiple entry pathways into the targeted cells [Citation30–Citation34]. Recent studies have shown that IEVs carrying oncolytic adenoviruses (Ad) could be used as novel therapeutics for the treatment of cancer [Citation23,Citation35] and that IEVs carrying adeno-associated viruses (AAV) may serve as enhanced tools for gene therapy [Citation24,Citation36,Citation37]. In the present work, we compared IEVs secreted by PC-3 prostate- and A549 lung cancer cells infected with an oncolytic Ad, Ad5/3-D24-GMCSF [Citation38], to the control EVs (cEVs) secreted by the non-infected cancer cells (cEVs). We found that, while cEVs and IEVs were strikingly similar in almost every aspect investigated, the major difference between the two populations was the increased viral cargo in the IEVs as the infection progressed. Importantly, these IEVs were able to infect other, autologous cancer cells. The IEVs were produced already at the early phase of the infection, when the cells’ viability had not yet been compromised, suggesting that Ad may transmit infection via IEVs even prior to the lytic release of viruses. These results indicate that in addition to the Ad capsid, IEVs provide an alternative vector for the viral genome.
Results
IEVs are secreted by infected cells both at the early and late stages of infection
To investigate whether cancer cells could secrete infective IEVs, the cells were infected with Ad5/3-D24-GMCSF virus and the cell-conditioned medium (CCM) containing the IEVs was collected after a cytopathic effect was observed under the microscope. Ad5/3-D24-GMCSF is an oncolytic serotype Ad5 virus expressing an Ad3 fibre knob for enhanced uptake and granulocyte-macrophage colony-stimulating factor (GMCSF), which is used to promote the antitumor immune response [Citation38]. For separating the IEVs from free Ad in the cell culture medium, we sought to take advantage of their differences in density. Ad have a reported density of approximately 1.21 g/mL in iodixanol [Citation39], while EVs have been reported to be lighter: approximately 1.01–1.20 g/mL, depending on their source [Citation40,Citation41]. After fractionation with the iodixanol gradient, cytotoxic fractions were identified by viability assay and examined by cryo-transmission electron microscopy (cryo-TEM) (). Initially, a top-loaded sucrose density gradient with a differential centrifugation protocol was applied and fractions were analysed for cytotoxicity and distributions of small particles, total protein and viral cargo (Supplementary Figure 1). However, due to the presence of impurities and inadequate separation of IEVs from free viruses as shown by cryo-TEM imaging (Supplementary Figure 2), a bottom-loaded iodixanol gradient was employed. Fractionation with free virions purified from infected cells was inspected in order to identify the fractions they occupy (). As expected, fractions with a density of 1.21 g/mL or heavier in the iodixanol gradient (fractions 7–10) were found to possess a clear cytotoxic effect, confirming the presence of free virions.
Figure 1. Cryo-TEM imaging of cEVs and IEVs isolated with an iodixanol gradient. (a) To identify the fractions containing free Ad virions, purified virions were loaded into the iodxianol gradient and separated into 10 fractions. A549 cells were incubated for 72 hours with equal volumes of each fraction from the gradient. Based on their cytotoxicity, fractions 7–10 were found to contain virions. (b) Gravimetrically determined densities of the different fractions. (c and d) IEV samples were collected five days after the initial infection and fractions 3–5 that were found to be cytotoxic, were pooled together for imaging. All vesicles displayed similar, heterogenous structures regardless of origin (c: PC-3 and d: A549). Representative images of IEVs from three individually prepared samples from both cell lines are presented, with 41 A549 IEVs and 98 PC-3 IEVs identified and analysed from 178 and 179 images, respectively. (e and f) The pellets resulting from the initial centrifugation at 15,000 g of the infected CCM (e: PC-3, f: A549) were also imaged by cryo-TEM. In addition to vesicles similar to those detected in c and d, intact virions (red arrow) and large cellular debris were observed. 152 images were analysed in e, and 60 images in f. In a, statistical significance was assessed using one-way ANOVA with Tukey’s HSD post hoc test and denoted by grouping with letters: for all variables with the same letter, the difference between the means is not statistically significant.
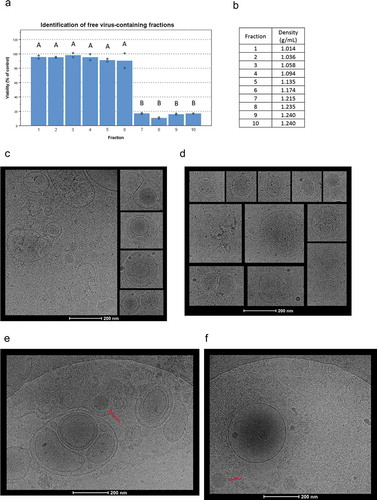
For cryo-TEM imaging, samples were collected after five days from the initiation of infection and IEV fractions 3–5 were pooled together as they were identified as the most cytotoxic ones and had a lighter density than the fractions containing the free virus. cEVs were not found to be cytotoxic, instead they had a viability increasing effect (Supplementary Figure 1D and E), consistent with our previous results [Citation42]. Detailed morphological imaging of IEVs by cryo-TEM did not reveal any differences between the vesicles from Ad-infected PC-3 and A549 cells or cEVs (; Supplementary Figure 1). IEVs from both cell lines were highly heterogeneous regarding their size, shape and electron density, consistent with earlier reports and characteristic of EVs regardless of their source [Citation43,Citation44]. Most of the vesicles had a spherical shape, while few were also observed to havefused, multivesicular or completely irregular shapes. Additionally, a higher electron density in some of the vesicles indicated a higher concentration of proteins or other biomolecules inside. In light of a previous report by Ran et al. [Citation23] describing infective extracellular microparticles, we used cryo-TEM imaging to further analyse the pellet of cell debris that was produced during IEV purification by centrifugation at 15,000 g (). These samples were found to contain large membrane fragments, free virions and vesicles of various sizes resembling the IEVs purified with iodixanol density gradient. Additionally, a single, large membrane structure was identified containing an apparently intact virion and capsid fragments, presented in . This is similar to what Ran et al. had described earlier, but no other such structures or vesicles containing virions were found in the studied samples.
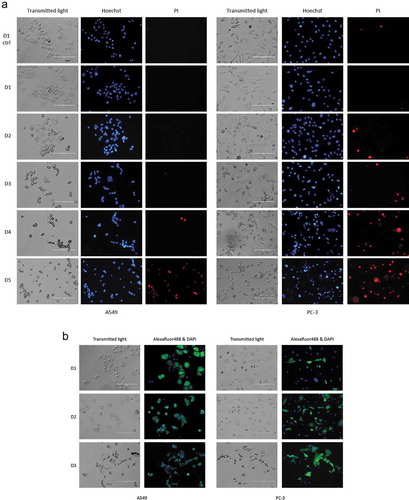
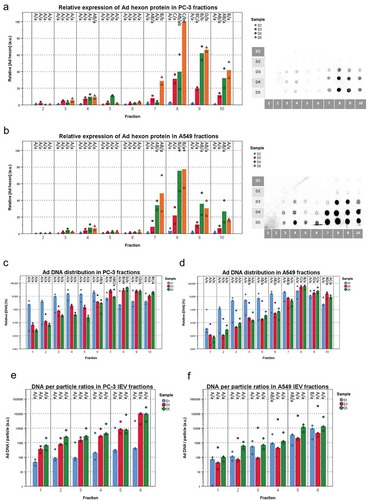
Samples were also collected every 24 hours after the initial infection (samples day (D) D1–D5) to determine when the first infective IEVs were secreted (). Since some of the IEVs could be derived from infected, dying cells, and their cytotoxicity could be explained by other cytotoxic cargo, such as apoptosis promoters or Ad death protein, we also assessed whether the IEVs could actually infect cells with the viral DNA. For this, cells were treated with D1 or D3 IEVs and TEM was used to inspect for the presence of virions forming in the nuclei of IEV treated cells. Indeed, after incubation with the D1 and D3 IEV samples, virions could be seen in the nuclei of both PC-3 and A549 cells (), demonstrating that IEVs can act as conveyers of Ad infection. Remarkably, the cytotoxic effect in the IEV fractions appeared already in D1 samples, collected only 24 hours after the infection. At this stage, the cells did not yet display any signs of cell death (), which is considered a prerequisite for Ad release [Citation45,Citation46]. In the subsequent samples from D2, the cells began to display signs of early apoptosis, including cell rounding and nuclear condensation [Citation47], which progressed up to D5, when virtually all of the cells had died and become detached from the surface. The D1 samples from the PC-3 cells appeared to be less cytotoxic than the samples from D2 to D5. This may be related to the observation that, compared to A549 cells, fewer PC-3 cells began to express the viral hexon protein at D1, as indicated by the immunofluorescence staining of the viral coat protein in the infected cells (). Thus, the amount of D1 IEVs and their viral cargo may be smaller, hence resulting in a less cytotoxic effect in comparison to the later time points and A549 derived D1 IEVs.
Figure 2. IEVs separated from free virions are able to infect cells. (a and b) The iodixanol gradient purification of IEVs was performed for samples produced at different time points after the initial infection of the cells. Cytotoxicity of the 10 fractions was assessed using the sample originating cell lines as the recipients. In addition to the free virus containing fractions, also lighter fractions 2–6, corresponding to the fractions where IEVs, were found cytotoxic. (c–e) In order to clarify, whether IEVs could induce the formation of new viruses in recipient cells, the cells were incubated with an autologous IEV fraction 4 of D1 and D3 and imaged using TEM. In both cell lines (c: A549 after 48 h with IEV fraction D3, d: PC-3 after 24 h with IEV fraction D3 and e: A549 after 48 h with IEV fraction D1), viruses (red arrows) were found in the nuclei of the treated cells. The nuclear membrane is shown in the images with a white arrowhead. In a and b, the median viability compared to the untreated control cells is presented with individual results, with sample size N = 3. Statistical significance was assessed with one-way ANOVA with Tukey’s HSD post hoc test in a and b, and denoted by grouping with letters: for all variables with the same letter, the difference between the means is not statistically significant. If two variables have different letters, they are significantly different. Uppercase letters denote fractions of the same time point while lower case letters denote different time points of each fraction. Additionally, statistically significant difference to the non-treated control samples is denoted with an asterisk. p-values of statistically differing samples are listed in Supplementary Figure 5.
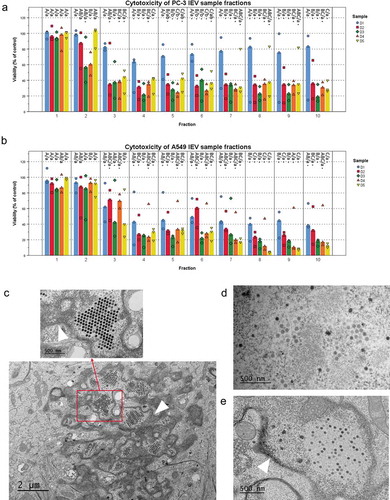
Figure 3. IEV producing cells start to show signs of apoptosis after two days from the initial infection. (a) A549 and PC-3 cells were infected with the Ad and their viability was assessed by inspection of cell morphology (transmitted light) and staining with Hoechst 3342 (Hoechst, blue) for nuclear condensation and propidium iodide (PI, red) for membrane permeability every 24 hours after the initial infection. At D1, based on nuclear staining and cell morphologies, no clear difference was found compared to the control cells, while cells from D2 to D5 started to show an in increase in cell rounding, nuclear condensation (bright, fragmented nuclei) and membrane permeability (PI positive). (b) Immunofluorescence staining of Ad hexon coat protein in the cells showed that a larger population of A549 than PC-3 cells expressed the viral protein at D1. Regarding cell death and hexon-positively stained cells, the outcome was the same for both cell lines by D3, when most cells were found to be dead or dying. Representative images of results are shown (three independent experiments in a and two in b).
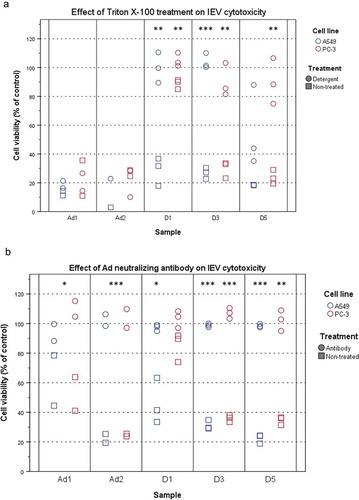
Even with density gradient purification, virions could be co-purifying with the IEVs by association to their surface during isolation. To assess this, the samples were tested for detergent resistance. Triton X-100 is commonly used for isolating Ad from infected cells, as the detergent lyses all cellular membrane structures, including EVs [Citation48], retaining the Ad intact. The IEV samples and control virions were treated with Triton-X 100 and ultracentrifuged on top of an iodixanol cushion to separate any surviving virions from the detergent and the pellets were tested for cytotoxicity (). As expected, Ad virions were found to be resistant to the treatment with no significant effect on their cytotoxicity. IEVs on the other hand, lost their cytotoxic effect after the treatment, and thus their infectivity could not be explained by the presence of virions, with the exception of A549 D5 samples, which retained a significant portion of their cytotoxicity. Additionally, it was assessed, whether IEVs are resistant to Ad neutralizing antibodies (). This should be the case if the IEVs are encasing infective viral components. However, it was found that IEVs are completely inactivated by the antibody just like free virions, suggesting that while they may not contain intact virions, the infectivity of IEVs is dependent on Ad proteins and that those proteins are on the outer surface of IEVs.
Figure 4. IEVs are sensitive to detergent treatment and Ad neutralizing antibody. (a) Detergent treatment. IEVs and Ad controls (Ad1: 5 × 10⁸ particles, Ad2: 5 × 10⁹ particles) were treated with 0.1% (w/v) Triton X-100 (circles), purified by ultracentrifugation and their cytotoxicity towards autologous cells was assessed, along with non-treated samples (squares). Free virions resulted in 65–90% loss of viability. In contrast to free virions, IEVs lost their cytotoxicity by the detergent treatment, with the exception of D5 A549 samples, which retained some of their effect. (b) The susceptibility of IEVs and Ad controls to Ad neutralizing antibody. Samples were treated with an Ad neutralizing antibody for one hour (circles) and their cytotoxicity towards autologous cells was assessed, along with non-treated samples (squares). As with Ad controls, IEVs lost their cytotoxicity after the antibody treatment. Results with individual samples are presented, with statistical significance assessed using paired two tailed Student’s t-test comparing cell viability values of each sample pair without and after treatment. Results with Ad controls from both cell lines were analysed together. Significant differences between non-treated and treated samples are denoted with asterisks: *: p < 0.05, **: p < 0.01 and ***: p < 0.001. p-values of statistically differing samples are listed in the Supplementary Figure 6.
IEVs are structurally similar to normal EVs
Next, the IEV fractions were screened with nanoparticle tracking analysis (NTA) to estimate the concentration of particles and their size distributions combined with a total protein assay (; Supplementary Figures 2G and 3G). Particles ranging from 50 to 500 nm from both infected and non-infected cell cultures were found to be enriched in the top fractions 1–6, corresponding to densities of 1.014–1.174 g/mL, with a peak of IEV numbers at fractions 3 and 4. The protein per particle ratio calculated for each IEV fraction showed consistent values of 1–2 mg 10−13 particles in fractions 1–4 of PC-3 derived EV/IEV samples from each day and approximately 2–5 mg 10−13 in fractions 5 and 6 (). Analysis of the particle size distributions from all fractions revealed that IEVs were very similar in size to cEVs with increasing size along the progress of infection, with representative size distributions of fraction 4 presented in . Some variation in size was also observed as a function of density (Supplementary Figures 3 and 4), with larger particles present in fractions 3 and 4 than in others. Vesicles of similar size were also observed in the cryo-TEM images from both cell lines (), demonstrating that the particles analysed by NTA were indeed vesicles. Variation in the amount of particles isolated from both cell lines at different time points is presented in , with combined particle yields from fractions 1–6 and fractions 7–10 separately. With PC-3 samples, the median IEV yields seemed to increase as the infection progressed until dropping at D5, while in A549 samples the median IEV yields increased after D2 and remained stable until D5. In fractions 7–10 the median particle yields seemed to increase through D1–D5 with both cell lines.
Figure 5. IEVs and control EVs have similar sizes and a density dependent protein content. The particle concentrations (a and b) were measured from each fraction of IEV and cEV samples and presented as relative concentrations compared to the other fractions of each sample. All of the samples showed a peak in particle concentration at fractions 3 and 4, corresponding to the IEVs and cEVs. In cEV preparations, the particle was more significant due to the longer production time. (c and d) Protein per particle ratios were calculated using total protein and particle concentrations for each IEV and cEV fraction. These values were found to be consistent across D1–D5. Although the denser fractions seemed to have a higher value, there were no statistically significant differences due to the small sample size. The size distribution of fraction 4 from each sample (e and f) is presented as a representative fraction of the IEVs and cEVs. The median particle diameter was 100–150 nm in each sample, with the mean size growing at later time points. Additional size distributions for fractions 1–6 presented in Supplementary Figures 2 and 3 together with the total protein distributions of each sample. For each sample, data is presented as medians with individual results, with N = 3 for each sample. Statistical significance in a–d was assessed using one-way ANOVA with Tukey’s HSD post hoc test, denoted by grouping with letters: for all variables with the same letter, the difference between the means is not statistically significant. If two variables have different letters, they are significantly different. Uppercase letters denote fractions of the same time point while lower case letters denote different time points of each fraction. p-values of statistically differing samples for particle and protein concentrations are listed in the Supplementary Figures 7 and 8, respectively.
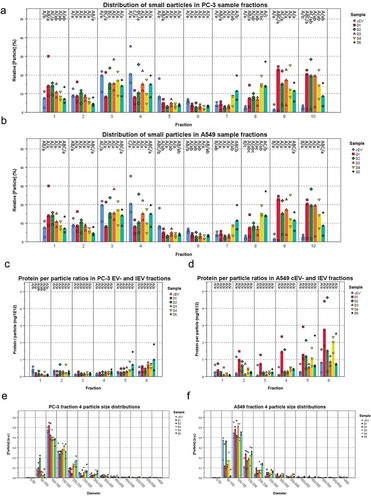
Figure 6. Particle yields increase as the infection progresses. (a and b) Total particle yields for each time point were calculated separately for fractions 1–6 representing the IEVs, and fractions 7–10 containing free virions and large impurities. Total yields were normalized across all time points of each experiment and are presented as relative particle yields, with individual yields (N = 3) and their median for each time point. The overall trend was that particle yields increased along the progression of the infection, although the variation between samples was high. Statistical significance was assessed using one-way ANOVA with Tukey’s HSD post hoc test, denoted by grouping with letter: time point samples with no significant difference are given the same letter, capitalized for fractions 1–6 and lower case for fractions 7–10. p-values of statistically differing samples are listed in the Supplementary Figure 9.
To investigate how the infection of the cells is reflected in the total IEV population they secrete, the expression of some of the ubiquitous EV proteins (Hsp70, TSG101, CD9 and CD81) along with α-tubulin representing a cellular housekeeping protein and GM130, a protein of the golgi apparatus, were assessed by western blot analysis from pooled fractions 1–6. These were compared to their respective cell lysates (). In general, compared to the cell lysates, IEVs and cEVs contained fewer soluble proteins and were enriched in the membrane proteins CD9 and CD81. Out of the soluble proteins, Hsp70 and TSG101 were the most prominently expressed in IEVs and cEVs, though TSG101 staining showed only very weak or undetectable bands in A549 samples. There was significant variation between the expressions of different protein markers between samples D1 and D5. cEV and D1 samples seemed to contain very low levels of any of the proteins analysed, while IEVs from later time points were more prominent. In PC-3 samples, D2–D4 produced the strongest bands of the EV associated proteins Hsp70, TSG101, CD9 and CD81, while in the A549 D2–D4 samples the band intensities contained less variation, with an increase of Hsp70 in D4 and D5 and CD9 in D5 IEVs. D3–D5 IEVs from both cell lines also showed very faint bands of GM130, suggesting the presence of vesicles from apoptotic cells in those samples, since golgi proteins are not normally associated with EVs. The cell lysates showed reduction in the expression of virtually all of the analysed protein markers, except for Hsp70, which was expressed more when compared to α-tubulin. The expression of membrane proteins in the cell lysates however seemed to be increased due to the infection, especially CD9 in A549 and CD81 in PC-3 as they were undetectable in the control cells. The heavier fractions 7–10 that were excluded from the IEV pools were also analysed for the same markers, showing little to no proteins in D1 and D2 samples, but D3–D5 contained bands from most of the markers, including also prominent GM130 bands. This suggests for the presence of cellular debris in the samples.
Figure 7. Characterization of the IEV protein cargo for EV markers. (a and b) Commonly EV-associated proteins Hsp70, TSG101, CD9 and CD81 along with GM130 and α-tubulin were analysed by western blotting from the pooled fractions 1–6 of cEVs and IEVs or cell lysate (CL) of PC-3 (a) and A549 (b) cells. Also fractions 7–10 from IEV samples were analysed. Representative blots are shown with three independent samples of IEVs/cEVs and two independent samples of CL and fractions 7–10. While other protein markers seemed to be depleted from the IEVs and cEVs, membrane proteins CD9 and CD81 were enriched in those samples. (c and d) the samples were also analysed by stain-free SDS-PAGE, showing a distinct pattern of proteins in both pools of fractions 1–6 and 7–10 when compared to CL.
In addition to the western blot analysis of these markers, the overall protein size profile of the samples was assessed by SDS-PAGE (). While the cell lysates contained a more diverse distribution of differently sized proteins, the staining patterns of the cEV and IEV samples from both cell lines showed intense smeared bands between the 100 and 55 kDa markers as well another sharper band of approximately 25 kDa. While these patterns might be typical to EVs, samples of fractions 7–10 showed a similar pattern, suggesting that it is not strictly EV-specific. In addition, a band of approximately 130 kDa appeared in the samples after the infection, corresponding to the Ad hexon protein, with its intensity increasing in the IEV and Fr.7–10 samples over the progression of the infection.
IEVs carry viral DNA and proteins reflecting the stage of infection
To evaluate the differences regarding the viral load between the IEVs secreted at different stages of the infection (D1–D5), the expression of viral proteins and viral DNA () were assessed from each fraction. At almost all of the time points, fractions 7–10, containing the free virus, harboured more hexon protein () and viral DNA () than the IEV fractions. D1 and D2 IEVs showed also much lower or undetectable amounts of Ad hexon protein compared to D3–D5. The peak in hexon concentrations in IEVs appeared to follow the same pattern as particle concentrations (), with an apparent peak in fraction 4. The D1 samples contained much less hexon protein and DNA in the free virus fractions than at the later time points. This is in line with the observation that the cells had not yet been lysed and thus released the virions (), suggesting that the hexon protein and DNA in D1 fractions 7–10 was from residual viruses left from the initial infection. At later time points (D3 and D5), the amount of DNA and hexon protein in the fractions 7–10 was significantly higher than in the IEV fractions 1–6, indicating the release of viruses from the cells and correlating with evident cytopathic effects. The amount of viral DNA per particle in the IEV fractions depended on the cell line, fraction density and isolation time point. The heaviest D3 and D5 PC-3 IEV fractions contained the most DNA per particle (). These results indicate that the progression of the infection is reflected on the viral cargo of IEVs as well, with a dramatic increase at D3 in the amount of viral proteins when the cells are dying.
Figure 8. Fraction- and time point -based comparisons of viral cargo in IEV fractions. (a and b) The amount of Ad hexon coat protein was assessed from the IEV density gradient fractions D1 – D5 from PC-3 (a) and A549 (b) cell lines by dot blotting. Representative blots are shown from two individual experiments. The intensity values were normalized by setting the highest intensity (usually D5 fr.8) to 100 a.u. (N = 2 for both cell lines). Data is presented as median values with individual results. Due to the low signal, D1 samples were omitted from the graphs. (c and d) The median amount of viral DNA and individual results of each IEV fraction from D1, D3 and D5 are shown for each time point, normalized against the total DNA in the sample set and presented on a logarithmic scale. (e and f) The Ad DNA concentration in d and e was compared to the particle concentrations derived from NTA analysis. Ad DNA per particle values were calculated for each IEV fraction and are presented with individual results with their median on a logarithmic scale. The results show two factors predicting higher DNA/particle values: fraction density and time from infection. All qPCR measurements were performed with primers against Ad E4 gene. In a and b, N = 2 and in c and d, N = 3. Statistical significance was assessed using one-way ANOVA with Tukey’s HSD post hoc test, denoted by grouping with letters: for all variables with the same letter, the difference between the means is not statistically significant. If two variables have different letters, they are significantly different. Uppercase letters denote fractions of the same time point while lower case letters denote different time points of each fraction. p-values of statistically differing samples for hexon amounts and Ad DNA are listed in Supplementary Figures 10 and 11 respectively.
Further characterization of the viral cargo in IEVs is provided in and . For assessing individual Ad proteins, western blot analysis of the viral proteins in pooled IEV fractions (1–6) and cell lysates was performed with a polyclonal anti-Ad antibody (). In line with the dot blot analysis of the hexon protein, the amount of other viral proteins increased with time in the IEVs and in the cell lysates when compared to α-tubulin. In contrast to the cell lysates, the IEVs seemed to contain more of the large (>100 kDa) Ad protein bands corresponding to the hexon protein (108 kDa), while the cell lysates were more enriched in Ad proteins under 70 kDa, corresponding to Ad penton proteins (64 kDa) and protein V (42 kDa). The topological arrangement of Ad proteins on IEVs was also examined by a dotblot analysis with proteinase K (): samples from fractions 3–6 of time points D1, D3 and D5 were treated with proteinase K, cleaving any exposed proteins on the vesicle surface, followed by heat inactivation of the enzyme and dotblot analysis with the polyclonal anti-Ad antibody. Addition of Triton X-100 with proteinase K was used to completely cleave all proteins in the sample to estimate any non-specific binding caused by the presence of inactive proteinase K. Compared to samples without proteinase K treatment, the signal intensity dropped 20–100% in all samples, with the highest drops (approx. 75–100%) occurring in fractions 5 and 6, suggesting that Ad proteins are more exposed in these fractions, although fraction 4 usually had the highest overall intensity. Fractions 1 and 2 were also analysed, but they produced very weak signals that could not be analysed reliably. A control sample with purified free Ad virions resulted in complete eradication of signal as Ad has no lipid membrane to protect itself from the enzyme. PC-3 D1 samples also produced only a weak signal to begin with, as the non-specific binding of antibodies caused by the presence of proteinase K was stronger than the in the samples without treatment themselves (). As the proteinase K background signal in the PC-3 D1 samples was nearly identical to the detergent treated replicates, a complete removal of proteins was estimated. Overall, these results demonstrate that all of the IEV samples analysed contain Ad proteins that are exposed outside the vesicles.
Figure 9. Viral proteins are expressed both on the exterior and interior of IEVs. (a and b) Ad proteins associated with PC-3 (a) and A549 (b) IEVs and cell lysates (CL) were blotted with a polyclonal anti-Ad antibody. Western blots of α-tubulin are presented for comparison as a housekeeping protein. Overall, the band intensities of Ad proteins increased along the progression of the infection without changes in pattern, also in CLs when compared to α-tubulin. In contrast to CLs, IEVs were enriched in proteins of approximately 130 and 110 kDa, corresponding to Ad hexon. (c and d) Dotblot assessment of Ad proteins on the surface of IEVs. IEV fractions 3–6 from time points D1, D3 and D5 were treated with proteinase K to determine the relative loss of signal from polyclonal anti-Ad antibody binding due to proteolytic cleaving of Ad proteins bound to the external surface of IEVs. A control with Triton X-100 was also used with proteinase K to establish the background signal, when complete cleavage of samples had occurred. In all of the samples, a reduction of signal was achieved with proteinase K treatment, with representative blots shown in c and the remaining intensity after proteinase K treatment (without Triton X-100) of each individual sample set presented in d. In a–d, representative blots of two separate experiments are shown. In c and d, only one replicate of A549 D1 samples was analysed, as the second replicate did not produce a sufficient signal for analysis without proteinase K treatment. Additionally, non-treated PC-3 D1 samples produced a very low signal below the background caused by proteinase K treatment. These samples were estimated at complete loss of signal based on the similar signal intensities from proteinase K with and without Triton X-100.
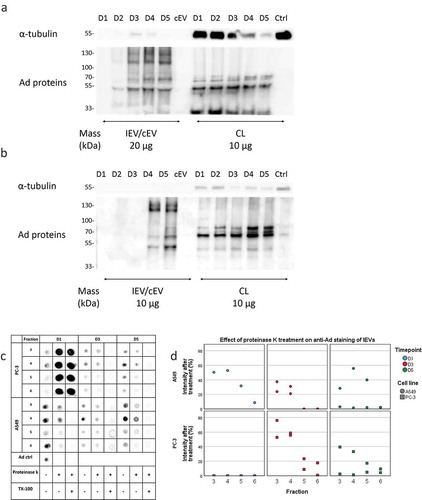
Figure 10. Viral DNA is packed differently in IEVs and free virions. (a) The total viral DNA carried by IEVs was measured from pooled fractions 1–6. A more steadily increasing amount of Ad DNA was found in the IEVs from D1 to D5 in A549 samples, but in PC-3 the increase happened only between D1 and D3 and then remained unchanged. DNA concentrations were standardized against the sum of each time point, with individual results and their median presented. (b) To evaluate whether DNA was protected by the IEV membrane or present externally, pooled IEV fractions 1–6 were treated with proteinase K followed by DNase I to cleave any extravesicular DNA. The DNA concentration was then measured and compared to the untreated controls and expressed as a ratio of the remaining DNA after treatment, with individual results presented on a logarithmic scale. Purified Ad was used as a positive control for the effect of enzyme treatment on the DNA encapsulated in virions and human DNA (GAPDH sequence) was also measured to control the treatment’s effect on DNA from a non-viral source. Proteinase K treatment was performed at +37°C (circles) and at +55°C (squares). Only the treatment at +55°C made the DNA from purified virions accessible to degradation by DNase. Ad genes E4 and E1A from the opposite ends of the viral genome were assessed by qPCR to demonstrate that the whole viral genome was present in the IEV samples. An almost equal ratio of 1:1 of both genes E4 and E1A was measured for both cell lines, suggesting that an intact genome was present. In a, N = 3 for all time points. In b, N = 2 for viral control and N = 3 for all of the IEV samples except for A549 GAPDH, where N = 2 in D1 both conditions and N = 2 in D3 + 55°C due to undetectable concentrations. Statistical significance in a and b was assessed using paired, two-tailed Student’s t-test. In a, statistical significance between different time points is denoted by grouping with letters, giving samples with no significant difference the same letters, A549 in lower case and PC-3 in capitalized. In b, statistical comparison was performed between DNA concentrations obtained with proteinase K treatments at different temperatures, with asterisks denoting p-values of statistical significance: p < 0.05, **: p < 0.01 and ***: p < 0.001. No statistically significant differences were found between the amounts of E4 and E1A DNA in any of the samples. p-values of statistically differing samples are listed in Supplementary Figure 12.
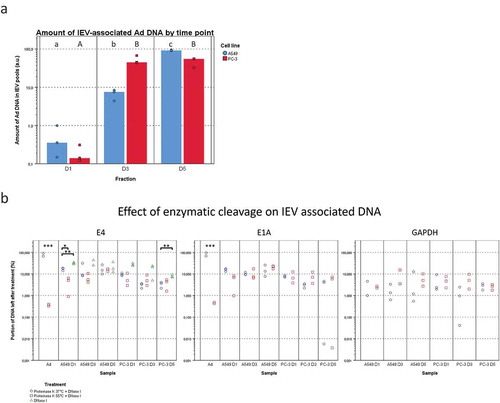
In addition to the Ad proteins, the amount of total viral DNA in IEV pools was compared between D1, D3 and D5 samples (). In A549 samples, the amount of viral DNA associated with the IEVs increased on average by a factor of approximately 19.8 from D1 to D3 and by 14.9 from D3 to D5. In PC-3 samples, the increase in viral DNA amount from D1 to D3 was much higher, 338.4 on average, while there was no significant change from D3 to D5. The presence of a protective EV membrane around the viral DNA against enzymatic degradation was also investigated (). The IEVs were treated first with proteinase K at +55°C to degrade any protective protein structures such as the viral capsid, followed by cleaving of the exposed DNA with DNAse I. As a control, we used purified viruses, which lost virtually all DNA as a result of the treatment, with less than 1% remaining. IEV samples retained on average approximately 5–20% of the viral DNA after the treatment. While this was significantly more than in the free virus control, a 80–95x loss in DNA still seemed drastic. Yet, it could be explained by leaking from the IEVs due to the proteinase K treatment or due to DNA binding to the exterior side of the IEVs. Therefore, since EVs have been reported to carry DNA from the secreting cells [Citation6,Citation49–Citation55], we sought to determine whether the loss in cellular DNA in IEVs was similar to the viral DNA loss. For this purpose, we chose to target the GAPDH-encoding region, since it has been reported earlier to be consistently present in EVs [Citation49]. While the amount of cellular DNA was much lower compared to viral DNA, the resulting loss was comparable, suggesting that they are both associated with the IEVs in a similar manner. Additionally, treatment of IEVs with DNase I without proteinase K resulted in a slightly less extensive loss in DNA as observed with E4 DNA that was tested, with an average loss of approximately 60–85%. This indicates that Ad DNA is not leaking from inside of the IEVs and that it is mostly unprotected by proteins. During the optimization of the DNA cleaving treatment, we found that Ad virions had to be treated with proteinase K at +55°C to release their genomic DNA (gDNA). While it has been reported that incubation of Ad virions at +55°C [Citation56] or at pH 4–5 [Citation57] in itself would result in releasing their DNA, it seemed to be an incomplete process. The treatment of the virions at +55°C and pH 4–5 followed by proteinase K treatment at +37°C and pH 7 was not sufficient to expose the viral DNA, as it remained nearly completely protected from DNase-mediated cleavage. However, the DNA in IEV samples was cleaved with equal efficiency regardless of the treatment temperature, providing further support to the possibility that the DNA in IEVs is not protected by Ad capsids. Furthermore, the samples contained nearly identical amounts of DNA of Ad genes E1A and E4 posited at the opposite sections of the Ad genome, suggesting that IEVs contain the whole intact viral genome, instead of random fragments.
Discussion
The results of this study demonstrate that IEVs, i.e. EVs from Ad infected cells, carry viral DNA and proteins in a manner that allows them to mediate the viral infection to other cells. While this concept of infection mediating IEVs has previously been presented by Ran et al. [Citation23], they focused on large fragments derived from infected, dying cells that were proposed to enclose intact Ad virions. Additionally, Maguire et al. [Citation24] showed that cells infected with AAV released infective EVs containing AAV particles. Based on the present data, we suggest that also another type of small, secreted IEVs exists, which carry Ad cargo without an intact capsid, but are still able to infect cells. The physical properties, such as the size, density and morphology of IEVs were almost identical to those of the normal EVs, and IEVs were sensitive to detergent treatment, to which intact Ad virions are resistant. We were unable to detect any small IEVs containing whole Ad particles in cryo-TEM, suggesting that those vesicles were either rare, or they had a density similar to the free Ad, and as such they were excluded from our analyses of the lighter IEVs. We were also unable to detect the large apoptotic vesicles carrying Ad particles reported by Ran et al. in our IEV preparations. Most likely they were cleared away during our isolation procedure with the large cell debris given their appearance in those pellets, as shown by the cryo-TEM images.
Previous work regarding quasi-enveloped viruses has mainly focused on RNA-viruses. They are assembled in the cytoplasm of the host cell [Citation58,Citation59], whereas Ad particles are formed inside the infected cell’s nucleus and are released by the lysis of the cell [Citation45,Citation46]. Therefore, to be packed into IEVs, intact Ad would have to escape the nucleus after assembly, but prior to cell lysis. While this may be possible, a simpler alternative would be that the infected cells direct viral products (including DNA) to be secreted out from the cell via the IEVs in the same manner to other (potentially harmful) molecules [Citation1,Citation6]. This model also implies an alternative mode of Ad DNA import into its subcellular target, the nucleus, which is normally mediated by the capsid [Citation60]. Indeed, EVs have been reported to deliver functional DNA into healthy cells as well [Citation52,Citation61], suggesting that IEVs could act as a vector for Ad DNA delivery. We also found that approximately 80–95% of the viral DNA was associated with the outer surface of the IEVs and that they could be neutralized with antibodies. Therefore, it is likely that their infectivity is still dependent on the viral proteins exposed on the outer surface of the IEVs and that the Ad DNA is associated with the viral proteins. For example, the Ad hexon protein has been shown to mediate the transport of DNA into the nucleus after endocytosis, which could be blocked by hexon-binding antibodies [Citation62]. Similar results regarding the localization of DNA on EVs has been reported earlier as well [Citation53–Citation55], suggesting that it may be a generally occurring feature of EVs, not limited only to cancerous cells. Taken together, there appeared to be some correlation between cytotoxicity, Ad DNA per particle ratio and Ad protein topology in the different fractions, as fractions 5 and 6 displayed highest values in all of these properties. This would suggest that displaying the most Ad DNA and proteins on the surface of IEVs would result in the highest infectivity. As the intact Ad genome is a very large molecule (26–46 kbp), its packing inside IEVs could be structurally impossible, and therefore its binding via Ad DNA-binding proteins to the exterior of IEVs would solve this issue, with the Ad proteins also acting in transporting the DNA into the nucleus during infection.
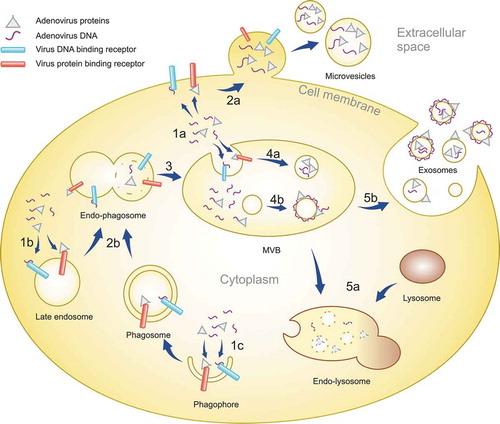
Localization of cargo to the external surface of EVs or IEVs would also point at their endosomal origin, similar to exosomes. Inward budding inside the late endosomes would result in the outer surface of the budding intraluminal vesicles (ILVs) being exposed to the endosomal contents including DNA or Ad proteins as observed in the case of IEVs, illustrated in for a hypothetical mechanism of IEV formation. This would be in contrast to the EVs budding from the plasma membrane, i.e. microvesicles, whose external surface is continuously exposed to the extracellular space, while the intravesicular cargo of both EV types is derived from the cytoplasm. The exosome pathway of IEV formation with viral cargo on their surface would require the viral cargo to enter the late endosome lumen before ILV budding. This could occur via autophagocytosis, a known pathway for cells to dispose of foreign molecules such as cytosolic DNA [Citation63] and viral proteins, which are recognized by receptors including cGAS of the STING pathway [Citation64,Citation65] and other pattern recognition receptor proteins. This suggested process of IEV cargo loading is presented in : the recognition of cytosolic Ad DNA leads to the formation of autophagosomes [Citation65], which fuse with late endosomes after maturing, followed by another fusion with lysosomes for the degradation of autophagocytosed material [Citation63]. In the case of IEV secretion, late endosomes forming ILVs would however fuse with the plasma membrane, releasing the ILVs as the final step of the exosome secretion pathway. Ad hexon is known to change in pH 4–5 into a more lipophilic conformation [Citation66], which could promote its binding to the intraluminal membrane of late endosomes as they are acidic, though Ad hexon has also been shown to bind phosphatidylcholine in neutral pH [Citation67]. Ad hexon would thus be able to serve as a linking protein for other Ad proteins to bind the forming IEVs. These include Ad DNA binding proteins V, VIII and X [Citation68], of which at least protein V could be identified in IEVs in and b in addition to a clear enrichment of hexon in IEVs compared to their respective cell lysates. Cargo loading inside the IEVs is also possible, even though according to our results the vast majority of Ad DNA is bound to their outer surface. This mechanism would require cargo to bind in the cytosolic side of late endosomes or plasma membrane in the exosome and microvesicle secretion pathways, respectively. Proteins such as Lamp2C have been shown to be able to bind DNA [Citation69], and given that Lamp2C is a splice variant of Lamp2, a protein known to be enriched in EVs, it could mediate the loading of cytosolic DNA into IEVs and other EVs.
Figure 11. A schematic representation of the IEV loading mechanism in infected cells. After infection of cells, Ad replication results in the virus DNA and proteins accumulating in the cytoplasm in addition to the nucleus. The viral components are recognized by receptors in plasma membrane, endosomes and forming phagosomes (1a, b and c). EVs budding off from the plasma membrane can entrap viral components localized to the inner surface of the plasma membrane, creating microvesicles with intravesicular viral cargo (2a). Phagosomes fuse with late endosomes (2b), forming endo-phagosomes where the phagosomal contents are released into the lumen of the endo-phagosome. Endo-phagosomes mature to multivesicular bodies (MVB) (3) where additional inward budding generates ILVs with viral components in their lumen (4a). Adsorption of viral components, delivered by phagosomes, to the surface of ILVs generates vesicles with a corona of viral components. MVB contents can be degraded by its fusion with lysosomes (5a). Alternatively, MVB fusion with the plasma membrane releases ILVs as exosomes, with viral components in their lumen and on their surface, to the extracellular space (5b).
As stated above, IEVs were secreted by living cells already prior to the lytic release of mature virions and visible signs of early apoptosis. Based on these observations, we cannot completely exclude the possibility of a few individual infected cells dying during the first 24 hours after the initial infection, leading to the generation of small apoptotic vesicles as a source for the viral load observed in our results. Alternatively, the viral cargo could also end up in the cytoplasm of the cell as a result of a failed infection, and it could be directed to exocytosis via EVs. However, considering the gradual increase in the amount of viral DNA in the A549 IEVs, active secretion of DNA via IEVs by living infected cells appears to provide a more plausible explanation. The total viral DNA load associated with the A549 IEVs at the D1 time point was approximately 20 times lower than at D3 (), when the apoptosis of infected cells had progressed to a clearly visible level (). If the viral DNA would have been dominantly secreted in apoptotic particles, the amount of DNA in the IEVs would have been expected to increase proportionately, as appeared to be the case with PC-3 cells. As the accompanying increase of Ad DNA in PC-3 IEVs from D1 to D3 was well over 300-fold and the DNA secretion stabilized by D5 with the cells dying, it could be determined together with the observation that the Ad DNA per particle ratio also increased (), that dying cells release IEVs with significantly more Ad DNA than living cells. Compared to the early time point (D1 and D2) IEVs, in D3 and later samples the DNA was also accompanied by a much higher amount of viral coat protein. This supports the idea that the portion of IEVs from dying cells contain a notable load of viral proteins and the load increases as the cells start to die in higher numbers.
While some differences were observed in the IEV preparations between the two different cancer cell lines, their overall properties were very similar. In terms of cytotoxicity, the difference between the D1 and later time point PC-3 samples was clearer than in the A549 samples. This may be explained by the relatively low amount of infected cells at that time point due to low expression of the CAR receptor [Citation70,Citation71] and DSG2 [Citation72] in PC-3 cells. The differences in the molecular cargo such as the amounts of hexon, Hsp70, CD9 and CD81 proteins or viral DNA reflected the status of the cells and seemed to be the major separating factor between the IEVs from different time points and cEVs. Regarding the protein markers, D1 IEVs seemed to correspond to a lag-phase type of IEVs. This is in contrast to the other time points, where very little of any of the studied proteins were present, even though the overall protein profiles seemed similar across all time points. The amount of viral DNA and total proteins also appeared to correlate with the vesicle density, which could be explained with proteins and nucleic acids having a relatively high density. Additionally, regardless of infection, the basic morphology of the vesicles remained the same, suggesting that the IEV secretion may be an adaptation from the normal EV secretion where viral molecules are packed in as an additional cargo.
The secretion of IEVs has been suggested by Takahashi et al. [Citation6] to be a defensive strategy deployed by the infected cells to rid themselves of the harmful viral DNA. However, given that the IEVs are able to spread the infection to other cells, this mechanism could instead be hypothesized to be an evolutionary trait of the Ad virus, by which the cell’s natural secretion pathways are exploited to promote viral dispersal. Ad could spread from cell to another undetected, as suggested by the “Trojan horse” theory of EVs and viruses [Citation15], if the EV provides camouflage for the virus. However, our observation was that the IEVs were affected by the Ad neutralizing antibodies, suggesting that as such they will not offer a full cover against the immune response. Nevertheless, IEVs could be important mediators of the infection to neighbouring cells that Ad could not normally enter due to the absence of virus receptors. While IEVs provide a novel paradigm for virus biology as alternative within-host vectors of the viral genome, they might also prove useful in gene and cancer therapy applications. In particular, the production of oncolytic IEVs could be optimized in healthy, non-cancerous cells, for a safe formulation of viruses for intravenous cancer treatment, if they can be effectively hidden from the immune system.
Materials and methods
Cell culture
A549 and PC-3 cells were acquired from the American type Culture Collection and maintained in Ham’s F12k base medium (ThermoFisher Scientific, Massachusetts, USA) supplemented with 10% (v/v) FBS (Gibco,) and 100 units/mL penicillin and 100 µg/mL streptomycin (Gibco, ThermoFisher Scientific), in a 5% CO2 + 37°C environment. Growth medium used for EV/IEV production was prepared with 10% FBS and ultracentrifuged overnight with 110,000 g at +4°C with Optima LE-80 K ultracentrifuge (Beckman Coulter, Brea, CA, USA), rotor SW32Ti (Beckman Coulter), in order to remove any FBS-derived EVs. This EV-free medium was diluted to a final concentration of 5% FBS and changed to cell cultures when they reached approximately 70% confluence. For infecting the cells to induce IEV production, the medium was also supplemented with Ad5/3-D24-GMCSF viruses at a concentration of approximately 30 particles per cell according to NTA.
EV and IEV isolation
cEVs were collected from the CCM after three days of culture, while the medium from infected cells was collected either after five days of uninterrupted incubation or every 24 hours for five days after the initial infection (D1–D5 samples), replacing the collected medium with fresh, virus-free medium. Cells were removed by pelleting them first by centrifugation with 500 g at +4°C for 10 minutes and the resulting supernatant was collected for the isolation of EVs and IEVs.
Iodixanol density gradient centrifugation
IEVs/EVs were purified in a continuous density gradient prepared with iodixanol (Optiprep©, Sigma Aldrich, St. Louis, MO, USA) diluted in DPBS containing 2 mM MgCl2. Following the removal of cells, any remaining debris was removed from the CCM by additional centrifugation with 15,000 g at +4°C for 15 minutes with rotor SW32Ti. The EVs/IEVs were then concentrated from the supernatant by ultracentrifugation at 150,000 g at +4°C for two hours with 200 µL of 45% iodixanol added to the bottom of the centrifuge tube to act as a density cushion. The bottom 3 mL of the supernatant containing the vesicles was then concentrated further to 250 µL by ultrafiltration with Amicon Ultra-15 10 kDa centrifugal ultrafiltration units (MerckMillipore, Burlington, MA, USA) and mixed with 750 µL of 60% iodixanol for bottom-loading of the samples into the following density gradient.
The density gradient was prepared with the diffusion method in a 13.5 mL ultracentrifuge tube by overlaying 4 mL of 45% iodixanol with 4 mL of 25% iodixanol and filling the rest of the tube with DPBS-2 mM MgCl2. The tubes were sealed with parafilm, carefully tipped to a horizontal position and incubated for one hour at RT. After the incubation, the tubes were chilled on ice and 1.5 mL were removed from the top to make room for sample loading. The samples mixed with iodixanol were then loaded through the gradient to the bottom of the tube with a long-nosed glass Pasteur pipette and ultracentrigued at 200,000 g at +4°C for three hours with rotor SW41Ti (Beckman Coulter). After the run 1 mL fractions were collected from the top of the tubes for further analyses, measuring their densities gravimetrically.
Isolation of oncolytic adenoviruses
Ad5/3-D24-GMCSF viral particles were isolated from the dead, infected A549 and PC-3 cells using the iodixanol density gradient based protocol described by Peng et al. [Citation73]. Briefly, the washed, pelleted cells were lysed by four freeze–thaw cycles and the cellular debris was removed by centrifugation with 5000 g at +4°C for 10 minutes. The gradient was prepared into a 13.5 mL ultracentrifuge tube by layering 2 mL of 40%, 3 mL of 25% and 4 mL of 15% iodixanol diluted in DPBS containing 2 mM MgCl2, with the 15% solution containing additional 1 M NaCl. Rest of the tube was filled with the clarified virus-containing cell supernatant and ultracentrifuged at 200,000 g at +4°C for two hours with rotor SW41Ti. The resulting band of viruses just below the 40% and 25% iodixanol interphase was collected and iodixanol was removed by serial ultrafiltration with DPBS, using Amicon Ultra-4 10 kDa ultrafiltration units at +4°C. The size distribution and particle concentrations of the virus preparations was determined with NTA from a heat-inactivated samples incubated at 95°C for 15 minutes.
NTA analysis
The particle concentrations and size distributions of the samples were determined using Nanosight LM-14 instrument equipped with a 405 nm, 60 mW laser (Nanosight, Salisbury, Great Britain) and SCMOS camera (Hamamatsu Photonics K.K., Hamamatsu, Japan). The camera level was adjusted to 15 and measurement time to 60 s. The results were analysed using NanoSight NTA software v3.0., with detection threshold set to 5. Potentially infective samples were inactivated by heating at +95°C for 15 minutes prior to measurement.
Total protein assay
Total protein concentration of samples was measured with Pierce BCA protein assay kit (ThermoFisher Scientific) as instructed by the manufacturer. Background signal caused by sucrose or iodixanol in the EV/IEV preparations was subtracted by measuring corresponding blank samples of gradient medium.
Viability assay of EV/IEV preparations
Cell viability was assessed with AlamarBlue viability assay (ThermoFisher Scientific) as instructed by the manufacturer. Cells were seeded on a 96-well plate at a density of 5000 cells per well in 100 µL of culture medium containing 5% FBS and allowed to attach for one day in the cell incubator. The following day, equal volumes (1–10 µL) of each collected EV/IEV or corresponding blank sucrose or iodixanol fraction was added to the cells and they were incubated for 72 hours. Following the incubation, 10 µL of AlamarBlue reagent was added to each well, the plates were incubated for one to three hours and fluorescence intensities were measured with Varioskan LUX (ThermoFisher Scientific) microplate reader with excitation at 570 nm and emission at 585 nm. Background signal was assessed with cell free wells and the results were compared to non-treated cells, representing 100% viability.
Treatment of IEVs with Ad neutralizing antibody
Eight microlitres of IEV fractions 4–6 were pooled from D1, D3 and D5 for a total volume of 24 µL each, of which 12 µL was mixed with 1 µL of rabbit anti-Adenovirus type 5 antibody (ab6982, Abcam) and the other 12 µL was mixed with 1 µL of DPBS and retained as non-treated control. The samples were incubated for 1 h at room temperature and divided to three wells on a 96-well plate prepared the previous day with 5000 cells per well. The cytotoxic effect of the samples was then assessed with AlamarBlue viability assay after 72 hours as described above.
Detergent treatment of IEVs and Ad
Ten microlitres of IEV fractions 4–6 were pooled from D1, D3 and D5 for a total volume of 30 µL each, of which 15 µL was retained as non-treated controls and the other 15 µL was mixed with 1 mL of 0.1% (w/v) of Triton X-100. For free Ad controls, 5E8 and 5E9 particles were used for both non-treated and Triton X-100 treated samples. The Triton X-100 samples were loaded on top of 10.5 mL of 25% iodixanol-DPBS in 13.5 mL ultracentrifuge tubes and ultracentrifuged at 200,000 g at +4°C for two hours with rotor SW41Ti. The supernatant was aspirated, the pellets were collected in approximately 40 µL of residual supernatant. The samples and their non-treated controls were then divided to three wells on a 96-well plate prepared the previous day with 5000 cells per well, mock controls were treated with an equal amount of 25% iodixanol-DPBS. The cytotoxic effect of the samples was then assessed with AlamarBlue viability assay after 72 hours as described above.
Preparation of cell lysates
Cell lysates were prepared with cell cultures prior to viral infection and every 24 hours after the initial infection. The culture medium containing floating cells was collected and the adherent cells were washed with ice cold DPBS, which was also collected. The cells were collected by centrifugation at 500 g at +4°C for 10 minutes and washed once with ice cold DPBS. Adherent cells were lysed with RIPA buffer (Sigma Aldrich) supplemented with Protease inhibitor cocktail (Sigma Aldrich), scraped and added to the pellet of floating cells. The cells were incubated for 30 minutes at +4°C and centrifuged with 16,000 g for 20 minutes at +4°C, collecting the supernatant and discarding the pellet.
SDS-PAGE and Western blot
Using 0.9 mL of each fraction, fractions 1–6 were pooled representing IEVs and cEVs, with fractions 7–10 representing the impurities. Iodixanol was removed by serial ultrafiltration, using Amicon Ultra-4 10 kDa ultrafiltration units at +4°C, after diluting the samples with DPBS to a total volume of 40 mL. The samples were filtered down to a volume of approximately 500 µL, diluted with 10 mL of DPBS and filtered once more down to 500 µL. SDS was added to a final concentration of 0.1% (w/v) to reduce sample loss due to adsorption to the filter unit prior to collection.
Sample amounts were standardized by total protein assay as described above and prepared with denaturing Laemmli sample buffer in +95°C. For stain-free imaging, the proteins were separated with SDS-PAGE on a 10% Mini-PROTEAN® TGX-Stain free™ Precast Protein Gel (BioRad, Hercules, CA, USA) and imaged with Chemidoc™ MP imaging system (BioRad) using the stain-free UV illumination protocol. For western blotting, the proteins were separated with SDS-PAGE on a 4–20% TGX-Stain free™ Precast Protein Gel (BioRad) and transferred to a polyvinylidene fluoride membrane. The membrane was blocked with 5% (w/v) bovine serum albumin (BSA) in Tris buffered saline-0.1% (v/v) Tween-20 (TBS-T) for one hour at room temperature and cut to strips corresponding to the weight of proteins to be analysed. Each strip was then incubated with primary antibodies diluted in 5% BSA-TBS-T (mouse anti-TSG101 (51/TSG101, 1:500, reducing conditions, BD Biosciences, Frankling Lakes, NJ, USA), mouse anti-Hsp70 (7/Hsp70, 1:500, reducing conditions, BD Biosciences), mouse anti-CD9 (HBM-CD9, 1:1000, non-reducing conditions, HansaBioMed Life Sciences, Tallinn, Estonia), mouse anti-CD81 (HBM-CD81-EM4, 1:500, non-reducing conditions, HansaBioMed Life Sciences), mouse anti-α-tubulin (DM1A, 1:500, reducing conditions, Sigma Aldrich), rabbit anti-GM130 (NBP1-89756, 1:250, reducing conditions, Novus Biologicals, Centennial, Colorado, USA), rabbit anti-Adenovirus type 5 antibody (ab6982, 1:4000, non-reducing conditions, Abcam)) overnight at +4°C. The strips were then washed with TBS-T and incubated with secondary antibody-HRP (ECL™ Anti-mouse IgG, 1:4000, GE healthcare, Little Chalfont, UK) or goat anti-rabbit IgG (G-21234 1:10,000, ThermoFischer Scientific) in TBS-T for one hour at room temperature. The strips were washed with TBS-T and briefly with TBS, incubated for 5 min in ECL substrate (Clarity™ Western ECL Substrate, BioRad) and imaged with BioSpectrum® imaging system (Ultra-Violet Products, Cambridge, UK). Image processing and signal intensity was assessed with imageJ software.
Dot blot analysis
Two microlitres of each density gradient fraction was blotted directly onto a nitrocellulose membrane and allowed to dry. For assessing Ad protein topology on IEVs, 16 µL of each sample was treated at +55°C for 1 hour with 2 µL of proteinase K (20 µg/µL) (ThermoFischer Scientific) + 2 µL of DPBS or 2 µL of 2% (w/v) Triton X-100, while 4 µL of only DPBS was added to control samples, followed by 15 min incubation at +95°C for enzyme inactivation. Low concentration samples were applied up to 5 times on the membrane to increase signal intensity. The membranes were then blocked with 5% (w/v) BSA in TBS-T for one hour at room temperature, followed by overnight incubation at +4°C with the primary antibody (mouse monoclonal anti-Ad hexon protein antibody 8C4, 1:2000, Abcam, or rabbit polyclonal anti-Adenovirus type 5 antibody ab6982, 1:4000) and detection with secondary antibody-HRP as described above.
qPCR analysis of viral DNA
DNA extraction and analysis
gDNA was extracted using NucleoSpin Tissue kit (Macharey-Nagel, Düren, Germany) according to the manufacturer protocol (support protocol (6.5) for gDNA and viral DNA from blood samples). The volumes used for extraction were 200 µL for individual fractions and 150 µL for pooled fractions 1–6 of iodixanol purified samples or 100 µL of individual fractions of sucrose purified samples. qPCR was performed using Maxima Probe/ROX qPCR Master Mix (ThermoFisher Scientific) and LightCycler480 system (Roche, Basel, Switzerland) with following cycling conditions: +95°C for 10 min, 50 cycles of (+95°C for 15 s, +60°C for 1 min). Equal volume of gDNA was used as a template in qPCR, sequences for primers and probes for Ad E4 and E1A were adapted from previous publications [Citation38,Citation74].
Primers:
Table
Proteinase K and DNAse treatments
In order to examine whether the DNA was inside IEVs, 100 µL of pooled fractions 1–6 were treated with proteinase K to free any DNA inside virus capsid, followed by degradation with DNAse I. A sample of purified free virus was used as a control for the treatment. Samples were either first incubated at +55°C with pH adjusted to 4 with 50 mM NaAc and HCl for 30 min, followed by neutralizing pH with NaOH and treatment with 1 mg/ml proteinase K (ThermoFisher Scientific) for 1 h at +37°C, or directly treated with proteinase K at +55°C. Proteinase K was inactivated with 5 mM PMSF for 1 h at +37°C, followed by addition of 5 U of DNase I (ThermoFisher Scientific) and incubation for 1 h at +37°C. Treatment was ended by addition of 1:10 volume of EDTA and incubation of 10 min in +65°C. The samples were then used for gDNA extraction as described above.
Fluorescence microscopy of infected cells
Apoptosis assay with Hoechst 33342 and propidium iodide (PI) staining
Cells were seeded in the wells of a 12 well plate and infected as described above. Every 24 hours following the initial infection the cells were stained with 100 µg/mL of both Hoechst 33342 (ThermoFisher Scientific) and PI (ThermoFisher Scientific), centrifuged with 1000 g for 5 minutes and inspected with EVOS FL Imaging System using DAPI and RFP light cubes.
Immunofluorescence staining of Ad hexon coat protein
Cells were seeded in the wells of a 6 well plate and infected as described above. Every 24 hours following the initial infection the cells were washed with DPBS and fixed with 4% (w/v) paraformaldehyde for 10 minutes at room temperature. The cells were washed with DPBS and permeabilized with 0.1% (v/v) Triton X-100 for 10 minutes, washed three times and blocked in 5% BSA-TBS-T for one hour at room temperature, followed by incubation with anti-Ad hexon protein antibody in 5% BSA-TBS-T (1:2000) overnight at +4°C. After incubation, the cells were washed three times with TBS-T and incubated with goat anti-mouse IgG-Alexa Fluor 488 secondary antibody (ThermoFisher Scientific, 1:200) in 5% BSA-TBS-T for one hour at room temperature, washed with TBS-T three times and incubated with 1 µg/mL of DAPI (ThermoFisher Scientific) for one minute. The cells were washed with TBS and inspected with EVOS FL Imaging System using DAPI and GFP light cubes. Negative controls were prepared with non-infected cells with the complete staining protocol for non-specific binding and infected cells without staining for auto fluorescence background.
TEM of IEV-treated cells
Two lakh cells were seeded on top of EM grade 0.1 mm coverslips in 6 well plates and on the following day they were treated with 10 µL of IEV fraction 4 obtained with iodixanol density gradient. After one or two days of incubation the cells were fixed with 2% (v/v) glutaraldehyde for 20 minutes at room temperature. The cells were washed two times with 0.1 M Na-phosphate buffer pH 7.0 and osmicated with 1% OsO4 in 0.1 M NaCac buffer for 1 h at RT. The samples were washed and dehydrated with ethanol, dipped in acetone and covered with Epon for 2 h at RT and 18 h at +60°C. Sixty nanometres sections were cut from the samples onto pioloform grids and post-stained with 0.5% uranyl acetate for 30 min and 3% lead acetate for 1 min. Imaging was performed with Jeol JEM 1400 electron microscope (Akishima, Tokyo, Japan) operated at 80 kV.
Cryo-TEM of EV-/IEV-samples
Iodixanol or sucrose was removed by extensive ultrafiltration with Amicon Ultra-0.5 10 kDa ultrafiltration units from fresh, non-frozen samples collected five days after infection of the cells as described above. The 15,000 g pellets from D5 were collected with 100 µL of DPBS and washed by centrifuging three times with 10,000 g for 5 min at +4°C in 1 mL of DPBS. The vitrified samples were prepared with a Leica EM GP vitrification device from 3 μL aliquots of each sample on freshly glow-discharged Quantifoil R2/2 grids (Quantifoil, Großlöbichau, Germany). The samples were observed in a FEI Talos Arctica microscope (ThermoFisher Scientific) operated at 200 kV. The images were recorded at a magnification of 57,000× with a FEI Falcon 3 camera operated in linear mode in the Instruct-FI and Biocenter Finland cryoEM unit, University of Helsinki.
Statistical analysis
Statistical analysis was performed with SPSS software version 22.0 using Student’s two-tailed paired t-test or one-way ANOVA with Tukey’s HSD post hoc analysis, when comparing large sets of density gradient fractions.
Author contributions
HS: Designed and performed most of the experiments and wrote the article.
TT: Designed and performed qPCR measurements and participated in article writing.
AL: Assisted in experimental design, execution and participated in article writing.
MT: Designed and performed qPCR measurements and participated in article writing.
MJ: Contributed to project planning and article writing.
SJB: Contributed to cryo-TEM experiment planning and article writing.
SYH: Contributed to article writing.
TV: Contributed to article writing.
VC: Contributed to project planning and provided the oncolytic adenovirus used in the study.
PS: Contributed to project planning and article writing.
MY: Designed the project and contributed to article writing and provided funding of the project
Competing interests
Authors have no competing interests to declare.
Supplemental Material
Download Zip (14.6 MB)Acknowledgments
We thank Benita Löflund, Pasi Laurinmäki (University of Helsinki), Instruct-FI, the Biocenter Finland National cryo-electron microscopy units, the Electron Microscopy Unit of the Institute of Biotechnology, the Instruct-HiLIFE Biocomplex unit, member of Biocenter Finland and Instruct-FI and the EV-core, for providing technical assistance and facilities to carry out the work. We would also like to thank the Academy of Finland, Alfred Kordelin foundation and Emil Aaltonen foundation for funding this project.
Supplementary material
The supplemental data for this article can be accessed here.
Additional information
Funding
References
- van der Pol E, Boing AN, Harrison P, et al. Classification, functions, and clinical relevance of extracellular vesicles. Pharmacol Rev. 2012;64(3):676–24.
- Yáñez-Mó M, Siljander PR-M, Andreu Z, et al. Biological properties of extracellular vesicles and their physiological functions. J Extracell Vesicles. 2015;4(1):27066.
- Pegtel DM, Cosmopoulos K, Thorley-Lawson DA, et al. Functional delivery of viral miRNAs via exosomes. Proc Nat Acad Sci. 2010;107(14):6328–6333.
- Kouwaki T, Okamoto M, Tsukamoto H, et al. Extracellular vesicles deliver host and virus RNA and regulate innate immune response. Int J Mol Sci. 2017;18(3):666.
- Sadeghipour S, Mathias RA. Herpesviruses hijack host exosomes for viral pathogenesis. Semin Cell Dev Biol. 2017;67:91–100.
- Takahashi A, Okada R, Nagao K, et al. Exosomes maintain cellular homeostasis by excreting harmful DNA from cells. Nat Commun. 2017;8(1). DOI:10.1038/ncomms15287
- Wang T, Fang L, Zhao F, et al. Exosomes mediate intercellular transmission of porcine reproductive and respiratory syndrome virus (PRRSV). J Virol. 2017;JVI.01734-17. DOI:10.1128/JVI.01734-17
- Yang Y, Han Q, Hou Z, et al. Exosomes mediate hepatitis B virus (HBV) transmission and NK-cell dysfunction. Cell Mol Immunol. 2017;14(5):465–475.
- Zhao X, Wu Y, Duan J, et al. Quantitative proteomic analysis of exosome protein content changes induced by hepatitis B virus in Huh-7 cells using SILAC labeling and LC-MS/MS. J Proteome Res. 2014;13(12):5391–5402.
- Zhou W, Woodson M, Neupane B, et al. Exosomes serve as novel modes of tick-borne flavivirus transmission from arthropod to human cells and facilitates dissemination of viral RNA and proteins to the vertebrate neuronal cells. PLoS Pathog. 2018;14(1):e1006764.
- Kapoor NR, Chadha R, Kumar S, et al. The HBx gene of hepatitis B virus can influence hepatic microenvironment via exosomes by transferring its mRNA and protein. Virus Res. 2017;240:166–174.
- Böker KO, Lemus-Diaz N, Rinaldi Ferreira R, et al. The impact of the CD9 tetraspanin on lentivirus infectivity and exosome secretion. Mol Ther. 2018;26(2):634–647.
- Mack M, Kleinschmidt A, Brühl H, et al. Transfer of the chemokine receptor CCR5 between cells by membrane-derived microparticles: a mechanism for cellular human immunodeficiency virus 1 infection. Nat Med. 2000;6(7):769.
- Nolte-‘t Hoen E, Cremer T, Gallo RC, et al. Extracellular vesicles and viruses: are they close relatives? Proc Nat Acad Sci. 2016;113(33):9155–9161.
- Gould SJ, Booth AM, Hildreth JE. The Trojan exosome hypothesis. Proc Natl Acad Sci U S A. 2003;100:10592–10597.
- Fu Y, Zhang L, Zhang F, et al. Exosome-mediated miR-146a transfer suppresses type I interferon response and facilitates EV71 infection. PLoS Pathog. 2017;(13(9): e1006611).
- Bird SW, Maynard ND, Covert MW, et al. Nonlytic viral spread enhanced by autophagy components. Proc Natl Acad Sci U S A. 2014;111(36):13081–13086.
- Jourdan N, Maurice M, Delautier D, et al. Rotavirus is released from the apical surface of cultured human intestinal cells through nonconventional vesicular transport that bypasses the Golgi apparatus. J Virol. 1997;71(11):8268–8278.
- Méndez F, Romero N, Cubas LL, et al. Non-lytic egression of infectious bursal disease virus (IBDV) particles from infected cells. PloS One. 2017;12(1):e0170080.
- Robinson SM, Tsueng G, Sin J, et al. Coxsackievirus B exits the host cell in shed microvesicles displaying autophagosomal markers. PLoS Pathog. 2014;10(4):e1004045.
- Nagashima S, Jirintai S, Takahashi M, et al. Hepatitis E virus egress depends on the exosomal pathway, with secretory exosomes derived from multivesicular bodies. J Gen Virol. 2014;95:2166–2175.
- van der Grein SG, Defourny KAY, Slot EFJ, et al. Intricate relationships between naked viruses and extracellular vesicles in the crosstalk between pathogen and host. Springer Semin Immunopathol. 2018;40(5):491–504.
- Ran L, Tan X, Li Y, et al. Delivery of oncolytic adenovirus into the nucleus of tumorigenic cells by tumor microparticles for virotherapy. Biomaterials. 2016;89:56–66.
- Maguire CA, Balaj L, Sivaraman S, et al. Microvesicle-associated AAV vector as a novel gene delivery system. Mol Ther. 2012;20(5):960–971.
- Rana S, Yue S, Stadel D, et al. Toward tailored exosomes: the exosomal tetraspanin web contributes to target cell selection. Int J Biochem Cell Biol. 2012;44(9):1574–1584.
- Wiklander OPB, Nordin JZ, O’Loughlin A, et al. Extracellular vesicle in vivo biodistribution is determined by cell source, route of administration and targeting. J Extracell Vesicles. 2015;4(1):26316.
- Hoshino A, Costa-Silva B, Shen T-L, et al. Tumour exosome integrins determine organotropic metastasis. Nature. 2015;527(7578):329.
- Peinado H, Alečković M, Lavotshkin S, et al. Melanoma exosomes educate bone marrow progenitor cells toward a pro-metastatic phenotype through MET. Nat Med. 2012;18(6):883–+.
- Grange C, Tapparo M, Collino F, et al. Microvesicles released from human renal cancer stem cells stimulate angiogenesis and formation of lung premetastatic niche. Cancer Res. 2011;71(15):5346–5356.
- Tian T, Zhu Y-L, Hu F-H, et al. Dynamics of exosome internalization and trafficking. J Cell Physiol. 2013;228(7):1487–1495.
- Tian T, Wang Y, Wang H, et al. Visualizing of the cellular uptake and intracellular trafficking of exosomes by live-cell microscopy. J Cell Biochem. 2010;111(2):488–496.
- Escrevente C, Keller S, Altevogt P, et al. Interaction and uptake of exosomes by ovarian cancer cells. BMC Cancer. 2011;11(1):108.
- del Conde I, Shrimpton CN, Thiagarajan P, et al. Tissue-factor–bearing microvesicles arise from lipid rafts and fuse with activated platelets to initiate coagulation. Blood. 2005;106(5):1604–1611.
- Mulcahy LA, Pink RC, Carter DRF. Routes and mechanisms of extracellular vesicle uptake. J Extracell Vesicles. 2014;3(1):24641.
- Garofalo M, Saari H, Somersalo P, et al. Antitumor effect of oncolytic virus and paclitaxel encapsulated in extracellular vesicles for lung cancer treatment. J Controlled Release. 2018;283:223–234.
- György B, Sage C, Indzhykulian AA, et al. Rescue of hearing by gene delivery to inner-ear hair cells using exosome-associated AAV. Mol Ther. 2017;25(2):379–391.
- Wassmer SJ, Carvalho LS, György B, et al. Exosome-associated AAV2 vector mediates robust gene delivery into the murine retina upon intravitreal injection. Sci Rep. 2017;7(1). DOI:10.1038/srep45329
- Koski A, Kangasniemi L, Escutenaire S, et al. Treatment of cancer patients with a serotype 5/3 chimeric oncolytic adenovirus expressing GMCSF. Mol Ther. 2010;18(10):1874–1884.
- Dormond E, Chahal P, Bernier A, et al. An efficient process for the purification of helper-dependent adenoviral vector and removal of helper virus by iodixanol ultracentrifugation. J Virol Methods. 2010;165(1):83–89.
- Tauro BJ, Greening DW, Mathias RA, et al. Comparison of ultracentrifugation, density gradient separation, and immunoaffinity capture methods for isolating human colon cancer cell line LIM1863-derived exosomes. Methods. 2012;56(2):293–304.
- Iwai K, Minamisawa T, Suga K, et al. Isolation of human salivary extracellular vesicles by iodixanol density gradient ultracentrifugation and their characterizations. J Extracell Vesicles. 2016;5(1):30829.
- Saari H, Lázaro-Ibáñez E, Viitala T, et al. Microvesicle- and exosome-mediated drug delivery enhances the cytotoxicity of Paclitaxel in autologous prostate cancer cells. J Controlled Release. 2015;220:727–737.
- Koifman N, Biran I, Aharon A, et al. A direct-imaging cryo-EM study of shedding extracellular vesicles from leukemic monocytes. J Struct Biol. 2017;198(3):177–185.
- Höög JL, Lötvall J. Diversity of extracellular vesicles in human ejaculates revealed by cryo-electron microscopy. J Extracell Vesicles. 2015;4(1):28680.
- Gros A, Guedan S. Adenovirus release from the infected cell as a key factor for adenovirus oncolysis. Open Gene Ther J. 2010;3(2):24–30.
- San Martín C. Latest insights on adenovirus structure and assembly. Viruses. 2012;4(5):847–877.
- Saraste A, Pulkki K. Morphologic and biochemical hallmarks of apoptosis. Cardiovasc Res. 2000;45(3):528–537.
- Osteikoetxea X, Sódar B, Németh A, et al. Differential detergent sensitivity of extracellular vesicle subpopulations. Org Biomol Chem. 2015;13(38):9775–9782.
- Lázaro-Ibáñez E, Sanz-Garcia A, Visakorpi T, et al. Different gDNA content in the subpopulations of prostate cancer extracellular vesicles: apoptotic bodies, microvesicles, and exosomes. Prostate. 2014;74(14):1379–1390.
- Thakur BK, Zhang H, Becker A, et al. Double-stranded DNA in exosomes: a novel biomarker in cancer detection. Cell Res. 2014;24(6):766–769.
- Waldenström A, Gennebäck N, Hellman U, et al. Cardiomyocyte microvesicles contain DNA/RNA and convey biological messages to target cells. PLoS ONE. 2012;7(4):e34653.
- Cai J, Wu G, Tan X, et al. Transferred BCR/ABL DNA from K562 extracellular vesicles causes chronic myeloid leukemia in immunodeficient mice. PLoS One. 2014;9(8):e105200.
- Shelke GV, Jang SC, Yin Y, et al. Human mast cells release extracellular vesicle-associated DNA. Matters (Zürich). 2016;2:1.
- Németh A, Orgovan N, Sódar BW, et al. Antibiotic-induced release of small extracellular vesicles (exosomes) with surface-associated DNA. Sci Rep. 2017;7(1):8202.
- Lázaro-Ibáñez E, Lässer C, Shelke GV, et al. DNA analysis of low- and high-density fractions defines heterogeneous subpopulations of small extracellular vesicles based on their DNA cargo and topology. J Extracell Vesicles. 2019;8(1):1656993.
- Benevento M, Di Palma S, Snijder J, et al. Adenovirus composition, proteolysis, and disassembly studied by in-depth qualitative and quantitative proteomics. J Biol Chem. 2014;289(16):11421–11430.
- Wiethoff CM, Wodrich H, Gerace L, et al. Adenovirus protein VI mediates membrane disruption following capsid disassembly. J Virol. 2005;79(4):1992–2000.
- Baggen J, Thibaut H, Strating JR, et al. The life cycle of non-polio enteroviruses and how to target it. Nature Rev Microbiol. 2018;1:368–381.
- Zell R. Picornaviridae—the ever-growing virus family. Arch Virol. 2018;163.2 : 299–317.
- Fay N, Panté N. Nuclear entry of DNA viruses. Front Microbiol. 2015;6:467.
- Cai J, Han Y, Ren H, et al. Extracellular vesicle-mediated transfer of donor genomic DNA to recipient cells is a novel mechanism for genetic influence between cells. J Mol Cell Biol. 2013;5(4):227–238.
- Smith JG, Cassany A, Gerace L, et al. Neutralizing antibody blocks adenovirus infection by arresting microtubule-dependent cytoplasmic transport. J Virol. 2008;82(13):6492–6500.
- Lan YY, Londoño D, Bouley R, et al. Dnase2a deficiency uncovers lysosomal clearance of damaged nuclear DNA via autophagy. Cell Rep. 2014;9(1):180–192.
- Rasmussen SB, Horan KA, Holm CK, et al. Activation of autophagy by α-herpesviruses in myeloid cells is mediated by cytoplasmic viral DNA through a mechanism dependent on stimulator of IFN genes. J Immunol. 2011;187(10):5268–5276.
- Lam E, Stein S, Falck-Pedersen E. Adenovirus detection by the cGAS/STING/TBK1 DNA sensing cascade. J Virol. 2014;88(2):974–981.
- Scherer J, Vallee RB. Conformational changes in the adenovirus hexon subunit responsible for regulating cytoplasmic dynein recruitment. J Virol. 2015;89:1013–1023.
- Balakireva L, Schoehn G, Thouvenin E, et al. Binding of adenovirus capsid to dipalmitoyl phosphatidylcholine provides a novel pathway for virus entry. J Virol. 2003;77(8):4858–4866.
- Fabry CMS, Rosa-Calatrava M, Conway JF, et al. A quasi‐atomic model of human adenovirus type 5 capsid. Embo J. 2005;24(9):1645–1654.
- Fujiwara Y, Kikuchi H, Aizawa S, et al. Direct uptake and degradation of DNA by lysosomes. Autophagy. 2013;9(8):1167–1171.
- Okegawa T, Li Y, Pong RC, et al. The dual impact of coxsackie and adenovirus receptor expression on human prostate cancer gene therapy. Cancer Res. 2000;60(18):5031–5036.
- Murakami M, Ugai H, Belousova N, et al. Chimeric adenoviral vectors incorporating a fiber of human adenovirus 3 efficiently mediate gene transfer into prostate cancer cells. Prostate. 2010;70(4):362–376.
- Barber AG, Castillo-Martin M, Bonal DM, et al. Characterization of desmoglein expression in the normal prostatic gland. Desmoglein 2 is an independent prognostic factor for aggressive prostate cancer. PLoS One. 2014;9(6):e98786.
- Peng HH, Wu S, Davis JJ, et al. A rapid and efficient method for purification of recombinant adenovirus with arginine-glycine-aspartic acid-modified fibers. Anal Biochem. 2006;354(1):140–147.
- Preuss MA, Lam JT, Wang M, et al. Transcriptional blocks limit adenoviral replication in primary ovarian tumor. Clin Cancer Res. 2004;10(9):3189–3194.