
ABSTRACT
Background: Early screening for colorectal cancer (CRC) is essential to improve its prognosis. Liquid biopsies are increasingly being considered for diagnosing cancer due to low invasiveness and high reproducibility. In addition, circulating extracellular vesicles (crEVs, extracellular vesicles isolated from plasma) expressing tumour-specific proteins are potential biomarkers for various cancers. Here, we present a data-independent acquisition (DIA)-mass spectrometry (MS)-based diagnostic method for liquid biopsies.
Methods: Extracellular vesicles (EVs) were isolated from culture supernatants of human CRC cell lines, and plasma of patients with CRC at different tumour stages, by overnight ultracentrifugation coupled with sucrose density gradient centrifugation. Tumour-specific EV proteins were prioritized using Tandem Mass Tag (TMT)-based shotgun proteomics and phosphoproteomics. The results were verified in a second independent cohort and a mouse tumour-bearing model using Western blotting (WB). The candidate biomarkers were further validated in a third cohort by DIA-MS. Finally, the DIA-MS methodology was accelerated to permit high-throughput detection of EV biomarkers in another independent cohort of patients with CRC and healthy controls.
Results: High levels of total and phosphorylated fibronectin 1 (FN1) in crEVs, haptoglobin (HP), S100A9 and fibrinogen α chain (FGA) were significantly associated with cancer progression. FGA was the most dominant biomarker candidate. Analysis of the human CRC cell lines and the mouse model indicated that FGA+ crEVs were likely released by CRC cells. Furthermore, fast DIA-MS and parallel reaction monitoring (PRM)-MS both confirmed that FGA+ crEVs could distinguish colon adenoma with an area of curve (AUC) in the receiver operating characteristic (ROC) curve of 0.949 and patients with CRC (AUC of ROC is 1.000) from healthy individuals. The performance outperformed conventional tumour biomarkers. The DIA-MS quantification of FGA+ crEVs among three groups agreed with that from PRM-MS.
Conclusion: DIA-MS detection of FGA+ crEVs is a potential rapid and non-invasive screening tool to identify early stage CRC.
Abbreviations: FGA: fibrinogen α chain; CRC: colorectal cancer; crEVs: circulating extracellular vesicles; EV: extracellular vesicles;MS: mass spectrometry; WB: Western blotting; ROC: receiver operating characteristic; PRM: Parallel Reaction Monitoring; GPC1: Glypican-1; GO: Gene ontology; TEM: transmission electron microscopy; FN1: Fibronectin 1; HP: haptoglobin; TMT: Tandem Mass Tag; LC-MS/MS: liquid chromatography coupled to tandem mass spectrometry; DIA: data-independent acquisition; DDA: data-dependent acquisition; CiRT: Common internal Retention Time standards;AGC: Automatic gain control; AUC: area under curve.
Introduction
Colorectal cancer (CRC) is a highly prevalent malignancy worldwide, with 2.2 million new cases and 1.1 million deaths predicted by 2030 [Citation1]. The primary cause of CRC-related mortality is liver metastasis, which afflicts more than half of the patients, and is driven by primary tumour-derived EVs [Citation2,Citation3]. Although colonoscopies and biopsies have substantially improved diagnosis of CRC, they are highly invasive procedures. Therefore, a standardized, minimally-invasive approach with higher degree of patient compliance is needed to screen for the high-risk patients with CRC [Citation4,Citation5].
Exosomes, the most widely known extracellular vesicles (EVs), are small membrane-bound vesicles ranging from 30 to 150 nm in diameter that are secreted by all cell types [Citation6]. We use the term EVs instead of exosomes as current methods are only able to enrich rather than purify exosomes. They encapsulate multiple proteins, nucleic acids and other biomolecules, depending on the parental cells as well as the (patho)physiological status of human body [Citation7]. EVs transport essential biomolecules across cells and therefore play important roles in inter-cellular trafficking and communication. They have been implicated in both innate and adaptive immune responses and are known to facilitate tumour angiogenesis and metastasis. In addition, crEVs have garnered considerable attention in recent years as biomarkers for early detection of cancers. Melo et al. detected Glypican-1 (GPC1)+ exosomes in almost 100% of the early pancreatic cancer tissues [Citation8], and Li et al. reported a potential diagnostic role of GPC1+ exosomes in CRC screening [Citation9]. Furthermore, EVs’ contents are protected from the external proteases and other enzymes, thus stay biologically stable. For example, EVs isolated from breast cancer patients showed high levels of stable phosphorylated proteins, providing new insights into molecular mechanisms underlying cancer progression and metastasis [Citation10].
Mass spectrometry (MS) is an effective approach for identifying crEV-derived biomarkers. However, analysis of the EV proteome is expensive due to the need for fractionation and the relatively long liquid chromatographic (LC) gradient [Citation11]. DIA-MS coupled with targeted data analysis [Citation12] has emerged as a promising strategy to analyse proteomes of clinical specimens using single-shot and relatively short gradients [Citation13]. In this study, we first explored EV protein/phosphoprotein biomarkers in liquid biopsies of patients with CRC, and identified FGA, FN1, S100A9 and HP with significantly differential protein expression and phosphorylation levels. Results of WB consolidated that FGA+ crEVs showed a sensitivity of almost 100% in diagnosing CRC, and 65% in the early diagnosis of adenoma patients. Studies on human CRC cell lines and an animal model indicated that the FGA+ crEVs were likely derived from the parent cancer cells. The DIA-based diagnostic tool was further tested on another independent CRC cohort, which validated the utility of FGA+ crEVs as an early diagnostic biomarker of CRC. This verified DIA-MS-based liquid biopsies for fast cancer screening. The DIA-MS quantification of FGA+ crEVs among three groups were finally validated by PRM-MS.
Materials and methods
Cell culture
The human CRC cell line SW620 (Cat. No. CCL-227, LOT: 61867814) was purchased from the American Type Culture Collection (ATCC), and cultured in Leibovitz’s L-15 medium at 37°C. The LoVo and NIH 3T3 cell lines were purchased from the Cell Bank of the Chinese Academy of Sciences (Shanghai, China), and cultured in Dulbecco’s modified Eagle’s medium (DMEM). All cell lines were validated using short tandem repeat (STR) markers by the Shanghai Biowing Applied Biotechnology Co. Ltd. The culture medium for SW620 and LoVo cells were EV-depleted and supplemented with 10% foetal bovine serum (FBS, Gibco), 100 U/mL penicillin, and 100 mg/mL streptomycin, and that for NIH 3T3 was additionally supplemented with 1% non-essential amino acids (Invitrogen, US) and 1% GlutaMAX (Invitrogen, US).
Establishment of mouse tumour-bearing model
All animal experiments were approved by the Institutional Ethics Committee of the Second Affiliated Hospital Zhejiang University School of Medicine (Zhejiang, P.R. China). BALB/c female mice were purchased from the National Cancer Institute Tumour Repository (DTP/DCTD, Frederick National Laboratory for Cancer Research). The experiments were performed at the Zhejiang Chinese Medical University (No. SYXK2018-0012). Each mouse was injected subcutaneously with 2 × 10⁶ SW620 or LoVo cells, and 200 µl blood samples were drawn before and 1 week after transplanting the CRC cells when the tumour sizes reached 0.3 cm to 0.6 cm.
Clinical samples
Peripheral blood samples were collected from healthy donors and histologically-confirmed patients with CRC with or without liver metastasis at the Second Affiliated Hospital of Zhejiang University School of Medicine. The discovery cohort consisted of 10 healthy individuals, 10 patients with CRC without liver metastasis and 10 patients with CRC with liver metastases. The plasma samples from all individuals from a group are pooled together for TMT-based LC-MS/MS. Each patient contributed 1 mL plasma sample. The two independent validation cohorts (cohort 2 and 3) included 30 healthy individuals, 20 adenoma patients, 30 patients with CRC without liver metastasis and 9 patients with CRC with liver metastases. The verification cohort for DIA and PRM verification (cohort 4) had 12 healthy individuals, 13 adenoma patients and 12 patients with CRC without liver metastases. All individuals provided informed consent for blood donation according to a protocol approved by the institutional review board (No. 2018–164).
The isolation and identification of EVs
Supernatants were collected from SW620 and LoVo cells cultured for 72 h and transferred into centrifugation tubes fitted with Amicon Ultra-15 centrifugal filters with a molecular weight limit of 100 kDa. After sequential centrifugation at 300 × g (5 min), 1,200 × g (20 min) and 10,000 × g (30 min) at 4°C to enrich for the EVs, the supernatants were passed through 0.22 µm pore size Millex-GP membrane filters (Millipore Express, US) to remove debris, and centrifuged at 100,000 × g for 70 min at 4°C using a Beckman MLA50 rotor. The vesicles were re-suspended, loaded onto a sucrose gradient (0.25, 0.5, 1.0, 1.25 and 2 M; Sigma Cat. No. S9378), and centrifuged at 100,000xg for 2.5 h using a Beckman SW41Ti rotor. Ten 1 mL fractions were collected and separately washed with PBS at 100,000xg for 2.5 h using a Beckman MLS50 rotor. To isolate EVs from human/murine plasma, 10 mL (for TMT-based LC-MS/MS) or 300 μL (for DIA-MS) of each sample was first diluted with 20 mL/3 mL PBS and filtered through the Millex-GP filters, followed by overnight ultracentrifugation at 160,000xg and 4°C using a Beckman MLA50/MLS50 rotor. The pellet from each tube was re-suspended in 1 mL PBS and ultra-centrifuged overnight at 160,000xg and 4°C using a Beckman MLA130 rotor. The vesicles were collected and processed further as described above.
The size and concentration of the EVs were determined using NanoSight (NTA 3.2 Dev Build 3.2.16, Malvern, UK) according to the manufacturer’s instructions, and the morphology was observed using transmission electron microscopy (TEM). Briefly, 100 µl EVs suspension (containing ~10 μg protein) was fixed in 1% (v/v) glutaraldehyde, layered onto formvar-coated 200-mesh copper grids, and allowed to dry at room temperature. The grids were washed thrice with deionized water for 5 min each, stained with 1% (w/v) uranyl acetate for 10 min, and visualized with TECNAL 10 TEM at 80 kV. The specific density of the sucrose fraction we used for further experiments is 1.15 g/mL as we reported to EV-TRACK (ID: BR2025GX and EV170041) after identification experiments.
Western Blotting
The EVs extracted from the plasma samples were re-suspended in 500 μl protein lysis buffer (Beyotime Biotechnology), and 20 μl of each lysed sample was resolved by SDS-PAGE (10% w/v sodium dodecyl sulphate, 30% w/v acrylamide, 1 M Tris-HCl pH 6.8, 10% w/v ammonium persulphate, and 2% TEMED). After transferring to PVDF membranes, the protein bands were probed with anti-CD63 ExoAB (1:1000, Cat. No. ExoAB-CD63A-1, System Biosciences, CA), rabbit anti-TSG101 (clone EPR 7130(B), 1:2000, Cat. No. ab125011, Abcam), rat anti-calnexin (1:500, Cat. No. sc-23954, Santa Cruz), rabbit anti-HSC70 (1:1000, Cat. No. ab51052, Abcam), rabbit anti-FGA (1:2000, Cat. No. ab92572, Abcam), rabbit anti-FN1 (1:1000, Cat. No. ET1702-25, HuaBio), rabbit anti-S100A9 (1:1000, Cat. No. ET1702-73, HuaBio) and rabbit anti-HP (1:1000, Cat. No. ET1703-24, HuaBio) antibodies. The blots were washed with the Tris-Buffered Saline (Boster, USA), 0.1% Tween® 20 Detergent (Sigma, MO, USA) buffer and incubated with IRDye 800-conjugated goat anti-mouse/rabbit IgG (1:1000 or 1:2,500, Li-COR Biosciences) secondary antibodies at room temperature. We have submitted all relevant data of our experiments to the EV-TRACK knowledgebase (EV-TRACK ID: BR2025GX for plasma and EV170041 for cell lines).
TMT-based LC-MS/MS
The TMT-based LC-MS/MS identification and data normalization analysis were performed by PTM-biolabTM (Hangzhou, China). The samples were sonicated thrice on ice (Scientz) in 8 M urea supplemented with 1% protease inhibitor cocktail. The protein concentrations were determined with BCA kit (Thermo-Fisher Scientific) according to the manufacturer’s instructions. After trypsin digestion, the ensuing peptides were pooled, desalted through the Strata X C18 SPE column (Phenomenex), vacuum-dried, and reconstituted in 0.5 M TEAB provided in the TMT kit (Thermo-Fisher Scientific) according to the manufacturer’s protocols.
The peptide mixtures were fractionated by high-pH reverse-phase HPLC using Agilent 300Extend C18 column (5 µm particles, ID 4.6 mm, length 250 mm). Briefly, the peptides were first separated through a gradient of 8%–32% acetonitrile (pH 9) over 60 min into 60 fractions, re-combined into 18 (or 8 for phosphopeptides) fractions, and vacuum-dried. For phosphorylated proteomics, the peptides were further subjected to bio-material-based post-translational modification enrichment using IMAC microspheres (see Supplementary Materials and Methods). The processed peptides were dissolved in buffer A (0.1% formic acid in HPLC water), directly loaded onto a self-made reverse-phase analytical column (length 15 cm length, ID 75 μm), and separated at the rate of 400 nl/min in a 6–80% buffer B (0.1% formic acid in 98% acetonitrile) gradient on an EASY-nLC 1000 UPLC system (6–23% over 26 min, 23–35% in 8 min, increasing to 80% in 3 min, and remaining at 80% for the last 3 min). The eluted peptides were subjected to NSI source followed by tandem MS (MS/MS) in Q ExactiveTM Plus (Thermo-Fisher) coupled online to EASY-nLC 1000 UPLC at 2kV electrospray voltage. The initial m/z scan range was 350 to 1800, and the intact peptides detected in the Orbitrap at the resolution of 70,000 (at m/z 200) were selected for MS/MS at NCE setting of 28, and fragments were detected in the Orbitrap at the resolution of 17,500 (at m/z 200).
The data-dependent acquisition (DDA) procedure alternated between one MS scan followed by 20 MS/MS scans with 15 s dynamic exclusion. Automatic gain control (AGC) was set at 5E4, and fixed first mass at 100 m/z. The MS/MS data were processed using MaxQuant search engine (v.1.5.2.8), and searched against the SwissProt Human database concatenated with reverse decoy database. Trypsin/P was specified as the cleavage enzyme allowing up to 2 (4 in phosphoproteomics) missed cleavages. The mass tolerance for precursor ions was set at 20 ppm in the First search and 5 ppm in the Main search, and the mass tolerance for fragment ions was set at 0.02 Da. Carbamidomethyl on Cys was specified as the fixed modification and Met oxidation was specified as the variable modification. FDR was adjusted to < 1% and minimum score for peptides was set at > 40. All proteomics and phosphoproteomics data have been deposited in the ProteomeXchange Consortium via the PRIDE PRoteomics IDEntifications (PRIDE) database (Identifier PXD009490).
DIA-MS and PRM-MS
For DIA-MS, EV proteins were extracted using a lysis buffer containing 0.1 M NH4HCO3 (Sigma, MO, USA), 6 M Urea (Sigma, MO, USA) and 2 M thiourea (Sigma, MO, USA), and reduced by incubating with 10 mM Tris(2-carboxyethyl)phosphine hydrochloride (TCEP) for 45 min at 33°C. The proteins were then alkylated with 40 mM iodoacetamide (IAA) in the dark at 25°C for 60 min, and digested with trypsin (Hualishi Technology, Beijing, China) at the enzyme-substrate ratio of 1:40 for 16 h at 33°C. The trypsinized peptides were then acidified by 1% trifluoroacetic acid (TFA, pH 2–3), and desalted by Sep-Pak Vac 1cc (50 mg) C18 cartridges (Waters, MA, USA) according to the manufacturer’s instruction. The cleaned peptides were vacuum dried and re-dissolved in 30 µl MS buffer containing 0.1% formic acid and 2% acetonitrile in water (all HPLC grade). The peptide concentration was measured by Nanoscan (Analytik Jena AG, Jena, Germany) in terms of absorbance at 280 nm, and 0.4 µg peptides per sample were injected into Thermo Q ExactiveTM-HF hybrid Quadrupole-Orbitrap.
After the equilibration with 3% B, we started to load samples at 4 min.The peptides were separated at 300 nL/min along with a 20/45/60/90 min 3–28% buffer B linear LC gradient (buffer A: 2% ACN, 0.1% formic acid; buffer B: 98% ACN, 0.1% formic acid, after the efficient gradient, %B increased to 80% in 2 min, and remaining at 80% for the last 3 min) using an analytical column (75 µm × 150 mm, 1.9 µm 120 Å C18 particles), and the DIA acquisition scheme was set up to 24 variable windows ranging from 400 to 1000 m/z. Each cycle in the MS method consists of one full MS scan over the m/z range of 400–1000 followed by 20 relative narrow isolation windows (m/z range 400–800, isolation width m/z 21) and 4 relative wide isolation window (m/z range 800–1000, isolation width m/z 41 or 61). Each isolation window overlapped by 1 m/z [Citation14]. The sequential precursor isolation window setup is shown in Supplementary Data 3. The transient time was 128 ms for MS1 (at a resolution of 60,000, with a max IT of 80 ms and AGC target value of 3E6) and 64 ms for MS2 (at a resolution of 30,000, with an approximate ion injection time of 55 ms and AGC target value of 1E6). The cycle time was 1,870 ms at least and 2,260 ms at most (read from raw data of 20, 45, 60 and 90 min gradients). OpenSWATH (version 2.0.0) was performed using a human plasma and plasma EV protein spectral library containing 629 proteins, which is the plasma subset of our previous work of a pan-human spectral library for DIA-MS [Citation15]. Pyprophet 0.24.1 was used to limit the threshold to 1% FDR, and we used the top three precursors for DIA quantification.
The expression of selected four proteins in crEVs from cohort 4 was verified by PRM, which is a target proteomic strategy. Common internal Retention Time standards (CiRT) peptides were used for retention time calibration [Citation15]. Peptides were separated at 300 nL/min along with a 10 min 10–30% buffer B linear LC gradient (buffer A: 2% ACN, 0.1% formic acid; buffer B: 98% ACN, 0.1% formic acid, time between runs was 25 min) using an analytical column (75 µm × 150 mm, 1.9 µm 120 Å C18 particles). The Q Exactive HF Hybrid Quadrupole-Orbitrap Mass Spectrometer was operated in the MS/MS mode with time-scheduled acquisition for 27 peptides (including CiRT peptides, Supplemental Data S5) in a ± 2.5 min retention time window (the maximum number of targets at any one time is 18). The full MS mode was measured at resolution 60,000 at m/z 200 in the Orbitrap, with AGC target value of 3E6 and maximum IT of 55 ms. Target ions were submitted to MS/MS in the HCD cell (1.2 m/z isolation width, 27% normalized collision energy). MS/MS spectra were acquired at resolution 30,000 (at m/z 200) in the Orbitrap using AGC target value of 2E5, a max IT of 100 ms to increase the sensitivity of the analysis [Citation16,Citation17].
We have deposited the MS proteomics data to the iProX database under project ID IPX0001411000 with subproject ID IPX0001411002 (for DIA) and IPX0001411004 (for PRM). The dataset is authorized with a PXD number: PXD015921.
Statistical analysis
All samples in the validation cohort were measured separately. The bar graphs were generated using GraphPad Prism V 7.0 (GraphPad Software, San Diego, CA), heat maps using Cluster 3.0 and Java Treeview 1.1.6r4, and the volcano plots, Venn graphs and ROC curves using R language. Data were presented as means ± standard deviation and compared between two groups using student t-test. One-way analysis of variance (ANOVA) test was used for multi-group comparison followed by Student–Newman–Keuls test. SPSS 20.0 (SPSS Inc., Chicago, USA) was used for data analysis, and p values < 0.05 were considered statistically significant.
Results
Study design and characterization of human crEVs
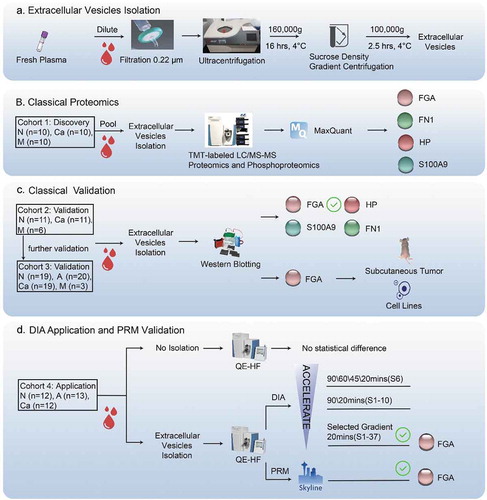
The protocol for EV extraction and purification is outlined in . To discover potential biomarkers, we performed TMT-labelled LC-MS/MS analysis of samples from a discovery cohort (), and identified FGA, FN1, S100A9 and HP with significantly differential protein expression and phosphorylation levels in the CRC samples compared to the healthy controls. Further verification on samples isolated from an independent validation cohort () indicated that FGA had the most significantly altered expression levels in the patient samples. Finally, high levels of FGA+ crEVs were independently verified in a third CRC patient cohort, along with human CRC cell lines and a tumour-bearing mouse model (). To explore potential clinical application, we performed DIA-MS in cohort 4 using the 20 min gradient after testing four different gradients ().
Figure 1. Study design.
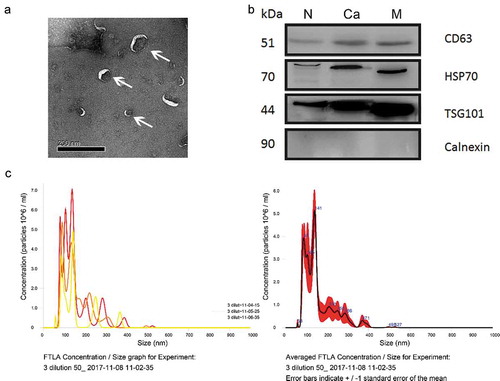
The morphology of the EVs purified from the plasma of healthy individuals was visualized by TEM (), and further characterized by high surface expression of known EV biomarkers (CD63, HSP70 and TSG101) and absence of Calnexin (). The diameters of the EVs were measured by Nano sight technology, and ranged from 30 to 150 nm, in accordance with previous reports () [Citation6].
Figure 2. Characterization of plasma-derived EVs enriched from healthy donors and patients with CRC.
Proteomics and phosphoproteomics analysis of EVs by TMT-labelled MS
TMT-labelled LC-MS/MS, a classical shotgun DDA-MS methodology, was used to analyse the EV proteome and phosphoproteome. For the initial screening, plasma samples were pooled from 10 healthy individuals (group N), 10 patients with CRC without metastasis (group Ca), and 10 patients with CRC with liver metastases (group M). A total of 545 SwissProt proteins were identified, and expression levels of 462 proteins were obtained. 47 proteins were significantly up-regulated in the M samples compared to N, 20 in Ca compared to N, and 45 in M compared to Ca. We also observed 91 down-regulated proteins in M/N, 30 in Ca/N and 84 in M/Ca (Figure S1A, fold change > 1.3, t-test p-value<0.05). The differential proteins with 2 or more unique peptides are shown in Volcano plots (, fold change > 1.3, t-test p-value<0.05).
Figure 3. Proteomics and phosphoproteomics analyses of EVs.
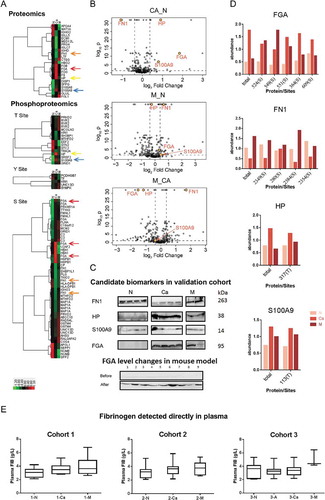
Gene Ontology (GO) analysis showed that many EV proteins are involved in cell–cell communication, metabolic processes, stimuli responses and biogenesis (Figure S1B). Cluster analysis showed variations in protein expression across the three groups (; fold change >1.5, t-test p-value<0.05), with significant differences in fibrinogen α chain (FGA), fibronectin (FN)1, S100A9 and haptoglobin (HP) expression levels, as well as their phosphorylation sites. In addition, we also identified 252 unique phospho-peptides and 347 phosphorylation sites from 195 proteins, of which 315 sites from 177 proteins were quantified, in the crEVs of patients with CRC. A total of 91 phosphoproteins and 161 sites were up-regulated in M compared to N, 21 and 27 in Ca compared to N, and 98 and 175 in M compared to Ca. Furthermore, 45 proteins and 74 sites were down-regulated in M compared to N, 59 and 105 in Ca compared to N, and 42 and 67 in M compared to Ca (Figure S1A, fold change > 1.3, t-test p-value<0.05). The most differentially expressed phosphorylation sites were identified with decreasing numbers from serines, threonines to tyrosines. FGA, FN1, HP and S100A9 also showed significantly different phosphorylation status (; fold change > 1.5, t-test p-value < 0.05), which corresponded to changes in total protein levels (). Taken together, crEVs of patients with CRC showed distinct proteomes, which can be used to identify patients with CRC from healthy individuals.
Verification of the differentially-expressed crEVs proteins
Based on ours and others’ findings [Citation18–Citation21], we validated the expression levels of FN1, HP, S100A9 and FGA in an independent cohort consisting of 11 healthy donors, 11 patients with CRC without liver metastases, and 6 patients with CRC with liver metastases. All proteins showed significant differences, of which FGA was the most dominant distinguishing biomarker (). To further validate FGA over-expression in CRC plasma samples, we tested a second independent cohort (cohort 3, see ), which also included 20 adenoma patients (group A). All CRC-EV samples (regardless of metastasis) showed FGA overexpression, as did 65% of the adenoma samples (Figure S2B). Since FGA is a component of fibrinogen, which is routinely detected when testing coagulation function, we also analysed the pre-treatment fibrinogen values obtained from the clinical data of cohort 1, 2 and 3. It showed no significant differences among different groups, indicating that clinical detection of fibrinogen expression directly in plasma cannot take the place of detecting FGA+ crEVs (). The clinical data of all patients are summarized in Tables in Supplementary Data S4.
Clinical application of DIA-MS
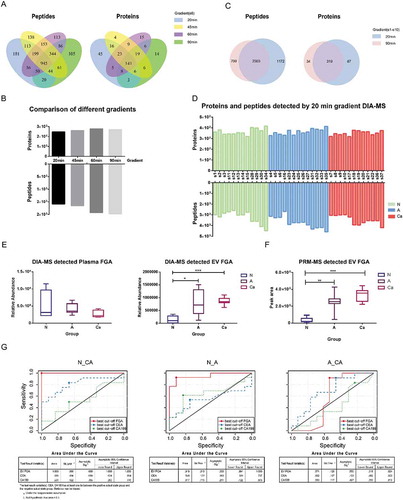
To determine the utility of our approach in the clinical screening of colon adenoma and CRC, we tested it individually on 37 new crEVs samples (S1 to S37 – 12 from healthy individuals or N, 13 from adenoma patients or A and 12 from patients with CRC without liver metastasis or Ca). An initial DIA-MS run on 20 plasma samples (n = 6, 7, 7) showed no significant difference in FGA levels across the three groups, indicating that differential FGA expression cannot be detected directly in the plasma (; p > 0.05). To accelerate our method for rapid clinical monitoring of the CRC crEVs proteome, we first analysed the proteome of the S6 sample using four different LC gradients of 20, 45, 60 and 90 min. After an OpenSWATH search [Citation22], we found considerable overlap between the peptides and proteins detected by the four conditions (), with no significant difference in the numbers of peptides or protein groups (; p > 0.05). To confirm the applicability of the shortest 20 min LC gradient, we tested both the 20 and 90 min conditions on samples S1 to S10 (three each from healthy individuals and adenoma patients, and four from patients with CRC without liver metastases). As we have systematically performed the experiment by comparing results using 90, 60, 45 and 20 min LC gradient. It was discovered that by reducing the LC gradient from 90 to 20 min, we could still detect 87% of the protein groups (353/406) (, Supplementary Figure 2A). Furthermore, the small number of proteins not detected using the 20 min LC gradient did not affect the clinical usage of the data. Then we used the 20 min LC gradient to analyse the relative abundance of FGA in all crEV samples (). We found significant differences between the N and A groups, as well as between the N and Ca groups, but not between the two patient groups (). Furthermore, the ROC curve showed that FGA+ crEVs could clearly demarcate between the patients with CRC from healthy controls with an AUC 1(), and were also an effective classifier between the adenoma patients and healthy controls with an AUC of 0.949 (). When compared to the ROC curves of CEA (the AUC is 0.809 and 0.548, ) and CA19-9 (the AUC is 0.531 and 0.647, ) acquired from the patients’ clinical data (Supplemental Data S4, Table 4), FGA could identify both adenoma and patients with CRC with higher specificity and sensitivity compared to the two archetypal tumour biomarkers.
Figure 4. Clinical validation of DIA-MS and PRM-MS.
Verification of clinical application of DIA-MS by PRM
To verify the results of the DIA-MS experiment, we performed PRM quantification of FGA peptides in cohort 4, which are the same samples as we used in DIA-MS experiments. We used the fragment total area reported by Skyline-daily (19.0.0.149, University of Washington, USA) to quantify FGA+ in crEVs. We selected peptides and tested their stability of signal and shape of peaks in the pool sample for final quantification, and referred to the ranking offered by skyline. The sequences of the peptides used are DSHSLTTNIMEILR and QFTSSTSYNR. We found that the significant differences between the N and A groups, as well as between the N and Ca groups (), are similar to the differences detected by DIA-MS (). The levels of FGA in crEVs of healthy individual were concentrated at low values, while those of patients with CRC at high levels. Meanwhile, the levels of FGA in crEVs of adenoma patients ranged from low to high values, while those of most adenoma patients disseminated at medium-high values. The differences of HP as well as S100A9 between group N and Ca matched the results of TMT-MS and WB. The quantification details are provided in Supplemental Data S4.
FGA+ crEVs originate from CRC cells
To determine the origin of the high levels of FGA+ crEVs in the patients with CRC, we evaluated the presence of the FGA-overexpressing EVs in the culture supernatants of two CRC cell lines (SW620 and LoVo) and a mouse embryonic fibroblast cell line (NIH 3T3), as well as in the plasma of a tumour-bearing mouse model. Samples were collected from the mice before and one week after subcutaneously injecting them with SW620 (n = 5) or LoVo (n = 4) cells. FGA+ crEVs increased significantly in the respective samples after in vitro culture (Supplementary Figure 2B) and subcutaneous tumour growth (), indicating that FGA+ crEVs are likely released from the parent CRC cells, and may contribute to primary tumorigenesis.
Discussion
Early tumour detection can remarkably improve the prognosis of cancer patients and increase chances of survival. Indeed, CRC-related mortality rates have decreased in the US and Europe since the introduction of colonoscopy [Citation23]. However, it is an invasive procedure associated with potential complications such as intestinal perforation, and is therefore not routinely performed. In recent years, circulating tumour cells (CTCs), circulating tumour DNA (ctDNA) and circulating exosomes (which are named crEVs in this study) have attracted considerable attention as cancer biomarkers, and offer significant ease of diagnosis since they can be detected in liquid biopsies. For example, CTCs are a reliable indicator of metastases [Citation24], while ctDNA can detect genetic diseases, although it may be an unreliable marker for advanced cancers [Citation25]. EVs are membrane-bound vesicles that are constantly released by various cells, and contain biomolecules including proteins, DNA, and both coding and non-coding RNAs. Therefore, the EVs released from cancer cells carry tumour-specific markers, and are potential biomarkers of cancer progression/metastasis. Recent studies on the diagnostic value of crEVs from the liquid biopsies of cancer patients have shown promising results. For example, Matsumura et al. identified exosomal miR-19a in serum as a prognostic biomarker for CRC recurrence [Citation26]. Although cancer-specific exosomal/EV miRNA panels present a convenient diagnostic method, the miRNAs constitute less than 10% of the total non-coding RNAs in the exosomes/EVs [Citation27,Citation28]. In addition, several exosomal/EV miRNAs are common across different cancer types, limiting their diagnostic value [Citation29]. An alternative approach would be to identify exosomal/EV protein biomarkers. Melo et al. detected exosomes containing the GPC1 protein in 100% of the pancreatic cancer patient samples. Despite high circulating levels in non-malignant pancreatitis as well [Citation30], GPC+ exosomes are a highly sensitive biomarker for the early detection of pancreatic cancer, as shown by Lewis et al. using the microfluidics approach [Citation31].
Detection of crEVs protein biomarkers in liquid biopsies is a rapid, minimally invasive method for cancer screening. However, the extraction of exosomes/EVs from small amounts of biological material is still technically challenging, and may limit the reliability and feasibility of the tests [Citation32]. MS-based proteomics have shown potential in the early diagnosis of malignant tumours, and can be adapted to EV proteome analysis [Citation33]. The isobaric mass tagging-based TMT method used in this study is a multiplexed peptide/protein quantification technique with a higher degree of precision and sensitivity compared to the other MS methods, but is limited by its high costs and relatively low throughput [Citation34]. Most MS analyses of exosomes/EVs have focused on cell supernatants [Citation35] and primary tissues [Citation36]. This is the first study to use TMT-MS on crEVs from cancer patients, which were isolated using ultracentrifugation combined with density gradient centrifugation [Citation37]. The different tumour stages in the CRC cohort were characterized by distinct EV proteomes and phosphoproteomes. Consistent with previous studies showing high plasma fibrinogen (composed of FGA) levels in different tumours [Citation38,Citation39], we found a significant increase in FGA+ crEVs in patients with CRC relative to the healthy donors. Rybarczyk et al. found that breast cancer cells synthesize and secret fibrinogen peptides, which affect their growth and migration [Citation40]. Therefore, we hypothesized that the CRC cells also synthesize FGA, which is engulfed by the EVs and released into the peripheral blood. In addition, elevated phosphorylation of FGA was observed at five serine positions in the patients with CRC. Protein phosphorylation is a major regulatory mechanism that controls protein functions and signalling [Citation41,Citation42], and phosphorylation status is often altered in pathophysiological conditions and therefore is indicative of disease [Citation11]. Serine phosphorylation mainly regulates protein stability and enzyme activity. Since the CRC-associated phosphoproteins were relatively stable inside the EVs, we surmise that they play an important role in tumorigenesis and/or metastases. Previous studies have reported fibrinogen as a predictive biomarker for CRC. Son et al. associated high fibrinogen levels with poor prognosis in colon cancer [Citation43], and Lee et al. found that fibrinogen levels predicted the response of rectal cancer to chemo-radiation therapy [Citation44]. While the plasma proteome contains many thousands of proteins most of which are low-abundance, mass spectrometry-based proteomics methods usually capture a small portion of relatively high-abundance proteins from plasma samples without depletion of the top abundance proteins including albumin and multi-dimensional fractionation of the proteome [Citation45]. However, both high-abundance protein depletion and fractionation increase the technical variability and may affect the abundance of the low-abundance analytes. For the sake of clinical feasibility and practicality, we did not perform depletion and fractionation, therefore the proteins we measured in this study are of relatively high abundance. Nevertheless, while we lose many low-abundance proteins, we successfully detected proteins including FGA and HP, which are consistently measured and distinguished different disease groups. And, this distinguishing difference revealed by plasma EV proteome cannot be detected directly in plasma. The high levels of the FGA+ crEVs could be the result of continuous secretion of these EVs by the tumour cells, or due to cancer-associated changes in the immune system and metabolism. Although our findings point to the first possibility, we cannot exclude the second at present.
The different proteomic signatures of crEVs isolated from patients with CRC at different stages were validated in multiple clinical cohorts using fast DIA-MS [Citation13]. More plasma sample amount (~ 100 microgram peptides) was used in TMT experiments, due to the requirement of chemical labelling, fractionation and multiple MS injections, while the DIA only needs ~ 1 microgram peptides in a single MS injection. In addition, TMT experiment analyses only 6–11 samples and consumes relatively long MS instrument time due to the need of pre-fractionation, while label-free DIA analyses do not have limitations in the number of samples. Moreover, the technical variation of TMT experiments introduced by pre-fractionation is somehow hard to evaluate. TMT experiments showed non-trivial batch effect in large sample set [Citation46]. In addition, fast DIA-MS reduced both operation costs and time, and the low complexity predictor of our study limited the pitfalls of over-fitting. The different expression of FGA+ crEV in the verification cohort detected by DIA-MS was confirmed by PRM-MS. The PRM results suggest that FGA+ crEV can distinguish patients with CRC from healthy individuals, while higher level of FGA+ crEV is also a warning of adenoma. There are statistical differences of the levels of Hp, S100A9 and FN1 among different groups. However, extremely high values and low values, as well as the overlap range between groups make them not as stability biomarkers for early screening as FGA+ crEV is. Therefore, DIA-MS on liquid biopsies offer a high throughput, non-invasive and reliable tool for screening clinical samples.
One drawback of our approach is the necessity of multiple overnight ultracentrifugation procedures to isolate and purify EVs from the plasma samples, which limits the throughput and leads to relative high cost for detection. We chose this isolation method for scientific research purpose, and this limitation can be alleviated by incorporating existing and emerging methods to isolate crEVs when it comes to clinical application. For example, both automated microfluidics technique and optimized precipitation-based plasma extracellular vesicle isolation are fast and affordable [Citation47,Citation48]. As we will continue to improve the proteomic coverage of the plasma and plasma EVs library and re-mine the data in the future, more meaningful differential proteins could be found as biomarkers, which would increase the accuracy of clinical application.
Ethics approval
Animal studies and sample collections were approved by the Institutional Ethics Committee of the Second Affiliated Hospital Zhejiang University School of Medicine (Zhejiang, P.R. China, permit number SYXK2018-0012). Plasma samples were collected under approval from the Second Affiliated Hospital of Zhejiang University, and all patients were properly consented before samples were collected (Number 2018-164).
Declaration of interest statement
The research group of Tiannan Guo is supported by Thermo-Fisher, which provides access to prototype methodologies partly used in this study.
Supplemental Material
Download Zip (3.9 MB)Acknowledgments
We thank Xiaofang Yu (Zhejiang University) for his guidance on article revision and polishing, and Yuchen Xu (Emory University) for his technical assistance in candidate biomarkers picking. We thank Westlake University Supercomputer Center for assistance in data storage and computation.
Supplementary material
Supplemental material for this article can be accessed here.
Additional information
Funding
References
- Arnold M, Sierra MS, Laversanne M, et al. Global patterns and trends in colorectal cancer incidence and mortality. Gut. 2017;66:683–13.
- Brodt P. Role of the microenvironment in liver metastasis: from pre- to prometastatic niches. Clin Cancer Res off J Am Assoc Cancer Res. 2016;22:5971–5982.
- Shao Y, Chen T, Zheng X, et al. Colorectal cancer-derived small extracellular vesicles establish an inflammatory premetastatic niche in liver metastasis. Carcinogenesis. 2018;39:1368–1379.
- Doubeni CA, Gabler NB, Wheeler CM, et al. Timely follow-up of positive cancer screening results: A systematic review and recommendations from the PROSPR Consortium. CA Cancer J Clin. 2018;68:199–216.
- Issa IA, Noureddine M. Colorectal cancer screening: an updated review of the available options. World J Gastroenterol. 2017;23:5086–5096.
- Yanez-Mo M, Siljander PR, Andreu Z, et al. Biological properties of extracellular vesicles and their physiological functions. J Extracell Vesicles. 2015;4:27066.
- Tkach M, Thery C. Communication by extracellular vesicles: where we are and where we need to go. Cell. 2016;164:1226–1232.
- Melo SA, Luecke LB, Kahlert C, et al. Glypican-1 identifies cancer exosomes and detects early pancreatic cancer. Nature. 2015;523:177–182.
- Li J, Li B, Ren C, et al. The clinical significance of circulating GPC1 positive exosomes and its regulative miRNAs in colon cancer patients. Oncotarget. 2017;8:101189–101202.
- Chen IH, Xue L, Hsu CC, et al. Phosphoproteins in extracellular vesicles as candidate markers for breast cancer. Proc Natl Acad Sci U S A. 2017;114:3175–3180.
- Iliuk AB, Arrington JV, Tao WA. Analytical challenges translating mass spectrometry-based phosphoproteomics from discovery to clinical applications. Electrophoresis. 2014;35:3430–3440.
- Gillet LC, Navarro P, Tate S, et al. Targeted data extraction of the MS/MS spectra generated by data-independent acquisition: a new concept for consistent and accurate proteome analysis. Mol Cell Proteomics. 2012;11:O111 016717.
- Guo T, Kouvonen P, Koh CC, et al. Rapid mass spectrometric conversion of tissue biopsy samples into permanent quantitative digital proteome maps. Nat Med. 2015;21:407–413.
- Reubsaet L, Sweredoski MJ, Moradian A. Data-independent acquisition for the Orbitrap Q Exactive HF: a tutorial. J Proteome Res. 2019;18:803–813.
- Zhu T, Zhu Y, Xuan Y, et al. DPHL: A pan-human protein mass spectrometry library for robust biomarker discovery. bioRxiv. 2020;2020(2):03.931329.
- Peterson AC, Russell JD, Bailey DJ, et al. Parallel reaction monitoring for high resolution and high mass accuracy quantitative, targeted proteomics. Mol Cell Proteomics. 2012;11:1475–1488.
- Bourmaud A, Gallien S, Domon B. Parallel reaction monitoring using quadrupole-Orbitrap mass spectrometer: principle and applications. Proteomics. 2016;16:2146–2159.
- Wu J, Wang Y, Xu X, et al. Transcriptional activation of FN1 and IL11 by HMGA2 promotes the malignant behavior of colorectal cancer. Carcinogenesis. 2016;37:511–521.
- Sun L, Hu S, Yu L, et al. Serum haptoglobin as a novel molecular biomarker predicting colorectal cancer hepatic metastasis. Int J Cancer. 2016;138:2724–2731.
- Fan NJ, Chen HM, Song W, et al. Macrophage mannose receptor 1 and S100A9 were identified as serum diagnostic biomarkers for colorectal cancer through a label-free quantitative proteomic analysis. Cancer Biomarkers. 2016;16:235–243.
- Palumbo JS, Talmage KE, Massari JV, et al. Platelets and fibrin(ogen) increase metastatic potential by impeding natural killer cell-mediated elimination of tumor cells. Blood. 2005;105:178–185.
- Rost HL, Rosenberger G, Navarro P, et al. OpenSWATH enables automated, targeted analysis of data-independent acquisition MS data. Nat Biotechnol. 2014;32:219–223.
- Malvezzi M, Carioli G, Bertuccio P, et al. European cancer mortality predictions for the year 2018 with focus on colorectal cancer. Ann Oncol. 2018;29:1016–1022.
- Giuliano M, Shaikh A, Lo HC, et al. Perspective on circulating tumor cell clusters: why it takes a village to metastasize. Cancer Res. 2018;78:845–852.
- Merker JD, Oxnard GR, Compton C, et al. Circulating tumor DNA analysis in patients with cancer: american society of clinical oncology and college of American pathologists joint review. J Clin Oncol. 2018;36:1631–1641.
- Matsumura T, Sugimachi K, Iinuma H, et al. Exosomal microRNA in serum is a novel biomarker of recurrence in human colorectal cancer. Br J Cancer. 2015;113:275–281.
- Liu Y, Gu Y, Han Y, et al. Tumor exosomal RNAs promote lung pre-metastatic niche formation by activating alveolar epithelial TLR3 to recruit neutrophils. Cancer Cell. 2016;30:243–256.
- Wei Z, Batagov AO, Schinelli S, et al. Coding and noncoding landscape of extracellular RNA released by human glioma stem cells. Nat Commun. 2017;8:1145.
- Kawamura M, Toiyama Y, Tanaka K, et al. Can circulating MicroRNAs become the test of choice for colorectal cancer? Curr Colorectal Cancer Rep. 2014;10:403–410.
- Lai X, Wang M, McElyea SD, et al. A microRNA signature in circulating exosomes is superior to exosomal glypican-1 levels for diagnosing pancreatic cancer. Cancer Lett. 2017;393:86–93.
- Lewis JM, Vyas AD, Qiu Y, et al. Integrated analysis of exosomal protein biomarkers on alternating current electrokinetic chips enables rapid detection of pancreatic cancer in patient blood. ACS Nano. 2018;12:3311–3320.
- Fujita Y, Yoshioka Y, Ochiya T. Extracellular vesicle transfer of cancer pathogenic components. Cancer Sci. 2016;107:385–390.
- Megger DA, Pott LL, Ahrens M, et al. Comparison of label-free and label-based strategies for proteome analysis of hepatoma cell lines. Biochim Biophys Acta. 2014;1844:967–976.
- Savitski MM, Mathieson T, Zinn N, et al. Measuring and managing ratio compression for accurate iTRAQ/TMT quantification. J Proteome Res. 2013;12:3586–3598.
- Choi DS, Lee JM, Park GW, et al. Proteomic analysis of microvesicles derived from human colorectal cancer cells. J Proteome Res. 2007;6:4646–4655.
- de Wit M, Kant H, Piersma SR, et al. Colorectal cancer candidate biomarkers identified by tissue secretome proteome profiling. J Proteomics. 2014;99:26–39.
- Peinado H, Zhang H, Matei IR, et al. Pre-metastatic niches: organ-specific homes for metastases. Nat Rev Cancer. 2017;17:302–317.
- Obata J, Tanaka N, Mizuno R, et al. Plasma fibrinogen level: an independent prognostic factor for disease-free survival and cancer-specific survival in patients with localised renal cell carcinoma. BJU Int. 2016;118:598–603.
- Sun ZQ, Han XN, Wang HJ, et al. Prognostic significance of preoperative fibrinogen in patients with colon cancer. World J Gastroenterol. 2014;20:8583–8591.
- Simpson-Haidaris PJ, Rybarczyk B. Tumors and fibrinogen. The role of fibrinogen as an extracellular matrix protein. Ann N Y Acad Sci. 2001;936:406–425.
- Hunter T. Signaling–2000 and beyond. Cell. 2000;100:113–127.
- Kabuyama Y, Resing KA, Ahn NG. Applying proteomics to signaling networks. Curr Opin Genet Dev. 2004;14:492–498.
- Son HJ, Park JW, Chang HJ, et al. Preoperative plasma hyperfibrinogenemia is predictive of poor prognosis in patients with nonmetastatic colon cancer. Ann Surg Oncol. 2013;20:2908–2913.
- Lee JH, Hyun JH, Kim DY, et al. The role of fibrinogen as a predictor in preoperative chemoradiation for rectal cancer. Ann Surg Oncol. 2015;22:209–215.
- Geyer PE, Holdt LM, Teupser D, et al. Revisiting biomarker discovery by plasma proteomics. Mol Syst Biol. 2017;13:942.
- Brenes A, Hukelmann J, Bensaddek D, et al. Multibatch TMT reveals false positives, batch effects and missing values. Mol Cell Proteomics. 2019;18:1967–1980.
- Wunsch BH, Smith JT, Gifford SM, et al. Nanoscale lateral displacement arrays for the separation of exosomes and colloids down to 20 nm. Nat Nanotechnol. 2016;11:936–940.
- Karttunen J, Heiskanen M, Navarro-Ferrandis V, et al. Precipitation-based extracellular vesicle isolation from rat plasma co-precipitate vesicle-free microRNAs. J Extracell Vesicles. 2019;8:1555410.