
ABSTRACT
Background: Fungal extracellular vesicles (EVs) have been implicated in host-pathogen and pathogen-pathogen communication in some fungal diseases. In depth research into fungal EVs has been hindered by the lack of specific protein markers such as those found in mammalian EVs that have enabled sophisticated isolation and analysis techniques. Despite their role in fungal EV biogenesis, ESCRT proteins such as Vps23 (Tsg101) and Bro1 (ALIX) are not present as fungal EV cargo. Furthermore, tetraspanin homologs are yet to be identified in many fungi including the model yeast S. cerevisiae.
Objective: We performed de novo identification of EV protein markers for the major human fungal pathogen Candida albicans with adherence to MISEV2018 guidelines.
Materials and methods: EVs were isolated by differential ultracentrifugation from DAY286, ATCC90028 and ATCC10231 yeast cells, as well as DAY286 biofilms. Whole cell lysates (WCL) were also obtained from the EV-releasing cells. Label-free quantitative proteomics was performed to determine the set of proteins consistently enriched in EVs compared to WCL.
Results: 47 proteins were consistently enriched in C. albicans EVs. We refined these to 22 putative C. albicans EV protein markers including the claudin-like Sur7 family (Pfam: PF06687) proteins Sur7 and Evp1 (orf19.6741). A complementary set of 62 EV depleted proteins was selected as potential negative markers.
Conclusions: The marker proteins for C. albicans EVs identified in this study will be useful tools for studies on EV biogenesis and cargo loading in C. albicans and potentially other fungal species and will also assist in elucidating the role of EVs in C. albicans pathogenesis. Many of the proteins identified as putative markers are fungal specific proteins indicating that the pathways of EV biogenesis and cargo loading may be specific to fungi, and that assumptions made based on studies in mammalian cells could be misleading.
Abbreviations: A1 – ATCC10231; A9 – ATCC90028; DAY B – DAY286 biofilm; DAY Y – DAY286 yeast; EV – extracellular vesicle; Evp1 – extracellular vesicle protein 1 (orf19.6741); GO – gene ontology; Log2(FC) – log2(fold change); MCC – membrane compartment of Can1; MDS – multidimensional scaling; MISEV – minimal information for studies of EVs; sEVs – small EVs; SP – signal peptide; TEMs – tetraspanin enriched microdomains; TM – transmembrane; VDM – vesicle-depleted medium; WCL – whole cell lysate
Introduction
Fungal infections are ubiquitous and are estimated to affect over 20% of the world’s population [Citation1]. These infections range from non-life-threatening mycoses of the skin and nails, to deadly systemic infections. They represent a significant burden on healthcare systems, with the direct medical cost of fungal disease in the USA in 2017 estimated to be 7.2 billion USD [Citation2]. The fungi responsible for most fungal infections worldwide are the various species of Candida [Citation3]. Candida is primarily associated with relatively harmless superficial infections [Citation4], but infections of the bloodstream or internal organs are associated with mortality rates as high as 75% [Citation4,Citation5]. Over 12,000 people were hospitalised for invasive candidiasis in the US in 2017 alone, at a cost of almost 1.2 billion USD [Citation2]. The species responsible for the majority of Candida infections is Candida albicans [Citation6]. C. albicans infections are most often treated with two classes of antifungals, the azoles which target biosynthesis of the fungal-specific sterol ergosterol, and the echinocandins, which target biosynthesis of the major cell wall polysaccharide 1,3-β-glucan [Citation7]. Resistance to these and other antifungals has begun to emerge [Citation8–Citation11] making the development of new antifungals with novel mechanisms of action paramount. Understanding the interface between the host and pathogen will help to identify new targets for controlling C. albicans infections.
Extracellular vesicles (EVs) are key factors in the progression of many diseases ranging from cancer [Citation12] to neurodegenerative diseases [Citation13] and bacterial infections [Citation14]. EVs are defined as “particles naturally released from the cell that are delimited by a lipid bilayer and cannot replicate” [Citation15]. Packaging of cargo into EVs is a method for the coordinated release of biological molecules via a non-classic method of secretion. This facilitates intercellular communication both within an organism [Citation16] and between organisms [Citation17].
Recently, EVs have been proposed to function in the pathogenesis of fungal disease, particularly in yeast infections including those from the genera Cryptococcus [Citation18–Citation20], Paracoccidioides [Citation21,Citation22] and Candida [Citation23–Citation25]. The cargo of fungal EVs comprises proteins [Citation26], nucleic acids [Citation27], lipids [Citation23,Citation24,Citation28,Citation29] and carbohydrates [Citation22,Citation28]. Fungal EVs activate innate immune cells in vitro [Citation18,Citation23,Citation24,Citation30] and are responsible for the hypervirulence of a Cryptococcus gattii strain that caused disease in immunocompetent individuals [Citation20]. Given the potential roles for EVs in host-pathogen interactions, there is significant motivation to better understand the biology of fungal EVs.
C. albicans EVs are typical of fungal EVs. They contain proteins, lipids, nucleic acids and carbohydrates [Citation23,Citation24,Citation27,Citation31,Citation32]. Activation of murine macrophages and dendritic cells by EVs from C. albicans indicates a potential role for EVs in modulating the innate immune response to the fungus [Citation23,Citation24]. Formation of biofilms is a critical component of C. albicans pathogenesis [Citation33] and the biofilm matrix provides a protective layer for the fungus against antifungal drugs [Citation34]. The cargo of EVs produced by C. albicans biofilms includes key proteins and carbohydrates for biofilm biogenesis, making EVs crucial contributors to the establishment of biofilms [Citation32]. Furthermore, “add-back” of EVs from wildtype biofilms restored the loss of azole resistance in biofilms formed by strains with deletions in genes encoding important enzymes for matrix generation [Citation32]. That is, EVs also function in antifungal drug resistance.
The tools and techniques for the study of fungal EVs have been adapted from those established for mammalian systems, where EVs are most intensively studied. Many of the cutting-edge experimental techniques for isolation, tracking and analysis of mammalian EVs are dependent on protein markers [Citation35]. They include identifying fractions containing EVs after density gradient centrifugation [Citation36] or size exclusion chromatography [Citation37], purification of EVs via immunoaffinity capture [Citation38], and imaging of EV release and uptake [Citation39]. Unfortunately, proteomic analyses of fungal EVs have revealed that the markers that have been so useful for the isolation and study of mammalian EVs are not present in fungal EVs [Citation26]. Thus, there are differences in the protein cargo and possibly the biogenesis of EVs from fungi and mammalian cells, and de novo identification of fungal EV markers is essential. Inconsistencies between published data sets on the protein content of fungal EVs [Citation26] means that a robust proteomic analysis of EVs from a particular species is required to provide an adequate data set for EV marker identification. In this study, we have addressed this problem by performing in-depth proteomic analyses on multiple C. albicans strains to define a set of broadly applicable C. albicans EV markers.
Label-free quantitative proteomics was employed to generate an overview of the differences in EV and whole cell lysate (WCL) proteomes for a selection of different C. albicans strains and morphologies; DAY286 yeast, DAY286 biofilm, ATCC90028 yeast and ATCC10231 yeast. By comparing the EV versus WCL data across all strains and morphologies we identified 47 putative EV markers which are enriched in C. albicans EVs regardless of source, cell strain, or morphology. These candidate protein markers include GTPases, enzymes crucial for cell wall synthesis, and plasma membrane proteins resembling mammalian tetraspanins or claudins. The “minimal information for studies of EVs” (MISEV) 2018 position statement indicates that, in addition to demonstrating the enrichment of EV marker proteins in EV preparations, a deficiency of non-EV proteins should also be shown [Citation15]. With this in mind, we identified 62 proteins that were depleted in C. albicans EVs compared to the WCL from the four data sets. Validation of these putative EV markers in vitro will allow future C. albicans EV research to align better with the recommendations set out in MISEV2018. Furthermore, robust C. albicans EV markers will allow adaptation of mammalian EV analysis techniques for use in the study of EVs in C. albicans pathogenesis and will provide potential new targets for the development of novel antifungals.
Materials and methods
C. albicans strains and maintenance
C. albicans strains used in this study were DAY286 [Citation40], ATCC90028 and ATCC10231. All strains were maintained on YPD Agar plates (1% yeast extract, 2% peptone, 2% dextrose, 2% agar). Liquid starter cultures were grown overnight in YPD medium (1% yeast extract, 2% peptone, 2% dextrose) at 30°C and 300 rpm.
Yeast culture conditions
For isolation of EVs from yeast form C. albicans (DAY286, ATCC90028, ATCC10231), YPD starter cultures were used to inoculate 150 or 300 mL YPD at an OD600 = 0.2 in a baffled flask. Cultures were incubated at 30°C overnight (approximately 20 h). The culture OD600 was measured immediately prior to EV isolation.
Biofilm culture conditions
Biofilms (DAY286) were generated based on the method described in [Citation41] with modifications. Briefly, 500 mL pre-warmed ½ strength RPMI (250 mL RPMI 1640 (Sigma), 0.165 M MOPS (Sigma) and 250 mL 3.6% dextrose) was inoculated using a liquid starter culture to 1.0 × 10⁶ cells/mL. Five 25 × 25 cm non-treated bioassay dishes (Thermo Fisher Scientific) were each filled with 100 mL of inoculated ½ RPMI and incubated statically for 4 h at 37°C to allow for adhesion of cells to the dish. Following cell adhesion, the culture medium (and any non-adherent cells) was decanted and replaced with 200 mL pre-warmed full strength RPMI. Biofilms were formed by incubating the dishes for 54 h at 37°C with agitation at 28 rpm in an Incu-Shaker Mini (Benchmark Scientific).
EV isolation
EVs were isolated according to the method described in [Citation28] with minor modifications. In brief, yeast cells or biofilm fragments were separated from the culture supernatants by centrifugation at 4000 x g for 15 min in an Heraeus Multifuge X3 R (75,003,607 rotor, kadj = 11,778.7, Thermo Scientific), then 15,000 x g for 30 min in an Avanti J-E centrifuge (JLA 16.250 rotor, kadj = 2790.4, Beckman Coulter). Supernatants were 0.45 μm filtered (Millipore) then ultracentrifuged at 100,000 x g for 1 h in a Beckman Coulter Optima L-100XP using 70 mL polycarbonate bottle assemblies (45Ti rotor, kadj = 312.6, Beckman Coulter) to pellet EVs, which were resuspended in phosphate buffered saline (137 mM NaCl, 2.7 mM KCl, 10 mM Na2HPO4, 1.8 mM KH2PO4) (PBS) and transferred to 1.5 mL polypropylene tubes (Beckman Coulter). EVs were ultracentrifuged again at 120,000 x g for 1 h using a Beckman TL-100 ultracentrifuge (TLA55 rotor, kadj = 102.3, Beckman Coulter) then resuspended in 100 μL PBS. An aliquot of yeast cells (250 µL) was reserved for preparation of yeast whole cell lysate. Similarly, 250 μL of biofilm scrapings were resuspended in PBS for preparation of biofilm lysate.
Preparation of whole cell lysate and protein quantification
C. albicans cells were washed three times with PBS prior to the addition of approximately 400 µL of acid washed glass beads (Sigma). Cells were lysed using a TissueLyser (Qiagen) at 30 bps for 3 × 1 min bursts with 1 min incubations on ice between bursts. Debris and beads were pelleted by centrifugation for 5 min at 23,000 x g at 4°C. The supernatant was retained as the respective lysate sample. Protein concentration of EVs and whole cell lysates (WCL) was determined using a QubitTM 4 fluorimeter (Life Technologies) and the QubitTM protein assay kit according to the manufacturer’s instructions.
Nanoparticle tracking analysis
The particle size and concentration of EV samples was determined using a NanoSight NS300 equipped with a 405 nm (blue) laser (Malvern Instruments). Immediately prior to injection, EVs were diluted between 1:250 and 1:6000 in 0.22 μm (Millipore) filtered PBS to bring the particle concentration within the manufacturer’s recommended range (108–109 particles/mL). NTA software version 3.2 was used to record data in 60 s reads in triplicate. Instrument settings included: a syringe infusion rate of 70, temperature held at 25°C, a camera level of 11, and a detection threshold of 6. The particle concentrations and particle size parameters were recorded. Dilution factor correction and averaging of data across biological replicates was performed using the R package tidyNano [Citation42].
Transmission electron microscopy
Carbon-coated 400-mesh copper grids (ProSciTech) were glow discharged for 1 min in a K950X turbo evaporator coupled to a K350 glow discharge unit (Quorum Technologies Ltd). EVs (5 µL) were deposited onto the grid and incubated for 1 min. Grids were then washed once with ultrapure water and negatively stained three times with 2% (v/v) uranyl acetate (Agar Scientific). Excess solution was blotted off and the grids were dried overnight. AJEM 2100 electron microscope (JEOL Ltd) operated at 200 kV was used for imaging.
Sample preparation for mass spectrometry
A total of 14 EV and WCL samples from four different C. albicans strains were used for proteomics and NTA analyses; DAY286 yeast (n = 3), ATCC90028 yeast (n = 3), ATCC10231 yeast (n = 3), and DAY286 biofilm (n = 5). Details of each independent culture from which the EV and WCL samples were isolated are provided in . Preparation of EV and WCL proteomics samples and MS data acquisition was performed in three separate batches; DAY286 yeast, DAY286 biofilm, and then both ATCC strains.
Table 1. Candidate positive protein markers for C. albicans EVs. This list of proteins consists of those that were found to be exclusive to EVs or significantly enriched in EVs across the four C. albicans strains examined in this study. Proteins are grouped according to their subcellular localisation as annotated in the Candida Genome Database (candidagenome.org) [Citation48,Citation49] unless otherwise indicated. The log2 ratio of the abundance (mean MaxQuant LFQ intensity) of each protein in EVs compared to whole cell lysate (WCL) for each strain is listed. “ex” indicates where a protein was only quantified in the EV fraction and not the WCL for that strain. The “TM” column indicates the number of transmembrane domains for each protein as annotated in UniProt. “SP” indicates whether a protein is annotated as having a signal peptide according to UniProt. “VDM” shows whether a protein has been detected previously in vesicle-depleted culture media (i.e. the proteins may also be in the soluble secretome) [Citation31]. Underlined proteins are those identified as the best candidates for positive EV markers according to the criteria depicted in Supplementary Figure S1.
EVs or WCLs (15 μg protein) were boiled in LDS sample buffer (Life Technologies) and TCEP (tris(2-carboxyethyl)phosphine) (Thermo Fisher Scientific), then separated by short-range SDS-PAGE [Citation43]. The gel was fixed in 50% (v/v) methanol, 7% (v/v) acetic acid for 30 min, and the samples were excised. The proteins were reduced (2 mM TCEP, 1 h) and alkylated (40 mM iodoacetamide, 30 min in the dark) before digestion with 1 μg trypsin (Promega) for 18 h at 37°C. Peptides were then extracted from the gel pieces with 85% (v/v) ACN, 0.5% (v/v) TFA, lyophilised and resuspended in 20 μL of 5% (v/v) ACN, 0.5% (v/v) TFA.
Mass spectrometry (ESI-LC-MS/MS) of EVs and WCL proteins
Two injections of 6 μL were used for each biological replicate and the samples were randomised prior to injection. Peptides were analysed as described previously [Citation44] with modifications. Using a nanoflow UPLC instrument (UltiMateTM 3000 RSLCnano, Thermo Fisher Scientific), the reconstituted peptides were loaded onto a precolumn (C18 PepMap 300 μm ID x 2 cm trapping column, Thermo Fisher Scientific) and washed (water with 0.1% formic acid, 2% ACN) prior to separation using a 90 min linear ACN gradient on an analytical column (BEH C18, 1.7 μm, 130 Å and 75 μm ID x 25 cm, Waters).
The nanoflow UPLC was coupled on-line to a Q Exactive HF mass spectrometer (Thermo Fisher Scientific) with a nanoelectrospray ion source (Nanospray Flex, Thermo Fisher Scientific). The separation of peptides was performed at 45°C, 250 nL/min using a linear ACN gradient of buffer A(water with 0.1% formic acid, 2% ACN) and buffer B (water with 0.1% formic acid, 80% ACN). The gradient started from 2% buffer B to 13% in 6 min, to 33% buffer B over 70 min, followed by 50% at 80 min. The gradient was then increased from 50% buffer B to 95% for 5 min and stayed 95% for 1 min. The column was then equilibrated for 4 min with buffer A.
Data were collected in data-dependent acquisition mode using an MS scan range of m/z 350–1500 and resolution of 60,000. HCD MS/MS spectra were collected for the 15 most intense ions per MS scan at 30,000 resolution with a normalised collision energy of 28% and an isolation window of 1.4 m/z. Dynamic exclusion parameters were set as follows: exclude isotope on, duration 30 s and peptide match preferred. Other Orbitrap instrument parameters included an MS maximum injection time of 30 ms with AGC target 3 x 10⁶, for a maximum injection time of 110 ms with an AGT target of 1 × 10⁵.
Database search and protein identification
Tandem MS data collected for EVs and WCLs were processed in MaxQuant version 1.6.0.16 [Citation45]. Andromeda was used to search the data against the UniProt C. albicans reference proteome (UP000000559; downloaded 16/06/2018; 6035 entries) and the common contaminants and decoys list [Citation46]. The raw data from both injections of each biological replicate was combined into one sample using the “set experiment” option in MaxQuant. Trypsin was selected as the digestion enzyme and up to 2 missed cleavages were allowed. Carbamidomethylation of cysteine was set as a fixed modification and oxidation of methionine and N-terminal acetylation were set as variable modifications. Peptide mass tolerances were 20 ppm (first search) and 4.5 ppm (main search), and false discovery rate (FDR) cut offs were 0.01 for both proteins and peptides. Minimum and maximum peptide lengths were set to 8 and 25 respectively and match between runs was not selected.
Label-free quantification (LFQ) of protein abundances was performed using the MaxLFQ algorithm [Citation47]. Fast LFQ was selected and normalisation was skipped. The proteinGroups.txt MaxQuant output was used for further analyses. Metadata for identified proteins (localisation, topology, function) were obtained from the UniProt C. albicans reference proteome as well as the C. albicans SC5314 Assembly 22 chromosomal feature file available from the Candida Genome Database (candidagenome.org/download/chromosomal_feature_files) [Citation48,Citation49].
Protein filtering and proteomic analysis
All proteomics statistical and data analyses were performed using R version 3.6.0 [Citation50], Statistical tests, multiple comparison corrections and important individual R and Bioconductor packages are referenced where they have been used. The DAY286 yeast, DAY286 biofilm and ATCC proteinGroups.txt MaxQuant output files were initially processed and analysed separately. The analysis methodology and some modified functions were derived from the Bioconductor package DEP [Citation51].
First, reversed and contaminant proteins as well as proteins identified by less than 2 unique peptides were removed. The resulting proteins were filtered for those quantified (LFQ intensity > 0) in a minimum of 2/3 yeast or 4/5 biofilm EV or WCL biological replicates (Supplementary Data S1). LFQ intensities were log2 transformed, then normalised using the cyclic loess normalisation method available in the Bioconductor package limma [Citation52]. Proteins were then separated into two groups: those exclusive to EVs or WCL, and those quantified in both samples. Missing LFQ values in the latter group were imputed using the bpca method from the Bioconductor package pcaMethods [Citation53], while exclusive proteins were left untouched. Finally, differential abundance analyses of proteins in EV versus WCL or EV vs EV were performed using the empirical Bayes method available in limma [Citation52,Citation54]. The resulting p-values were adjusted using the Benjamini-Hochberg approach [Citation55] and the significance threshold was set at an adjusted p-value of 0.01 and a log2(fold change) of 1. Results of the differential abundance analyses are available in Supplementary Data S2 and Supplementary Data S6.
Functional enrichment analysis and clustering
The online tool FungiFun2 version 2.2.8 (sbi.hki-jena.de/fungifun) was used for all GO term enrichment analyses [Citation56]. The hypergeometric distribution significance test was used and resulting p-values were adjusted using the Benjamini-Hochberg procedure. Enriched GO terms were those with an adjusted p-value less than 0.01. Full results from the functional enrichment analyses are presented in Supplementary Data S3 and S7. Multidimensional scaling (MDS) plots were constructed using the plotMDS function from limma [Citation52]. To construct the heatmap in (), unsupervised clustering of log2(FC) for the proteins common to EVs from all strains was performed using Gower’s formula via the daisy function from the R package cluster [Citation57].
Protein localisation and attribute prediction
Location information of proteins was obtained from the Candida Genome Database (candidagenome.org) or the C. albicans UniProt reference proteome (UP000000559; downloaded 16/06/2018; 6035 entries) [Citation48,Citation49,Citation58]. When this information was not available, the subcellular location of a C. albicans protein was inferred from the S. cerevisiae homolog as annotated in the Candida Genome Database [Citation48,Citation49]. Signal peptide and transmembrane domain annotations for each protein were obtained from UniProt or were predicted using TOPCONS2 (topcons.cbr.su.se) [Citation58,Citation59]. Prediction of protein palmitoylation sites was performed using CSS-PALM 4.0 (csspalm.biocuckoo.org) [Citation60].
C. albicans EV marker definition
Lists of proteins significantly enriched and exclusive to EVs from each strain were compared using the R package VennDiagram [Citation61]. Proteins common to all the three strains and both morphologies were selected as potential EV positive protein markers. This was repeated for significantly enriched and exclusive proteins in WCL to define potential EV negative protein markers. Initial candidate EV marker proteins were refined using the following criteria to obtain a shortlist of the best potential markers. Ideal positive EV markers were proteins that satisfied MISEV2018 marker categories 1 and 2 [Citation15] and had less than five transmembrane domains, no recognisable signal peptide, and were not detected in vesicle-depleted media [Citation31]. Ideal negative EV marker proteins were selected based on prior tagging with fluorescent proteins in literature, prior detection via Western blot, and adherence to MISEV2018 marker categories 3 or 4 [Citation15].
Data availability
The proteomics data have been deposited in the ProteomeXchange Consortium database via the PRIDE partner repository [Citation62,Citation63] with the data set identifiers PXD014367 (DAY286 yeast), PXD014388 (ATCC90028 and ATCC10231) and PXD014389 (DAY286 biofilm). These data include “RAW” files, peak list files, MaxQuant search parameters, MaxQuant search engine txt output and the UniProt C. albicans reference proteome FASTA file. The proteinGroups.txt files and source code used in this study is freely available in an online research compendium available at github.com/csdaw/candidaev. It was constructed using the R package rrtools [Citation64] and is structured as an R package which can be used to reproduce the results as submitted. The compendium has also been permanently archived at zenodo (https://www.doi.org/10.5281/zenodo.3747549).
Results
EV size distribution is dependent on the C. albicans source strain
EVs were isolated from different strains using a modified version of the differential ultracentrifugation method defined by [Citation28] (Supplementary Figure S1). The strains included the clinical isolate strains ATCC90028 (isolated from blood) and ATCC10231 (isolated from a patient with bronchomycosis). Areference strain commonly used in experiments with C. albicans mutants, DAY286, was also assessed in both yeast and biofilm morphology. Characterisation was performed in accordance with the MISEV2018 recommendations wherein the EV preparation and the EV source are imaged and described quantitatively [Citation15]. Information on each EV preparation used for proteomics experiments and the EV source culture is provided in Supplementary Table S1.
The final protein yield of the EV samples ranged from 18.0 to 71.6 µg with concentrations of 0.192 to 0.716 μg/μL (Supplementary Table S1). EVs from DAY286 yeast and ATCC90028 had a higher protein content than those from ATCC10231 cultures and DAY286 biofilms.
TEM visualisation revealed cup-shaped particles typically 200 nm or less in diameter as well as some non-vesicular co-isolated components ()). Nanoparticle tracking analysis (NTA) of the EV preparations agreed with the TEM imaging, revealing that the mode size of C. albicans EVs isolated at 100,000 x g was less than 200 nm for all samples (Supplementary Table S1). The EVs examined in this study are primarily “small EVs” (sEVs) as defined in MISEV2018 [Citation15], hence the proteomics results are relevant for sEVs and not necessarily larger EVs.
Figure 1. Characterisation and quantification of EVs from different C. albicans strains. (a) Representative TEM images of EVs isolated from different C. albicans strains. Scale bar indicates 0.5 µm. (B) Size distribution of DAY286 yeast (n = 3), ATCC90028 yeast (n = 3), ATCC10231 yeast (n = 3), and DAY286 biofilm (n = 5) EVs as measured by nanoparticle tracking analysis. Bar plots show the percentage of the total number of EVs that can be assigned to each size range. The size of the bars indicates the mean percentage across each biological replicate and the error bars indicate the standard error of the mean. NTA traces for the individual biological replicates are presented in Supplementary Figure S2. (C) Comparison of the ratio of particle concentration to protein concentration of the EV fraction, (particles/mL) ÷ (µg protein/mL), across the four EV sources. Each dot represents one biological replicate. Sample means were compared using One-way ANOVA followed by Tukey’s HSD post-hoc test. Adjusted p-values indicating significant differences are shown. The particle and protein concentrations for each biological replicate are provided in Supplementary Table S1.
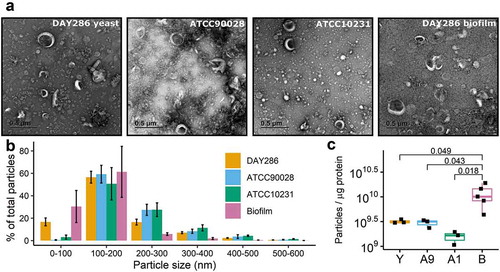
The distribution of EV particle size differed slightly for each strain (), Supplementary Figure S2). The yeast form strains had a broader range of EV sizes, with particles up to 500 nm being detected. Conversely, the biofilm EVs showed a tight, symmetrical distribution centred around 100 nm. Interestingly, EVs from both ATCC strains had a significantly larger mode diameter than EVs from either morphology of DAY286 (Supplementary Figure S3A) which was reflected by a lack of detected particles for ATCC strain EVs below 100 nm ()). The total particle concentration of EVs from ATCC90028, DAY286 yeast and DAY286 biofilm was not significantly different (Supplementary Figure S3B), and typically ranged from 1 to 3 × 10¹² particles/mL; although one exceptional biofilm EV preparation had 8 × 10¹² particles/mL that skewed the biofilm average (Supplementary Table S1). Conversely, the particle concentration of ATCC10231 EVs was lower than all the other EV samples (2 to 5 × 10¹¹ particles/mL), but this difference was only significant compared to the biofilm EV preparations (Supplementary Figure S3B). Comparing the ratio of particles per μg of protein for each EV sample revealed that DAY286 biofilm EVs had a significantly higher ratio of particles per μg of protein than the other C. albicans EVs.
C. albicans strains show similar numbers of differentially abundant EV proteins
MaxQuant and the Andromeda search engine were used to identify proteins in EVs and WCL for each strain ()). Raw MS/MS spectra were used to query the C. albicans (SC5314) reference proteome in the UniProt database. Initially, proteins identified by less than two unique peptides were removed. Proteins with two or more unique peptides were filtered to ensure that they were detected in at least 2/3 replicates of EV or WCL for the yeast strains and 4/5 replicates of EV or WCL for the biofilm strain. EV proteins remaining post-filtering ranged from 690 in DAY286 yeast EVs to 1202 proteins in ATCC90028 yeast EVs. Similarly, WCL proteins numbered from 760 for DAY286 yeast WCL to 1229 for ATCC90028. There was at least a 50% overlap between the proteins quantified in EVs and those in WCL for each strain. The biofilm samples had the highest degree of overlap at 77.1% whilst for ATCC10231 54.8% of proteins were common to EVs and WCL ()). For all strains, the number of proteins exclusive to EVs was less than WCL exclusive proteins. Of the proteins quantified in EVs from DAY286 biofilms or yeast cells, 44% were common (Supplementary Figure S4A).
Figure 2. Differential abundance analysis of proteins identified in C. albicans EVs and whole cell lysates (WCL). (a) Venn diagrams comparing the EV and WCL proteomes from four C. albicans strains; DAY286 yeast (n = 3), ATCC90028 yeast (n = 3), ATCC10231 yeast (n = 3), and DAY286 biofilm (n = 5). Whole cell lysates were prepared from the EV source cells. Proteins were quantified (MaxQuant LFQ intensity) in a minimum of 2/3 (yeast) and 4/5 (biofilm) biological replicates of EV or WCL. (B) Volcano plots depicting significantly enriched EV or WCL proteins. Differential abundance analysis was performed by comparing the mean normalised LFQ intensities of proteins identified in both EV and WCL (i.e. proteins in the Venn overlap) using the package limma [Citation47,Citation52]. Significantly enriched proteins were identified using a Benjamini-Hochberg adjusted p-value cut-off of 0.01 and log2(FC) cut-off of 1. Counts of significant and non-significant proteins are indicated on each graph. Proteins with a log2(FC) greater than 8 are labelled. Data tables underlying the Venn diagrams and volcano plots are provided in Supplementary Data S2.
![Figure 2. Differential abundance analysis of proteins identified in C. albicans EVs and whole cell lysates (WCL). (a) Venn diagrams comparing the EV and WCL proteomes from four C. albicans strains; DAY286 yeast (n = 3), ATCC90028 yeast (n = 3), ATCC10231 yeast (n = 3), and DAY286 biofilm (n = 5). Whole cell lysates were prepared from the EV source cells. Proteins were quantified (MaxQuant LFQ intensity) in a minimum of 2/3 (yeast) and 4/5 (biofilm) biological replicates of EV or WCL. (B) Volcano plots depicting significantly enriched EV or WCL proteins. Differential abundance analysis was performed by comparing the mean normalised LFQ intensities of proteins identified in both EV and WCL (i.e. proteins in the Venn overlap) using the package limma [Citation47,Citation52]. Significantly enriched proteins were identified using a Benjamini-Hochberg adjusted p-value cut-off of 0.01 and log2(FC) cut-off of 1. Counts of significant and non-significant proteins are indicated on each graph. Proteins with a log2(FC) greater than 8 are labelled. Data tables underlying the Venn diagrams and volcano plots are provided in Supplementary Data S2.](/cms/asset/b64ecce8-32c7-454b-b594-48e81a4461cb/zjev_a_1750810_f0002_oc.jpg)
Differential abundance analysis was performed on the common EV and WCL proteins from each strain to identify enriched proteins ()). The full results including log2(FC) values and p-values are available in Supplementary Data S2. Following imputation of missing values, the mean normalised log2 LFQ intensities for each protein were compared using the empirical Bayes method implemented in limma [Citation52,Citation54]. The resulting t-statistics were adjusted using the Benjamini-Hochberg method [Citation55] and an adjusted p-value cut-off of 0.01, along with a log2(FC) cut-off of 1, was used to identify significantly enriched EV and WCL proteins for each strain ()). a similar number of proteins were significantly enriched in EVs compared to WCL across all datasets. The number of EV-enriched proteins ranged from 101 to 121 whereas the number of WCL-enriched proteins ranged from 100 to 176. The differential abundance analysis was repeated to compare the enrichment of proteins common to DAY286 yeast and biofilm EVs (Supplementary Figure S4B, Supplementary Data S6). From the 433 shared proteins, 129 were significantly enriched in biofilm EVs versus 136 proteins which were significantly more abundant in DAY286 yeast EVs.
Cell wall and pathogenesis proteins are overrepresented in EVs
We performed functional enrichment analyses on proteins significantly enriched or exclusive to C. albicans EVs from each strain (,)) to explore whether there were common biological roles for the cargo, and to provide insight on potential functions of C. albicans EVs (). This was implemented using the online resource FungiFun2 which is a web-tool specific for analysis of fungal genes and proteins [Citation56]. In agreement with previous reports [Citation24,Citation31], fungal-type or yeast-type cell wall organisation were significantly enriched biological processes that were identified for all four types of EVs. Furthermore, C. albicans EV proteins from all isolations were commonly associated with the C. albicans cell wall, the plasma membrane, or generally to the cell surface. Proteins involved in ER localisation and protein glycosylation were overrepresented in the three yeast EV data sets (Supplementary Data S3) and may relate to the production of glycoproteins that are directed to the fungal cell wall. Enrichment of ER, cell wall and plasma membrane proteins suggest that the EVs contain a mix of EV subtypes derived from potentially different vesicle biogenesis pathways.
Figure 3. Functional enrichment analyses of the significantly enriched and exclusive C. albicans EV proteins. The online tool FungiFun2 (elbe.hki-jena.de/fungifun) was used to identify enriched biological process (BP), cellular component (CC), and molecular function (MF) GO terms [Citation56] based on EV enriched or exclusive proteins from (a) DAY286 yeast, (B) ATCC90028, (C) ATCC10231, and (D) DAY286 biofilm. The top 8 (where present) significantly enriched terms for each GO domain are shown (Hypergeometric distribution, Benjamini-Hochberg adjusted p-value < 0.01). They are presented top to bottom in order of increasing Benjamini-Hochberg adjusted p-value. Full lists of enriched GO terms can be found in Supplementary Data S3.
![Figure 3. Functional enrichment analyses of the significantly enriched and exclusive C. albicans EV proteins. The online tool FungiFun2 (elbe.hki-jena.de/fungifun) was used to identify enriched biological process (BP), cellular component (CC), and molecular function (MF) GO terms [Citation56] based on EV enriched or exclusive proteins from (a) DAY286 yeast, (B) ATCC90028, (C) ATCC10231, and (D) DAY286 biofilm. The top 8 (where present) significantly enriched terms for each GO domain are shown (Hypergeometric distribution, Benjamini-Hochberg adjusted p-value < 0.01). They are presented top to bottom in order of increasing Benjamini-Hochberg adjusted p-value. Full lists of enriched GO terms can be found in Supplementary Data S3.](/cms/asset/56ca106c-6a62-467c-90f9-955eeeb25889/zjev_a_1750810_f0003_oc.jpg)
EVs from the two clinical isolates ATCC90028 and ATCC10231 as well as the DAY286 biofilms were enriched for proteins that function in pathogenesis, consistent with the notion that EVs are crucial to the interaction between the fungus and the host. For example, proteins with aspartic protease activity and adhesion functions which were enriched in ATCC10213 and biofilm EVs are linked to C. albicans virulence [Citation65,Citation66]. All EV data sets were enriched with proteins with 1,3 beta-glucanosyltransferase activity. However, the biofilm EVs were also enriched with proteins with exo-1,3-beta-glucosidase activity indicating that the role for EVs in cell wall dynamics may change between morphologies.
Consequently, we performed functional analyses on the differentially abundant proteins found in DAY286 biofilm and yeast EVs to explore how EV function may change depending on source cell morphology (Supplementary Figure S5). Compared to biofilm EVs, DAY286 yeast EVs were enriched in ribosomal and mitochondrial proteins and proteins that function in post-translational modification. EVs from C. albicans biofilms have been shown to function in extracellular matrix biogenesis [Citation32], which was reflected here by an enrichment of cell surface and cell wall proteins that function in carbohydrate metabolism. Furthermore, biofilm EVs were enriched in oxidative and heat stress response proteins, which is reflective of the different growth conditions compared to DAY286 yeast EVs.
WCL proteomes have a higher degree of similarity than the EV proteomes from four C. albicans strains
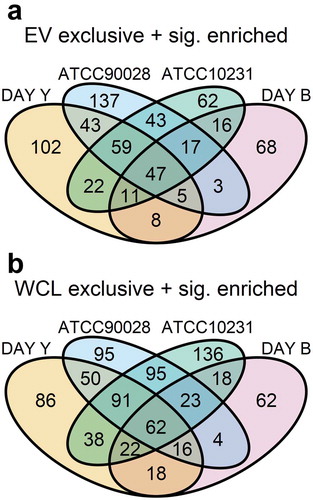
EV proteins from each isolation were compared to identify proteins that are packaged into C. albicans EVs, regardless of cell morphology or strain. Of the 1487 proteins quantified in EVs across the four data sets, 396 (26.7%) were common to all ()). Conversely, more WCL proteins; 556 out of 1389 proteins (40.0%) were common to the four proteomes ()).
Figure 4. Combined comparison of C. albicans proteomes. (a) Venn diagram comparing four C. albicans EV proteomes. Lists of EV proteins present in the Venn diagrams in were compared to identify proteins common to all four EV datasets. (B) Venn diagram comparing four C. albicans WCL proteomes. Lists of WCL proteins present in the Venn diagrams in were compared to identify proteins common to all four WCL datasets. The data tables underlying Figuress 4A and 4B are provided in Supplementary Data S4. (C) Multidimensional scaling (MDS) plot of each LC-MS/MS biological replicate sample with the first 2 dimensions shown. Pairwise distance between samples approximately indicates the log2(FC) between samples. The plotMDS function from limma was used to generate the MDS plots [Citation52]. (D) MDS plot of each LC-MS/MS biological replicate sample with the second and third dimensions shown.
![Figure 4. Combined comparison of C. albicans proteomes. (a) Venn diagram comparing four C. albicans EV proteomes. Lists of EV proteins present in the Venn diagrams in Figure 2A were compared to identify proteins common to all four EV datasets. (B) Venn diagram comparing four C. albicans WCL proteomes. Lists of WCL proteins present in the Venn diagrams in Figure 2A were compared to identify proteins common to all four WCL datasets. The data tables underlying Figuress 4A and 4B are provided in Supplementary Data S4. (C) Multidimensional scaling (MDS) plot of each LC-MS/MS biological replicate sample with the first 2 dimensions shown. Pairwise distance between samples approximately indicates the log2(FC) between samples. The plotMDS function from limma was used to generate the MDS plots [Citation52]. (D) MDS plot of each LC-MS/MS biological replicate sample with the second and third dimensions shown.](/cms/asset/af5efa78-a6bc-41de-b849-f7b5a0a3442a/zjev_a_1750810_f0004_oc.jpg)
The relationship between the C. albicans proteomes presented in this study was explored further via multi-dimensional scaling plots (,)). Dimension 1, which represents the leading factor explaining the log2(FC) between the four data sets, separates the samples based on source strain; DAY286 versus both ATCC strains. The second dimension shows a batch effect associated with each LC-MS/MS experiment. The two ATCC strains cluster closely together, away from both DAY286 yeast and biofilm. Likewise, the two ATCC sample sets were run on the MS and analysed together, whereas the other two strains were run separately and analysed separately. Finally, dimension 3 separates the samples according to the primary condition of interest; EVs versus WCL ()).
Immunogenic cell surface and cell wall organisation proteins are universally EV enriched
The 396 proteins common to EVs from all sources ()) were assessed by unsupervised hierarchical clustering to group proteins based on their log2(FC) across the four data sets, with the results plotted in a heatmap (). The proteins were grouped into eight clusters, C1 to C8. C1, C2 and C3 contained proteins that were highly enriched or exclusive to EVs with an abundance of proteins that were exclusive to one or more EV isolations. C4 also contained EV enriched proteins which were largely not EV exclusive. C5 and C6 contained proteins with varied relative abundance in EVs versus WCL, with C7 containing highly WCL enriched proteins. Finally, C8 included proteins that were exclusive to EVs across all four data sets. These could not be included in the cluster analysis because they did not have any valid log2(FC) values and were appended to the heat map manually. Supplementary Data S5 contains the names and functions of all the proteins represented in the heatmap in order of appearance from top to bottom.
Figure 5. Identification of commonly enriched EV proteins across different C. albicans strains. Heatmap of proteins identified in all four EV samples (n = 396, Venn overlap in ). Each column represents a C. albicans strain and each row represents a protein. The colours indicate the log2(FC) of the protein for that particular strain; red is EV enriched, blue is EV depleted, and black is EV exclusive. Unsupervised clustering of rows and columns was performed using Gower’s formula via the daisy function from the R package cluster [Citation57]. Proteins which were exclusive to EVs in all four data sets and therefore had no valid log2(FC) values were separated prior to clustering, in the group designated “Cluster 8”. Functional enrichment analyses were performed on the heatmap protein clusters using the online tool FungiFun2 [Citation56]. a selection of significantly enriched GO terms, biological process (BP), cellular component (CC), and molecular function (MF), are presented in the table inset. Full lists of enriched GO terms and proteins in each cluster are available in Supplementary Data S3 and S5 respectively. Proteins in bold italics are the 22 putative C. albicans EV marker proteins presented in .
![Figure 5. Identification of commonly enriched EV proteins across different C. albicans strains. Heatmap of proteins identified in all four EV samples (n = 396, Venn overlap in Figure 4A). Each column represents a C. albicans strain and each row represents a protein. The colours indicate the log2(FC) of the protein for that particular strain; red is EV enriched, blue is EV depleted, and black is EV exclusive. Unsupervised clustering of rows and columns was performed using Gower’s formula via the daisy function from the R package cluster [Citation57]. Proteins which were exclusive to EVs in all four data sets and therefore had no valid log2(FC) values were separated prior to clustering, in the group designated “Cluster 8”. Functional enrichment analyses were performed on the heatmap protein clusters using the online tool FungiFun2 [Citation56]. a selection of significantly enriched GO terms, biological process (BP), cellular component (CC), and molecular function (MF), are presented in the table inset. Full lists of enriched GO terms and proteins in each cluster are available in Supplementary Data S3 and S5 respectively. Proteins in bold italics are the 22 putative C. albicans EV marker proteins presented in Figure 7.](/cms/asset/a45528aa-ea2f-4b82-a2c1-bacb301a273a/zjev_a_1750810_f0005_oc.jpg)
GO enrichment analyses of the proteins in each of these clusters were performed to provide further insight into the functional roles of C. albicans EV proteins with similar log2(FC) patterns. The 13 proteins in C8 are cell surface/wall (Crh11, Mp65, Msb2, Pga4, Pga52, Plb4.5, Sap9) or plasma membrane-localised proteins (Cdc42, Ena21, Hgt1, orf19.6741, Phm7, Rho3) involved in cell wall organisation, establishment of cell polarity and pathogenesis. Many of the cell surface/wall proteins, such as Mp65 and Bgl2, are immunogenic and are released extracellularly by soluble secretion as well as in vesicles in vitro [Citation31,Citation67,Citation68]. C1, C2 and C3 also contain primarily plasma membrane-associated proteins, many of which function in cell wall biosynthesis and organisation, morphogenesis and pathogenesis. Of note is the enrichment of proteins from the eisosome; a fungal plasma membrane domain also known as the membrane compartment containing Can1 (MCC). Several MCC/eisosome proteins are EV enriched or exclusive across all C. albicans strains including the transmembrane proteins Sur7, Nce102, orf19.6741. The cytosolic eisosome proteins Lsp1 and Pil1 were also detected in EVs but were not enriched. C1 also contains the multidrug transporter Cdr1 (and Cdr2, which cannot be distinguished from Cdr1 based on the peptides identified in this study) that is associated with azole resistance [Citation69]. The locations and functions of C4 proteins are more varied but importantly include GTPases and secretory pathway proteins. Small GTPases are associated with intracellular vesicular trafficking and regulate a variety of membrane fusion events [Citation70,Citation71]. C5, C6 and C7 proteins are mostly cytosolic or ribosomal proteins with functions in glycolysis and translation.
Putative C. albicans EV positive markers include trans-plasma membrane domain Sur7 family proteins
Potential protein markers for C. albicans EVs were selected firstly on the criteria that they were EV exclusive or significantly enriched in EVs. That is, the proteins had a log2(FC) greater than 1 and adjusted p-value of less than 0.01 across all four datasets ()). The 47 candidate positive EV markers that were identified are listed in . These proteins are mostly located on the plasma membrane and cell surface, with ER, endosome and vacuole proteins also represented. Of note were two mitochondrial proteins, which were unexpectedly enriched across all strains.
Figure 6. Identification of common significantly enriched or exclusive C. albicans EV and WCL proteins. Proteins identified as significantly enriched or exclusive to EVs in were compared to select those which were common to all four datasets. (A) 47 proteins were identified as potential positive EV protein markers and (B) 62 proteins as potential negative EV protein markers. The data tables underlying Figure 6 are provided in Supplementary Data S4. Details of the 47 positive EV protein marker candidates and 62 negative candidates can be found in Table 1 and Supplementary Table S2, respectively.
The 47 candidate proteins were filtered according to specific criteria (Supplementary Figure S1) to obtain a list of the best potential markers for future use. Proteins with signal peptides that had previously been detected in a proteomic analysis of C. albicans vesicle-depleted culture medium (VDM) [Citation31], and proteins with more than 5 predicted transmembrane domains were not considered the best marker candidates. This was because proteins with signal peptides that have been detected in VDM are likely secreted canonically as well as in EVs, hence they would not be EV-specific markers. Furthermore, though marker candidates with numerous transmembrane domains such as GSC1 are likely to be secreted specifically in EVs, they may prove difficult to work with in subsequent applications. Following this refinement, 22 proteins were identified as ideal C. albicans EV positive markers (). These included trans-plasma membrane proteins such as the Sur7 family proteins orf19.6741 and Sur7 (Pfam: PF06687) and the MARVEL family protein Nce102 (Pfam: PF01284). Anumber of GTPases, which associate with the plasma membrane (Arf3, Cdc42, Rac1, Rho1, Rho3) and secretory pathway (Sec4, Ypt31), respectively, were also determined to be ideal marker candidates. The 22 proteins were only present in clusters C1-C4 and C8 of the heatmap in which included only proteins that were consistently enriched across all four proteomics experiments. Metadata regarding these proteins including their localisation and associated GO terms are provided in Supplementary Data S8.
Figure 7. Twenty-two best potential C. albicans positive EV protein markers. The most promising EV marker proteins are underlined in Table 1. They are enriched or exclusive to EVs isolated from all the C. albicans strains investigated in this study. The proteins fit within the EV biomarker categories 1 and 2 from MISEV2018 which includes transmembrane, GPI-anchored, and cytosolic proteins that are EV enriched [Citation15].
![Figure 7. Twenty-two best potential C. albicans positive EV protein markers. The most promising EV marker proteins are underlined in Table 1. They are enriched or exclusive to EVs isolated from all the C. albicans strains investigated in this study. The proteins fit within the EV biomarker categories 1 and 2 from MISEV2018 which includes transmembrane, GPI-anchored, and cytosolic proteins that are EV enriched [Citation15].](/cms/asset/677bfc49-359c-469f-96f7-b8321765026d/zjev_a_1750810_f0007_oc.jpg)
The process for defining candidate EV positive markers was repeated to identify potential EV negative markers. Specifically, the lists of exclusive and significantly enriched WCL proteins from each strain were compared ()). Sixty-two proteins were selected as potential negative EV markers (Supplementary Table S2). These candidates were refined to a short-list of seven proteins which have been fluorescently tagged or detected by Western blot in previous literature. The 7 proteins are located in the mitochondria (Lpd1, Sod2), vacuole (Apr1, Cpy1, Lap41), cell wall (Gpm1) and actin cortical patches (Abp1).
Discussion
EVs are increasingly being identified as crucial components of cell-cell communication. Most EV studies have been performed in mammalian systems and a reliable set of EV-specific marker proteins has been identified [Citation15]. These markers have been invaluable for tracking EVs during isolation and have also been exploited for immunoaffinity purification and monitoring of EV release and distribution in vivo with fluorescently tagged markers [Citation72–Citation74]. More recently EVs have been identified in a range of yeast and filamentous fungi and their importance in fungal biology has been acknowledged particularly in the interaction between the fungal pathogens and their hosts [Citation75]. However, research on fungal EVs has been limited to the basic techniques developed early in the investigation of mammalian EVs because of the absence of suitable marker proteins to assist in purification and tracking in biological systems. Many of the mammalian EV marker proteins either have no homologs in fungi, or the homologs are not found in fungal EVs [Citation26]. This has led to the need for de novo identification of fungal EV protein markers based on the recommendations outlined in MISEV2018 [Citation15]. These markers will enable researchers to adapt cutting edge techniques from mammalian EV research to the study of fungal EVs.
We have defined a suite of 22 proteins that are putative markers of C. albicans EVs (). These positive markers are complemented by seven negative markers that are depleted or absent from EVs versus cell lysates. Both sets of markers were identified from analysis of robust proteomic data sets generated from multiple, independent isolations of EVs from three C. albicans strains grown in the yeast form and one strain grown as a biofilm. This represents a step change in the quality of proteomic data published for C. albicans EVs as three out of four previous studies analysed EVs from a single isolation [Citation26]. Thus, we are highly confident that the proteins we have identified as putative EV markers are present in C. albicans EVs. These markers will need to be validated in future studies using techniques including Western blotting, immunogold labelling on TEM and/or Nano-FACS. The validation studies will depend on generation of antibodies to EV marker proteins, particularly the extracellular loops of membrane proteins, as no commercial antibodies to specific C. albicans proteins are available. One putative marker, Hgt1, has already been independently confirmed to be packaged into C. albicans EVs using immunogold labelling and electron microscopy [Citation76]. The immunogold TEM images from Kenno et al. [Citation76] show the plasma membrane protein Hgt1 present in the membrane of small EVs released from the C. albicans strain SN152. This result not only confirms Hgt1 as C. albicans EV cargo, but also demonstrates that the markers presented here may be applicable to EVs isolated from C. albicans strains other than those assessed in this study.
Generally, the EVs isolated in this study had morphologies and size distributions consistent with published data [Citation23,Citation24,Citation31,Citation32]. The main difference was in the number of proteins identified in EVs. Initial investigations into the proteome of C. albicans yeast EVs repeatedly found fewer than 100 proteins [Citation23,Citation24,Citation31]. We identified 690–1202 proteins in EVs, which is consistent with the most recent C. albicans EV report which identified 862 and 729 proteins in yeast and biofilm EVs, respectively [Citation32]. In addition to the improved quality of our data due to analysis of multiple biological replicates for EVs from each strain, this work also represents the first comparative label-free quantitative analyses of proteins in C. albicans EVs and their parent planktonic cells. This is particularly important because our meta-analysis of previously published EV proteomes revealed only 12 proteins that were common to all available data sets [Citation26]. Ten of these were also detected in all four EV proteomes in this study (Supplementary Data S1) but there was no consistent significant difference in abundance between EVs and WCL for seven of the proteins (Eft2, Eno1, Hsp70, Pdc11, Pgk1, Tal1 and Tdh3) (Supplementary Data S2). Furthermore, one protein (Gpm1) was consistently EV depleted compared to WCL. Two out of ten proteins were confirmed as enriched in all EVs tested; the cell surface glycosidase Phr2 and the aspartyl protease Sap9.
Phr2 and Sap9 were among 47 proteins that were either unique or significantly enriched in EVs across the four EV proteomes analysed in this study. To identify putative markers for C. albicans EVs, we refined these 47 proteins to eliminate those with unfavourable characteristics for downstream applications or where there was published data indicating that they are not secreted exclusively within EVs [Citation31]. This left us with 22 potential markers that could be grouped into two broad categories, transmembrane/GPI-anchored proteins and lumenal/cytosolic proteins, which align with MISEV2018 biomarker categories 1 and 2.
The cytosolic/lumenal group of marker proteins consists mainly of GTPases, which are associated with different internal membranes. Rho-type GTPases (Rho1, Rho3, Rac1 and Cdc42) are of particular interest because they are from the same protein family as the mammalian EV marker RhoA, which is involved in microvesicle biogenesis alongside Rac1 [Citation77,Citation78]. The primary role of C. albicans Rho GTPases is in polarised growth and morphogenesis [Citation79–Citation81], but we show they may also have a role in vesicle release from the fungal plasma membrane. This is supported by the enrichment of Arf3 in all four EV data sets (). Arf3 is the C. albicans homolog of human ARF6, a key regulator of selective cargo recruitment and microvesicle shedding [Citation82].
Potential functional roles of C. albicans EVs may also be related to other activities of Rho GTPases. EVs from S. cerevisiae are enriched for the cell wall 1,3-β-glucan synthase Fks1 and can provide a protective effect against the 1,3-β-glucan synthase inhibitor caspofungin [Citation83]. Rho1 is the essential regulatory GTPase that forms a complex with the 1,3-β-glucan synthase in C. albicans, Gsc1 [Citation84]. This 1,3- β- glucan synthase in C. albicans is also enriched in EVs, supporting a conserved role for EVs in cell wall maintenance between S. cerevisiae and C. albicans.
The four non-plasma membrane associated cytosolic/luminal markers are predicted to associate with secretory compartments (Ykt6, Sec4, Ypt31), and the vacuole (Vac8). These proteins all have roles in intracellular vesicle transport in yeast [Citation85–Citation87], particularly the v-SNARE Ykt6 which is involved in vesicle fusion to the ER, Golgi and vacuole [Citation88,Citation89]. In Drosophila and human cells, Ykt6 is required for sorting of Wnt proteins into exosomes for secretion [Citation90,Citation91]. Interestingly, another SNARE protein similar to human syntaxin-2 was enriched in all the EV proteomes (Supplementary Data S2). This t-SNARE, Sso2, is an integral membrane protein involved in the fusion of secretory vesicles with the plasma membrane [Citation92]. Enrichment of these proteins may reflect an endocytic origin of some C. albicans EVs, similar to exosomes produced via fusion of multivesicular bodies with the plasma membrane in mammalian cells [Citation73]. This is supported by the abundance of the Rab GTPases Sec4 and Ypt31 which function in the vesicular exocytic pathway of C. albicans and S. cerevisiae [Citation87,Citation93].
The transmembrane/GPI-anchored proteins could be grouped into four subcellular locations; the membrane compartment of Can1 (MCC)/eisosome, the cell surface, the plasma membrane and the ER membrane. Of these the MCC/eisosome proteins, Sur7 and orf19.6741 were the most intriguing.
Sur7 is a four TM domain protein present in the plasma membrane in stable, sphingolipid and ergosterol enriched microdomains known as the MCC [Citation94]. orf19.6741 is a non-essential, chlamydospore induced gene which encodes a predicted 3 TM domain protein homologous to the S. cerevisiae MCC/eisosome protein Pun1 [Citation95,Citation96]. Based on the detection of the orf19.6741 protein exclusively in all EV samples with particularly high abundance, we designate this protein as ‘EV associated Protein 1ʹ or Evp1. Sur7 and Evp1 are both part of the fungal-specific Sur7 family (Pfam: PF06687). This family describes a group of fungal specific transmembrane proteins which localise to the plasma membrane and have a conserved cysteine motif similar to mammalian claudins [Citation97,Citation98]. Alongside their similarities to claudins, Sur7 and Evp1 have predicted topologies reminiscent of mammalian tetraspanins, which are key markers for mammalian EVs () [Citation15]. Tetraspanin family (Pfam: PF00335) proteins have four transmembrane alpha helices and two extracellular loops, one short and one long which contains four or more conserved cysteine residues. Similarly, Sur7 and Evp1 have 4 or 3 predicted transmembrane domains, with two extracellular loops of different lengths. The long extracellular loops of Sur7 and Evp1 have at least two cysteine residues in a conserved motif.
Figure 8. Predicted topology and palmitoylation sites of C. albicans MCC/eisosome proteins Sur7 and Evp1 (orf19.6741) compared to the human tetraspanin CD81. TOPCONS2 (topcons.cbr.su.se) [Citation59] was used to analyse the amino acid sequences of human CD81 and C. albicans Sur7 and Evp1 to predict their topology and the location of transmembrane (TM) domains. The hydrophobicity plots (light blue chart) and topology diagrams (red and blue lines) are shown on the left side of the figure. Additionally, cysteine residues of Sur7 and Evp1 predicted to be palmitoylated using CSS-PALM 4.0 (csspalm.biocuckoo.org) have been annotated [Citation60]. For CD81, palmitoylation sites experimentally determined in previous literature are shown [Citation119]. The right side of the figure shows a cartoon representation of the TOPCONS2 consensus topology prediction for the three proteins as well as the crystal structure of CD81 (PDB: 5TCX) [Citation120].
![Figure 8. Predicted topology and palmitoylation sites of C. albicans MCC/eisosome proteins Sur7 and Evp1 (orf19.6741) compared to the human tetraspanin CD81. TOPCONS2 (topcons.cbr.su.se) [Citation59] was used to analyse the amino acid sequences of human CD81 and C. albicans Sur7 and Evp1 to predict their topology and the location of transmembrane (TM) domains. The hydrophobicity plots (light blue chart) and topology diagrams (red and blue lines) are shown on the left side of the figure. Additionally, cysteine residues of Sur7 and Evp1 predicted to be palmitoylated using CSS-PALM 4.0 (csspalm.biocuckoo.org) have been annotated [Citation60]. For CD81, palmitoylation sites experimentally determined in previous literature are shown [Citation119]. The right side of the figure shows a cartoon representation of the TOPCONS2 consensus topology prediction for the three proteins as well as the crystal structure of CD81 (PDB: 5TCX) [Citation120].](/cms/asset/d2900a4c-b93a-4a42-a1fd-d1e77e064c1a/zjev_a_1750810_f0008_oc.jpg)
We hypothesize that Sur7 and Evp1 will be ideal C. albicans EV markers after validation because of their potential topological similarity to tetraspanin EV markers, specifically CD9, CD81 and CD63. The utility of tetraspanins as EV markers is characterised by their abundant and broad expression in different cell types, their stability as part of tetraspanin-enriched microdomains (TEMs) in EV membranes, and the plethora of monoclonal antibodies that are available for them. Antibodies raised against tetraspanins typically bind to epitopes in the large extracellular loop [Citation99–Citation102], which protrudes from the EV surface. This interaction has been exploited to isolate EVs from complex biological fluids such as plasma, serum and urine [Citation72,Citation103,Citation104]. Unfortunately, commercial antibodies for Sur7 are not available and Evp1 has largely been investigated at the transcript level [Citation96,Citation105]. However, if these Sur7 and Evp1 are validated as C. albicans EV membrane proteins, then raising antibodies against their extracellular loops would be vital for future in vivo research. Alternatively, the genetic manipulability of C. albicans means that the expression of fusion proteins is relatively simple and rapid [Citation106], as demonstrated for Sur7 [Citation98]. Isolation of EVs from C. albicans strains with GFP-tagged Sur7 or Evp1 will enable monitoring of EVs via fluorescence or the use anti-GFP antibodies for EV marker detection via Western blot. Furthermore, if the predicted topology of Evp1 is correct, expression of Evp1 with a small N-terminal tag may permit immunocapture of C. albicans EVs.
Of the 22 putative C. albicans EV markers, the MCC/eisosome proteins Sur7 and Evp1 are certainly the most promising candidates. Interestingly, other MCC/eisosome proteins including Nce102, Pil1 and Lsp1 were detected in all four EV proteomes and Fmp45 was quantified in both DAY286 data sets. MCC/eisosomes are important for cell wall synthesis and organisation as well as the recruitment of proteins to the plasma membrane [Citation107]. We speculate that these fungal-specific microdomains also have a role in EV biogenesis from C. albicans, and potentially other fungi, based on the role of TEMs in sorting specific cargo into mammalian EVs [Citation108].
To supplement the positive EV markers, we selected 62 proteins that were significantly less abundant in, or were absent from C. albicans EVs as potential negative markers. They included ribosome associated proteins such as Tif11 and Tma19, which are potential MISEV2018 category 3 markers. Proteins of this category are part of non-EV co-isolated structures (such as ribosomes) and their depletion in EV isolations is a measure of purity [Citation15]. The 62 candidates were refined to seven proteins that had been interrogated using antibodies or fluorescent constructs as reported in previous literature [Citation109–Citation114]; making them prime targets for initial validation. All seven were from intracellular compartments such as the mitochondria (Lpd1, Sod2), the vacuole (Apr1, Cpy1, Lap41), the cell wall (Gpm1) and actin cortical patches (Apb1) and can be roughly assigned to MISEV2018 marker category 4.
We have focused on the identification of EV marker proteins; however, the biological activities of these proteins provide insight into the function of C. albicans EVs. Functional enrichment analysis of the EV proteins indicated a likely role in pathogenesis (). Several of the most enriched proteins in all four data sets are antigenic virulence factors involved in morphogenesis such as Bgl2, Mp65 and Phr1 [Citation68,Citation115,Citation116]. Furthermore, hyphal-specific virulence proteins including Xog1, Sap5, Hyr1 and Ece1 are highly abundant in biofilm EVs but absent from the biofilm cell lysates or EVs from yeast-form cells of the same strain (Supplementary Data S2). Also, of note was the enrichment of Cdr1/Cdr2 in EVs from all strains (). These drug efflux pump proteins are important in the development of resistance to azole antifungals [Citation69]. Their presence in C. albicans EVs indicates that EVs may function in azole resistance through transportation of efflux pumps from resistant to non-resistant C. albicans cells. This differs from previous studies where C. albicans EVs contribute to azole resistance through delivery of matrix components and glucan modification enzymes to promote biofilm growth [Citation32].
Conclusion
In summary, the most promising putative markers for C. albicans EVs are the plasma membrane proteins Sur7 and Evp1, which have potential to be the fungal equivalents of the tetraspanin markers used for mammalian EV research. Complementary negative EV markers include the cell surface protein Gpm1, the actin binding protein Apb1, and the intracellular proteins Apr1, Cpy1, Lap41, Sod2 and Lpd1. We are confident that these positive and negative EV marker proteins will be valuable in future investigations on C. albicans EVs but antibody-based validation is required. Following in vitro validation, these markers will enable the use of a plethora of EV analysis methods, which have not yet been applied to fungal EVs due to the absence of protein markers. Examples include EV immunocapture, in vitro tracking of vesicle release and fusion, and in vivo monitoring of C. albicans EVs over the course of an infection, for example, in mice [Citation73,Citation117,Citation118]. Gaining access to these techniques will allow researchers to answer important questions regarding C. albicans EV biology. Specifically, are EVs involved in C. albicans pathogenesis in vivo, what is their role during infection, and what are the EV biogenesis pathways in C. albicans? At this point, it is unclear whether the markers identified in this study will be applicable to other fungal species. Our previous analysis determined that the likelihood of cross-species fungal EV markers is low [Citation26]. Therefore, the process of defining EV enriched markers should be repeated for other pathogenic fungi including C. neoformans, C. gattii and P. brasiliensis, all of which are known to release EVs.
Supplemental Material
Download Zip (4.8 MB)Acknowledgments
The authors would like to thank Dr Peter Lock from the La Trobe Institute for Molecular Science BioImaging Platform for his help with the TEM imaging.
Disclosure statement
The authors have no conflict of interest.
Supplementary material
Supplemental data for this article can be accessed here.
Additional information
Funding
References
- Havlickova B, Czaika VA, Friedrich M. Epidemiological trends in skin mycoses worldwide. Mycoses. 2008;51(s4):2–20.
- Benedict K, Jackson BR, Chiller T, et al. Estimation of direct healthcare costs of fungal diseases in the USA. Clin Infect Dis. 2018;68(11):1791–1797.
- Pfaller MA, Diekema DJ. Epidemiology of invasive candidiasis: a persistent public health problem. Clin Microbiol Rev. 2007;20(1):133–163.
- Brown GD, Denning DW, Gow NAR, et al. Hidden killers: human fungal infections. Sci Transl Med. 2012;4(165):165rv13.
- Kullberg BJ, Arendrup MC. Invasive Candidiasis. N Engl J Med. 2015;373(15):1445–1456.
- Guinea J. Global trends in the distribution of candida species causing candidemia. Clin Microbiol Infect. 2014;20(Suppl. 6):5–10.
- Pappas PG, Kauffman CA, Andes DR, et al. Clinical practice guideline for the management of candidiasis: 2016 update by the infectious diseases society of America. Clin Infect Dis. 2016;62(4):e1–e50.
- Whaley SG, Berkow EL, Rybak JM, et al. Azole antifungal resistance in candida albicans and emerging non-albicans Candida species. Front Microbiol. 2017;7:2173.
- Perlin DS. Mechanisms of echinocandin antifungal drug resistance. Ann N Y Acad Sci. 2015;1354(1):1–11.
- Perlin DS, Rautemaa-Richardson R, Alastruey-Izquierdo a. The global problem of antifungal resistance: prevalence, mechanisms, and management. Lancet Infect Dis. 2017;17(12):e383–e392.
- Fisher MC, Hawkins NJ, Sanglard D, et al. Worldwide emergence of resistance to antifungal drugs challenges human health and food security. Science. 2018;360(6390):739–742.
- Xu R, Rai a, Chen M, et al. Extracellular vesicles in cancer - implications for future improvements in cancer care. Nat Rev Clin Oncol. 2018;15(10):617–638.
- Quek C, Hill AF. The role of extracellular vesicles in neurodegenerative diseases. Biochem Biophys Res Commun. 2017;483(4):1178–1186.
- Pathirana RD, Kaparakis‐Liaskos M. Bacterial membrane vesicles: biogenesis, immune regulation and pathogenesis. Cell Microbiol. 2016;18(11):1518–1524.
- Théry C, Witwer KW, Aikawa E, et al. Minimal information for studies of extracellular vesicles 2018 (MISEV2018): a position statement of the international society for extracellular vesicles and update of the MISEV2014 guidelines. J Extracell Vesicles. 2018;7(1):1535750.
- Maas SLN, Breakefield XO, Weaver AM. Extracellular vesicles: unique intercellular delivery vehicles. Trends Cell Biol. 2017;27(3):172–188.
- Schorey JS, Cheng Y, Singh PP, et al. Exosomes and other extracellular vesicles in host-pathogen interactions. EMBO Rep. 2015;16(1):24–43.
- Oliveira DL, Freire-de-Lima CG, Nosanchuk JD, et al. Extracellular vesicles from cryptococcus neoformans modulate macrophage functions. Infect Immun. 2010;78(4):1601–1609.
- Rodrigues ML, Nakayasu ES, Oliveira DL, et al. Extracellular vesicles produced by cryptococcus neoformans contain protein components associated with virulence. Eukaryot Cell. 2008;7(1):58–67.
- Bielska E, Sisquella MA, Aldeieg M, et al. Pathogen-derived extracellular vesicles mediate virulence in the fatal human pathogen cryptococcus gattii. Nat Commun. 2018;9(1):1556.
- Vallejo MC, Matsuo AL, Ganiko L, et al. The pathogenic fungus paracoccidioides brasiliensis exports extracellular vesicles containing highly immunogenic α-galactosyl epitopes. Eukaryot Cell. 2011;10(3):343–351.
- da Silva RP, Heiss C, Black I, et al. Extracellular vesicles from paracoccidioides pathogenic species transport polysaccharide and expose ligands for DC-SIGN receptors. Sci. Rep. 2015;5(1):14213.
- Wolf JM, Espadas J, Luque-Garcia J, et al. Lipid biosynthetic genes affect candida albicans extracellular vesicle morphology, cargo, and immunostimulatory properties. Eukaryot Cell. 2015;14(8):745–754.
- Vargas G, Rocha JDB, Oliveira DL, et al. Compositional and immunobiological analyses of extracellular vesicles released by Candida albicans. Cell Microbiol. 2015;17(3):389–407.
- Joffe LS, Nimrichter L, Rodrigues ML, et al. Potential roles of fungal extracellular vesicles during infection. mSphere. 2016;1(4):e00099–16.
- Bleackley MR, Dawson CS, Anderson MA. Fungal extracellular vesicles with a focus on proteomic analysis. PROTEOMICS. 2019;19(8):1800232.
- da Silva RP, Puccia R, Rodrigues ML, et al. Extracellular vesicle-mediated export of fungal RNA. Sci. Rep. 2015;5(1):7763.
- Rodrigues ML, Nimrichter L, Oliveira DL, et al. Vesicular polysaccharide export in cryptococcus neoformans is a eukaryotic solution to the problem of fungal trans-cell wall transport. Eukaryot Cell. 2007;6(1):48–59.
- Oliveira DL, Nimrichter L, Miranda K, et al. Cryptococcus neoformans cryoultramicrotomy and vesicle fractionation reveals an intimate association between membrane lipids and glucuronoxylomannan. Fungal Genet Biol. 2009;46(12):956–963.
- da Silva TA, Roque-Barreira MC, Casadevall a, et al. Extracellular vesicles from paracoccidioides brasiliensis induced M1 polarization in vitro. Sci Rep. 2016;6(1):35867.
- Gil-Bona a, Llama-Palacios a, Parra CM, et al. Proteomics unravels extracellular vesicles as carriers of classical cytoplasmic proteins in Candida albicans. J Proteome Res. 2015;14(1):142–153.
- Zarnowski R, Sanchez H, Covelli AS, et al. Candida Albicans biofilm–induced vesicles confer drug resistance through matrix biogenesis. PLoS Biol. 2018;16(10):e2006872.
- Nobile CJ, Johnson AD. Candida albicans biofilms and human disease. Annu Rev Microbiol. 2015;69(1):71–92.
- Taff HT, Nett JE, Zarnowski R, et al. A candida biofilm-induced pathway for matrix glucan delivery: implications for drug resistance. PLoS Pathog. 2012;8(8):e1002848.
- Lötvall J, Hill AF, Hochberg F, et al. Minimal experimental requirements for definition of extracellular vesicles and their functions: a position statement from the international society for extracellular vesicles. J Extracell Vesicles. 2014;3(1):26913.
- Greening DW, Xu R, Ji H, et al. a Protocol for Exosome Isolation and Characterization: evaluation of Ultracentrifugation, Density-Gradient Separation, and Immunoaffinity Capture Methods. In Proteomic Profiling: methods and Protocols. In: Posch a, editor. Methods in molecular biology. New York: Springer New York; 2015. p.179–209. DOI:10.1007/978-1-4939-2550-6_15
- Gámez-Valero a, Monguió-Tortajada M, Carreras-Planella L, et al. Size-exclusion chromatography-based isolation minimally alters extracellular vesicles’ characteristics compared to precipitating agents. Sci. Rep. 2016;6(1):33641.
- Oksvold MP, Neurauter a, Pedersen KW. Magnetic bead-based isolation of exosomes. in rna interference: challenges and therapeutic opportunities. In: Sioud M, editor. Methods in Molecular Biology. New York: Springer New York; 2015. p.465–481. DOI:10.1007/978-1-4939-1538-5_27
- Suetsugu a, Honma K, Saji S, et al. Imaging exosome transfer from breast cancer cells to stroma at metastatic sites in orthotopic nude-mouse models. Adv Drug Deliv Rev. 2013;65(3):383–390.
- Davis DA, Bruno VM, Loza L, et al. Candida albicans Mds3p, a conserved regulator of ph responses and virulence identified through insertional mutagenesis. Genetics. 2002;162(4):1573–1581.
- Ramage G, Saville SP, Wickes BL, et al. Inhibition of candida albicans biofilm formation by farnesol, a quorum-sensing molecule. Appl Environ Microbiol. 2002;68(11):5459–5463.
- Nguyen SL, Greenberg JW, Wang H, et al. Quantifying murine placental extracellular vesicles across gestation and in preterm birth data with tidynano: a computational framework for analyzing and visualizing nanoparticle data in R. Plos One. 2019;14(6):e0218270.
- Greening DW, Nguyen HPT, Elgass K, et al. Human endometrial exosomes contain hormone-specific cargo modulating trophoblast adhesive capacity: insights into endometrial-embryo interactions. Biol Reprod. 2016;94(2). DOI:10.1095/biolreprod.115.134890
- Fingerhut LCHW, Strugnell JM, Faou P, et al. Shotgun proteomics analysis of saliva and salivary gland tissue from the common octopus octopus vulgaris. J Proteome Res. 2018;17(11):3866–3876.
- Tyanova S, Temu T, Cox J. The maxquant computational platform for mass spectrometry-based shotgun proteomics. Nat Protoc. 2016;11(12):2301–2319.
- Cox J, Neuhauser N, Michalski a, et al. Andromeda: a peptide search engine integrated into the maxquant environment. J Proteome Res. 2011;10(4):1794–1805.
- Cox J, Hein MY, Luber CA, et al. Accurate proteome-wide label-free quantification by delayed normalization and maximal peptide ratio extraction, termed MaxLFQ. Mol Cell Proteomics. 2014;13(9):2513–2526.
- Arnaud MB, Costanzo MC, Skrzypek MS, et al. The Candida Genome Database (CGD), a community resource for candida albicans gene and protein information. Nucleic Acids Res. 2005;33(suppl_1):D358–D363.
- Skrzypek MS, Binkley J, Binkley G, et al. The Candida Genome Database (CGD): incorporation of assembly 22, systematic identifiers and visualization of high throughput sequencing data. Nucleic Acids Res. 2017;D45(D1):D592–D596.
- R Core Team. R: a language and environmental for statistical computing. R Foundation for Statistical Computing; 2018. Vienna, Austria https://www.R-project.org
- Zhang X, Smits AH, van Tilburg GB, et al. Proteome-wide identification of ubiquitin interactions using UbIA-MS. Nat Protoc. 2018;13(3):530–550.
- Ritchie ME, Phipson B, Wu D, et al. Limma powers differential expression analyses for rna-sequencing and microarray studies. Nucleic Acids Res. 2015;43(7):e47–e47.
- Stacklies W, Redestig H, Scholz M, et al. PcaMethods—a bioconductor package providing PCA methods for incomplete data. Bioinformatics. 2007;23(9):1164–1167.
- Phipson B, Lee S, Majewski IJ, et al. Robust hyperparameter estimation protects against hypervariable genes and improves power to detect differential expression. Ann Appl Stat. 2016;10(2):946–963.
- Benjamini Y, Hochberg Y. Controlling the false discovery rate: a practical and powerful approach to multiple testing. J R Stat Soc Ser B Methodol. 1995;57(1):289–300.
- Priebe S, Kreisel C, Horn F, et al. FungiFun2: a comprehensive online resource for systematic analysis of gene lists from fungal species. Bioinformatics. 2015;31(3):445–446.
- Maechler M, Rousseeuw P, Struwf a, et al. Cluster: cluster analysis basics and extensions. R Package Version 208. 2019.
- The UniProt Consortium. UniProt: a worldwide hub of protein knowledge. Nucleic Acids Res. 2019;47(D1):D506–D515. .
- Tsirigos KD, Peters C, Shu N, et al. The TOPCONS web server for consensus prediction of membrane protein topology and signal peptides. Nucleic Acids Res. 2015;43(W1):W401–W407.
- Ren J, Wen L, Gao X, et al. CSS-Palm 2.0: an updated software for palmitoylation sites prediction. Protein Eng Des Sel. 2008;21(11):639–644.
- Chen H, Boutros PC. VennDiagram: a package for the generation of highly-customizable venn and euler diagrams in R. BMC Bioinformatics. 2011;12(1):35.
- Deutsch EW, Csordas a, Sun Z, et al. The proteomexchange consortium in 2017: supporting the cultural change in proteomics public data deposition. Nucleic Acids Res. 2017;45(D1):D1100–D1106.
- Perez-Riverol Y, Csordas a, Bai J, et al. The PRIDE database and related tools and resources in 2019: improving support for quantification data. Nucleic Acids Res. 2019;47(D1):D442–D450.
- Marwick B, Boettiger C, Mullen L. Packaging data analytical work reproducibly using R (and Friends). Am Stat. 2018;72(1):80–88.
- Dutton LC, Jenkinson HF, Lamont RJ, et al. Role of Candida albicans secreted aspartyl protease Sap9 in interkingdom biofilm formation. Pathog Dis. 2016;74(3):ftw005.
- Hoyer LL, Green CB, Oh S-H, et al. Discovering the secrets of the candida albicans agglutinin-like sequence (ALS) gene family — a sticky pursuit. Med Mycol. 2008;46(1):1–15.
- Gomez MJ, Maras B, Barca a, et al. Biochemical and immunological characterization of MP65, a Major mannoprotein antigen of the opportunistic human pathogencandida albicans. Infect Immun. 2000;68(2):694–701.
- Pitarch a, Jiménez a, Nombela C, et al. Decoding serological response to candida cell wall immunome into novel diagnostic, prognostic, and therapeutic candidates for systemic candidiasis by proteomic and bioinformatic analyses. Mol Cell Proteomics. 2006;5(1):79–96.
- Holmes AR, Lin Y-H, Niimi K, et al. ABC transporter cdr1p contributes more than cdr2p does to fluconazole efflux in fluconazole-resistant candida albicans clinical isolates. Antimicrob Agents Chemother. 2008;52(11):3851–3862.
- Hessvik NP, Llorente a. Current knowledge on exosome biogenesis and release. Cell Mol Life Sci. 2018;75(2):193–208.
- Bobrie a, Colombo M, Raposo G, et al. Exosome secretion: molecular mechanisms and roles in immune responses. Traffic. 2011;12(12):1659–1668.
- Fang S, Tian H, Li X, et al. Clinical application of a microfluidic chip for immunocapture and quantification of circulating exosomes to assist breast cancer diagnosis and molecular classification. Plos One. 2017;12(4):e0175050.
- Verweij FJ, Bebelman MP, Jimenez CR, et al. Quantifying exosome secretion from single cells reveals a modulatory role for GPCR signaling. J Cell Biol. 2018;217(3):1129–1142.
- Takahashi Y, Nishikawa M, Shinotsuka H, et al. Visualization and in vivo tracking of the exosomes of murine melanoma B16-BL6 cells in mice after intravenous injection. J Biotechnol. 2013;165(2):77–84.
- Zamith-Miranda D, Nimrichter L, Rodrigues ML, et al. Fungal extracellular vesicles: modulating host–pathogen interactions by both the fungus and the host. Microbes Infect. 2018;20(9):501–504.
- Kenno S, Speth C, Rambach G, et al. Candida albicans factor H binding molecule Hgt1p – a low glucose-induced transmembrane protein is trafficked to the cell wall and impairs phagocytosis and killing by human neutrophils. Front Microbiol. 2019;9. DOI:10.3389/fmicb.2018.03319.
- Li B, Antonyak MA, Zhang J, et al. RhoA triggers a specific signaling pathway that generates transforming microvesicles in cancer cells. Oncogene. 2012;31(45):4740–4749.
- Sedgwick AE, Clancy JW, Olivia Balmert M, et al. Invadopodia mediate non-overlapping modes of tumor cell invasion. Sci. Rep. 2015;5(1):14748.
- Bassilana M, Arkowitz RA. Rac1 and Cdc42 have different roles in candida albicans development. Eukaryot Cell. 2006;5(2):321–329.
- Corvest V, Bogliolo S, Follette P, et al. Spatiotemporal regulation of Rho1 and Cdc42 activity during candida albicans filamentous growth. Mol Microbiol. 2013;89(4):626–648.
- Dünkler a, Wendland J. Candida albicans rho-type gtpase-encoding genes required for polarized cell growth and cell separation. Eukaryot Cell. 2007;6(5):844–854.
- Tricarico C, Clancy J, Biology D-SC. Biogenesis of Shed Microvesicles. Small GTPases. 2017;8(4):220–232.
- Zhao K, Bleackley M, Chisanga D, et al. Extracellular vesicles secreted by saccharomyces cerevisiae are involved in cell wall remodelling. Commun Biol. 2019;2(1):1–13.
- Kondoh O, Tachibana Y, Ohya Y, et al. Cloning of the RHO1 gene from candida albicans and its regulation of beta-1,3-glucan synthesis. J Bacteriol. 1997;179(24):7734–7741.
- Barelle CJ, Richard ML, Gaillardin C, et al. Candida albicans VAC8 is required for vacuolar inheritance and normal hyphal branching. Eukaryot Cell. 2006;5(2):359–367.
- Lupashin VV, Pokrovskaya ID, McNew JA, et al. Characterization of a novel yeast snare protein implicated in golgi retrograde traffic. Mol Biol Cell. 1997;8(12):2659–2676.
- Jedd G, Mulholland J, Segev N. Two new ypt gtpases are required for exit from the yeast trans-golgi compartment. J Cell Biol. 1997;137(3):563–580.
- McNew JA, Søgaard M, Lampen NM, et al. Ykt6p, a prenylated SNARE essential for endoplasmic reticulum-golgi transport. J Biol Chem. 1997;272(28):17776–17783.
- Kweon Y, Rothe a, Conibear E, et al. Ykt6p is a multifunctional yeast r-snare that is required for multiple membrane transport pathways to the vacuole. Mol Biol Cell. 2003;14(5):1868–1881.
- Gross JC, Chaudhary V, Bartscherer K, et al. Active wnt proteins are secreted on exosomes. Nat Cell Biol. 2012;14(10):1036–1045.
- Linnemannstöns K, Karuna P, Witte L, et al. Ykt6 membrane-to-cytosol cycling regulates exosomal Wnt secretion. bioRxiv. 2018:485565. DOI:10.1101/485565.
- Bernardo SM, Rane HS, Chavez-Dozal a, et al. Secretion and filamentation are mediated by the candida albicans T-SNAREs Sso2p and Sec9p. FEMS Yeast Res. 2014;14(5):762–775.
- Bishop a, Lane R, Beniston R, et al. Hyphal growth in candida albicans requires the phosphorylation of Sec2 by the Cdc28‐Ccn1/Hgc1 Kinase. Embo J. 2010;29(17):2930–2942.
- Douglas LM, Wang HX, Li L, et al. Membrane compartment occupied by can1 (MCC) and eisosome subdomains of the fungal plasma membrane. Membranes (Basel). 2011;1(4):394–411.
- Noble SM, French S, Kohn LA, et al. Systematic screens of a candida albicans homozygous deletion library decouple morphogenetic switching and pathogenicity. Nat Genet. 2010;42(7):590–598.
- Palige K, Linde J, Martin R, et al. Global transcriptome sequencing identifies chlamydospore specific markers in candida albicans and candida dubliniensis. Plos One. 2013;8(4):e61940.
- Young ME, Karpova TS, Brügger B, et al. The Sur7p family defines novel cortical domains in saccharomyces cerevisiae, affects sphingolipid metabolism, and is involved in sporulation. Mol Cell Biol. 2002;22(3):927–934.
- Alvarez FJ, Douglas LM, Rosebrock a, et al. The Sur7 protein regulates plasma membrane organization and prevents intracellular cell wall growth in candida albicans. Mol Biol Cell. 2008;19(12):5214–5225.
- Grove J, Hu K, Farquhar MJ, et al. A new panel of epitope mapped monoclonal antibodies recognising the prototypical tetraspanin CD81. Wellcome Open Res. 2017;2:82.
- Cook GA, Longhurst CM, Grgurevich S, et al. Identification of CD9 extracellular domains important in regulation of CHO cell adhesion to fibronectin and fibronectin pericellular matrix assembly. Blood. 2002;100(13):4502–4511.
- Kim T-K, Park CS, Jeoung MH, et al. Generation of a human antibody that inhibits tspan8-mediated invasion of metastatic colorectal cancer cells. Biochem Biophys Res Commun. 2015;468(4):774–780.
- Saint-Pol J, Billard M, Dornier E, et al. New insights into the tetraspanin tspan5 using novel monoclonal antibodies. J Biol Chem. 2017;292(23):9551–9566.
- Sina AAI, Vaidyanathan R, Dey S, et al. Label free profiling of clinically relevant exosomes. Sci. Rep. 2016;6(1):30460.
- Hildonen S, Skarpen E, Halvorsen TG, et al. Mass spectrometry analysis of urinary extraexosomal proteins. Sci. Rep. 2016;6(1):36331.
- García-Sánchez S, Mavor AL, Russell CL, et al. Global roles of Ssn6 in Tup1- and Nrg1-dependent gene regulation in the fungal pathogen, candida albicans. Mol Biol Cell. 2005;16(6):2913–2925.
- Gola S, Martin R, Walther a, et al. New modules for PCR-based gene targeting in candida albicans: rapid and efficient gene targeting using 100 Bp of flanking homology region. Yeast. 2003;20(16):1339–1347.
- Foderaro JE, Douglas LM, Konopka JB. MCC/eisosomes regulate cell wall synthesis and stress responses in fungi. J Fungi. 2017;3(4):61.
- Perez-Hernandez D, Gutiérrez-Vázquez C, Jorge I, et al. The intracellular interactome of tetraspanin-enriched microdomains reveals their function as sorting machineries toward exosomes. J Biol Chem. 2013;288(17):11649–11661.
- Kim S-Y, Kim J. Roles of dihydrolipoamide dehydrogenase lpd1 in candida albicans filamentation. Fungal Genet Biol. 2010;47(9):782–788.
- Broxton CN, Culotta VC. An adaptation to low copper in candida albicans involving SOD enzymes and the alternative oxidase. Plos One. 2016;11(12):e0168400.
- Bauerova V, Pichova I, Nitrogen Source H-HO. Growth stage of candida albicans influence expression level of vacuolar aspartic protease aprlp and carboxypeptidase cpylp. Can J Microbiol. 2012;58(5):678–681.
- Yu Q, Jia C, Dong Y, et al. Candida albicans autophagy, no longer a bystander: its role in tolerance to er stress-related antifungal drugs. Fungal Genetics and Biology. 2017;2:238–249.
- Lopez CM, Wallich R, Riesbeck K, et al. Candida albicans uses the surface protein gpm1 to attach to human endothelial cells and to keratinocytes via the adhesive protein vitronectin. Plos One. 2014;9(3):e90796.
- Rida PCG, Nishikawa a, Won GY, et al. Yeast-to-hyphal transition triggers formin-dependent golgi localization to the growing tip in candida albicans. Mol Biol Cell. 2006;17(10):4364–4378.
- Sandini S, Stringaro a, Arancia S, et al. The MP65 gene is required for cell wall integrity, adherence to epithelial cells and biofilm formation in candida albicans. BMC Microbiol. 2011;11(1):106.
- Saporito-Irwin SM, Birse CE, Sypherd PS, et al. PHR1, a PH-regulated gene of candida albicans, is required for morphogenesis. Mol Cell Biol. 1995;15(2):601–613.
- Kowal J, Arras G, Colombo M, et al. Proteomic Comparison defines novel markers to characterize heterogeneous populations of extracellular vesicle subtypes. Proc Natl Acad Sci. 2016;113(8):E968–E977.
- Hikita T, Miyata M, Watanabe R, et al. Rapid quantification of exosomes by fusing luciferase to exosome marker proteins. Sci Rep. 2018;8(1):14035.
- Delandre C, Penabaz TR, Passarelli AL, et al. Mutation of juxtamembrane cysteines in the tetraspanin CD81 affects palmitoylation and alters interaction with other proteins at the cell surface. Exp Cell Res. 2009;315(11):1953–1963.
- Zimmerman B, Kelly B, McMillan BJ, et al. Crystal structure of a full-length human tetraspanin reveals a cholesterol-binding pocket. Cell. 2016;167(4):1041–1051.e11.