
ABSTRACT
Bone marrow (BM) is the major target organ for neuroblastoma (NB) metastasis and its involvement is associated with poor outcome. Yet, the mechanism by which NB cells invade BM is largely unknown. Tumour microenvironment represents a key element in tumour progression and mesenchymal stromal cells (MSCs) have been recognized as a fundamental part of the associated tumour stroma. Here, we show that BM-MSCs isolated from NB patients with BM involvement exhibit a greater osteogenic potential than MSCs from non-infiltrated BM. We show that BM metastasis-derived NB-cell lines secrete higher levels of exosomal miR-375, which promotes osteogenic differentiation in MSCs. Of note, clinical data demonstrate that high level of miR-375 correlates with BM metastasis in NB patients. Our findings suggest, indeed, a potential role for exosomal miR-375 in determining a favourable microenvironment in BM to promote metastatic progression. MiR-375 may, thus, represent a novel biomarker and a potential target for NB patients with BM involvement.
Introduction
Neuroblastoma (NB) is the most common extracranial, solid tumour of childhood. Most patients with metastatic disease present bone-marrow (BM) infiltration at diagnosis and relapse [Citation1]. Despite intensive multimodal therapy, patients with BM dissemination continue to have poor survival rates. Current research increasingly supports BM stroma as a unique metastatic niche that contributes to favour the metastatic process by promoting tumour cell survival [Citation2]. Among the cells that normally reside in BM, mesenchymal stromal cells (MSCs), pluripotent progenitors of osteoblasts, adipocytes and chondroblasts play an important role in bone remodelling and provide stromal support to tumour cells [Citation3]. In particular, osteoblasts may promote the formation of the BM niche through the establishment of a favourable microenvironment for both homing and growth of tumour cells [Citation4,Citation5].
In recent years, several microRNAs (miRNAs) have been identified as key regulators in tumorigenesis and development of metastasis to the bone [Citation6]. Indeed, within bone homoeostasis, miRNAs have been shown to have a profound effect in directing differentiation and activity of cells residing in the bone microenvironment [Citation7]. The metastatic process involves multiple steps, including bidirectional crosstalk among the primary tumour and the future site of metastasis, that help create a fertile soil in the target organ before tumour cell colonization [Citation8]. Exosomes, nanometre-sized membrane vesicles of endocytic origin, can serve as vehicles for horizontal transfer of RNA, mRNA, DNA and proteins promoting modifications in the tumour microenvironment [Citation9] and pre-metastatic niche formation [Citation10]. Indeed, exosomes can mediate the transfer of miRNAs from tumour cell to target cells in distant organs facilitating metastatic colonization [Citation11]. In NB patients, metastasis to bone is predominantly osteoclastic, as observed in other tumours such as breast cancer, multiple myeloma and Ewing sarcoma, this process is mediated by the RANKL/RANK axis [Citation12,Citation13]. In this study, we demonstrate that BM-MSCs derived from NB patients with BM metastasis have a pro-osteogenic phenotype. We identified miR-375 as a crucial exosomal miRNA, released from BM metastasis-derived NB-cell lines, which leads to the expression of bone differentiation-related genes in HC (healthy controls) BM-MSCs. Moreover, high expression of miR-375 in circulating exosomes and BM of NB patients positively correlated with the presence of BM metastasis. In summary, we provide new evidence that exosomal miR-375 has a role in promoting the osteogenic differentiation of BM-MSCs and in generating a favourable microenvironment for tumour growth. Therefore, miR-375 may represent a new biomarker and a potential therapeutic target for NB patients.
Materials and methods
Cells and cell culture
Human NB-cell lines, SKNSH, SHSY5Y, IGR-N91 and IGR-NB8 (gift from Dr Birgit Geoerger, Gustave Roussy. Paris-Sud, Université Paris-Saclay, Villejuif, France), were grown in DMEM low glucose (Euroclone Spa, Pero, MI, Italy), IMR32 cells were maintained in IMDM (Euroclone Spa, Pero, MI, Italy) medium. SKNBe2 c and LAN1 cells were cultured in RPMI 1640 medium (Euroclone Spa, Pero, MI, Italy). IMR32 and IGR-NB8 had been derived from biopsy tissue obtained from a primary tumour mass located in the abdomen [Citation14,Citation15], while SKNSH [Citation16], SKNBe2 c [Citation17], LAN1 [Citation18] and IGR-N91 [Citation19] cell lines were established in vitro from BM-metastasis samples. SH-SY5Y is a twice-subcloned cell line derived from SKNSH cell lines. MSCs were grown in DMEM low glucose (Euroclone Spa, Pero, MI, Italy). All culture media were supplemented with 10% foetal bovine serum (FBS, Gibco), 2 mmol/L l-glutamine (Euroclone Spa, Pero, MI, Italy) and 100 g/mL penicillin-streptomycin (Euroclone Spa, Pero, MI, Italy). FBS for exosomes-education experiment was depleted of bovine exosomes by ultracentrifugation at 100,000 × g for 70 min. Cell lines were maintained at 37°C in a 5% (v/v) CO2 humidified incubator. All NB-cell lines were characterized by short tandem repeat analysis (STR) using the Thermo Fisher, AmpFlSTR® Identifiler® Plus PCR Amplification Kit (Eurofins). The STR profiles of IMR32, SKNSH, SHSY5Y, SKNBe2 C, LAN1 matched with the existing on-line DSMZ database (http://www.dsmz.de/de/service/service-human-and-animal-cell-lines/online-str-analysis.html). IGRNB8 and IGRN91 cell lines were not present in the DSMZ or ATCC STR database. Cells were confirmed negative for mycoplasma by routine testing performed once every month.
NB patients and healthy donors
MSCs were isolated from BM samples of NB patients and healthy donors (HC) at the Department of Paediatric Haematology-Oncology, Istituto di Ricovero e Cura a Carattere Scientifico (IRCCS) Bambino Gesù Children’s Hospital, Rome. The study was approved by the institutional ethics committee (protocol number GR-2016-02364088) and human samples were obtained from patients diagnosed with NB and from HC after obtaining written informed consent from their parents. BM samples were collected from 12 children with NB. All experiments were performed in accordance with relevant guidelines and results were compared with seven HCs, who donated BM for haematopoietic cell transplantation in favour of an HLA-identical sibling at the same Hospital. Characteristics of NMBM, MBM-patients and HCs from which MSCs were isolated are listed in .
Table 1. Characteristics of NMBM-, MBM-patients and HCs from which MSCs were isolated.
MSC-isolation and ex vivo expansion
A density gradient centrifugation (Ficoll 1,077 g/ml; Lympholyte, Cedarlane Laboratories Ltd., The Netherlands) was performed to collect mononuclear cells (MNCs) from NB patients and HC BM samples. MNCs were then washed twice in saline phosphate buffer (PBS, Euroclone Spa, Pero, MI, Italy) and seeded at a density of 160,000/cm2 in DMEM low glucose (Euroclone Spa, Pero, MI, Italy), 10% FBS (Gibco, Life Technologies Ltd, Paisley, UK), 2 mmol/L-glutamine and 100 g/mL penicillin-streptomycin (Euroclone Spa, Pero, MI, Italy). After at least 36 h, non-adherent cells were removed and the culture medium was replaced twice a week. MSCs were then harvested, after reaching ≥80% confluence, with a Trypsin solution (Euroclone Spa, Pero, MI, Italy) and then transferred to a new flask at a concentration of 4,000 cells/cm2 for the subsequent passages (P). All MSCs obtained were confirmed negative for mycoplasma by routine testing performed once every month.
Characterization of MSCs (Proliferative capacity/immune-phenotype/differentiation capacity)
Proliferative capacity
Cell proliferation was assessed between P1 and P4 by population doubling (PDs) calculated as log10(N)/log10 [Citation2], where N represents harvested cells/seeded cells.
Phenotype
MSCs from NB patients and HC donors were characterized staining them with specific monoclonal antibodies against CD34, CD45, CD90, CD105, CD81, CD9, CD56 and GD2 antigens (BD, San Diego, CA, USA), associated with different fluorochromes. Briefly, MSCs were harvested, counted and divided 1x10⁵/tube and then re-suspended in 100 μL of antibodies mix. Subsequently, cells were incubated for 30ʹ at 4°C, washed and analysed with a FACSCanto flow cytometer (BD PharMingen) and with the FACSDiva software (Tree Star, Inc. Ashland, OR).
Differentiation capacity
The osteogenic differentiation ability of patients and HC-MSCs was performed between at P2 and P5 by culturing cells with αMEM (Euroclone Spa, Pero, MI, Italy), 10% FBS, penicillin 50 U/ml, 50 mg/ml streptomycin, and 2 mM L-glutamine supplemented with 10−7 M dexamethasone, 50 mg/ml L-ascorbic acid, and 5 mM ß-glycerol phosphate starting from day 7 (Sigma-Aldrich, St Louis, MO). Adipogenic differentiation was as well evaluated between P2 and P5 by incubating cells with the osteogenic medium supplemented with 100 mg/ml insulin, 50 mM isobutyl methylxanthine, 0,5 mM indomethacin (Sigma-Aldrich, St Louis, MO) and 5 mM b-glycerol phosphate. Both osteogenic and adipogenic cultures were incubated for 10 and 21 days before evaluating the differentiation status. To detect osteogenic differentiation, cells were stained for calcium deposition with Alizarin Red (Sigma-Aldrich, St Louis, MO). Adipogenic differentiation, in contrast, was evaluated through the staining of fat droplets with Oil Red O (Sigma-Aldrich). At the same time points, differentiated MSCs were also stored at −20°C to perform RNA extraction and RT-PCR analysis.
Exosome isolation and labelling
Exosomes were purified from supernatants after 2–3 days of culture of 70,000–100,000 cells/cm2, depending on cell line, cultured in T-150 petri dishes, by sequential centrifugation. Supernatants were centrifuged at 500 g for 10 min to remove any cell contamination, then spun at 12,000 g for 20 min to remove any possible apoptotic bodies and large cell debris, and finally, exosomes were collected by spinning at 100,000 g for 70 min. The final pellet was resuspended in PBS and protein concentration was measured by BCA (Pierce, Thermo Fisher Scientific). Exosome preparations were verified following the recommendations of MISEV2018 [Citation20] by Scanning Electron Microscopy (SEM) and characterized by western blot (WB) and nanoparticle tracking analysis (NTA) as previously described [Citation21]. For up-take experiments, the exosome pellet was resuspended in 1 mL of diluent solution C for general membrane labelling (Sigma Aldrich, St Louis, MO) and 1uL of fluorescent red dye (PKH26, Sigma Aldrich, PKH26 GL) was added. After mixing at room temperature for 5 mins the dye in excess was removed by adding 35% BSA solution. Exosomes were then diluted in PBS and after ultracentrifugation were resuspended in 100uL PBS and quantified by BCA (Pierce, Thermo Fisher Scientific). 10 µg of labelled exosomes were added for every mL of cell media of HC-MSCs plated at 80% of confluence. After 24 h incubation, media was removed, cells were washed with PBS and fixed with 4% PFA for 20 min.
Immunofluorescence and cell microscopy
For immunofluorescence, cells were incubated with Dapi (1:5,000) for 5 min and then after one wash in PBS with Wheat Germ Agglutinin (1:200, WGA, Alexa Fluor™ 488 Conjugate, ThermoFisher Scientific) at room temperature for 20 min to stain cell membranes. Cells were washed again, one drop of PBS-glycerol and coverslip was added to each slide for cell microscopy. Confocal microscopy was performed on a Leica TCS-SP8X laser-scanning confocal microscope (Leica Microsystems, Mannheim, Germany) equipped with tunable white light laser (WLL) source, 405 nm diode laser, 3 Internal Spectral Detector Channels (PMT) and 2 Internal Spectral Detector Channels (HyD) GaAsP. The fluorescence intensity mean (normalized for the cell number in the field) was calculated using the NIS-Elements software (Nikon) in at least 10 digital images acquired under 20X magnification, randomly selected and analysed for each staining condition.
MSC education with NB-derived exosomes
Education of HC-MSCs (80,000 cells/wells in 6-well plates) was performed by adding each well 10 µg/ml medium of purified NB-derived exosomes or synthetic Plain Liposomes (Cellsome®, Encapsula NanoSciences) every 2 days. Standard education was performed for 14 days, whereas for experiments combining education and differentiation the period of standard education was followed by 21 days of differentiation in which the exosomes are administered in the same manner described above.
Isolation of exosomes from plasma
Before exosome isolation, whole blood samples were collected in EDTA plasma tubes (BD Vacutainer, Reading, UK) and processed within 2 h. First were centrifuged at 500 g for 10 min. Supernatants were collected and centrifuged at 3,000 g and then at 12,000 g for 20 min. Plasma sample was then stored at −80ºC prior use. Exosome isolation from plasma was performed using the commercial kit miRCURY™ Exosome isolation Kit – Serum and Plasma (Exiqon) according to the manufacturer’s protocol. Isolation is based on capturing of water molecules which otherwise form the hydrate envelop of particles in suspension. Briefly, 3 U of Thrombin was added to 0,6 mL of plasma and incubated for 5 min at room temperature (RT) and spun for 5 min at 10,000 g. 0,5 mL of supernatant was collected, 200 µl of Precipitation Buffer A was added, vortex for 5 s to mix and incubated for 60 min at 4°C. After incubation, samples were spun for 5 min at 500 g at RT and the supernatants were removed and discarded. Pellets were re-suspended by vortex in 270 µl Resuspension Buffer. The purified exosome samples were characterized following the recommendations of MISEV2018 [Citation20] by SEM, WB and NTA, and then processed for RNA extraction.
RNA isolation from exosomes
RNA from plasma exosomes was isolated using miRCURY™ RNA Isolation Kit – Biofluids (Exiqon) according to the manufacturer’s protocol. In detail, 300 µL supernatant from exosome isolation were mixed with 90 µL Lysis solution BF, vortex for 5 s and incubated for 10 min at RT. 1 µL RNA Spike-in template mixture (miRCURY LNA™ Universal RT microRNA PCR, RNA Spike-in kit) was added to each sample for downstream PCR analysis. Thereafter, 30 µL Protein Precipitation Solution BF was added to samples and then vortexed, incubated for 1 min at RT and centrifuged for 3 min at 11,000 g. After transferring the supernatants 400 µL isopropanol was added, vortexed for 5 s and loaded in microRNA Mini Spin Column BF. Columns were incubated for 2 min at RT, centrifuged for 30 s at 10,000 g, washed with Wash Solution 1 BF and twice with Wash Solution BF 2. After that, columns were centrifuged for 2 min at 11,000 g to dry membranes and RNA was eluted adding 80 µL RNase-free H2O directly onto the membrane of the spin column BF. Columns were incubated for 1 min at RT and then centrifuged for 1 min at 11,000 g. The purified RNA samples were stored at −80°C.
RNA-extraction, RT-PCR and RT-qPCR for genes or miRNA expression
Total RNA for gene expression was extracted using TRIzol (Invitrogen, Carlsbad, CA, USA) according to the manufacturer’s protocol and inspected by agarose gel electrophoresis. Reverse transcription was performed using the Improm-II Reverse Transcription System (Promega, Madison, WI, USA). The relative gene expression levels were measured by real-time RT-qPCR. TaqMan assays (Applied Biosystems, Life Technologies, Carlsbad, CA, USA) for RUNX2 (Hs01047973_m1), BMP2 (Hs00154192_m1), SPP1 (Hs00959010_m1), OSTERIX (Hs01866874_s1), RANKL (Hs00243522_m1), IL-6 (Hs00174131_m1), IL-8 (Hs00174103_m1), DEPTOR (Hs00961900_m1), YAP1 (Hs00371735_m1) were used. Samples were normalized according to the glyceraldehyde-3-phosphate dehydrogenase (GAPDH) mRNA (Hs99999905_m1) levels. RNA for miRNA expression was isolated from exosomes using Plasma/Serum Circulating and Exosomal RNA Purification Mini Kit (slurry format) (Norgen Biotek Corp., Thorold, Canada) following the manufacturer’s instruction. For extraction efficiency evaluation, spike-ins (RNA spike-in kit, Exiqon) were added to lysis buffer before serum extraction. Extracted samples were stored at −80°C until use. Reverse transcription (RT) for miRNAs was performed by mixing RNA (2 μl) with two artificial RNAs (RNA spike-ins as RT controls) and the final mixture (10 μl) was reverse transcribed at 42°C for 60 min using the miRCURY LNA™ Universal RT cDNA Synthesis Kit (Exiqon) following the manufacturer’s instruction. The expression level of miRNAs was evaluated by the Serum/Plasma Focus microRNA PCR panel (Exiqon) with a QuantStudio 12 K Flex Real-Time PCR System (Thermo Fisher Scientific, Waltham, MA, USA). The amplification curves were filtered (Ct<36), imported into the GenEx software (ver.5, Exiqon) and normalized by global mean. The expression level (fold change [FC]) was calculated by taking the mean of individual Cq values for each group (controls and NB cells). Individual assays for mature miR-375 (cat.no.204362) and two endogenous controls, miR-16-5p (cat.no.205702) and let-7a-5p (cat.no.205727), for cell models or miR-191-5p (cat.no.204306) and miR-103a-3p (cat.no.204063) for exosomes were used. QuantStudio 12 K Flex Real-Time PCR System (Thermo Fisher Scientific, Waltham, MA, USA) was employed for the qPCR quantification and the fold change was calculated by the 2−ΔΔCt method by using the Relative Quantification module of Thermo Fisher Cloud Data Analysis Apps. At least two independent amplifications were performed for each probe on triplicate samples.
miRNA mimic and inhibitor transfection
NMBM- and MBM-MSCs were transiently transfected with 30 nM of mirVana miR-375 mimic, 30 nM of miRVana mimic negative control, 30 nM mirVana miR-375 inhibitor or 30 nM mirVana inhibitor negative control (all from Ambion, Life technologies) using Lipofectamine RNAiMAX reagent (Invitrogen, Life Technologies) following the manufacture’s protocol. Cells were lysed for miRNA and gene expression analysis or protein extraction 24, 48, 72 and 96 h post-transfection.
Western blotting
Cell cultures were lysed with Cell lysis buffer (Cell Lysis Buffer (10X) #9803 Cell Signalling Technology) containing 10 mM phenylmethylsulphonyl fluoride (PMSF 93,482 Sigma) as a protease inhibitor. Lysates were incubated on ice for 15 min and centrifugated at 13 000 × g for 20 min at 4°C. Equal micrograms (20 µg) of proteins quantified with bicinchoninic acid (BCA) assay (Thermo Scientific) and boiled in SDS sample buffer (2x Laemmli Sample Buffer BIORAD cat.#161-0737) were resolved on 10% SDS-PAGE and transferred to PVDF membranes (Immun-Blot® PVDF Membrane for protein Blotting BIORAD cat.#162-0177). Blots were blocked for 1 h in PBS-T (PBS plus 0.05% Tween-20), 5% non-fat, dried milk and probed overnight at 4°C with DEPTOR/DEPDC6 antibody, NBP1-49,674 (Novusbio); GAPDH (D16 H11) XP #5174 (Cell Signalling Technology); Anti-YAP (phosphor S127) antibody [EP1675Y] ab76252 (Abcam); anti-YAP antibody [EP1674Y] ab52771 (Abcam); Anti-Sp7/Osterix antibody ab94744 (abcam); anti-BMP2 antibody ab14933 (abcam); RUNX2 (D1L7 F) Rabbit mAb #12,556 (Cell Signalling Technology); Anti-Osteopontin antibody ab8448 (abcam). Immunocomplexes were detected with horseradish peroxidase-conjugated species-specific secondary antibodies (Santa Cruz Biotechnology) followed by enhanced chemiluminescence reaction with Immobilon Western Chemiluminescence HRP substrate WBKLS0100 (Millipore).
In vivo experiments
The animal studies were performed in NOD SCID mice following the protocols approved by the Italian Ministry of Health. Female 5–6 weeks-old mice were purchased from Charles River (Milan, Italy) and housed in a barrier rodent facility with free access to standard diet and water for 1 week before the experiment. For the uptake testing, exosomes were labelled with PKH26 fluorescent dye, 10ug of total exosome proteins were resuspended in 100 µl of PBS and injected retro-orbitally. The same concentration of liposomes was used as negative control. After 24 h, mice were sacrificed, and the long bones (tibia and femur) were embedded in Optimum Cutting Temperature (OCT) compound and frozen at −80°C. Fluorescent signal from bone marrow, counterstained with DAPI, was observed with confocal microscopy. For in situ hybridization (ISH), 10 µg of exosomes resuspended in 100ul of PBS were injected retro-orbitally each day for 3 days. The same concentration of liposomes was used as negative control. At day 4 mice were sacrificed, long bones (tibia and femur) were fixed in 10% buffered formalin, decalcified in ethylenediaminetetraacetic acid (EDTA), embedded in paraffin and processed for ISH.
In situ hybridization (ISH)
Paraffin-embedded BM and murine long bone samples were cut in RNAse-free environment at 5 µm thick, placed on positive-charged slides, backed at 60°C for 1 h and half and store at room temperature until used the day after. Before starting, double-DIG-LNA probes (Exiqon) for miR-375 (/5DigN/CACGCGAGCCGAACGAACAAA/3Dig_N/), U6 small nuclear probe (/5DigN/CACGAATTTGCGTGTCATCCTT/3Dig_N/) (positive control) and the scramble-miR probe (/5DigN/GTGTAACACGTCTATACGCCCA/3Dig_N) (negative control) were denaturated by heating at 90°C for 4 min and then diluted with ISH buffer (Exiqon) at 80 nM, 40 nM, 1 nM and 40 nM, respectively. Slides were placed in xylene and hydrated in alcohol descending scale. Tissue permeabilization was performed by using Protease-k at a final concentration of 15 µg/mL for 10 min for human BM sections and for 15 min for mice bone sections at 37°C in the stove. Slides were then washed in sterile phosphate buffer solution 1X, dehydrated in alcohol-increasing scale and air-dried. Probe mixture was placed directly on the tissue section and covered with sterile coverslip avoiding air bubbles. Slides were placed in a humidified chamber in the stove at 55°C for 1 h for human BM sections and at 50°C for 1 h and 30 min for mice bone sections. Non-specific bounds were removed through decreasing gradient (5X, 1X, 0,2X) washes of Sodium Sulphate Citrate (SSC) (Sigma-Aldrich, St Louis, MO) at the hybridization temperature for 5 min each and one wash in SSC 0,2X at room temperature for 5 min. Slides were placed in a humidifying chamber and incubate for 15 min with blocking solution (PBS, 0.1% Tween, 2% Sheep serum, 1% BSA) at room temperature. After removing blocking solution anti-DIG reagent at 1:800 in antibody dilutant (PBS, 0.05% Tween, 1% Sheep serum, 1% BSA) was applied with AP substrate (NBT/BCIP tablet in Milli-Q water, 0.2 mM Levamisole) (Roche) for 2 h at 30°C in the humidifying chamber. To stop the reaction slides were incubated in KTBT buffer two times for 5 min and then washed twice with water. Nuclear Fast RedTM (Vector laboratories) was applied for 1 min for nuclear counterstaining, and finally, slides were washed in tap water, dehydrated in alcohol-increasing scale and mounted with Eukitt® (VWR) mounting medium. Slides were analysed by light microscopy with (Eclipse E600, Nikon) the subsequent day.
Prediction of miRNA targets
To discuss the potential biological role of putative target genes regulated by those miRNAs that were found significantly upregulated in NB cells compared to MSCs, we performed a bioinformatics analysis by using the miR-Ontology Database miRò (http://microrna.osumc.edu/miro/). This tool allows to obtain validated and/or predicted miRNA targets belonging to a well-defined biological process or phenotype (disease). As a selection criterion, we extracted only those targets belonging to phenotypes related to the osteogenic lineage commitment (e.g. BMP2, RUNX, SPP1). Gene Ontology and KEGG pathway enrichment analysis and annotation were performed by DAVID bioinformatics tool [Citation22] to determine the biological processes and signalling pathways in which the predicted targets of the dysregulated miRs were involved.
Statistical analyses
Statistical analysis was performed using the two-tailed Student’s t-test for single comparison or one-way ANOVA for multiple comparisons. For qRT-PCR statistical analyses were performed on 2−ΔΔCt. Quantitative data are presented as mean±standard error of the mean (SEM). All experiments were performed in triplicate. Differences were considered significant at *P < 0.05; **P < 0.01; ***P < 0.001; ****P < 0.0001. The raw Cq values from amplification curves were normalized by global mean using the GenEx qPCR analysis software (Exiqon ver 5). Statistically significant (p < 0.05) miRNAs with a fold change (FC) smaller than −1.5 (FC<-1.5) and greater than 1.5 (FC >1.5) compared to controls were obtained. Categorical variables were summarized by absolute frequencies and percentages, and continuous variables by mean and standard deviation or median and interquartile range. To determine statistical differences between groups, the χ2 test or Fisher exact test was used for categorical variables, whereas the t-test or Mann–Whitney test was used for continuous variables. Two multivariable logistic regression models were developed to assess independent predictors of score 0, compared with score 1 + 2. Variables for which the p value was ≤0.20 in univariable analysis were included in the multivariable models. We have used infiltration of BM compared with non-infiltration of BM and alternatively presence of INRGSS compared with the absence of INRGSS among the covariates. The Hosmer–Lemeshow test was used to measure the model performance. All multivariable logistic model was adjusted for potential confounders. All statistical analyses were performed using Stata, version 13 (StataCorp).
Results
BM-MSCs from patients with NB and BM-metastasis exhibit a strong osteogenic ability
NB-cell lines enhance osteoblastic differentiation of BM-MSCs in vivo [Citation23] and osteoblastic precursors stimulate osteoclast differentiation and bone resorption via RANKL [Citation24]. Therefore, we speculated that BM-MSCs may play a crucial role in promoting NB metastasis.
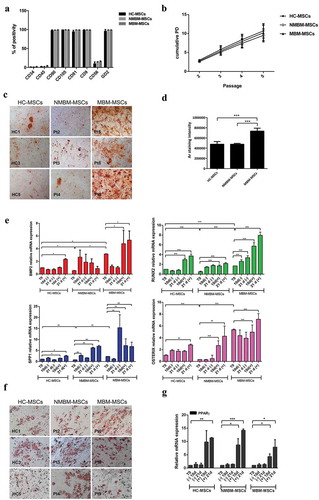
To test this hypothesis, we isolated and characterized in vitro BM-MSCs from 12 children affected by NB and 7 healthy controls (HC) ((). Among NB patients, eight presented BM metastasis (MBM-MSCs, metastatic bone marrow-MSCs) and four did not have BM metastasis (NMBM-MSCs, non-metastatic bone-marrow MSCs). First, MSC cells were immune-phenotypically characterized by flow-cytometry, at cell passage between 2 and 4, for the expression of mesenchymal (CD90, CD105, CD81, CD9), haematopoietic (CD34, CD45) and neuronal (CD56) markers. Furthermore, we analysed the GD2 ganglioside, reported as abundant on the surface of NB cells and considered also to be an MSC marker [Citation25]. Similar to HC-MSCs, MBM- and NMBM-MSCs were positive for CD90, CD105, CD81, CD9 and GD2 and negative for CD34, CD45, CD56 (). To compare their proliferative capacity, NMBM-, MBM- and HC-MSCs were plated in parallel, by using the same culture conditions. Comparable proliferative capacity, calculated as population doublings (PDs), was found among NMBM-, MBM- and HC-MSCs (). Then, to examine the osteogenic potential, MSCs were induced to differentiate into osteoblasts and adipocytes and were examined by histological staining and gene expression. Alizarin Red staining, performed on day 21 after osteogenic induction, showed a higher content of calcium deposits in MBM-MSCs compared to NMBM-MSCs and HC-MSCs (,d)). By real-time quantitative PCR (Q-PCR) we analysed transcription factors expressed during osteogenic differentiation, such as RUNX2 and OSTERIX and osteogenic markers as BMP2 and SPP1. MBM-MSCs had a higher expression level of these osteogenic factors compared to the other two groups, both at basal level (T0) and during induction of osteogenic differentiation (). No significant differences were detected in the adipogenic differentiation (,g)). In sum, our data suggest that BM-MSCs isolated from NB patients with BM infiltration have stronger osteogenic differentiation capacity when compared to BM-MSCs from patients without BM metastasis.
Figure 1. MBM-MSCs have an increased osteogenic potential.
Exosomes produced by NB-cell lines derived from BM metastasis enhance osteogenesis in HC-MSCs
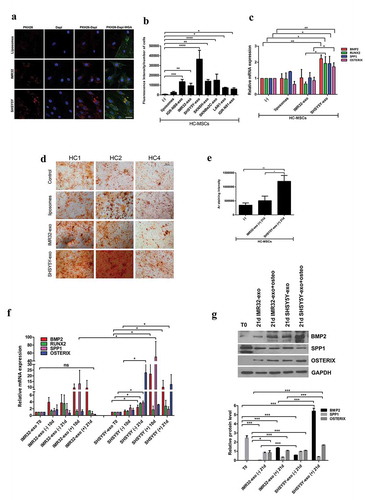
In our previous study, we showed that exosomes isolated from BM metastasis-derived NB-cell lines have a unique proteomic signature [Citation21]. Nakata and colleagues demonstrated that the uptake of NB-cell line-derived exosomes by MSCs was associated with a rapid increase in ERK1/2 and AKT activation [Citation26]. To explore whether the exosomes produced by BM metastasis-derived NB-cell lines interact differently with MSCs, we isolated exosomes from serum-free conditioned medium of two primary tumour (PT) – (IMR-32 and IGR-NB8 cells) and five BM metastasis-derived (SKNSH, SHSY5Y, SKNBe2 c, LAN-1 and IGR-N91) NB-cell lines, by following previously reported methods [Citation21]. Then, after preparation of PKH26 labelled exosomes, 10 µg of total exosomal protein per mL of media, as reported in the literature [Citation10,Citation27], was co-cultured with HC-MSCs. Synthetic liposomes were used as negative control. After 24 h, fluorescent red signals were visualized in the cytoplasm of MSCs by confocal microscopy, supporting the idea that, at variance with liposomes, NB-cell line-derived exosomes were efficiently internalized by HC-MSCs ((a,b) and Supplementary Figure 1A). Since SHSY5Y-derived exosomes, from a BM metastasis-derived cell line, were significantly taken up by HC-MSCs compared to those derived from IMR32 (PT-derived) ((a,b)), we investigated their different biological effects on the osteogenic ability of MSCs. The addition in culture media for 24 h of SH5YSY-exosomes significantly induced the expression of osteogenic mRNAs, such as BMP2, RUNX2, SPP1 and OSTERIX, compared with those isolated from IMR-32 in HC-MSCs ((c)). These results were confirmed using exosomes isolated from a second BM metastasis-derived cell line (SKNBe2 C), whereas no effect was observed using IGR-NB8 or cervical cancer cells HeLa-derived exosomes (Supplementary Figure 1 B). To further explore the osteogenic phenotype induction due to exosome influence on BM-MSCs, we added SH5YSY-, IMR-32-derived exosomes or liposomes (10 µg/mL of media) every other day for 14 days to the HC-MSCs culture medium. After 14 days, we replaced the culture medium with osteogenic differentiation medium to the persisting co-culture with exosomes for further 21 days. At the end of the differentiation period, we observed that HC-MSCs co-cultured with SH5YSY-derived exosomes had a higher content of calcium deposits as compared with the other two groups ((d,e)). Moreover, BMP2, RUNX2, SPP1 and OSTERIX mRNA expression was significantly increased not only in the presence of the osteogenic medium but also in cells treated for 21 days with SHSY5Y-exosomes without osteogenic differentiation medium ((f)) suggesting the possibility that these have the ability to potentiate/induce osteogenic differentiation of HC-MSCs. Furthermore, both BMP2 and OSTERIX protein levels increased in HC-MSCs exposed to SH5YSY-exosomes even in absence of osteogenic differentiation media after 21 days respect to basal condition (T0) or IMR32-exosomes ((g)). No significant variation in the induction of adipogenic differentiation was observed in HC-MSCs educated with SH5YSY- or IMR-32-exosomes (Supplementary Figure 1 C, D, E). Altogether, these data suggest that exosomes released from BM metastasis-derived NB cells play an important role in regulating osteogenic differentiation of BM-MSCs.
Figure 2. Exosomes isolated from MBM cells induce osteogenic differentiation of HC-MSCs.
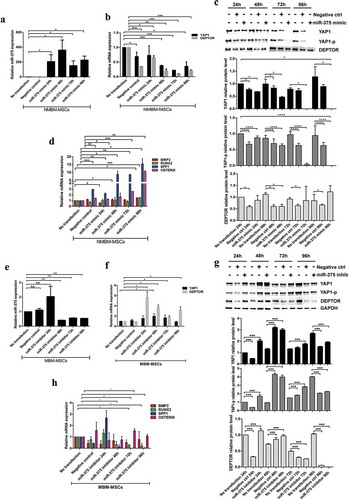
MiR-375 is highly expressed in exosomes released from NB-cell lines derived from BM-metastasis and in MBM-MSCs
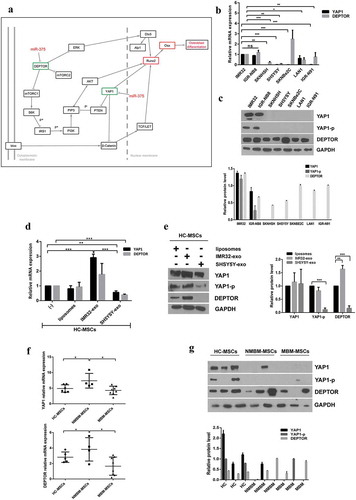
MiRNAs may be secreted by cancer cells within exosomes and transferred to target cells, influencing their gene expression [Citation9]. We postulated that NB-derived exosomal miRNAs could promote an osteogenic phenotype in MSCs described in (c,f). To verify this hypothesis, we characterized exosomal miRNAs of 7 NB-cell lines: PT-derived (IMR32, IGR-NB8) and BM metastasis-derived (SKNSH, SH5YSY, SKNBe2 c, LAN-1, IGR-N91). By real-time Q-PCR, we compared the expression levels of exosomal miRNAs between PT-derived lines and each single BM-derived line ((a)). In exosomes isolated from all BM metastasis-derived cell lines, five miRNAs (miR-375, miR-365a-3p, miR-193b-3p, miR-18a-3p, miR-140-5p) resulted up-regulated, with a fold change FC>1.5 or FC<-1.5. Among these, miR-375 was particularly expressed compared to control (FC>3). The levels of miR-375 were higher in BM-metastasis-derived with respect to PT-derived cell lines ((b)). In addition, we found that miR-375 expression level was also increased in MBM-MSCs compared to HC- and NMBM-MSCs ((c)). In light of this evidence, we decided to investigate the expression of miR-375 in HC-MSCs treated with either SHSY5Y- or IMR32-derived exosomes. We observed that 24 h co-culture with SHSY5Y-exosomes significantly increased the miR-375 expression in HC-MSCs ((d)). Target prediction analysis revealed and confirmed Yes-Associated Protein 1 (YAP1) and DEP domain-containing mTOR-interacting protein (DEPTOR) among the potential miR-375 targets ((a)) as reported in the literature [Citation28,Citation29]. Indeed, it has been demonstrated that YAP1, an effector of Hippo pathway, suppresses the activity of RUNX2 required for osteoblast maturation [Citation30]. Thus, we postulated that miR-375, carried by exosomes released from NB cells with BM tropism, promotes osteogenesis by inhibiting YAP1 and consequently restoring RUNX2 function. To test this hypothesis, we first evaluated the expression of both YAP1 and DEPTOR in NB-cell lines. Both YAP1 and DEPTOR expression levels were lower in NB BM-metastasis compared to PT-derived cell lines ((b)). Moreover, WB analyses showed that both YAP1 and its phosphorylated form (YAP1-p) were not expressed in NB BM-metastasis-derived cell lines with respect to both IMR32 and IGR-NB8 ((c)). On the contrary, DEPTOR was substantially expressed in all the NB-cell lines analysed, and marginally in the metastatic ones. Interestingly, the SKNBe2 C cell line expressed a high level of DEPTOR both at mRNA and protein levels, probably due to different cell-specific mechanisms. mRNA expression and WB analysis of HC-MSCs treated for 24 h with SH5YSY-derived exosomes showed a significant decrease in both YAP1 and DEPTOR levels, at variance with what has been observed for IMR-32 exosomes ((d,e)). A baseline mRNA analysis of miR-375 target genes in MBM, NMBM- and HC-MSCs showed a decreased expression of YAP1 and DEPTOR in MBM-MSC with respect to NMBM- and HC-MSCs ((f)). WB analyses on three representative subjects of each group evidenced the absence of YAP1 in all patients with NB except for one without BM infiltration, the absence of YAP1-p in all NB patients and in one HC and the presence of DEPTOR in all samples excluding one derived from a BM metastatic patient ((g)). This variability in miR-375 targets expression could be linked to the reduced number of samples or the fact that these are involved in several other molecular pathways such as the Hippo pathway and mTOR pathway [Citation31,Citation32].
Figure 3. Exosomal miR-375 expression differs between PT- and BM-derived cell lines.
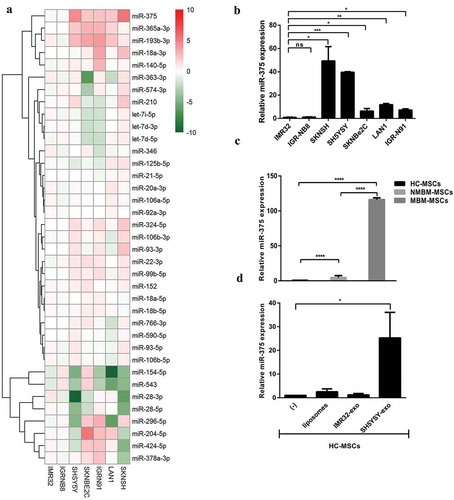
Figure 4. YAP1 and DEPTOR, two MiR-375 target genes, are down-regulated by exosomes isolated from SHSY5Y.
MiR-375 modulates the expression of osteogenic transcription factors
To confirm the involvement of miR-375 in the induction of osteogenic differentiation program in BM-MSCs, we transiently overexpressed miR-375 in NMBM-MSC or knocked it down in MBM-MSC for 24, 48, 72 and 96 h. As predicted, real-time Q-PCR analysis confirmed the increase of miR-375 levels in NMBM-MSC compared to basal condition (no transfection) and the mimic negative control ((a)). Consistently, overexpression of miR-375 significantly decreased both mRNA and protein expression of its target genes YAP1 and, to a lesser extent, DEPTOR ((b,c)) and increased osteogenic markers such as SPP1 and OSTERIX ((d)). Conversely, the down-regulation of miR-375 by using synthetic oligo inhibitor in MBM-MSC for 24, 48, 72 and 96 h determined a significant miR-375 downregulation respect to basal condition starting from 48 h after transfection (), a significant up-regulation of YAP1 and DEPTOR mRNA expression and proteins at 24, 48 and 72 h of down-regulation of the miR-375 compared to the non-transfected cells ((f,g)). The effects of miR-375 inhibition on its targets are lost at 96 h probably due to particular kinetics of transcripts and proteins turnover that are however perturbed by forcing the system, without considering that these factors are involved in several other molecular pathways (i.e. Hippo pathway and mTOR pathway). However, no significant modulation or a down-regulation of genes involved in osteoblast differentiation was observed ((h)).
Figure 5. MiR-375 overexpression induces transcription of osteogenic genes in NMBM-MSCs.
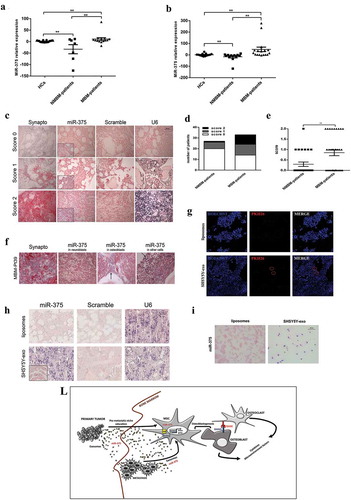
MiR-375 expression correlates with BM disease in NB patients
To test a possible correlation between the levels of miR-375 and BM infiltration in NB patients, we isolated and characterized (Supplementary Figure 2) exosomes from peripheral blood plasma (PBP) of HC (n = 17), NMBM patients (n = 7) or MBM patients (n = 14). MiR-375 expression levels were then assessed by Q-PCR. The mean value of miR-375 expression in HC was established as 1 and levels in plasma exosomes have been calculated as fold changes (FC). MBM patients had statistically significant higher level of miR-375 than NMBM-patients (P = 0.01) ((a)). Furthermore, we measured miR-375 levels in exosomes isolated from BM plasma derived from HC- (n = 13), NMBM- (n = 12) or MBM- (n = 17) patients and we found that MBM patients had higher levels of miR-375 than NMBM patients (P = 0.01) ((b)). In order to investigate the expression of miR-375 in BM cells, whole-mount ISH was performed on paraffin-embedded BM samples of 27 NMBM patients and 33 MBM patients. Synaptophysin staining was used to evaluate NB invasion. Staining intensity for miR-375 was evaluated by three independent operators and a score (0 = no expression; 1 = low expression; 2 = high expression) was assigned to each case ((c)). Comparison with clinical characteristics revealed that score 1 or 2 was significantly associated with patients presenting BM infiltration (P = 0.016) ((d,e)). We evidenced that miR-375 expression in MBM patients is present not only in neuroblasts but also in osteoblasts and in other cells native of the BM (e.g. erythroid colonies) (). Intriguingly, a patient with localized NB at diagnosis, who presented a negative staining for miR-375 in BM, became positive after BM relapse (Supplementary Figure 3). Moreover, we correlated the different prognostic risk factors known in NB with miR-375 staining (0 versus 1 + 2 score). We performed a univariable analysis taking into account patients’ age (younger or older than 18 months), stage of disease according to INRG (L1/L2 versus M), MYCN status (amplified versus not amplified) and BM-infiltration (Yes versus Not). We found that positive staining for miR-375 (score 1 or 2) correlates with the metastatic stage (p = 0.007) and BM infiltration (p = 0.016) (Supplementary Table 1). We did not find any correlation between miR-375 expression and MYCN status. This could be related to the presence of a subset of high-risk cases without MYCN amplification [Citation33]. Clinical characteristics of patients are summarized in Supplementary tables 2. To determine whether NB-derived exosomes are able to reach BM, we inject in NOD SCID mice 10 µg of SHSY5Y-exosomes PKH26-labelled retro-orbitally. After 24 h of injection, we confirm an uptake of exosomes by BM cells (). To evaluate if exosomes are able to transfer miR-375 to BM microenvironment, we injected, retro-orbitally in NOD SCID mice, 10 µg/day of NB exosomes or liposomes for 3 days. Then, we verified the expression of miR-375 in long bone sections by ISH, and we observed a positivity for miR-375 expression in mice injected with exosomes than those injected with liposomes (). Moreover, to confirm that NB exosomes carry on miR-375 and are able to transfer it to MSCs we performed an ISH on HC-MSCs after coculture for 24 h with 10 µg/mL of SHSY5Y-exosomes or liposomes (). HC-MSCs treated with NB exosomes become positive for miR-375 while those with liposomes were negative. In sum, our data indicate that a high level of miR-375 in circulating exosomes and in BM is associated with BM metastasis.
Figure 6. MiR-375 expression correlates with BM disease in NB patients.
Discussion
BM is the most frequent site of metastasis and one of the major cause of cancer-related death in NB. In several cancer types, the interaction among tumour cells and BM microenvironment plays a central role in promoting metastasis formation [Citation34]. MSCs are fundamental components of the BM microenvironment and are essential for the homing of tumour cells and the establishment of metastasis by forming the osteoblastic niche [Citation3]. In NB, tumour cells activate osteoclasts to form osteolytic lesions for bone invasion [Citation34] and their ability to induce osteoclastogenesis is mediated by RANKL [Citation12]. HaDuong and co-workers have described that NB cells may increase the capacity of osteogenic differentiation in vivo [Citation23]. However, despite several studies, the role of osteoblasts and osteoclasts in generating a favourable microenvironment for BM metastases is still controversial [Citation35–Citation37].
In this study, we showed that BM-MSCs derived from NB patients with BM invasion exhibit a stronger osteogenic differentiation ability as compared to MSCs isolated from patients without BM metastasis and HC. Furthermore, we showed that both NMBM- and MBM-MSCs expressed high levels of RANKL; however, the significance was lost considering separately patients with only BM metastasis and with also bone metastasis. Considering other osteoclast activating factors (i.e. IL-6 and IL-8) we observed a not significant increase of IL-8 in MBM-MSCs (Supplementary Figure 4). Taken together, our findings suggest that NB-MSCs (and mostly MBM-MSCs) could enhance osteolytic bone metastasis formation via RANKL and IL-8 production [Citation35,Citation36,Citation38]. In support of our hypothesis, a recent work has demonstrated that β-tricalcium-phosphate scaffolds promote differentiation of human MSC towards osteoblasts favouring the growth of metastatic NB cells in characteristic rosette-like structures [Citation39]. In support of our hypothesis, a recent work has demonstrated that β-tricalcium-phosphate scaffolds promote differentiation of human MSC towards osteoblasts favouring the growth of metastatic NB cells in characteristic rosette-like structures [Citation39].
Osteogenic differentiation of MSCs is a complex process, which is regulated by various factors, including miRNAs [Citation40]. MiRNAs can be transported by exosomes, endosome-derived nanovesicles secreted into the extracellular space. Exosomes may facilitate the communication among the primary tumour and site of metastasis by transferring genetic information to target cells and promoting modifications in the tumour microenvironments [Citation9]. Exosomal miRNAs have been shown to directly control cell–cell interactions in the BM environment, as well [Citation41,Citation42].
Our results indicate that the uptake of exosomes isolated from NB cells with BM tropism by BM-MSCs is able to promote osteogenesis. Although we cannot rule out the presence of other types of extracellular vesicles, such as small microparticles, we postulate that the functional effect we have observed is mainly mediated by exosomes.
This occurs via induction of expression of transcription factors as RUNX2 and OSTERIX and osteogenic markers, including BMP2 and SPP1. Indeed, by using a high-throughput analysis, we identified a panel of exosomal miRNAs associated with BM metastasis-derived NB-cell lines. Among these miRNAs, miR-375 is significantly up-regulated in bone tropic NB-derived exosomes. MiR-375 has been described to function either as an oncogene or tumour suppressor in many human cancers [Citation43]. Interestingly, a recent work reported that exosomes from prostate adenocarcinoma cells carry miR-375 promoting osteoblast activity [Citation44]. In the present study, we found that miR-375 expression level was also increased in MBM-MSCs and in HC-MSCs after co-culture with bone tropic NB-derived exosomes. Based on these results, we hypothesize that miR-375 may be transferred from BM tropic NB cells to MSCs via exosomes promoting osteogenic differentiation and generating a favourable microenvironment for metastasis growth ((f)).
Our prediction analysis confirms that YAP1, an effector of Hippo pathway, and DEPTOR may represent targets of miR-375. It has been demonstrated that YAP1 suppresses the activity of RUNX2 required for osteoblast maturation [Citation30]. It has also been reported that DEPTOR is implicated in osteogenic differentiation by inhibiting MEG3-mediated activation of BMP4 signalling [Citation45]. In line with our results Chen et al. showed that miR-375 promoted the osteogenic differentiation of hASCs via the YAP1/DEPTOR/AKT regulatory network [Citation46].
Indeed, we demonstrate that overexpression of miR-375 in NMBM-MSCs, which exhibits a low expression of this miRNA, leads to down-regulation of YAP1 mRNA and increased expression of bone differentiation-related genes. On the other hand, down-regulation of miR-375 in MBM-MSCs has no significant effect on the transcription of genes involved in osteoblast differentiation, which is basically transcribed at higher levels in MSCs derived from these patients. This suggests the importance of down-regulating YAP to unlock transcription [Citation30] and to initiate the process of osteoblastogenesis in NMBM.
Interestingly, several studies reported that circulating and exosomal miR-375 was elevated in plasma or serum of patients affected by breast and prostate cancer with distant metastases [Citation47–Citation50]. Here, we showed that miR-375 level in circulating exosomes (peripheral and BM plasma) from NB patients with BM metastasis was higher than in those without BM metastasis. In addition, in situ hybridization analysis of miR-375 on paraffin-embedded BM trephine biopsy specimens derived from 60 NB patients revealed a positive correlation between the expression of this miRNA and BM infiltration. Altogether, our clinical data suggest that high levels of miR-375 in circulating exosomes and in BM are associated with BM infiltration in NB patients.
Overall, our findings suggest that osteoblastic activity is crucial in determining a favourable microenvironment for NB growth in BM. It is thus conceivable that miR-375 produced by NB cells facilitate the metastatic spread in BM. This hypothesis is currently explored in our laboratory.
Evaluation of blood and BM miR-375 would be useful for the diagnosis of BM metastasis in NB patients. Therapies targeting miR-375 may be a strategy able to suppress BM metastasis in NB. Bisphosphonates, such as zoledronic acid, have been shown to be efficacious against bone metastasis in different solid tumours [Citation51]. A phase 1 of zoledronic acid associated with low-dose cyclophosphamide in recurrent/refractory NB has shown good tolerance with prolonged disease stability [Citation52]. Denosumab, a monoclonal antibody targeting RANKL, inhibits osteoclast formation and maturation preventing osteolysis. The inhibition of RANKL in a breast cancer mouse model significantly delayed the formation of bone metastases and improved animal survival [Citation53]. Thus, the inhibition of RANKL/RANK axis also represents a potential strategy for preventing the development of BM metastasis in NB.
Author contributions
MC, ADG, designing research study; MC, LT, AG, AP, VDP, CDS, PM, LP, HP, conducting experiments; MC, LT, AG, AP, VDP, SP, acquiring data; MC, LT, AP, SP, AM, ADG, analyzing data; RDV, AC, AM, IR, RC, FN, ADG providing patient samples and reagents; MC, LT, FL, ADG, writing the manuscript.
Supplemental Material
Download MS Word (4.3 MB)Acknowledgments
This work was supported by grants from the Ministero della Salute (GR-2016-02364088 to ADG), the Associazione Italiana per la Ricerca sul Cancro (AIRC)-Special Program Metastatic disease: the key unmet need in oncology 5 per mille 2018 Id. 21147 to FL and Ministero dell’Istruzione, Università e Ricerca (MIUR, grant PRIN 2017 to FL). We thank Prof. Francesco Cecconi for feedback on the manuscript and Dr. Birgit Geoerger for kindly providing IGR-NB8 and IGR-N91 NB-cell line. We thank the blood collection center of the Ospedale Pediatrico Bambin Gesù (Centro prelievi sede di San Paolo) and in particular Dr. Mauro Albano, Dr. Stefano Ceccarelli and Caterina Ciriaci for the collaboration in the sample collection. We thank Dr. Valentina Polcini for proofreading of the manuscript. Dr. Marta Colletti and Dr. Virginia Di Paolo are recipients of the post-doctoral fellowships 2020-FUV (Umberto Veronesi Foundation).
Disclosure statement
The authors declare no potential conflicts of interest.
Supplementary data
Supplemental material for this article can be accessed here.
Additional information
Funding
References
- Brodeur GM, Pritchard J, Berthold F, et al. Revisions of the international criteria for neuroblastoma diagnosis, staging, and response to treatment. J Clin Oncol. 1993;11(8):1466–18.
- Ren G, Esposito M, Kang Y. Bone metastasis and the metastatic niche. J Mol Med. 2015;93(11):1203–1212.
- Méndez-Ferrer S, Michurina TV, Ferraro F, et al. Mesenchymal and haematopoietic stem cells form a unique bone marrow niche. Nature. 2010;466(7308):829–834.
- Kakonen SM, Mundy GR. Mechanisms of osteolytic bone metastases in breast carcinoma. Cancer. 2003;97:834–839.
- Roodman GD. Role of the bone marrow micro-environment in multiple myeloma. J Bone Miner Res. 2002;17:1921–1925.
- Krzeszinski JY, Wei W, Huynh H, et al. miR-34a blocks osteoporosis and bone metastasis by inhibiting osteoclastogenesis and Tgif2. Nature. 2014 Aug 28;512(7515):431–435..
- Brian E, Yibin K. MicroRNAs as regulators of bone homeostasis and bone metastasis. Bonekey Rep. 2014;3:549.
- Paget S. The distribution of secondary growths in cancer of the breast. Cancer Metastasis Rev. 1989;8:98–101.
- Valadi H, Ekström K, Bossios A, et al. Exosome-mediated transfer of mRNAs and microRNAs is a novel mechanism of genetic exchange between cells. Nat Cell Biol. 2007;9(6):654–659.
- Hoshino A, Costa-Silva B, Shen TL, et al. Tumour exosome integrins determine organotropic metastasis. Nature. 2015 Nov 19;527(7578):329–335..
- Fong MY, Zhou W, Liu L, et al. Breast-cancer-secreted miR-122 reprograms glucose metabolism in premetastatic niche to promote metastasis. Nat Cell Biol. 2015 Feb;17(2):183–194..
- Granchi D, Amato I, Battistelli L, et al. In vitro blockade of receptor activator of nuclear factor-kappaB ligand prevents osteoclastogenesis induced by neuroblastoma cells. Int J Cancer. 2004;111:829–838.
- Redini F, Heymann D. Bone tumor environment as a potential therapeutic target in ewing sarcoma. Front Oncol. 2015;5:279.
- Tumilowicz JJ, Nichols WW, Cholon JJ, et al. Definition of a continuous human cell line derived from neuroblastoma. Cancer Res. 1970;30(8):2110–2118.
- Vassal G, Terrier-Lacombe MJ, Bissery MC, et al. Therapeutic activity of CPT-11, a DNA-topoisomerase I inhibitor, against peripheral primitive neuroectodermal tumour and neuroblastoma xenografts. Br J Cancer. 1996;74(4):537–545.
- Biedler JL, Helson L, Spengler BA. Morphology and growth, tumorigenicity, and cytogenetics of human neuroblastoma cells in continuous culture. Cancer Res. 1973;33(11):2643–2652.
- Barnes EN, Biedler JL, Spengler BA, et al. The fine structure of continuous human neuroblastoma lines SK-N-SH, SK -N-BE(2), and SK-N-MC. InVitro. 1981;17:619–630.
- Seeger RC, Rayner SA, Banerjee A, et al. Morphology, growth, chromosomal pattern and fibrinolytic activity of two new human neuroblastoma cell lines. Cancer Res. 1977;37(5):1364–1371.
- Ferrandis E, Da Silva J, Riou G, et al. Coactivation of the MDR1 and MYCN genes in human neuroblastoma cells during the metastatic process in the nude mouse. Cancer Res. 1994;54(8):2256–2261.
- Thery C, Witwer KW, Aikawa E, et al. Minimal information for studies of extracellular vesicles 2018 (misev2018): A position statement of the international society for extracellular vesicles and update of the misev2014 guidelines. J Extracell Vesicles. 2018;7:1535750.
- Colletti M, Petretto A, Galardi A, et al. proteomic analysis of neuroblastoma-derived exosomes: new insights into a metastatic signature. Proteomics. 2017 Dec;17(2324):23–24..
- Da Huang W, BT S, Lempicki RA. Systematic and integrative analysis of large gene lists using DAVID bioinformatics resources. Nat Protoc. 2009;4(1):44–57.
- HaDuong JH, Blavier L, Baniwal SK, et al. Interaction between bone marrow stromal cells and neuroblastoma cells leads to a VEGFA-mediated osteoblastogenesis. Int J Cancer. 2015;137(4):797–809.
- Akhtari M, Mansuri J, Newman KA, et al. Biology of breast cancer bone metastasis. Cancer Biol Ther. 2008;7(1):3–9.
- Sait S, Modak S. Anti-GD2 immunotherapy for neuroblastoma. Expert Rev Anticancer Ther. 2017;17(10):889–904.
- Nakata R, Shimada H, Fernandez GE, et al. Contribution of neuroblastoma-derived exosomes to the production of pro-tumorigenic signals by bone marrow mesenchymal stromal cells. J Extracell Vesicles. 2017;6(1):1332941.
- Fonseka P, Liem M, Ozcitti C, et al. Exosomes from N-Myc amplified neuroblastoma cells induce migration and confer chemoresistance to non-N-Myc amplified cells: implications of intra-tumour heterogeneity. J Extracell Vesicles. 2019;8(1):1597614.
- Wang Y, Lieberman R, Pan J, et al. miR-375 induces docetaxel resistance in prostate cancer by targeting SEC23A and YAP1. Mol Cancer. 2016;15(1):70.
- Kang W, Huang T, Zhou Y, et al. miR-375 is involved in Hippo pathway by targeting YAP1/TEAD4-CTGF axis in gastric carcinogenesis. Cell Death Dis. 2018;9(2):92.
- Zaidi SK, Sullivan AJ, Medina R, et al. Tyrosine phosporilation controls Runx2-mediated subnuclear targeting of YAP to repress transcription. Embo J. 2004;23(4):790–799.
- Pocaterra A, Romani P, Dupont S. YAP/TAZ functions and their regulation at a glance. J Cell Sci. 2020;133(2):ii: jcs23042.
- Catena V, Fanciulli M. Deptor: not only a mTOR inhibitor. J Exp Clin Cancer Res. 2017;36(1):12.
- Zimmerman MW, Liu Y, He S, et al. MYC drives a subset of high-risk pediatric neuroblastomas and is activated through mechanisms including enhancer hijacking and focal enhancer amplification. Cancer Discov. 2018 Mar;8(3):320–335..
- Berrettoni BA, Carter JR. Mechanisms of cancer metastasis to bone. The Journal of Bone & Joint Surgery. 1986;68(2):308–312.
- Sohara Y, Shimada H, Scadeng M, et al. Lytic bone lesions in human neuroblastoma xenograft involve osteoclast recruitment and are inhibited by bisphosphonate. Cancer Res. 2003;63(12):3026–3031.
- Michigami T, Ihara-Watanabe M, Yamazaki M, et al. Receptor activator of Nuclear factor kB ligand (RANKL) is a key molecule of osteoclast formation for bone metastasis in a newly developed model of human neuroblastoma. Cancer Res. 2001;61:1637–1644.
- Ara T, Song L, Shimada H, et al. Interleukin-6 in the bone marrow microenvironment promotes the growth and survival of neuroblastoma cells. Cancer Res. 2009 Jan 1;69(1):329–337..
- Mussano F, Genova T, Corsalini M, et al. Cytokine, chemokine, and growth factor profile characterization of undifferentiated and osteoinduced human adipose-derived stem cells. Stem Cells Int. 2017;2017:6202783.
- Aveic S, Davtalab R, Vogt M, et al. Calcium phosphate scaffolds with defined interconnecting channel structure provide a mimetic 3D niche for bone marrow metastasized tumor cell growth. Acta Biomater. 2019;88:527–539..
- Zhang JF, Fu WM, He ML, et al. MiRNA-20a promotes osteogenic differentiation of human mesenchymal stem cells by co-regulating BMP signaling. RNA Biol. 2011;8:829–838.
- Valencia K, Luis-Ravelo D, Bovy N, et al. miRNA cargo within exosome-like vesicle transfer influences metastatic bone colonization. Mol Oncol. 2014;8:689–703.
- Zhang X, Sai B, Wang F, et al. Zheng L Hypoxic BMSC-derived exosomal miRNAs promote metastasis of lung cancer cells via STAT3-induced EMT. Mol Cancer. 2019;13(18):40.
- Kinoshita T, Hanazawa T, Nohata N, et al. The functional significance of microRNA-375 in human squamous cell carcinoma: aberrant expression and effects on cancer pathways. J Hum Genet. 2012;57:556–653.
- Li SL, An N, Liu B, et al. Exosomes from LNCaP cells promote osteoblast activity through miR-375 transfer. Oncol Lett. 2019;17(5):4463–4473.
- Si C, Lingfei J, Shan Z, et al. DEPTOR regulates osteogenic differentiation via inhibiting MEG3-mediated activation of BMP4 signaling and is involved in osteoporosis. Stem Cell Res Ther. 2018;9:185.
- Chen S, Zheng Y, Zhang S, et al. Promotion effects of miR-375 on the osteogenic differentiation of human adipose-derived mesenchymal stem cells. Stem Cell Reports. 2017;8(3):773–786.
- Yan JW, Lin JS, He XX. The emerging role of miR-375 in cancer. Int J Cancer. 2014;135:1011–1018.
- Madhavan D, Peng C, Wallwiener M, et al. Circulating miRNAs with prognostic value in metastatic breast cancer and for early detection of metastasis. Carcinogenesis. 2016;37:461–470.
- Nam RK, Wallis CJD, Amemiya Y, et al. Identification of a novel MicroRNA panel associated with metastasis following radical prostatectomy for prostate cancer. Anticancer Res. 2018;38:5027–5034.
- Porzycki P, Ciszkowicz E, Semik M, et al. Combination of three miRNA (miR-141, miR-21, and miR-375) as potential diagnostic tool for prostate cancer recognition. Int Urol Nephrol. 2018;50(9):1619–1626.
- Singh I, Swami R, Pooja D, et al. Lactoferrin bioconjugated solid lipid nanoparticles: a new drug delivery system for potential brain targeting. J Drug Target. 2016;24(3):212–223.
- Russell HV, Groshen SG, Ara T, et al. A phase I study of zoledronic acid and low-dose cyclophosphamide in recurrent/refractory neuroblastoma: a new approaches to neuroblastoma therapy (NANT) study. Pediatr Blood Cancer. 2011 Aug;57(2):275–282..
- Canon JR, Roudier M, Bryant R, et al. Inhibition of RANKL blocks skeletal tumor progression and improves survival in a mouse model of breast cancer bone metastasis. Clin Exp Metastasis. 2008;25(2):119–129.