
 ?Mathematical formulae have been encoded as MathML and are displayed in this HTML version using MathJax in order to improve their display. Uncheck the box to turn MathJax off. This feature requires Javascript. Click on a formula to zoom.
ABSTRACT
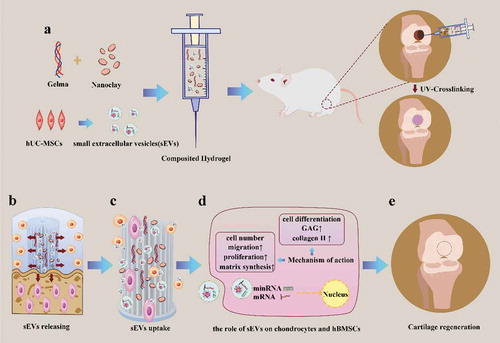
Articular cartilage has limited self-regenerative capacity and the therapeutic methods for cartilage defects are still dissatisfactory in clinic. Recent studies showed that exosomes derived from mesenchymal stem cells promoted chondrogenesis by delivering bioactive substances to the recipient cells, indicating exosomes might be a novel method for repairing cartilage defect. Herein, we investigated the role and mechanism of human umbilical cord mesenchymal stem cells derived small extracellular vesicles (hUC-MSCs-sEVs) on cartilage regeneration. In vitro results showed that hUC-MSCs-sEVs promoted the migration, proliferation and differentiation of chondrocytes and human bone marrow mesenchymal stem cells (hBMSCs). MiRNA microarray showed that miR-23a-3p was the most highly expressed among the various miRNAs contained in hUC-MSCs-sEVs. Our data revealed that hUC-MSCs-sEVs promoted cartilage regeneration by transferring miR-23a-3p to suppress the level of PTEN and elevate expression of AKT. Moreover, we fabricated Gelatin methacrylate (Gelma)/nanoclay hydrogel (Gel-nano) for sustained release of sEVs, which was biocompatible and exhibited excellent mechanical property. In vivo results showed that hUC-MSCs-sEVs containing Gelma/nanoclay hydrogel (Gel-nano-sEVs) effectively promoted cartilage regeneration. These results indicated that Gel-nano-sEVs have a promising capacity to stimulate chondrogenesis and heal cartilage defects, and also provided valuable data for understanding the role and mechanism of hUC-MSCs-sEVs in cartilage regeneration.
Introduction
Articular cartilage has limited self-regenerative capacity due to the lack of vascular, neural and lymphatic network [Citation1]. The treatments for cartilage defects include microfracture, autologous chondrocyte implantation (ACI) and cartilage tissue engineering were difficult to regenerate the damaged cartilage [Citation2]. Compared to natural hyaline cartilage, the fibrocartilage formed by microfracture has poor durability and lacks good histological and biomechanical properties [Citation3]. ACI also has some disadvantages including high cost, secondary injuries and postoperative complications such as articular adhesions, periosteal hypertrophy and delamination of the defect [Citation4,Citation5]. Therefore, new strategies to regenerate the damaged cartilage are desperately needed for the treatment of cartilage defect.
Mesenchymal stem cells (MSCs)-based tissue engineering has promising potential therapy for cartilage defects [Citation6–Citation8]. Human umbilical cord MSCs (hUC-MSCs) possess desirable biological properties, such as abundant tissue source, great expansion capability and painless collection process [Citation9]. Recent studies reported that the therapeutic power of MSCs on cartilage defect can be replicated by the MSCs-derived exosomes [Citation10]. Compared to MSCs, small extracellular vesicles (sEVs) are important bioactive extracellular vesicles with potential application in MSC-based tissue-engineering therapies due to their high stability, easy to obtain and rich sources [Citation11,Citation12]. Recent studies reported that MSC-derived exosomes promoted chondrogenesis [Citation13–Citation15]. For example, human-induced pluripotent stem cell-derived exosomes integrated with hydrogel showed potential in the regeneration of cartilage tissue [Citation14]. Therefore, sEVs are ideal option for the treatment of cartilage defects; however, the role of hUC-MSCs-derived small extracellular vesicles (hUC-MSCs-sEVs) on cartilage regeneration remains unknown and the underlying mechanism requires further researched.
Exosomes (one of the sEVs) with a diameter of 30 –150 nm are rich in proteins, mRNAs and miRNAs [Citation16–Citation18]. MicroRNAs (miRNAs) are a class of ~22nt small non-coding RNA, which play an important regulatory role in target gene expression by binding to the 3ʹuntranslated region (3ʹUTR) of target mRNA, resulting in degradation or translation repression of the target [Citation19]. Recent studies reported that exosomes were secreted to the microenvironment to mediate cell-to-cell communication and deliver genetic information through transferring miRNA [Citation20]. For example, infrapatellar fat pad MSCs-derived exosomes inhibited mTOR-autophagy pathway by delivering miR-100-5p to protect cartilage from damage [Citation10], indicating miRNAs were crucial factors in exosome-mediated intercellular communication. However, whether hUC-MSCs-sEVs promote cartilage regeneration by transferring miRNAs and then affecting related signalling pathways remains elusive.
To optimize in vivo application of sEVs and achieve their sustained release, the scaffold with good biocompatibility, mechanical performance and biodegradability is extremely important. Hydrogel is an excellent biomaterial with promising applications in cartilage tissue engineering due to its unique properties such as extracellular matrix-like water content, thixotropy and desirable biocompatibility [Citation21]. Gelatin methacrylate (Gelma) hydrogel recently attracted increasing attention in tissue engineering for its injectable and UV-cross-linked properties. Chen et al reported the use of 3D printed Gelma/sEVs scaffold in repairing osteochondral defect [Citation17]. However, the application of Gelma hydrogel on cartilage tissue engineering was limited due to its poor strength [Citation22]. Nanomaterials have emerged as a promising biomaterial additive to effectively enhance the mechanical and biological properties of biomaterials [Citation23,Citation24]. Therefore, in this work, we added laponite nanoclay into Gelma hydrogel to improve its mechanical and biological properties and achieve the sustained release of sEVs with the degradation of the hydrogel.
In this study, we successfully fabricated Gelma/nanoclay/sEVs hydrogel (). The sEVs were released in a sustained manner with the degradation of the hydrogel and then gradually internalized by chondrocytes and human bone marrow mesenchymal stem cells (hBMSCs). The absorbed sEVs improved the migration, proliferation and chondrogenic differentiation of the cells, resulting in the formation of glycosaminoglycan, extracellular matrix and collagen II. Successful cartilage regeneration was achieved by the use of Gelma/nanoclay/sEVs hydrogel and this finding provided a promising therapeutic strategy for the repair of cartilage defects.
Materials and methods
Cell isolation and culture
Primary articular cartilage chondrocytes were isolated as previously described [Citation25]. Briefly, newborn mice were killed under excessive anaesthesia, the skin and soft tissue were removed by scissors and pincer, then, cartilage tissue was isolated and washed in PBS. After be diced, cartilage tissue was digested overnight in Dulbecco’s modified Eagle’s medium (DMEM)/F12(Corning, USA,10092001) supplemented with 0.2% type II collagenase (Invitrogen, USA,17101015) and 1% P/S at 37°C. The collected chondrocytes were cultured in DMEM/F12 in a thermal incubator under 5% CO2.
hUCMSCs characterization
Flow cytometry analysis
hUCMSCs(Cyagen, USA, HUXUC-01101) were purchased from cyagen biotechnology company. hUC-MSCs were cultured in Ultra culture medium (Lonza, USA, 12–725 F) contained serum analogue UltroserTM G (Life Science, USA, 259509). Then, 1 × 10⁴ cells were incubated with antibodies of PE anti-human CD44(BD, USA,550989), PE anti-human CD151(BD, USA,556057), PE anti-human CD73(BD, USA, 550257), APC anti-human CD133(BD, USA,566596), PE anti-human CD34(BD, USA,560,710) and finally analysed by flow cytometry.
Inducing hUCMSCs chondrogenic, adipogenic and osteogenic differentiation
hUCMSCs were cultured in osteogenic (Cyagen, USA, HUXUC-90021), adipogenic (Cyagen, USA, HUXUC-90031) or chondrogenic differentiation medium (Cyagen, USA, HUXUC-9004) for 14 days, 21 days and 21 days, respectively. Subsequently, the differentiated cells were fixed by 4% paraformaldehyde (PFA) and then identified by Alizarin Red, Oil O Red and Alcian Blue, respectively.
Isolation and identification of sEVs
Isolation of sEVs
hUC-MSCs were cultured in Ultra culture medium (Lonza, USA, 12–725 F) contained with 10% sEVs-free FBS (System Biosciences, USA, 50A-1) for 72 hours. Then, sEVs were purified and collected from the collected conditioned media. According to the published protocol [Citation26], to remove dead cells and cell debris, the supernatants were centrifuged at 300 g for 10 min, 2000 g for 10 min and 10,000 g for 30 min at 4°C. Next, the supernatants were then transferred to a fresh ultracentrifuge tube and centrifuged at the speed of 100,000 g (Beckman Coulter, USA) for 70 min at 4°C. Then, the pellets were resuspended with 1 mL PBS in each tube. sEVs were obtained after be centrifuged at 100,000 g for 70 min and resuspended with cold PBS.
PKH-26 staining assay
PKH-26 kit (Sigma, USA, SLB6089) was used to label sEVs according to the manufacturer’s protocol. Briefly, sEVs were incubated with 500 ul Dilution C solution and 4ul PKH-26 dye solution for 5 min at room temperature in dark environment. Then, 500 ul 1% bovine serum albumin were added to stop the process of staining. The labelled sEVs were obtained after be centrifuged at 100,000 g for 70 min and resuspended with 200 ul cold PBS. The chondrocytes and hBMSCs were incubated with labelled sEVs in 48-well plate for 24 h. Subsequently, the cells were fixed with 4% paraformaldehyde and then stained with DAPI for 5 min. The image was visualized under fluorescence microscopy.
Nanoparticle tracking analysis (NTA)
sEVs particle size and concentration were measured by NTA with Zetaview PMX 110 (Particle Metrix, Meerbusch, Germany) and corresponding software ZetaView 8.04.02. sEVs were pre-diluted by 1× PBS (diluted factor: 1:1000) and then injected into the sample-carrier cell. NTA measurement was recorded and analysed at 11 positions. The ZetaView system was calibrated using 110 nm polystyrene particles. Temperature was maintained at 27.65°C.
Transmission electron microscopy (TEM)
According to the published protocol [Citation27], sEVs were fixed by 2% PFA for 5 min. Then, sEVs suspension solution was loaded on the grid and incubated for 10 min. sEVs were stained with 1% uranyl acetate (UA) solution on the surface of the EM grid for 2 min. Subsequently, the excess UA solution on the grid was removed by filter paper and dried at room temperature. sEVs were observed under TEM (Tecnai G2 spirit BioTWIN).
Western blot analysis
Western blotting was carried out as previously described [Citation10]. The cells were harvested by RIPA and endogenous proteins were isolated from cell lysates, then the protein concentration was measured by BCA protein assay kit. Equivalent amounts of proteins (20,000 ug) were separated on a 10% SDS-PAGE gel and transferred to 0.22 μm polyvinylidene difluoride membranes. The membranes were blocked by 5% fat-free milk and then incubated with primary antibodies overnight at 4°C. After being washed by TBST for 5 min, the membranes were incubated with secondary antibodies for 1 h. The protein bands were visualized with ImmunoStar Western C (LI-COR, USA). The primary antibodies were listed as follows: anti-Akt(CST, USA, 9272, 1:1000), anti-phospho-Akt(CST,USA,9271, 1:1000), anti-PTEN(CST,USA,9559, 1:1000), anti-GAPDH(CST, USA, 2118, 1:1000), anti-β-actin(CST,USA,3700, 1:1000), anti-collagen II(Servicebio, China, GB11021, 1:2000), anti-aggrecan(Proteintech, USA, 13,880-1-Ap, 1:1000) anti-CD63(SBI, USA, EXOAB-CD63A-1, 1:1000), anti-CD81(SBI, USA, EXOAB-CD81A-1, 1:1000), CD9(SBI, USA, EXOAB-CD9A-1, 1:1000).
Luciferase reporter assay and transfection
Transfection was carried out by Lipofectamine 2000 reagent (Invitrogen, USA, 11,668,019) according to the manufacturer’s instruction. Briefly, the luciferase report vectors including pmir-report-pten wt and pmir-report-pten mut were transfected into HEK-293 t cells with miR-23a-3p mimics or the control. After 24 h transfection, the cells were cleaved by passive lysis buffer. Firefly and renilla luciferase activity were measured by Dual-Luciferase Reporter Assay System (Promega, USA).
Antagomir-23a-3p treatment
According to the published protocol [Citation28], chondrocytes and hBMSCs cultured in serum-free medium were treated with 100 nm antagomir-23a-3p or scramblemir (Ctrl) in a thermal incubator under 5% CO2 for 6 h. Then, the supernatant was removed. The cells were further cultured in the complete medium contained serum. The sequences of antagomir-23a-3p and scramblemir are listed in Supplementary Table 2.
Quantitative RT-PCR analysis
Total RNA was extracted from cells using Trizol reagent, RNA (1000 ng) was reverse-transcribed into cDNA using the revert first strand cDNA synthesis kit (Yesen, China). qPCR was performed in 20-ul reaction volumes (10 ul SYBR, 0.8 ul primers, 2ul cDNA, 7.2 ul H2O) using SYBR Premix EX TaqTM II (Yesen, China, 11202ES03) according to the manufacture’s instruction. Glyceraldehyde 3-phosphate dehydrogenase (GAPDH) and the small U6 RNA were the internal reference for mRNA and miRNA, respectively. The primers used in qPCR are shown in Supplementary table 1. The related gene expression was calculated using the 2−ΔΔCT method. Data were presented as mean ± SD of three number of replicates.
Inducing hBMSCs chondrogenesis and histologic analysis
hBMSCs were cultured in the Ultra culture medium (Lonza, USA) contained UltroserTM G serum analogue (Life science, USA). Then, 3 × 10⁵ cell/mL hBMSCs were resuspended and centrifuged at 400 g for 8 min, then cultured in basal medium overnight. The medium was removed and chondrogenic differentiation medium supplied different concentrations of sEVs (5 and 10 × 108 particles/mL) was added and refreshed every 2 days. At 21 days, the microspheres were washed by phosphate buffer solution (PBS), and then fixed using 4% paraformaldehyde (PFA). After washed by PBS, the microspheres were treated with 30% sucrose solution overnight and embedded in medium (Leica, Germany) for frozen tissue specimens. For histologic analysis, 6-um sections were stained by Alcian blue for proteoglycans and were visualized under microscopy.
Chondrocytes differentiation assay
Primary chondrocytes were collected and cultured in the form of micromass as previously described [Citation29,Citation30]. In brief, the cell droplets (25 ul) counted in 2.5 × 10⁴ cells were carefully seeded in 24-well plate and incubated for 2 h. Then, the complete chondrogenic medium (DMEM/F12 supplied ITS, 100 nM dexamethasone, 50ug/mL ascorbate, 10 ng/mL TGF-β3, 40ug/mL proline, 1 mM sodium pyruvate) contained sEVs were added and refreshed every 2 days. At 7 days, the micromass was fixed and stained by Alcian blue. Alcian blue activity was analysed by Image J. Proteoglycans were visualized clearly under microscopy. Data were presented as mean ± SD of three number of replicates.
Transwell migration assay
To investigate the effect of sEVs on migration of hBMSCs and chondrocytes, transwell migration assay was performed as previously described [Citation31]. Briefly, 10 × 104 cells cultured in serum-free medium were added to the upper chamber in transwell system (BD falcon, USA) and migrated for 8 h. The cells on the upper chamber were removed and the remaining cells on the undersurface of the transwell were fixed using 4% PFA. After be stained using 0.2% crystal violet, the migrated cells were visualized under the microscopy. Data were presented as mean ± SD of three number of replicates.
Cell proliferation assay
The proliferation of hBMSCs and chondrocytes stimulated by sEVs was measured by cell counting kit-8 (CCK-8, Dojindo, Japan). Briefly, 5000 cells were incubated in the 96-well dishes for 24 h. Then, 10 ul CCK8 was added into each well and co-incubated with cells for 3 h. The cell proliferation was evaluated by 450 nm absorbance values using an enzyme-linked immunosorbent assay plate reader. Data were presented as mean ± SD of three number of replicates.
MiRNA microarray
Microarray was used to analyse total RNA extracted from hUC-MSCs-sEVs. Briefly, RNA was extracted using trizol reagent and purified with the RNeasy mini kit (Qiagen, Valencia, CA, USA). Biotinylated cDNA was prepared according to the standard Affymetrix protocol. Following labelling, fragmented cDNA was hybridized for 16 h at 45°C on GeneChip miRNA 4.0 Array (Affymetrix). In addition, GeneChip was washed and stained in the Affymetrix Fluidics Station 450. The data (.cel) were normalized by the software TAC (Transcriptome Analysis Console; Version:4.0.1) with Robust Multichip Analysis (RMA) algorithm using the normalization method of Affymetrix default analysis settings and global scaling. Values were presented as log2 RMA signal intensity.
Preparation and characterization of hydrogels
Preparation of hydrogels and sEVs release analysis
Hydrogels were synthesized as follows: gelma was first dissolved in 0.1 g/mL PBS at 50°C, 0.06 g/mL gelatin or 0.06 g/mL nanoclay was added into the gelma solution, mixed and incubated for 2 h. The sEVs (10 × 108 particles/mL) were added into the mixture and composited hydrogels were obtained after chemical cross-linking by ultraviolet radiation for 3 min. The sEVs released profiles from hydrogels were measured using BCA protein assay kit (Beyotime, China) as previously described [Citation11]. Briefly, the hydrogels were immersed in PBS in 24-well plate. At specific time points, the surface supernatant was collected and fresh PBS was added. The released sEVs were quantified and expressed as the release percentage. Data were presented as mean ± SD of three number of replicates.
Scanning electron microscopy (SEM)
SEM was used to observe the reticular porous structure of the composited hydrogels. Different compositions of gel samples were immersed into 2 mL PBS and incubated at 37°C for 24 h to obtain equilibrium swelling. The hydrogels were freeze-dried and were then cut into pieces in a longitudinal direction. The specimens were sputter-coated with gold for 30 s and directly visualized using SEM.
Swelling ratio and mechanical properties assay
The photo-crosslinked (365 nm UV radiation for 2 min) cylindrical samples were soaked in PBS and incubated for 24 h [Citation32]. After removing the surface water, the swelling samples were weighted at different time points. The formula below was used to calculate the swelling ratios of the hydrogels:
was the dry weight of the hydrogel, and
was the swollen weight of the hydrogels. Mechanical properties of the hydrogels were examined by compression testing (Zwick Z050) in a press mode. Photo-crosslinked cylinder hydrogels (5 mm height; 10 mm diameter; n = 4) were placed in the lower plate at a speed of 1 mm/min. The compressive force was recorded until hydrogels were deformed by upper plate [Citation33].
Rheological properties and degradation behaviours assay
A rheometer (Kinexus ultra+) equipped with a plate with a diameter of 25 mm, and a gap distance of 1 mm was used to measure the Rheological properties of the composite ink. To measure the viscosity, these inks were loaded with steady rate sweeps within a shear rate range of 0.1 to 1000 s−1. To evaluate the degradation behaviours of hydrogels, the samples (5 mm height; 10 mm diameter; n = 3) were soaked in PBS at 37°C. At given time points (day 1, 2, 3, 4, 5, 6, 7, 10, 14), after removing the surface supernatant, the weight of hydrogels was measured. The following formula was used to calculate the degradation ratios of hydrogels:
where was the initial weight of the sample, and
was the weight of the sample at a specific time point.
Biocompatibility and cytotoxicity assay
To evaluate the biocompatibility and cytotoxicity of the hydrogels, 1 × 10⁴ cells/mL hBMSCs were seeded on three different hydrogels sterilized with ultraviolet light in 48-well culture plates. The cytotoxicity of the hydrogels was examined by the viability of hBMSCs using CCK-8 after incubating for 1st, 3rd and 7th days. Data were presented as mean ± SD of three number of replicates.
Animal experiment
Animal experiments were reviewed and approved by the ethical review committee of Changhai Hospital, the Second Military Medical University. All surgical procedures were performed under sterile environment. Twenty-four male Sprague-Dawley rats (8 weeks old) were anaesthetized by injecting 4% chloral hydrate (1 mL/100 g), shaved, and disinfected. The knee joint was exposed by slitting the skin and muscle. Subsequently, a full thickness cylindrical cartilage defects (2 mm in diameter and 1.5 mm in depth) were created by electrical drill. Twenty-four rats were randomly divided into four groups including (1) control; (2) Gelma/nanoclay (Gel-nano); (3) Gelma/nanoclay/sEVs (Gel-nano-sEVs) (10 × 108 particles/mL); (4) sham. For group 1,2,3, the cartilage defects were created and the specimens were implanted directly into defects. All rats were sacrificed 12 weeks after surgery by injecting excessive 4% chloral hydrate and the samples collected.
Histology and immunohistochemical analysis
The knee joint samples were fixed in 4% paraformaldehyde for 24 h and decalcified in EDTA. The specimens were embedded in paraffin after dehydration in a gradient alcohol. The embedded specimens were cut into 6 μm thick sections which were analysed by Safranin-O & fast green-stained, haematoxylin and eosin (H&E) staining, immunohistochemical staining. Immunohistochemical staining was carried out as previously described [Citation34]. The sections were treated with sodium citrate solution to epitope retrieval and then incubated with a primary antibody like collagen II (Abcam, USA) overnight at 4°C. Subsequently, the samples were incubated with a second antibody and then stained with haematoxylin. The sections were clearly observed under the microscope.
Statistical analysis
The results are presented as mean ± standard deviation (SD). For comparison of two groups, the unpaired Student’s t-test was used. One-way analysis of variance (ANOVA) was used for the comparison of multiple groups. Differences were considered statistically significant when P < 0.05.
Scheme 1. Schematic illustration of therapeutic sEVs released from Gelma/nanoclay hydrogel for cartilage regeneration. (a) Preparation of Gelma/nanoclay/sEVs hydrogel and cartilage defect implantation. (b) Sustained release of sEVs with the degradation of hydrogel. (c) Internalization of therapeutic sEVs by chondrocytes and hBMSCs. (d) The effect of sEVs on chondrocytes and hBMSCs. (e) Regeneration of cartilage defect by the composited hydrogel.
Results
Identification of hUC-MSCs and hUC-MSCs-sEVs
hUC-MSCs morphology observed under the microscope revealed a spindle-like shape ()). To evaluate the muti-lineage differentiation potential of hUC-MSCs, they were induced to chondrogenic, adipogenic, osteogenic cells when cultured in chondrogenic, adipogenic, osteogenic induction medium, respectively. The images from Alcian blue, Oil Red O, Alizarin Red staining () indicated that hUC-MSCs showed muti-lineage differentiation. Moreover, we measured the surface marker of hUC-MSCs such as CD44, CD73, CD151, CD34, CD133 by flow cytometer assay ()). The analysis data confirmed that hUC-MSCs were consistent with the criteria for identifying stem cells. Furthermore, we successfully isolated sEVs from hUC-MSCs and identified the characteristics using various experiments (). hUC-MSCs-sEVs exhibited a spherical microvesicle structure observed under the TEM, whose diameters were approximately from 50 to 150 nm ()). Data from NTA demonstrated that the average diameters of the microvesicles were about 142.9 nm, while the percentage of the vesicles with diameters 30–150 nm was 99.2% and the concentration was 8.2 × 10⁶ particles/mL ()). In addition, western blot analysis revealed that the exosomal surface marker CD81, CD63, CD9 expressed on sEVs rather than hUC-MSCs ()). In general, all these results confirmed sEVs were successfully isolated from hUC-MSCs.
Figure 1. Identification of hUC-MSCs and hUC-MSCs-sEVs. (a) Representative images showing the spindle-like morphology of hUC-MSCs. Scale bar: 100 um. (b) Characteristic surface markers of hUC-MSCs evaluated by flow cytometry. The blue curves represent isotype controls and the red curves represent the surface markers. (c) Morphology of hUC-MSCs-sEVs visualized under transmission electron microscopy (TEM). Scale bar: 200 nm. (d) Particle size distribution of hUC-MSCs-sEVs measured using nanoparticle tracking analysis. (e) Surface markers of hUC-MSCs-sEVs quantified by western blotting.
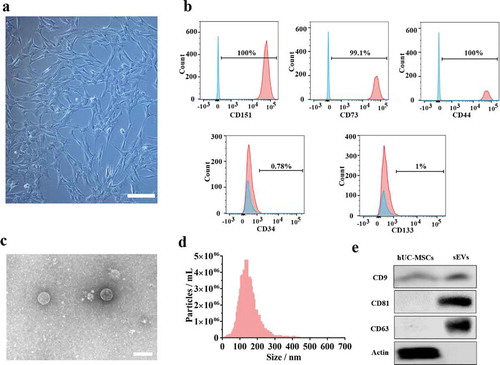
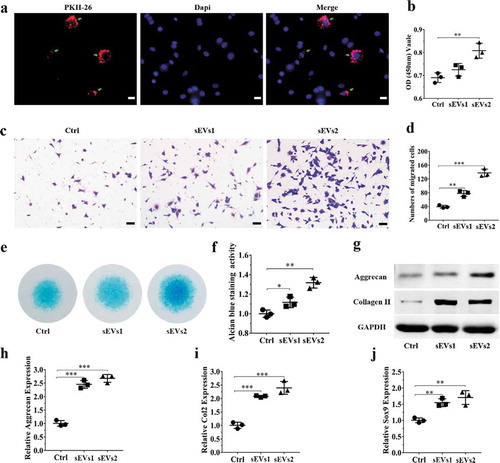
Figure 2. hUC-MSCs-sEVs promoted the migration, proliferation and differentiation of chondrocytes. (a) Representative fluorescence micrograph of PKH-26 (red)-labelled sEVs internalized by primary chondrocytes. The labelled sEVs were co-incubated with chondrocytes for 24 h. Scale bar:20um. (b) Effect of hUC-MSCs-sEVs on viability of chondrocytes. CCK-8 values were measured at 24 h after co-incubation **P < 0.01. (c) Representative images showing the transwell migration assay of chondrocytes treated with sEVs for 8 h. Scale bar: 50 um. (d) Quantitative analysis of the migrated chondrocytes cultured in different concentrations of sEVs. **P < 0.01, ***P < 0.001. (e) Alcian blue staining of chondrocytes treated with sEVs for 7 days. (f) Quantitative analysis of alcian blue staining. (g) The protein levels of aggrecan and collagen II in chondrocytes were analysed by western blotting. (h), (i) and (j) RNA expression levels of Aggrecan, Col2, Sox9 were measured by qPCR. **P < 0.01, ***P < 0.001. For viability assay, transwell migration assay and qPCR, group control, sEVs1 and sEVs2 indicated 0, 5 and 10 × 108 particles/mL sEVs, respectively. Data were presented as mean ± SD of three number of replicates. t-test was applied to each group in order to compare mean beta values.
hUC-MSCs-sEVs significantly promoted the migration, proliferation and differentiation of chondrocytes
To investigate the role of hUC-MSCs-sEVs on chondrocytes, we utilized PKH-26 to label hUC-MSCs-sEVs. The labelled sEVs were co-incubated with chondrocytes for 24 h. The fluorescence microgragh ()) showed that PKH-26-labelled sEVs (red fluorescence) were gradually internalized by chondrocytes (the nuclei were stained with blue fluorescence by DAPI). We next sought to evaluate whether hUC-MSCs-sEVs may affect viability of chondrocytes. Different concentrations of sEVs (sEVs1 and sEVs2 indicated that 5 × 10⁸ and 10 × 108 particles/mL sEVs, respectively) were added to co-incubate with chondrocytes for 24 h. CCK-8 assay was performed to evaluate cell viability. As showed in ), hUC-MSCs-sEVs treatment resulted in increased chondrocytes viability and 10 × 108 particles/mL hUC-MSCs-sEVs significantly promoted cells proliferation compared to the control group. Moreover, the migration ability of chondrocytes treated with different concentrations of hUC-MSCs-sEVs was evaluated by transwell migration assay. As shown in , d), compared to the control group, the numbers of migrated cells stimulated with sEVs was significantly increased, and chondrocytes stimulated with 10 × 108 particles/mL sEVs possessed highest migration ability than other groups. Subsequently, to confirm the role of sEVs on chondrogenic differentiation, chondrocytes were cultured in chondrogenic induction differentiation medium contained hUC-MSCs-sEVs. After chondrogenic stimulation for 7 days, alcian blue staining and activity were significantly increased in hUC-MSCs-sEVs treatment and the chondrogenic rate in sEVs2 group (10 × 108 particles/mL) was distinctly higher than other groups (). Consistently, stimulation with sEVs upregulated the mRNA expression levels of chondrogenesis-related genes such as Sox9, Col2, Aggrecan. Compared to the control and sEVs1 (5 × 10⁸ particles/mL) group, sEVs2 (10 × 108 particles/mL) group displayed higher upregulation of the chondrogenesis-related genes ()). Moreover, sEVs treatment upregulated the protein expression of aggrecan and collagen II ()), indicating hUC-MSCs-sEVs (10 × 108 particles/mL) were more conducive to the formation of glycosaminoglycan and the deposition of collagen II.
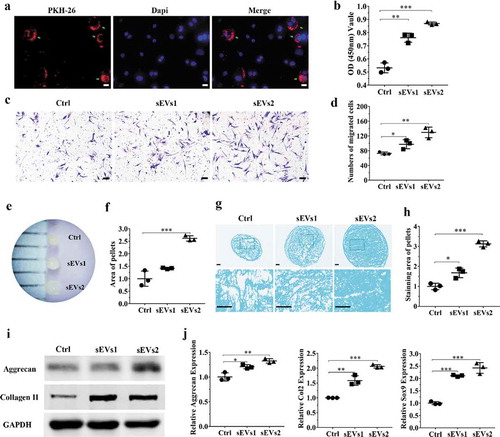
Figure 3. hUC-MSCs-sEVs promoted the migration, proliferation and differentiation of hBMSCs. (a) Representative fluorescence micrograph of PKH-26 (red)-labelled hUC-MSCs-sEVs internalized by hBMSCs. The labelled sEVs were co-incubated with hBMSCs for 24 h. Scale bar: 20 um. (b) Effect of hUC-MSCs-sEVs on viability of hBMSCs. CCK-8 values was measured at 24 h after co-incubation. **P < 0.01, ***P < 0.001. (c) Representative images of transwell migration assay of hBMSCs treated with sEVs for 8 h. Scale bar: 50um. (d) Quantitative analysis of the migrated hBMSCs cultured in different concentrations of sEVs. *P < 0.05, **P < 0.01. (e) and (f) Representative micrograph of hBMSCs microspheres and the statistical results. The cell microspheres with sEVs treatment for 21 days. (g) Alcian blue stained sections of hBMSCs microspheres. (h) Quantitative analysis of alcian blue stained sections of hBMSCs microspheres. (i) The protein levels of aggrecan and collagen II in hBMSCs were analysed by western blotting. (j) Gene expression levels of Aggrecan, Col2 and Sox9 were measured by qPCR, the statistical results analysis was also showed. *P < 0.05, **P < 0.01, ***P < 0.001. For viability assay, transwell migration assay, and qPCR, group Ctrl, sEVs1 and sEVs2 indicated 0, 5 and 10 × 108 particles/mL sEVs, respectively, and data were presented as mean ± SD of three number of replicates. t-test was applied to each group in order to compare mean beta values.
hUC-MSCs-sEVs significantly promoted the migration, proliferation and differentiation of hBMSCs
Firstly, to validate the role of hUC-MSCs-sEVs on hBMSCs, PKH-26 was used to label sEVs. As shown in ), sEVs were undergo uptake by hBMSCs and evenly distributed around the nuclei, indicating that hUC-MSCs-sEVs could be gradually internalized by hBMSCs and further may affect the viability, migration differentiation potential of hBMSCs. Subsequently, CCK-8 assay was used to evaluate the viability of hBMSCs with sEVs treatment. The results demonstrated different concentrations of sEVs (sEVs1 and sEVs2 represented 5 × 10⁸ and 10 × 108 particles/mL, respectively) significantly enhanced the proliferation potential of hBMSCs, while sEVs2 show the major effect on viability of hBMSCs ()). The migration ability of hBMSCs treated with different concentrations of hUC-MSCs-sEVs was evaluated by transwell migration assay. As shown in ), the number of migrated cells stimulated with sEVs (sEVs1 and sEVs2) was significantly increased compared to the control group, while sEVs2 group shows major effect on the migration.
Additionally, we sought to confirm differentiation ability of hBMSCs with sEVs treatment. After 21 days of chondrogenesis, the cell microspheres with sEVs treatment (10 × 108 particles/mL) were significantly bigger than other two groups ()). Then Alcian blue staining was used to detect the deposition of glycosaminoglycan (GAG). The micrograph ()) showed the chondrogenic activity with sEVs treatment (10 × 108 particles/mL) was obviously stronger than other two groups, indicating that GAG was prominently enhanced by treatment with sEVs, which were conducive to hBMSCs chondrogenic differentiation. Consistently, stimulation with sEVs upregulated the mRNA expression levels of chondrogenesis-related genes such as Aggrecan, Col2 and Sox9 ()). Moreover, sEVs treatment upregulated the protein expression of aggrecan and collagen II ()), indicating hUC-MSCs-sEVs were conducive to the formation of glycosaminoglycan and the deposition of collagen II.
Figure 4. hUC-MSCs-sEVs activated the PTEN/AKT signalling pathway by delivering miR-23a-3p. (a) Normalized miRNA expression levels measured by miRNA microarray. (b) Normalized chondrogenesis-related miRNA expression levels and gene expression level of miR-23a-3p. (c) The potential target sequences of miR-23a-3p were predicted by bioinformatic analysis. (d) 293 T cells were transfected with luciferase reporter plasmids WT or MUT 3ʹ-UTR of PTEN and miR-23a-3p, luciferase activity was detected by Dual-Luciferase Reporter Assay System. Data were presented as mean ± SD of three number of replicates. **P < 0.01. (e) Chondrocytes were transfected miR-23a-3p for 24 h, then the expression of miR-23a-3p in chondrocytes was measured by qPCR. Data were presented as mean ± SD of three number of replicates. t-test was applied to each group in order to compare mean beta values. ***P < 0.001. (f) The protein levels of AKT, P-AKT, PTEN in chondrocytes were quantified using western blotting.
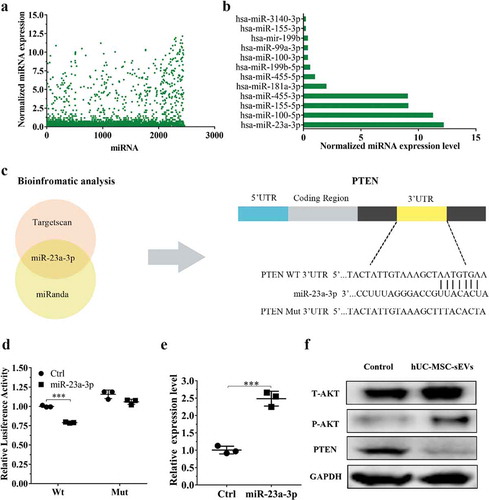
hUC-MSCs-sEVs activated the PTEN/AKT signalling pathway through delivering miR-23a-3p
MiRNAs, one of the crucial constituents in exosomes play prominent roles in regulating gene expression and biological function by binding 3ʹUTR or amino acid coding sequences of target gene [Citation19,Citation35]. We firstly used miRNA microarray to detect the miRNA expression levels of hUC-MSCs-sEVs. The results showed that there were various kinds of miRNA contained in sEVs ()), among which the ones related to chondrogenesis are listed in ). Among these various miRNAs, miR-23a-3p was the most highly expressed, indicating hUC-MSCs-sEVs may perform their biological function through delivering miR-23a-3p. Subsequently, we predicted the potential target gene of miR-23a-3p using targetscan and miranda database. Among the predicted target genes, PTEN have been reported to relate to cartilage metabolism [Citation36]. Bioinformatic analysis showed miR-23a-3p could bind the 3ʹUTR of PTEN ()). To experimentally confirm whether miR-23a-3p directly targeted PTEN, luciferase reporter constructs containing the predicted 3ʹUTR of PTEN (WT-psicheck2-PTEN) and mutated 3ʹUTR of PTEN(MUT-psicheck2-PTEN) were cloned and transfected into 293 T cells. When transfected cells were incubated with miR-23a-3p, the luciferase activity was decreased, and the response was abolished by mutating the target sites in the 3ʹUTR of PTEN ()). These results confirmed that PTEN was the direct target gene of miR-23a-3p and could be suppressed by miR-23a-3p.
To further investigate whether hUC-MSCs-sEVs could activate downstream signalling pathways through delivering miR-23a-3p, chondrocytes and hBMSCs were treated with sEVs. qPCR results revealed that the expression of miR-23a-3p with sEVs treatment was significantly enhanced compared to cells in the absence of sEVs () and ). Moreover, we examined the related protein of PTEN/AKT signalling pathway including total AKT (T-AKT), AKT phosphorylation(P-AKT) and PTEN. Western blotting revealed that the level of T-AKT, P-AKT in chondrocytes and hBMSCs were increased in the presence of sEVs, whereas the level of PTEN was decreased () and ). Collectively, all these results demonstrated that hUC-MSCs-sEVs could deliver miR-23a-3p into chondrocytes and hBMSCs. The increased miR-23a-3p in cells bound the 3ʹUTR of PTEN and inhibited the expression of PTEN. The inhibitory PTEN signal further resulted in up-regulation of AKT and the corresponding downstream signal pathway.
Figure 5. miR-23a-3p silencing attenuated the effect of hUC-MSCs-sEVs in chondrocytes. (a) Chondrocytes treated with antagomir-23a-3p or scramblemir (Ctrl) for 6 h, and the expression of miR-23a-3p was measured by qPCR. The results of statistical of three independent replicates are shown. ***P < 0.001. (b) Viability of chondrocytes treated with antagomir-23a-3p and hUC-MSCs-sEVs. Group ant-mir-23a represented the treatment of antagomir-23a-3p and hUC-MSCs-sEVs (10 × 108 particles/mL), Group Ctrl and sEVs2 represented scramblemir and 10 × 108 particles/mL hUC-MSCs-sEVs, respectively. Data were presented as mean ± SD of three number of replicates. **P < 0.01 (c) Representative images of transwell migration assay of chondrocytes. Scale bar: 50um. Group ant-mir-23a represented the treatment of antagomir-23a-3p and hUC-MSCs-sEVs (10 × 108 particles/mL), Group Ctrl and sEVs2 represented scramblemir and 10 × 108 particles/mL hUC-MSCs-sEVs, respectively. (d) Quantitative analysis of the migrated chondrocytes. **P < 0.01. Data were presented as mean ± SD of three number of replicates (e) Alcian blue staining of chondrocytes. (f) RNA expression levels of Sox9, Col2, Aggrecan were measured by qPCR. *P < 0.05. Data were presented as mean ± SD of three number of replicates. *P < 0.05.(g) The protein levels of AKT, P-AKT, PTEN in chondrocytes were analysed by western blotting.
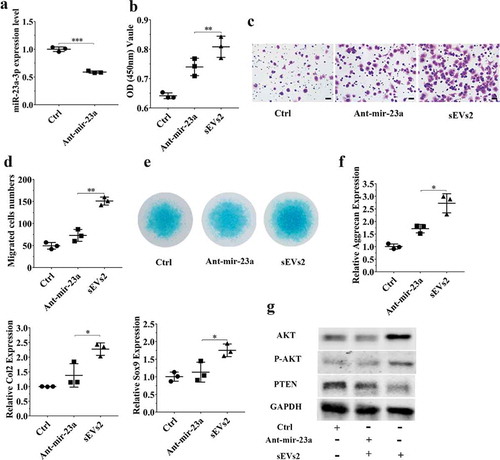
Figure 6. miR-23a-3p silencing attenuated the effect of hUC-MSCs-sEVs in hBMSCs. (a) hBMSCs treated with antagomir-23a-3p or scramblemir (Ctrl) for 6 h, and the expression of miR-23a-3p was measured by qPCR. The results of statistical of three independent replicates are shown. ***P < 0.001. (b) Viability of hBMSCs treated with antagomir-23a-3p and hUC-MSCs-sEVs. Group ant-mir-23a represented the treatment of antagomir-23a-3p and hUC-MSCs-sEVs (10 × 108 particles/mL), Group Ctrl and sEVs2 represented scramblemir and 10 × 108 particles/mL hUC-MSCs-sEVs. Data were presented as mean ± SD of three number of replicates. **P < 0.01 (c) Representative images of transwell migration assay of hBMSCs. Scale bar: 50um. Group ant-mir-23a represented the treatment of antagomir-23a-3p and hUC-MSCs-sEVs (10 × 108 particles/mL), Group Ctrl and sEVs2 represented scramblemir and 10 × 108 particles/mL hUC-MSCs-sEVs. (d) Quantitative analysis of the migrated hBMSCs. **P < 0.01. Data were presented as mean ± SD of three number of replicates (e) Alcian blue staining of hBMSCs. Group ant-mir-23a represented the treatment of antagomir-23a-3p and hUC-MSCs-sEVs (10 × 108 particles/mL), Group Ctrl and sEVs2 represented scramblemir and 10 × 108 particles/mL hUC-MSCs-sEVs. (f) RNA expression levels of Sox9, Col2, Aggrecan were measured by qPCR. *P < 0.05. Data were presented as mean ± SD of three number of replicates. *P < 0.05. (g) The protein levels of AKT, P-AKT, PTEN in hBMSCs were analysed by western blotting.
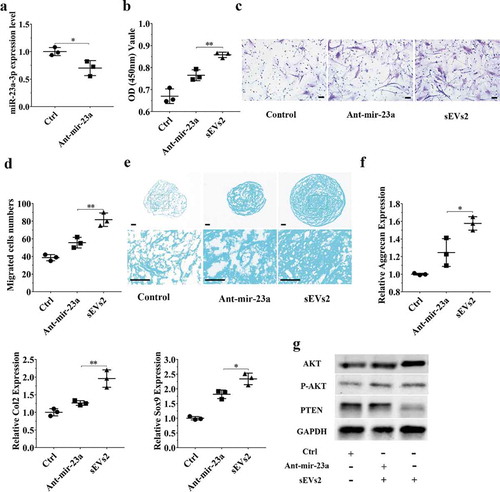
miR-23a-3p silencing attenuated the therapeutic effect of hUC-MSCs-sEVs on cartilage defect in vitro
To further investigate whether miR-23a-3p was important and involved in hUC-MSCs-sEVs-mediated cartilage regeneration in vitro, we used antagomir-23a-3p to silence miR-23a-3p expression. As shown in ) and ), the expression of miR-23a-3p was decreased in chondrocytes and hBMSCs when treated with antagomir-23a-3p for 6 h. We next sought to evaluate whether antagomir-23a-3p may affect the proliferation, migration and differentiation mediated by hUC-MSCs- sEVs in chondrocytes and hBMSCs. Antagomir-23a-3p administration significantly attenuated the proliferation of cells as evaluated by CCK-8 assays, when compared to sEVs2 administration (10 × 108 particles/mL) (), )). As shown in ) and ), the number of migrated cells treated with antagomir-23a-3p was significantly decreased compared to sEVs2 group (10 × 108 particles/mL), indicating that antagomir-23a-3p may impair the favourable migration effect mediated by hUC-MSCs-sEVs in chondrocytes and hBMSCs. Additionally, alcian blue staining and qPCR were performed to measure the effect of antagomir-23a-3p on differentiation of cells. As showed in ) and ), antagomir-23a-3p attenuated the differentiation effect mediated by hUC-MSCs-sEVs. Moreover, the chondrogenesis-related genes such as Aggrecan, Col2 and Sox9 were significantly decreased on antagomir-23a-3p group, when compared to sEVs2 group. Subsequently, to investigate whether miR-23a-3p silence may affect downstream signalling pathways. Western blotting revealed that the level of T-AKT, P-AKT in chondrocytes and hBMSCs were decreased in the presence of antagomir-23a-3p, whereas the level of PTEN was increased, indicating that antagomir-23a-3p impaired the activation of AKT signalling pathway that mediated by hUC-MSCs-sEVs (), )). In summary, above results demonstrated that miR-23a-3p silencing attenuated the therapeutic effect of hUC-MSCs-sEVs on cartilage defect in vitro.
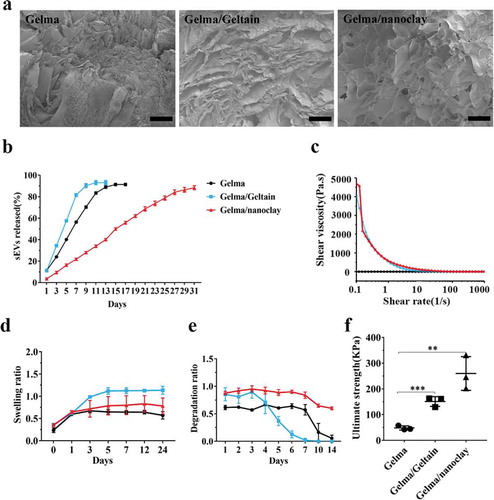
Figure 7. Characterization of Gelma hydrogel, Gelma/Geltain hydrogel and Gelma/nanoclay hydrogel. (a) Scanning electron micrographs of Gelma, Gelma/Geltain and Gelma/nanoclay hydrogels. Scale bars, 200 μm. (b) Profile of sEVs released from the hydrogels. (c) Rheological properties of the hydrogels. (d) Swelling ratio of the hydrogels in PBS (pH 7.2) at 37°C. (e) Degradation ratio and mechanical properties (f) the hydrogels. For mechanical properties analysis, data were presented as mean ± SD of three number of replicates. t-test was applied to each group in order to compare mean beta values. ***P < 0.001.
Characterization of Gelma hydrogel, Gelma/Geltain hydrogel and Gelma/nanoclay hydrogel
SEM images ()) showed the reticular porous structure of the hydrogels. The Gelma/Geltain hydrogel had larger pores than Gelma hydrogel and the reason for this was gelatin gradually dissolved out from scaffolds when the hydrogel was placed above the gelatin temperature of 37°C. The lyophilized Gelma/nanoclay sample revealed more porous than other two groups, and the proper porous pore size (100–200 nm) was beneficial to cell proliferation and nutrients transferring [Citation37,Citation38]. The release behaviour of sEVs loaded in hydrogels is shown in ) and Supplementary Figure 5(a, b). sEVs were released in a sustained manner when encapsulated into the Gelma/nanoclay hydrogels. Moreover, sEVs released from Gelma/nanoclay/sEVs hydrogels exhibited a spherical microvesicle structure (Supplementary Figure 5(c)), indicating that the sEVs from Gelma/nanoclay/sEVs hydrogels kept normal morphology and did not damage by hydrogel.
Apart from the pure Gelma ink, the other solutions revealed shear-thinning behaviour with increased shear rate as they are non-Newtonian fluids ()). The pure Gelma ink viscosity was much lower than that of Gelma/nanoclay or Gelma/Gelatin. Therefore, the ink was easily extruded from the syringe based on the shear-thinning property to form stable hydrogel.
The swelling behaviour of various combinations of hydrogels is presented in ). There was an increase of the swelling ratio during the first 5 h in three groups. Gelma/nanoclay hydrogel had the lowest ratio than Gelma, Gelma/Geltain group, which may be explained by undissolved nanoclay in the Gelma network, leading to the chain entanglements.
) shows the degradation ratio of the different samples during an incubation of 2 weeks. Gelma and Gelma/Gelatin hydrogels degraded rapidly when maintained at physiological temperatures, limiting their in vivo application. However, the addition of nanoclay obviously prolonged the degradation resistance of Gelma hydrogel, which ensured sustained released and therapeutic effect of sEVs. Certainly, the degradation ratio could be controlled by changing the crosslink time, solvent concentration and composite. As showed in Supplementary Figure 2, the number of hBMSCs cultured in the three samples enhanced during the process of culture, demonstrating that the hydrogels had good biocompatibility and no cytotoxicity.
The hydrogel with good mechanical strength is promising for cartilage tissue engineering. As shown in ), the Gelma/nanoclay hydrogel showed the highest ultimate strength than other two groups. The ultimate strength increased significantly from 48.2 ± 8.1 kPa to 259.8 ± 35.6 kPa with addition of nanoclay. For the Gelma group, the entry of water molecule makes the cross-linked gelma form a loose network structure, resulting in the decrease in the ultimate strength. For the Gelma/nanoclay group, through an intensive electrostatic interaction between Gelma of positive sides and nanoclay negatively charged sides, resulting in the improved mechanical properties.
Figure 8. Histological evaluation of cartilage defect repaired by Gel-nano-sEVs hydrogel. (a) Macroscopic observation of cartilage defect at 12 weeks postsurgery. (b) ICRS macroscopic scores of different groups. Data were presented as mean ± SD of three number of replicates. t-test was applied to each group in order to compare mean beta values. n = 6, ***P < 0.001. (c) Safranin O/fast green staining of repaired cartilage. Scale bar = 250 um. (d) HE staining of repaired cartilage. Scale bar = 250 um. (e) Immunohistochemical staining of collagen II. Scale bar = 125 um. (f) Quantitative analysis of immunohistochemical staining of collagen II. (g) ICRS visual histological scores of different groups. Data were presented as mean ± SD of three number of replicates. t-test was applied to each group in order to compare mean beta values. n = 6, ***P < 0.001.
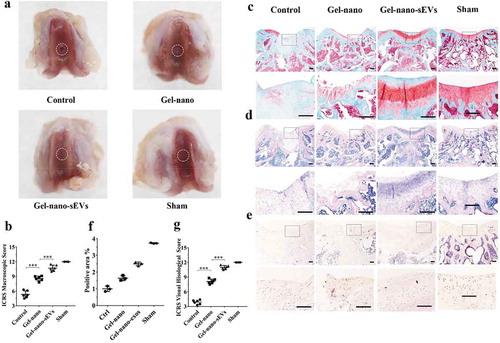
Histological evaluation of cartilage defect repaired by Gel-nano-sEVs hydrogel
To optimize in vivo application and achieve sustained release of sEVs, we fabricated Gel-nano hydrogel contained sEVs (10 × 108 particles/mL) for local administration in cartilage defects.
Gross macroscopic evaluation ()) of the samples at 12 weeks postsurgery was carried out to assess the efficacy of hUC-MSCs-sEVs on cartilage regeneration. The regions of the drilled defects were rarely covered by regenerated neotissue in the control group, and the boundary between the regenerated neotissue and the surrounding original cartilage was still distinct. The regions of the defects partially covered by regenerated neotissue in Gelma/nanoclay hydrogel group (Gel-nano group) and the interface between regenerated neotissue and the surrounding normal cartilage was rarely distinct, whereas the newly formed tissues had rough surface. The Gelma/nanoclay/sEVs hydrogel group (Gel-nano-sEVs group) exhibited intact and smooth regenerated neotissue, which were well integrated with the surrounding original cartilage and similar to the normal cartilage in the sham group. Consistently, according to International Cartilage Repair Score (ICRS) standard [Citation39], the Gel-nano-sEVs group showed higher ICRS macroscopic scores (10.7 ± 1.5) than the control (5.3 ± 1.8), Gel-nano (8.6 ± 1.3) group and was similar to the sham group (12) ()).
As for the histological evaluation, Safranin O/fast green and HE staining were performed to assess the regeneration of the newly formed cartilage ()). Cartilage defects in the control group were the most severe among all groups. Few of the regenerated cartilage tissues which were red staining by Safranin O/fast green staining were observed. The boundary between regenerated neotissue and the surrounding natural cartilage was distinct in the control group. In the Gel-nano group, the regenerated neotissue was partially filled with the drilled defects and the red stained tissues showed irregular and rough surface. The regenerated cartilage in Gel-nano-sEVs group revealed intense red staining by Safranin O/fast green staining, which was similar to the natural cartilage in the sham group. However, the interface between regenerated neotissue and the surrounding normal cartilage was rarely distinct. Similarly, ICRS histological scores analysis ()) revealed that Gel-nano-sEVs group had higher scores (11.2 ± 0.7) than the scores of the control group (3.83 ± 0.7) and the Gel-nano group (8.4 ± 1.2) and was similar to the sham group. In addition, significant difference was found in the scores between the Gel-nano-sEVs group and control group, and the scores of the Gel-nano group were significantly higher than the control group, indicating hUC-MSCs-sEVs possessed favourable stimulatory effect for cartilage regeneration.
The immunohistochemical staining was carried out to evaluate the expression of type II collagen in the newly formed tissues ()). Similar to the natural cartilage in the sham group, the expression of collagen II in the Gel-nano-sEVs group was increased compared to the control group and the Gel-nano group. The stained area was strongly positive for collagen II, indicating hUC-MSCs-sEVs contributed to the generation of collagen II and the extracellular matrix ()).
Figure 9. Underlying mechanism of hUC-MSCs-sEVs on cartilage regeneration.
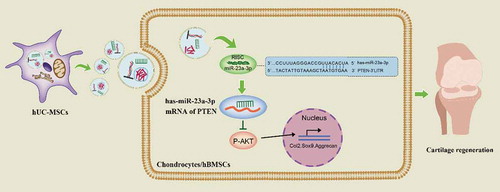
The related underlying mechanism of hUC-MSCs-sEVs in cartilage regeneration
As shown in , hUC-MSCs secreted large quantities of sEVs contained abundant proteins, mRNA and miRNAs. In addition, there were notably high levels of miR-23a-3p. Then, hUC-MSCs-sEVs were uptaked by chondrocytes or hBMSCs. The increased miR-23a-3p in cells specially targeted the 3ʹUTR of PTEN by RNA-induced silencing complex (RISC) and suppressed the level of PTEN. The inhibitory PTEN signal further resulted in up-regulation of P-AKT and activation of PTEN/AKT signal pathway, resulting in glycosaminoglycan formation, extracellular matrix synthesis and collagen II deposition. As the painless collection process of hUC-MSCs and the favourable chondrogenesis effect of hUC-MSCs-sEVs, our finding may provide a novel promising therapy for cartilage regeneration.
Discussion
It is difficult to completely regenerate cartilage for its limited self-regenerative capacity. Currently, various treatments for cartilage defect have been reported [Citation40]. However, these treatments were difficult to regenerate natural cartilage and this further limited their clinical application. Herein, we isolated sEVs from hUC-MSCs and found that hUC-MSCs-sEVs effectively enhanced the migration, proliferation and differentiation of chondrocytes and hBMSCs via delivering miR-23a-3p. In addition, we fabricated an injectable, favourable biomechanical property, UV-shielding Gel-nano hydrogel to load therapeutic sEVs to ensure their sustained release. In vivo results showed that hUC-MSCs-sEVs effectively promoted cartilage regeneration.
hUC-MSCs are suitable for cartilage regeneration due to their desirable biological properties such as abundant tissue source, great expansion capability and painless collection process [Citation9]. Previous studies demonstrated the positive effect of hUC-MSCs on cartilage regeneration [Citation41]. Compared to MSCs, sEVs are important bioactive extracellular vesicles with potential application in MSC-based tissue-engineering therapies due to their high stability, easy to obtain and rich sources [Citation11,Citation12]. Notably, the therapeutic efficacy of MSCs on cartilage regeneration can be replicated by the MSCs-derived exosomes [Citation10]. hUC-MSCs-sEVs are naturally produced biological carrier with a similar function to parent cells [Citation42]. Li et al. reported that hUC-MSCs-sEVs mediated miR-181c attenuate burn-induced inflammation [Citation43]. Nevertheless, the role of hUC-MSCs-sEVs in cartilage regeneration remains ambiguous and the specific mechanism remains to be researched. Articular cartilage is composed of chondrocytes and extracellular matrix, the main components of which are glycosaminoglycan. In this study, we revealed hUC-MSCs-sEVs could be successfully internalized by chondrocytes and further promoted the migration, proliferation and differentiation of chondrocytes, resulting in glycosaminoglycan formation, extracellular matrix synthesis and collagen II deposition. Previous studies reported that the interaction of articular chondrocytes and BMSCs was advantageous to maintain the phenotypes of articular chondrocytes [Citation8,Citation44], which was conducive to the synthesis of hyaline cartilage. Herein, we found that hUC-MSCs-sEVs enhanced the migration, proliferation and chondrogenic differentiation of hBMSCs. Meanwhile, hBMSCs may secrete a good deal of cytokines and growth factors, contributing to the proliferation and re-differentiation of chondrocytes [Citation45].
Exosomes released from derived cells transferred bioactive agents such as proteins, mRNA and miRNA to mediate cell-to-cell communication and regulate recipient cells function [Citation46,Citation47]. MiRNAs played an essential regulatory role in metabolic homoeostasis by binding 3ʹUTR of mRNA, resulting in degradation or translation repression of the target [Citation48]. Several exosomal miRNAs have been reported to regulate chondrocytes functions [Citation10,Citation13,Citation30], suggesting that exosome-mediated transferring miRNA elicited great potential in cartilage-related disease therapy. To further investigate the underlying mechanism of sEVs, miRNAs expression level in hUC-MSCs-sEVs was investigated via miRNA microarray. The result showed that miR-23a-3p was the most highly expressed among various miRNAs, suggesting hUC-MSCs-sEVs may perform their biological function through delivering miR-23a-3p. Moreover, we showed that hUC-MSCs-sEVs enriched with miR-23a-3p were successfully taken up by chondrocytes and hBMSCs, as indicated of the increased expression of miR-23a-3p in chondrocytes and hBMSCs. Recently studies revealed that miR-23a target 3ʹUTR of PTEN and overexpression of miR-23a in muscle prevented diabetes-induced muscle cachexia [Citation42]. However, no study investigated that hUC-MSCs-sEVs performed their biological function on chondrocytes and hBMSCs by delivering miR-23a-3p. In this study, luciferase reporter assay showed that miR-23a-3p directly targeted mRNA of PTEN. In addition, miR-23a-3p mimic suppressed the production of PTEN, whereas the mutant miR-23a-3p up-regulated PTEN production. PTEN was a negative regulator in AKT signalling pathway [Citation49]. PTEN/AKT signalling was reported to play a chondroprotective role by promoting chondrocytes proliferation, extracellular matrix synthesis and inhibiting hypertrophic differentiation [Citation36,Citation49,Citation50]. In this report, we verified that hUC-MSCs-sEVs delivered miR-23a-3p into chondrocytes and hBMSCs. The increased miR-23a-3p bound the 3ʹUTR of PTEN and inhibited the expression of PTEN. The inhibitory PTEN signal further resulted in up-regulation of P-AKT and activation of PTEN/AKT signal pathway improved chondrogenesis by promoting the proliferation, migration, differentiation of chondrocytes and hBMSCs, resulting in glycosaminoglycan formation, extracellular matrix synthesis and collagen II deposition. Taken together, hUC-MSCs-sEVs may provide a novel promising therapeutic method for cartilage defect therapy based on this research.
To optimize in vivo application and achieve sustained release of sEVs, we fabricated Gel-nano-sEVs hydrogel for local administration in cartilage defects. Previous study showed that hydrogel elicited great potential in cartilage engineering due to its soft-like property, hydroscopicity, thixotropy, elastic mechanical performance, and high biocompatibility [Citation22,Citation51]. In this study, injectable and UV-crosslinking Gelma hydrogel were suitable for the shapeless cartilage defect, which completely filled with defect sites and further prevented cartilage from damage. In addition, the method of UV-crosslinking was beneficial to maintain long-term stable structure and control the degradation rate of hydrogel by adjusting the light duration and intensity. However, conventional hydrogel inevitably lacked mechanical property and ordered structure of cartilage tissue [Citation52–Citation54]. Herein, we added nanoclay into hydrogel and found nanoclay could enhance the mechanical and biological performance of hydrogel, providing stable and desirable microenvironment for cells proliferation and differentiation. In addition, sEVs were released in a sustained manner during the degradation of scaffold and this promoted cartilage regeneration. In vivo results revealed that hUC-MSCs-sEVs released by Gel-nano hydrogel effectively promoted cartilage regeneration.
In summary, we found that hUC-MSCs-sEVs rich in miR-23a-3p promoted cartilage regeneration by activating PTEN/AKT signalling pathway. Moreover, the designed Gelma/nanoclay hydrogel exhibited desirable mechanical and biological performance and achieved release of sEVs in a sustained manner, which were beneficial for the therapeutic effects of hUC-MSCs-sEVs. Taken together, Gelma/nanoclay/sEVs hydrogel has great potential for cartilage defects treatment.
Disclosure of interest
The authors reported no potential conflict of interest.
Supplemental Material
Download MS Word (1.4 MB)Supplementary material
Supplemental data for this article can be accessed here.
Additional information
Funding
References
- Iannone F, Lapadula G. Phenotype of chondrocytes in osteoarthritis. Biorheology. 2008;45(3–4):411–18.
- Yin L, Wu Y, Yang Z, et al. Characterization and application of size-sorted zonal chondrocytes for articular cartilage regeneration. Biomaterials. 2018;165:66–78.
- Kowalczuk M, Musahl V. F.h.j.c.o. fu, r. research, cochrane in corr®: surgical interventions (microfracture, drilling, mosaicplasty, and allograft transplantation) for treating isolated cartilage defects of the knee in adults. Clin Orthop Relat Res. 2018;476(1):16.
- Kon E, Filardo G, Di Martino A, et al. ACI and MACI. Journal of Knee Surgery. 2012;25(1):017–022.
- Basad E, Ishaque B, Bachmann G, et al. J.J.K.s. Steinmeyer, sports traumatology, arthroscopy, Matrix-induced autologous chondrocyte implantation versus microfracture in the treatment of cartilage defects of the knee: a 2-year randomised study. Knee Surg Sports Traumatol Arthrosc18. 2010;18(4):519–527.
- Lu Z, Liu S, Le Y, et al. An injectable collagen-genipin-carbon dot hydrogel combined with photodynamic therapy to enhance chondrogenesis. Biomaterials. 2019;218:119190.
- Moradi L, Vasei M, Dehghan MM, et al. Regeneration of meniscus tissue using adipose mesenchymal stem cells-chondrocytes co-culture on a hybrid scaffold: in vivo study. Biomaterials. 2017;126:18–30.
- Zhu Y, Kong L, Farhadi F, et al. An injectable continuous stratified structurally and functionally biomimetic construct for enhancing osteochondral regeneration. Biomaterials. 2019;192:149–158.
- Yang W, Zhang J, Xu B, et al. HucMSC-derived exosomes mitigate the age-related retardation of fertility in female mice. Mol Ther. 2020;28(4):1200–1213.
- Wu J, Kuang L, Chen C, et al. miR-100-5p-abundant exosomes derived from infrapatellar fat pad MSCs protect articular cartilage and ameliorate gait abnormalities via inhibition of mTOR in osteoarthritis. Biomaterials. 2019;206:87–100.
- Wang M, Wang C, Chen M, et al. Efficient angiogenesis-based diabetic wound healing/skin reconstruction through bioactive antibacterial adhesive ultraviolet shielding nanodressing with exosome release. ACS Nano. 2019;13(9):10279–10293.
- Zhang ZG, Buller B, Chopp M. Exosomes – beyond stem cells for restorative therapy in stroke and neurological injury. Nat Rev Neurol. 2019;15(4):193–203.
- Tao SC, Yuan T, Zhang YL, et al. Exosomes derived from miR-140-5p-overexpressing human synovial mesenchymal stem cells enhance cartilage tissue regeneration and prevent osteoarthritis of the knee in a rat model. Theranostics. 2017;7(1):180–195.
- Liu X, Yang Y, Li Y, et al. Integration of stem cell-derived exosomes with in situ hydrogel glue as a promising tissue patch for articular cartilage regeneration. Nanoscale. 2017;9(13):4430–4438.
- Zhang S, Chuah SJ, Lai RC, et al. MSC exosomes mediate cartilage repair by enhancing proliferation, attenuating apoptosis and modulating immune reactivity. Biomaterials. 2018;156:16–27.
- Phinney DG, Pittenger MF. Concise review: msc-derived exosomes for cell-free therapy. Stem Cells. 2017;35(4):851–858.
- Chen P, Zheng L, Wang Y, et al. Desktop-stereolithography 3D printing of a radially oriented extracellular matrix/mesenchymal stem cell exosome bioink for osteochondral defect regeneration. Theranostics. 2019;9(9):2439–2459.
- Thery C, Witwer KW, Aikawa E, et al. Minimal information for studies of extracellular vesicles 2018 (MISEV2018): a position statement of the International Society for Extracellular Vesicles and update of the MISEV2014 guidelines. J Extracell Vesicles. 2018;7(1):1535750.
- Li CJ, Cheng P, Liang MK, et al. MicroRNA-188 regulates age-related switch between osteoblast and adipocyte differentiation. J Clin Invest. 2015;125(4):1509–1522.
- Thind A, Wilson C. Exosomal miRNAs as cancer biomarkers and therapeutic targets. J Extracell Vesicles. 2016;5(1):31292.
- Chen S, Tang F, Tang L, et al. Synthesis of cu-nanoparticle hydrogel with self-healing and photothermal properties. ACS Appl Mater Interfaces. 2017;9(24):20895–20903.
- Zhao Z, Fang R, Rong Q, et al. Bioinspired nanocomposite hydrogels with highly ordered structures. Adv Mater. 2017;29(45):1703045.
- Hasany M, Thakur A, Taebnia N, et al. combinatorial screening of nanoclay-reinforced hydrogels: a glimpse of the “holy grail” in orthopedic stem cell therapy? ACS Appl Mater Interfaces. 2018;10(41):34924–34941.
- Jin Y, Shen Y, Yin J, et al. Nanoclay-based self-supporting responsive nanocomposite hydrogels for printing applications. ACS Appl Mater Interfaces. 2018;10(12):10461–10470.
- Gosset M, Berenbaum F, Thirion S, et al. Primary culture and phenotyping of murine chondrocytes. Nat Protoc. 2008;3(8):1253.
- Thery C, Amigorena S, Raposo G, et al. Isolation and characterization of exosomes from cell culture supernatants and biological fluids. Curr Protoc Cell Biol. 2006; Chapter 3:. doi:10.1002/0471143030.cb0322s30.
- Au - Jung MK, Au- Mun JY. Sample preparation and imaging of exosomes by transmission electron microscopy. J Vis Exp. 2018;131:e56482.
- Haftmann C, Riedel R, Porstner M, et al. Direct uptake of Antagomirs and efficient knockdown of miRNA in primary B and T lymphocytes. J Immunol Methods. 2015;426:128–133.
- Zhang Z, Kang Y, Zhang Z, et al. Expression of microRNAs during chondrogenesis of human adipose-derived stem cells. Osteoarthritis Cartilage. 2012;20(12):1638–1646.
- Meng F, Li Z, Zhang Z, et al. MicroRNA-193b-3p regulates chondrogenesis and chondrocyte metabolism by targeting HDAC3. Theranostics. 2018;8(10):2862–2883.
- Zhu Z, Liu Y, Xue Y, et al. Tazarotene released from aligned electrospun membrane facilitates cutaneous wound healing by promoting angiogenesis. ACS Appl Mater Interfaces. 2019;11(39):36141–36153.
- Park H, Guo X, Temenoff JS, et al. Effect of swelling ratio of injectable hydrogel composites on chondrogenic differentiation of encapsulated rabbit marrow mesenchymal stem cells in vitro. Biomacromolecules. 2009;10(3):541–546.
- Wu J, Ding Q, Dutta A, et al. An injectable extracellular matrix derived hydrogel for meniscus repair and regeneration. Acta Biomater. 2015;16:49–59.
- Chen Y, Wu T, Huang S, et al. Sustained Release SDF-1alpha/TGF-beta1-Loaded Silk Fibroin-Porous Gelatin Scaffold Promotes Cartilage Repair. ACS Appl Mater Interfaces. 2019;11(16):14608–14618.
- Xin H, Li Y, Chopp M. Exosomes/miRNAs as mediating cell-based therapy of stroke. Front Cell Neurosci. 2014;8:377.
- Xie J, Lin J, Wei M, et al. Sustained Akt signaling in articular chondrocytes causes osteoarthritis via oxidative stress-induced senescence in mice. Bone Res. 2019;7(1):1–9.
- Murphy CM, Haugh MG, O’Brien FJ. The effect of mean pore size on cell attachment, proliferation and migration in collagen-glycosaminoglycan scaffolds for bone tissue engineering. Biomaterials. 2010;31(3):461–466.
- Perez RA, Mestres G. Role of pore size and morphology in musculo-skeletal tissue regeneration Materials science & engineering. C. Mater Biol Appl. 2016;61:922–939.
- van den Borne MP, Raijmakers NJ, Vanlauwe J, et al. International Cartilage Repair Society (ICRS) and Oswestry macroscopic cartilage evaluation scores validated for use in Autologous Chondrocyte Implantation (ACI) and microfracture. Osteoarthritis Cartilage. 2007;15(12):1397–1402.
- Yin L, Wu Y, Yang Z, et al. Characterization and application of size-sorted zonal chondrocytes for articular cartilage regeneration. Biomaterials. 2018;165:66–78.
- Liu S, Hou KD, Yuan M, et al. Characteristics of mesenchymal stem cells derived from Wharton’s jelly of human umbilical cord and for fabrication of non-scaffold tissue-engineered cartilage. J Biosci Bioeng. 2014;117(2):229–235.
- Chen S, Tang Y, Liu Y, et al. Exosomes derived from miR-375-overexpressing human adipose mesenchymal stem cells promote bone regeneration. Cell Prolif. 2019;52(5):e12669.
- Li X, Liu L, Yang J, et al. Exosome derived from human umbilical cord mesenchymal stem cell mediates mir-181c attenuating burn-induced excessive inflammation. EBioMedicine. 2016;8:72–82.
- Tan AR, Dong EY, Andry JP, et al. Coculture of engineered cartilage with primary chondrocytes induces expedited growth. Clin Orthop Relat Res. 2011;469(10):2735–2743.
- Liu X, Sun H, Yan D, et al. In vivo ectopic chondrogenesis of BMSCs directed by mature chondrocytes. Biomaterials. 2010;31(36):9406–9414.
- Valadi H, Ekstrom K, Bossios A, et al. Exosome-mediated transfer of mRNAs and microRNAs is a novel mechanism of genetic exchange between cells. Nat Cell Biol. 2007;9(6):654–659.
- Hannafon BN, Ding WQ. Intercellular communication by exosome-derived microRNAs in cancer. Int J Mol Sci. 2013;14(7):14240–14269.
- Zhang A, Li M, Wang B, et al. miRNA-23a/27a attenuates muscle atrophy and renal fibrosis through muscle-kidney crosstalk. J Cachexia Sarcopenia Muscle. 2018;9(4):755–770.
- Manning BD, Toker A. AKT/PKB Signaling: navigating the Network. Cell. 2017;169(3):381–405.
- Price J, Zaidi AK, Bohensky J, et al. Akt-1 mediates survival of chondrocytes from endoplasmic reticulum-induced stress. J Cell Physiol. 2010;222(3):502–508.
- Taylor DL. M. in het panhuis, self-healing hydrogels. Adv Mater. 2016;28(41):9060–9093.
- Dou X-Q, Feng C-L. Amino acids and peptide-based supramolecular hydrogels for three-dimensional cell culture. Adv Mater. 2017;29(16):1604062.
- Oliva N, Conde J, Wang K, et al. Designing hydrogels for on-demand therapy. Acc Chem Res. 2017;50(4):669–679.
- Lai W-F, Rogach AL. Hydrogel-based materials for delivery of herbal medicines. ACS Appl Mater Interfaces. 2017;9(13):11309–11320.