
Introduction
One reason that makes extracellular vesicles (EVs) so exciting is the large variety of cargo molecules associated with them. The studies suggesting that specific molecules are sorted and assembled into EVs uncovered their great potential in diagnostics – even small changes in specific cargo abundances have been associated with a variety of metabolic conditions. Among all cargo molecules contained in EV-enriched samples, microRNAs have been intensively scrutinized over the last 10 years because their dysregulation has been associated with diseases, and traces of their expression are often present in biofluids – either associated with EVs or in EV-free manner [Citation1–Citation3]. Furthermore, because of their exceptional stability in biofluids, microRNAs are being intensively tested as potential biomarkers [Citation2,Citation4–Citation6]. Since the launch of the Journal of Extracellular Vesicles (JEV), there has been considerable interest in reporting the association of microRNAs with EVs collected from human biofluids or collected from cultured cells: close to one-third of all JEV publications so far deals with some aspect of the detection, delivery or packaging of microRNAs; this proportion is comparable to the literature in the field of EVs published elsewhere.
Circulating microRNAs are not always the most abundant class of small RNAs in all biofluids; other classes, like tRNA fragments, might be more abundant on occasions [Citation7]. Yet, the popularity of microRNAs prevails. The seminal reports that showed the functional delivery of microRNAs via EVs and that tumour-derived EVs may promote metastasis or prepare the niche for metastatic cell invasion [Citation8–Citation14], sparked the interest to identify the microRNA expression patterns found in solid and liquid biopsies from individuals affected not only by cancer but by many other diseases. So far, there are two diagnostic tests clinically applicable in the market – ThyraMIR (Interpace Biosciences) and mir-THYpe (ONKOS Molecular Diagnostics); both are based on a microRNA detection panel to test and classify thyroid cancer. However, the first diagnostic panel targeting microRNAs as analytes from EV samples, or biofluids in general, is yet to get to market.
One of the challenges faced by the community in detecting microRNAs (or any other class of small RNAs) contained in EV-enriched samples is the limited number of molecules that each vesicle may contain. Estimates of the microRNA content per vesicle resulted in an average of one molecule per 100 individual EVs (i.e. exosomes) [Citation15]. (For a thorough explanation about the use and nomenclature of the term “exosomes”, refer to Witwer and Théry [Citation16]). Clearly, the starting material of biofluid to obtain enough quantities of EVs per sample is essential. Thus, the development of commercial assays to measure microRNA expression has played a crucial role in this matter. Fortunately, the ease in conducting high-throughput microRNA expression profiling is nowadays more sensitive compared to the early years of microRNA research. A typical workflow adopted by many research groups in order to look for candidate biomarkers within a small RNA sample consists of conducting first a high-throughput profiling of microRNAs, to then “validate” the observed expression pattern by using another technique directed to specific candidates with suspected dysregulation [Citation17–Citation20]. Because of their commercial availability, high sensitivity and ease of use, reverse transcription quantitative real-time PCR (RT-qPCR) assays are by far the most widely used approach to validate high-throughput microRNA profiling experiments [Citation21–Citation24]. Although this strategy is widely employed and has led to several publications that support the use of microRNAs as early biomarkers, on many occasions, the results observed by using one quantification platform may not be reproducible by another, yielding data challenging to interpret. This workflow has given rise to inconsistencies not only in those microRNAs whose elevated expression pose potential as biomarkers, but even in those expected to remain constant and unrelated to disease [Citation25–Citation27]. Recent reports addressed this issue and propose that its origin may lie with the inherent variability of microRNA sequences in combination with the use of different detection platforms to validate microRNA expression data.
In this editorial, we aim at raising awareness about the lessons learned on the sensitivity and specificity of the most widely used platforms to quantify the abundance of microRNAs. As not all platforms are created equal, their detection mechanism – and in some cases – the detected molecule, may not be equal. We highlight the studies testing how microRNA variants might affect expression profiling experiments and therefore lead to inconsistencies in data – especially when compared across platforms. We believe that in understanding the limitations each platform presents the research conducted to characterize EV-carried and circulating microRNAs may be particularly benefited because of the scarce material available for experimentation. We provide a simple diagram that summarizes the general strategy followed by the few research groups that have managed to overcome these limitations, which could be used as a workflow in cases of low data correlation when assessing the abundance of microRNAs with different detection platforms.
Variations on the theme of microRNA profiling and detection
The most widely used methods to explore microRNA expression are microarrays, RT-qPCR and small RNA-seq (sRNA-seq) [Citation17,Citation18,Citation22,Citation24,Citation28]. Although the technologic approach of microarrays and RT-qPCR operates by different mechanisms, both meet at one concurrent principle: specific oligonucleotide probes hybridize to microRNA molecules to produce a signal. This condition inexorably requires previous knowledge on the RNA sequences in order to design and synthesize the hybridizing probes (the molecular approach conducted by each platform may be revisited in Yin et al., 2008; and Pritchard et al., 2012). sRNA-seq, on the contrary, does not require previous knowledge on the sequence to detect, and hence has been typically employed in studies aimed to discover novel sequences. As the commercial availability of these three approaches has increased and their cost has reduced over the last 10 years, many laboratories use them routinely to explore microRNA expression in several experimental setups and disease conditions.
Even though each type of platform is very robust in detecting microRNAs, it is common to stumble on puzzling results when their expression is validated by using different platforms sequentially. For example, while some microRNAs correlate robustly and present similar expression trends, others show low correlations between platforms – this can be observed for the same microRNA and sample [Citation18,Citation21,Citation22,Citation29,Citation30]. For this reason, microRNAs with acute fold-changes relative to their controls, and therefore attractive as potential biomarkers must be discarded from further analyses because the platform chosen to validate their expression did not reproduce the trend observed with the first one. The expression of those microRNAs with low correlation is typically ignored due to the suspicion of biases in data collection. This situation is detrimental to biomarker discovery.
To understand this phenomenon in more detail, one research group explored in vitro how microRNA sequence variants contribute to such discrepancies [Citation31–Citation33]. First, Nejad et al. reported confounding results in the detection of miR-222 in human fibroblasts: by RT-qPCR, the authors failed to detect the 70% decrease of miR-222-3p in response to IFN initially observed by sRNA-seq. This observation was later confirmed and extended by Pillman et al., who reported that the use of predesigned LNA-based RT-qPCR assays employed in their study – and that of Nejad et al. – targeted the miRBase entry sequence of miR-222-3p, but failed to detect other of its abundant variants, which were only discernable by computational analysis of the sRNA-seq data. Intriguingly, Pillman et al. also noticed that this situation was not unique to their study, and it applied as well for other published data, but in some cases went unnoticed [Citation31]. Finally, Magee et al. reported that the Cq values for miR-21 obtained by using one RT-qPCR platform were affected by changing the stoichiometry between its miRBase entry sequence with either synthetic spiked-in variants or cell-extracted RNA [Citation30]. Importantly, the Cq values were affected differently by using another RT-qPCR platform. Reports exemplifying the lack of correlation in microRNA analyses are increasing (reviewed by Witwer [Citation27]), and despite numerous review articles highlighting the strengths and limitations of each approach [Citation17,Citation18,Citation20,Citation26,Citation27,Citation34–Citation36], the lack of validation is still a recurring theme.
A microRNA name is not composed of one molecular entity only
Since the first reports of hundreds of conserved microRNAs in animals, their existence has been accompanied by the presence of sequence variants to what is collectively known as mature sequences [Citation37,Citation38]. Historically, except for few exceptions (like let-7 and bantam), mature microRNAs were given a number, and therefore a name, after their discovery in a progressive list (e.g. miR-1, miR-2, and so on). Most mature microRNAs arise from the processing of longer stem-loop precursors in a series of cleavage events by the RNases type III Drosha and Dicer [Citation39–Citation41]. The intense study of biogenesis and function of microRNAs in the first decade after their discovery led to assume that in general, the variability observed in their mature sequences originated during their biogenesis, being the most frequently varying location the nucleotide positions near their 3′ ends. These positions were assumed to have little to no effect on microRNA function [Citation38,Citation42]. The variants were primarily observed by direct cloning of microRNA-containing DNA concatamers, and later corroborated by northern blot assays; the combination of these two methods made evident that the variability observed for any given microRNA could be in sequence, in size, or a combination of both. With the advent of deep sequencing technologies, our understanding of microRNA variants evolved in the last decade [Citation43–Citation45], and several laboratories have demonstrated that they are not merely byproducts of imprecise cleavages by Drosha or Dicer [Citation46–Citation48], but also that play a biological role and might influence mRNA target selection [Citation49–Citation53], and their presence associates with diseases as well [Citation54–Citation57]. These variants are referred to as microRNA isoforms, or isomiRs [Citation58]. IsomiRs not only appear when there is a high-depth coverage in sequencing reads, but they were also observed since the first massively cloning studies in animals from Profs. Tuschl’s and Ambros’ laboratories in 2001 [Citation37,Citation38]. In those studies, due to the method employed for the cloning of small RNAs (concatamerization), the depth and coverage of the sequences obtained did not go beyond a few dozen thousands of “reads”. It is currently known that isomiRs exist in every sample, regardless of the abundance of their canonical microRNAs, and also that some isomiRs could be the most abundant representative of a microRNA name within a sample.
The abundance of isomiRs might bias the bulk detection of microRNAs
The evidence obtained from experiments aimed to address the inconsistencies in microRNA quantification across platforms suggests that the issue may have roots in the abundance of isomiRs within a sample, and also by how each detection platform deals with them. Notably, this phenomenon is not only constrained to one specific detection platform only, but rather to their sequential combination [Citation31–Citation33,Citation56] – e.g. microarray or sRNA-seq followed by individual RT-qPCR validation.
To explain how the abundance of isomiRs may affect microRNA detection across platforms we present two hypothetical scenarios: one in which data validation is robust, and another in which is low (). Consider a sample that contains several isoforms of a given microRNA of interest (in this case, hsa-let-7a-1); all isoforms are present at various stoichiometries. In the case of robust validation (, top), the miRBase entry sequence for hsa-let-7a-1 (red) – also commonly referred to as canonical, reference, archetype, consensus, or |0|0| – is the predominant and most abundant compared to the sum of all other isoforms. If a high-throughput analysis of this sample is conducted by microarray profiling, it is expected that the mature archetype sequence is detected, together with its other isoforms in a bulk signal (checkmarks). A subsequent validation by RT-qPCR for hsa-let-7a-1 would show a high correlation of detection across platforms, as the abundance of all other isoforms has little to no influence in detecting the predominant |0|0| isoform (for isomiR nomenclature refer to [Citation56,Citation57,Citation59]).
Figure 1. The abundance of isomiRs may reveal inconsistencies in the bulk detection of mature microRNAs across detection. Two examples of high (top) and low (bottom) correlation are shown. The archetype miRBase entry sequence (|0|0|) of hsa-let-7a-1 is shown in red, and its isomiRs are shown in black. The hypothetical abundance of each isoform is represented by a horizontal bar (left). NTA, Non-templated nucleotide additions (grey Us).
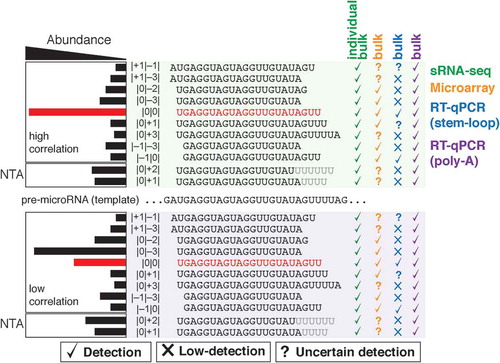
In the case of low validation, however, the miRBase entry sequence might not be the most predominant isoform within the sample (, bottom). All platforms will detect the archetype, but the majority of the bulk signal will come from the most predominant isoform, hsa-let-7a-1 |0|–3|. Since some abundant isoforms may not be detected by each platform technology (cross marks), the confounding results will arise because of low correlation. For example, if hsa-let-7a-1 |0|–3| is detected and profiled by microarray, it will not be detected by stem-loop RT-qPCR; conversely, if it is followed by poly-A RT-qPCR, the bulk detection of the different isoforms altogether would yield a higher signal-to-noise. These scenarios are expected because it is known that individual hybridization probes cross-react with highly similar isoforms (e.g. having 1–2 nt difference) [Citation30], but the detection tolerance for all microRNA isoforms remains largely unknown, and it is uncertain whether some isoforms might even be detected by each probe (, question marks). Therefore, since the bulk detection of each microRNA in a sample is the sum of all its isomiRs detected individually, assays based on the poly-A RT-qPCR approach typically yield higher signal-to-noise ratios compared to those based on the stem-loop (e.g. the hydrolysis-based probes known as Taqman [Citation60]) [Citation22,Citation29,Citation33].
The only platform from which individual isoforms may be deconvoluted from the bulk signal is sRNA-seq. In general, the diversity and relative proportions of all microRNA isoforms in a sample can be assessed quantitatively by computational analyses, regardless of the sequencing technology (Illumina, SeqLL, Invitrogen-Thermo, etc.). Additionally, sRNA-seq offers the advantage to detect non-templated nucleotide additions (NTAs), that do not correspond to the original precursor sequences that give rise to mature microRNAs – NTAs arise from the activity of terminal transferases that typically add extra uridines or adenines at the miR-3′ ends, and their presence is sometimes related to a target-directed microRNA decay mechanism (reviewed in refs. 14 and 35). Despite the current understanding of the importance of isomiRs biology, however, most computational tools used for the analysis of microRNAs expression do not include an isomiR deconvolution feature by default, so the user must specifically look for this option (for a list of tools for isomiR analysis refer to www.tools4mirs.org [Citation61]). If there is not an appropriate computational analysis after sRNA-seq profiling and the advantage offered of individual isoform detection with their respective abundances is not harnessed, the detected isomiRs might end up simply portrayed as bulk signals. Therefore, a careful bioinformatic analysis is required to figure out whether the lack of robustness can be explained given the abundance of specific isomiRs in each case. A concern that escapes the scope of this text is the ligation and amplification biases that may occur during library construction, and the type of normalization that limits sRNA-seq profiling (for review on this matter, see references [Citation2,Citation5,Citation20,Citation25,Citation28,Citation29,Citation62–Citation64]). Poor reproducibility across platforms is the result of a complex blend of several factors, originated by the intrinsic mechanisms by which each platform detects microRNAs.
It is essential to highlight that within any sRNA-seq dataset, only a handful of microRNAs uniquely correspond to the archetype miRBase entry. For the majority of microRNA names, there is a rich blend of isoforms that may even outnumber their |0|0| counterpart and this applies for several microRNA names [Citation31–Citation33,Citation65-Citation67]. In 81 colorectal neoplasia samples, for example, isomiRs account for 70% of all microRNA sequencing reads and their archetype sequences account only for 30% of all microRNA reads. Similar archetype:isomiRs ratios are observed from the sRNAseq data collection at miRBase, or directly from any of the SRA datasets referenced at the repository (miRBase v22 [Citation65],), or even by a random selection of SRA files from the Gene Expression Omnibus (GEO) from a variety of human and mouse cell lines and tissues, including biofluids and EV-enriched samples. Within these ratios, microRNA names distribute in four general categories: 1) microRNA names whose archetypes are the only sequence encountered; 2) microRNA names whose archetypes are more abundant than the sum of all their respective isoforms; 3) microRNA names whose archetypes are less abundant than the sum of all of their corresponding isoforms; and 4) microRNA names for which one or many individual isomiRs are more abundant than their archetype. The most critical aspect of such distribution is that category 1) is the least frequent (in agreement with Wu et al., and Fiskaa et al.). In other words, the representative of a microRNA name – for which most commercial probes are directed to hybridize – rarely exists as a unique sequence in a sample, supporting previous reports and the data deposited at miRBase (v22) [Citation65–Citation67].
Why isomiRs matter in EV-enriched samples?
Since the diameter of EVs is typically under 1 µm, their maximum cargo is minimal. Exosomes, for example, range at ~30–120 nm in diameter, so only a few microRNA molecules could be assembled into one particle. In this view, not all may correspond to the same microRNA name, but most could be microRNA-empty. The estimated average of the number of microRNA molecules per vesicle particle in the size range of exosomes is 1:100 [Citation15]. At such scarcity, it is not surprising that RT-qPCR is the preferred validating platform for the detection of EV-carried microRNAs – it has been demonstrated that as low as 10 molecules per sample can be detected using this platform [Citation68]. Notably, for sRNA-seq experiments, the amount of starting material must be substantially higher (1–5 ng of enriched small RNAs). Lower quantities might be used for library construction, but the quality tests and concentration measurements must be skipped. Additionally, higher PCR amplification cycles are required during library construction, but it is known this originates acute amplification biases [Citation5,Citation64,Citation69].
Despite the current lack of nomenclature that thoroughly describes the nature of every class of microRNA-carrying vesicle [Citation6,Citation70], the proportions of isomiRs detected in cultured parental cells are generally recapitulated in EV-enriched samples. Few studies, however, have reported that specific isomiRs may be enriched in EVs in comparison to parental cells, suggesting that the proportion EV/parental cell may vary under certain circumstances. Koppers-Lalic et al. reported that 3′-NTAs (i.e. 3′-uridylated isoforms) are over-represented in the repertoire of microRNAs of exosomes compared to their parental B-cells (which are rather 3′-adenylated) [Citation71]; the same group later observed this in EV-enriched samples of urine from prostate cancer patients [Citation72]. Li et al. reported an enrichment in 3′-uridylated isoforms for miR-214-3p in osteoclast EVs [Citation73]. Whereas such NTA 3′-uridylation was not observed in hepatic cells [Citation74], other studies reported differences at specific nucleotide positions within microRNAs in EV-enriched samples [Citation75–Citation78], supporting the notion that a sequence heterogeneity may influence the packing of specific microRNAs into EVs, or also promote their cellular retention [Citation67]. More research is required to clarify the conditions that may promote specific isomiR association with EVs.
We note that the stoichiometric changes observed for specific isomiRs in EV-enriched samples mentioned above where discernable only after bioinformatic analyses of sRNA-seq data, like those of Nejad et al. and Pillman et al. referred earlier. Since it is unclear at this point the sensitivity level at which microarrays or RT-qPCR probes discriminate between individual isomiRs, significant insights may inadvertently be ignored in the literature; a situation that may worsen for samples with minute amounts of small RNAs.
A strategy followed when stumbling on elusive cargo
So far, we presented two different but related issues that arise with the detection of microRNAs with complex isomiR stoichiometries. First, the discrepancies in expression caused by the inherent molecular principle employed by each platform, associated with their sensitivity in detecting or not isomiRs as bulk signals. Second, the diversity of isomiRs for each microRNA name within every sample, evidenced by experiments that employ the same detection platform but vary the isomiR stoichiometries with spiked-in oligos, either with synthetic or cell-extracted RNA. It is reasonable to expect that the issues that apply for in vitro cultured cells may also occur for samples of different origin, like solid or liquid biopsies – including EV-associated and EV-free circulating microRNAs.
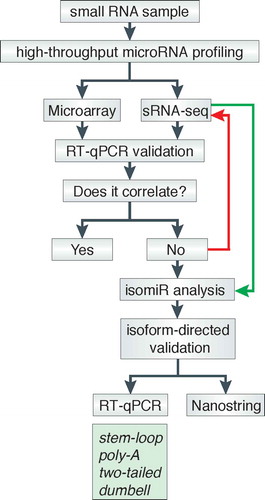
The in vitro studies cited here that managed to solve discrepancies in the level of expression detected between platforms have one thing in common: they all had sRNA-seq data available, and the authors looked back to revisit the isomiR datasets. Hence, based on the general empirical strategy followed in those studies, we present a simple decision-making diagram that could aid in the steps to follow to adequate a confirmation test across platforms in cases of suspicion of a high abundance of non-archetype isoforms (). We note that this workflow applies to microRNA-containing samples from any sources or concentrations. For high-throughput microRNA profiling conducted by sRNA-seq, it is possible to analyse sequencing reads and look for abundant isoforms (, green arrow). For microarrays, however, if there is no previous knowledge of candidate isoforms, it is challenging to locate the putative confounding isomiRs. Naturally, a high correlation is expected to occur whenever the same detection platform is employed to validate previous results with identical samples (e.g. stem-loop qPCR panels, followed by stem-loop individual assays), regardless of isomiR stoichiometries. Once the putative isoforms are sorted out, it is possible to design specific assays for their detection by using RT-qPCR probes of commercial and non-commercial methods (, green box). Alternatively, nanostring technology has been shown to detect specific isoforms in a linear range of quantification [Citation79]. Alas, should no previous knowledge of candidate isoforms is available, it is recommended to re-analyse some or all samples by sRNA-seq to then proceed to isomiR analysis (, red arrow).
Figure 2. Decision-making diagram. After high-throughput microRNA profiling data are typically validated by conducting specific RT-qPCR assays for interesting microRNAs with acute fold-change expression over control samples. In those cases where the RT-qPCR assays do not reproduce the initial fold-change observed for any candidate microRNA, an isomiR-directed analysis may help to corroborate previous expression profiling results or trends. Ideally, the identification of isomiRs in a sample is conducted by the computational analysis that follows after sRNA-seq profiling; specific isoforms can be detected by isomiR-directed RT-qPCR probes (green box), or Nanostring technology. Conversely, the lack of information about the presence of putative confounding isomiRs within samples requires sRNA-seq profiling (red arrow) and the concomitant isomiR-directed computational analysis (green arrow).
Some research groups have succeeded in detecting specific isoforms of selected microRNAs empirically by using inventoried and customized commercial probes that work either with stem-loop or poly-A RT-qPCR assays () [Citation30,Citation32,Citation33,Citation49,Citation66,Citation68,Citation80–Citation82]. Also, few research groups have designed elegant modifications to existing methods to detect specific isoforms [Citation33,Citation68,Citation82,Citation83]. While not commercially available yet, assays like two-tailed RT-qPCR and dumbbell-PCR look promising and cost-effective approaches to tackle the low correlation issue directly due to the abundance of non-archetype sequences by RT-qPCR. However, further experimentation is still needed to demonstrate their full cross-reactivity and specificity range.
Table 1. RT-qPCR probes reported to detect specific isomiRs.
Concluding remarks and future directions
Awareness of the presence of isomiRs might be the tipping point for cases in which the abundance of candidate microRNAs could be associated with the onset of a disease state, but there is a low correlation when their expression is assayed with a different detection platform. The reports of NTA 3′-uridylated isomiRs and the nucleotide variability observed in EV-enriched samples are an invitation to look more in detail for possible expression changes within the isomiR repertoires.
Importantly, understanding the different molecular mechanisms by which each microRNA detection platform operates helps in selecting the type of analysis in accordance with the expected results. We stress the argument that microRNA detection inconsistencies across platforms do not necessarily subtract validity to data acquisition, as each platform is robust in its niche. However, isomiR stoichiometries within samples vary – some microRNAs are present as a rich blend of isoforms, while others are unique molecular entities [Citation45]. Not considering the sequence variability threshold tolerated by each platform may confine researchers to conclude miR-x,y,z – but not miR-a,b,c – are relevant biomarkers because their expression fold-change was validated with another platform. Remarkably, those platforms that work through hybridizing probes, inexorably assume specific sequences and therefore detect specific mature microRNA sequences [Citation22]. The fact that most commercially available probes are directed to hybridize the miRBase entry sequence helped to nurture and develop the microRNA field for several years [Citation65,Citation84,Citation85]. However, our current understanding of microRNAs heterogeneity requires to adjust their detection to avoid confounding results [Citation22,Citation31]. Although microRNA databases other than miRBase have been developed (for example, the hand-curated miRgeneDB [Citation86]), there is no consensus currently referring to which archetype should be primarily considered, or even whether an archetype should be considered at all. In our perspective, this constitutes the main drawback for microRNA detection using predesigned probes.
Several groups of microRNAs are profiled as highly represented in specific diseases, either from cultured cells or from solid and liquid biopsies (reviewed in [Citation25,Citation34]). Hence, the hunt for biomarkers rarely finds isolated examples of individual microRNAs associated with disease. Instead, it is common to find groups of microRNAs from unrelated families whose collective expression can be used as biomarkers. One key exception to this, however, is miR-21 – which, among microRNAs, is considered the quintessence of biomarkers in cancer. The work by Telonis et al. puts in perspective the value in considering not only microRNA names and their archetype sequences, but also their isomiRs. Of all microRNAs, miR-21 is by far the most associated with the term “biomarker” in the literature. Yet, its presence is poorly discriminatory of disease, supporting a previous conclusion by Wang et al. [Citation56,Citation87]. Conversely, Telonis and colleagues also described that specific isomiRs corresponding to other microRNAs could be even more discriminatory but are poorly recognized as biomarkers in the literature. Since commercial RT-qPCR assays of miR-21 are designed and directed against the sequence referenced at miRBase (as for most microRNAs), it is expected that such archetype is detected accurately and quantitatively. Interestingly, the miRBase archetype of miR-21 is not the most abundant of its variants in sRNA-seq data from the TCGA repository, and many of its isoforms are unusually high compared to other microRNAs – close to 50 isoforms [Citation30,Citation56,Citation57,Citation67]. Additionally, Magee et al. reported that two different commercial RT-qPCR assays for miR-21 do not discriminate among some of its most abundant isoforms and show a significant cross-reactivity, either in experiments that used only synthetic spiked-in RNA oligos as target molecules or by mixing the spiked-ins with cell-extracted RNAs [Citation30].
Which of the miR-21 variants was profiled in those studies that reported a high correlation of different types of cancer with the mature miR-21? If the bulk detection of miR-21, either by stem-loop or poly-A assays, does not discriminate among its most abundant isoforms, could it be that this cross-reactivity of miR-21 probes can extend beyond and also cross-react with other somewhat similar microRNAs? In a different study, Wu et al. concluded that the detection of miR-21 archetype is a poor biomarker of colorectal neoplasia [Citation66]. Then, why is the presence of miR-21 so heavily associated with cancer? Could it be that the cross-reactivity of miR-21 RT-qPCR probes (associated with the large proportion of its isomiRs) is more likely to recapitulate expression fold-changes obtained by using other platforms? In support of this, Fiskaa et al. reported that a miR-21 isoform (3′ termini = C) – not its archetype – is a more consistent biomarker of breast cancer [Citation67].
One provocative hypothesis that could explain this phenomenon is that the biomarker literature is biased towards certain microRNAs, like miR-21, but not precisely because of their potential as biomarkers, but rather because the stoichiometric ratio of archetype:isomiR sequences facilitates their “validation” of expression fold-changes across different platforms. For example, microRNAs with abundant isomiRs, for which RT-qPCR probes are more sensitive to sequence changes, may not pass the validation process, and therefore are discarded from the discussion and further experimentation, while others that do pass the validation, become highly popular in the biomarker realm [Citation31,Citation33,Citation82].
We conclude by stating that not accounting for isomiRs due to the limitations of detection, keeps us from establishing the true suitability of microRNA as biomarkers and from the rapid development of accurate panels to diagnose diseases. In addition, understanding cargo isomiRs will aid in cementing the foundation our knowledge to develop synthetic EVs as microRNA delivery vehicles. Ultimately, the ideal platform for characterizing the microRNA content in EVs would be such that could identify the complete isomiR repertoire, per EV particle, per sample, in an unbiased manner. For that, we hope not to wait yet for too much time.
Competing interests
The authors declare that they have no competing interests.
Acknowledgments
We kindly thank O. Moreno-Proo and M. Flores-Torres for assistance in Table 1, and for comments on manuscript drafts. We thank Valentín Mendoza Rodríguez and Blanca Delgado-Coello for technical assistance.
Additional information
Funding
References
- Gebert LFR, MacRae IJ. Regulation of microRNA function in animals. Nat Rev Mol Cell Biol. 2018. DOI:10.1038/s41580-018-0045-7
- Das S, Ansel KM, Bitzer M, et al. The extracellular RNA communication consortium: establishing foundational knowledge and technologies for extracellular RNA research. Cell. 2019;177:231–10.
- Pluchino S, Smith JA. Explicating exosomes: reclassifying the rising stars of intercellular communication. Cell. 2019;177:225–227.
- Buschmann D, Haberberger A, Kirchner B, et al. Toward reliable biomarker signatures in the age of liquid biopsies – How to standardize the small RNA-Seq workflow. Nucleic Acids Res. 2016;44:5995–6018.
- Barberán-Soler S, Vo JM, Hogans RE, et al. Decreasing miRNA sequencing bias using a single adapter and circularization approach. Genome Biol. 2018;19:105.
- Murillo OD, Thistlethwaite W, Rozowsky J, et al. exRNA atlas analysis reveals distinct extracellular RNA cargo types and their carriers present across human biofluids. Cell. 2019;177:463–477.e15.
- Godoy PM, Bhakta NR, Barczak AJ, et al. Large differences in small RNA composition between human biofluids. Cell Rep. 2018;25:1346–1358.
- Costa-Silva B, Aiello NM, Ocean AJ, et al. Pancreatic cancer exosomes initiate pre-metastatic niche formation in the liver. Nat Cell Biol. 2015;17:816–826.
- Bigagli E, Luceri C, Guasti D, et al. Exosomes secreted from human colon cancer cells influence the adhesion of neighboring metastatic cells: role of microRNA-210. Cancer Biol Ther. 2016;17:1062–1069.
- Fong MY, Zhou W, Liu L, et al. Breast-cancer-secreted miR-122 reprograms glucose metabolism in premetastatic niche to promote metastasis. Nat. Cell Biol. 2015;17:183–194.
- Le MTN, Hamar P, Guo C, et al. MiR-200-containing extracellular vesicles promote breast cancer cell metastasis. J Clin Invest. 2014;124:5109–5128.
- Valadi H, Ekström K, Bossios A, et al. Exosome-mediated transfer of mRNAs and microRNAs is a novel mechanism of genetic exchange between cells. Nat Cell Biol. 2007;9:654–659.
- Skog J, Würdinger T, van Rijn S, et al. Glioblastoma microvesicles transport RNA and proteins that promote tumour growth and provide diagnostic biomarkers. Nat Cell Biol. 2008;10:1470–1476.
- Pegtel DM, Cosmopoulos K, Thorley-Lawson DA, et al. Functional delivery of viral miRNAs via exosomes. Proc Natl Acad Sci U S A. 2010;107:6328–6333.
- Chevillet JR, Kang Q, Ruf IK, et al. Quantitative and stoichiometric analysis of the microRNA content of exosomes. Proc Natl Acad Sci. 2014;111:14888–14893.
- Witwer KW, Théry C. Extracellular vesicles or exosomes? On primacy, precision, and popularity influencing a choice of nomenclature. J Extracell Vesicles. 2019;8:1.
- Dave VP, Ngo TA, Pernestig A-K, et al. MicroRNA amplification and detection technologies: opportunities and challenges for point of care diagnostics. Lab Investig. 2019;99:452–469.
- Pritchard CC, Cheng HH, Tewari M, et al. MicroRNA profiling: approaches and considerations. Nat Rev Genet. 2012;13:358–369.
- Nair VS, Pritchard CC, Tewari M, et al. Design and analysis for studying microRNAs in human disease: A primer on-omic technologies. Am J Epidemiol. 2014;180:140–152.
- Moldovan L, Batte KE, Trgovcich J, et al. Methodological challenges in utilizing miRNAs as circulating biomarkers. J Cell Mol Med. 2014;18:371–390.
- Llorens F, Hummel M, Pantano L, et al. Microarray and deep sequencing cross-platform analysis of the mirRNome and isomiR variation in response to epidermal growth factor. BMC Genomics. 2013;14:371.
- Forero DA, González-Giraldo Y, Castro-Vega LJ, et al. qPCR-based methods for expression analysis of miRNAs. Biotechniques. 2019;67:192–199.
- Balcells I, Cirera S, Busk PK, et al. Specific and sensitive quantitative RT-PCR of miRNAs with DNA primers. BMC Biotechnol. 2011;11:70.
- Yin JQ, Zhao RC, Morris KV, et al. Profiling microRNA expression with microarrays. Trends Biotechnol. 2008;26:70–76.
- Witwer KW, Halushka MK. Toward the promise of microRNAs – enhancing reproducibility and rigor in microRNA research. RNA Biol. 2016;13:1103–1116.
- Mateescu B, Kowal EJK, van Balkom BWM, et al. Obstacles and opportunities in the functional analysis of extracellular vesicle RNA - An ISEV position paper. J Extracell Vesicles. 2017;6:1286095.
- Witwer KW. Circulating microRNA biomarker studies: pitfalls and potential solutions. Clin Chem. 2015;61:56–63.
- Schwarzenbach H, da Silva AM, Calin G, et al. Data normalization strategies for microRNA quantification. Clin Chem. 2015;61:1333–1342.
- Mestdagh P, Hartmann N, Baeriswyl L, et al. Evaluation of quantitative miRNA expression platforms in the microRNA quality control (mirQC) study. Nat Methods. 2014;11:809–815.
- Magee R, Telonis AG, Cherlin T, et al. Assessment of isomiR discrimination using commercial qPCR methods. Noncoding RNA. 2017;3:2.
- Pillman KA, Goodall GJ, Bracken CP, et al. miRNA length variation during macrophage stimulation confounds the interpretation of results: implications for miRNA quantification by RT-qPCR. RNA. 2019;25:232–238.
- Nejad C, Pillman KA, Siddle KJ, et al. miR-222 isoforms are differentially regulated by type-I interferon. Rna. 2018;24:332–341.
- Nejad C, Pépin G, Behlke MA, et al. Modified polyadenylation-based RT-qPCR increases selectivity of amplification of 3ʹ-MicroRNA isoforms. Front. Genet. 2018;9:1–9.
- Anfossi S, Babayan A, Pantel K, et al. Clinical utility of circulating non-coding RNAs – an update. Nat Rev Clin Oncol. 2018;15:541–563.
- Russell AE, Sneider A, Witwer KW, et al. Biological membranes in EV biogenesis, stability, uptake, and cargo transfer: an ISEV position paper arising from the ISEV membranes and EVs workshop. J Extracell Vesicles. 2019;8:1684862.
- Witwer KW, Soekmadji A, Hill A, et al. Updating the MISEV minimal requirements for extracellular vesicle studies: building bridges to reproducibility. J Extracell Vesicles. 2017;6:1.
- Lee RC, Ambros V. An extensive class of small RNAs in Caenorhabditis elegans. Science. 2001;294:862–864.
- Lagos-Quintana M, Rauhut R, Lendeckel W, et al. Identification of novel genes coding for small expressed RNAs. Science. 2001;294:853–858.
- Hutvágner G, McLachlan J, Pasquinelli AE, et al. A cellular function for the RNA-interference enzyme dicer in the maturation of the let-7 small temporal RNA. Science. 2001;293:834–838.
- DP B. MicroRNAs: genomics,biogenesis, mechanism, and function.pdf. Cell. 2004;116:281–297.
- Provost P, Ahn C, Han J, et al. The nuclear RNase III Drosha initiates microRNA processing. Nature. 2003;425:415–419.
- Haley B, Zamore PD. Kinetic analysis of the RNAi enzyme complex. Nat Struct Mol Biol. 2004;11:599–606.
- Ameres SL, Zamore PD. Diversifying microRNA sequence and function. Nat Rev Mol Cell Biol. 2013;14:475–488.
- Ghildiyal M, Zamore PD. Small silencing RNAs: an expanding universe. Nat Rev Genet. 2009;10:94–108.
- Lee LW, Zhang S, Etheridge A, et al. Complexity of the microRNA repertoire revealed by next-generation sequencing. RNA. 2010;16:2170–2180.
- Fukunaga R, Han B, Hung J-H, et al. Dicer partner proteins tune the length of mature miRNAs in flies and mammals. Cell. 2012;151:533–546.
- Flores-Jasso CF, Arenas-Huertero C, Reyes JL, et al. First step in pre-miRNAs processing by human dicer. Acta Pharmacol Sin. 2009;30:8.
- Seitz H, Ghildiyal M, Zamore PD, et al. Argonaute loading improves the 5′ precision of both MicroRNAs and their miRNA* strands in flies. Curr. Biol. 2008;18:147–151.
- Llorens F, Bañez-Coronel M, Pantano L, et al. A highly expressed miR-101 isomiR is a functional silencing small RNA. BMC Genomics. 2013;14:104.
- Cloonan N, Wani S, Xu Q, et al. MicroRNAs and their somiRs function cooperatively to target common biological pathways. Genome Biol. 2011;12:R126.
- Yu F, Pillman KA, Neilsen CT, et al. Naturally existing isoforms of miR-222 have distinct functions. Nucleic Acids Res. 2017;45:11371–11385.
- Manzano M, Forte E, Raja AN, et al. Divergent target recognition by coexpressed 5′-isomiRs of miR-142-3p and selective viral mimicry. RNA. 2015;21:1606–1620.
- Fernandez-Valverde SL, Taft RJ, Mattick JS, et al. Dynamic isomiR regulation in Drosophila development. RNA. 2010;16:1881–1888.
- Neilsen CT, Goodall GJ, Bracken CP, et al. IsomiRs - The overlooked repertoire in the dynamic microRNAome. Trends Genet. 2012;28:544–549.
- Tan GC, Chan E, Molnar A, et al. 5′ isomiR variation is of functional and evolutionary importance. Nucleic Acids Res. 2014;42:9424–9435.
- Telonis AG, Magee R, Loher P, et al. Knowledge about the presence or absence of miRNA isoforms (isomiRs) can successfully discriminate amongst 32 TCGA cancer types. Nucleic Acids Res. 2017;45:2973–2985.
- Telonis AG, Loher P, Jing Y, et al. Beyond the one-locus-one-miRNA paradigm: microRNA isoforms enable deeper insights into breast cancer heterogeneity. Nucleic Acids Res. 2015;43:9158–9175.
- Morin RD, O’Connor MD, Griffith M, et al. Application of massively parallel sequencing to microRNA profiling and discovery in human embryonic stem cells. Genome Res. 2008;18:610–621.
- Loher P, Londin ER, Rigoutsos I. IsomiR expression profiles in human lymphoblastoid cell lines exhibit population and gender dependencies. Oncotarget. 2014;5:18.
- Bustin SA, Benes V, Garson JA, et al. The MIQE guidelines: minimum information for publication of quantitative real-time PCR experiments. Clin Chem. 2009;55:611–622.
- Lukasik A, Wójcikowski M, Zielenkiewicz P, et al. Tools4miRs – one place to gather all the tools for miRNA analysis. Bioinformatics. 2016;32:2722–2724.
- Ciesla M, Skrzypek K, Kozakowska M, et al. MicroRNAs as biomarkers of disease onset. Anal Bioanal Chem. 2011;401:2051–2061.
- Buschmann D, Kirchner B, Hermann S, et al. Evaluation of serum extracellular vesicle isolation methods for profiling miRNAs by next-generation sequencing. J Extracell Vesicles. 2018;7:1.
- Srinivasan S, Duval MX, Kaimal V, et al. Assessment of methods for serum extracellular vesicle small RNA sequencing to support biomarker development. J Extracell Vesicles. 2019;8:1.
- Kozomara A, Birgaoanu M, Griffiths-Jones S. MiRBase: from microRNA sequences to function. Nucleic Acids Res. 2019;47:D155–D162.
- Wu CW, Evans JM, Huang S, et al. A comprehensive approach to sequence-oriented isomiR annotation (CASMIR): demonstration with isomiR profiling in colorectal neoplasia. BMC Genomics. 2018;19:401.
- Fiskaa T, Knutsen E, Nikolaisen MA, et al. Distinct small RNA signatures in extracellular vesicles derived from breast cancer cell lines. PLoS One. 2016;11:e0161824.
- Androvic P, Valihrach L, Elling J, et al. Two-tailed RT-qPCR: A novel method for highly accurate miRNA quantification. Nucleic Acids Res. 2017;45:e144-e144.
- Tan GW, Khoo ASB, Tan LP. Evaluation of extraction kits and RT-qPCR systems adapted to high-throughput platform for circulating miRNAs. Sci Rep. 2015;5:1–8.
- Jeppesen DK, Fenix AM, Franklin JL, et al. Reassessment of exosome composition. Cell. 2019;177:428–445.e18.
- Koppers-Lalic D, Hackenberg M, Bijnsdorp I, et al. Nontemplated nucleotide additions distinguish the small RNA composition in cells from exosomes. Cell Rep. 2014;8:1649–1658.
- Koppers-Lalic D, Hackenberg M, de Menezes R, et al. Non-invasive prostate cancer detection by measuring miRNA variants (isomiRs) in urine extracellular vesicles. Oncotarget. 2016;7:22566–22578.
- Li D, Liu J, Guo B, et al. Osteoclast-derived exosomal miR-214-3p inhibits osteoblastic bone formation. Nat Commun. 2016. DOI:10.1038/ncomms10872.
- Mukherjee K, Ghoshal B, Ghosh S, et al. Reversible HuR-micro RNA binding controls extracellular export of miR-122 and augments stress response. EMBO Rep. 2016;17:1184–1203.
- Alexander M, Hu R, Runtsch MC, et al. Exosome-delivered microRNAs modulate the inflammatory response to endotoxin. Nat. Commun. 2015;6. DOI:10.1038/ncomms8321.
- Batool A, Hill TDM, Nguyen NT, et al. Altered biogenesis and MicroRNA content of hippocampal exosomes following experimental status epilepticus. Front Neurosci. 2020;13. DOI:10.3389/fnins.2019.01404.
- Cha DJ, Franklin JL, Dou Y, et al. KRAS-dependent sorting of miRNA to exosomes. Elife. 2015. DOI:10.7554/eLife.07197.
- Van Balkom BWM, Eisele AS, Pegtel DM, et al. Quantitative and qualitative analysis of small RNAs in human endothelial cells and exosomes provides insights into localized RNA processing, degradation and sorting. J Extracell Vesicles. 2015;4:26760.
- Wyman SK, Knouf EC, Parkin RK, et al. Post-transcriptional generation of miRNA variants by multiple nucleotidyl transferases contributes to miRNA transcriptome complexity. Genome Res. 2011;21:1450–1461.
- Gutierrez-Vazquez C, Enright AJ, Rodríguez-Galán A, et al. 3′uridylation controls mature microRNA turnover during CD4 T cell activation. Rna. 2017;11:rna.060095.116.
- Schamberger A, Orbán TI. 3′ IsomiR species and DNA contamination influence reliable quantification of microRNAs by stem-loop quantitative PCR. PLoS One. 2014;9:1–13.
- López-Longarela B, Morrison EE, Tranter JD, et al. Direct detection of circulating microRNA‐122 using dynamic chemical labelling with single molecule detection overcomes stability and isomiR challenges for biomarker qualification. bioRxiv. 2019.
- Honda S, Kirino Y. Dumbbell-PCR: A method to quantify specific small RNA variants with a single nucleotide resolution at terminal sequences. Nucleic Acids Res. 2015;43:e77.
- Kozomara A, Griffiths-Jones S. MiRBase: annotating high confidence microRNAs using deep sequencing data. Nucleic Acids Res. 2014;42:68–73.
- Kozomara A, Griffiths-Jones S. MiRBase: integrating microRNA annotation and deep-sequencing data. Nucleic Acids Res. 2011;39:152–157.
- Fromm B, Billipp T, Peck LE, et al. A uniform system for the annotation of vertebrate microRNA genes and the evolution of the human microRNAome. Annu. Rev. Genet. 2015;49:213–242.
- Wang Y, Gao X, Wei F, et al. Diagnostic and prognostic value of circulating miR-21 for cancer: A systematic review and meta-analysis. Gene. 2014;533:389–397.