
ABSTRACT
Extracellular vesicles (EVs) have been implicated in a wide variety of biological activities, have been implicated in the pathogenesis of numerous diseases, and have been proposed to serve as potential biomarkers of disease in human patients and animal models. However, characterization of EV populations is often performed using methods that do not account for the heterogeneity of EV populations and require comparatively large sample sizes to facilitate analysis. Here, we describe an imaging-based method that allows for the multiplexed characterization of EV populations at the single EV level following centrifugation of EV populations directly onto cover slips, allowing comprehensive analysis of EV populations with relatively small samples. We observe that canonical EV markers are present on subsets of EVs which differ substantially in a producer cell and cargo specific fashion, including differences in EVs containing different HIV-1 proteins previously reported to be incorporated into pathogenic EVs. We also describe a lectin binding assay to interrogate EVs based on their glycan content, which we observe to change in response to pharmacological modulation of secretory autophagy pathways. These studies collectively reveal that a multiplexed analysis of EV populations using fluorescent microscopy can reveal differences in specific EV populations that may be used to understand the biogenesis of specific EV populations and/or to interrogate small subsets of EVs of interest within larger EV populations in biological samples.
Introduction
Cells release populations of extracellular vesicles (EVs) of various sizes which contain a multitude of cargoes including RNA, proteins, and lipids [Citation1–Citation3]. While EVs were once thought to be relegated strictly to the task of shedding unwanted cellular waste, it is now appreciated that EVs play an integral role in cell-to-cell communication [Citation4] and that all cell types produce EVs under both healthy and pathological cellular states [Citation5]. As a result, understanding mechanisms associated with the transport and characterization of EVs has become an increasingly important. In particular, by identifying specific EV cargoes under pathological conditions, EVs have the potential to be excellent biomarkers to assist in earlier detection and diagnosis of a variety of diseases [Citation6,Citation7].
The most often cited subtypes of EVs are exosomes, microvesicles, and apoptotic bodies, which are derived from distinct mechanisms and sub-cellular compartments. As a result, the different EV subtypes are characterised based on their size, protein composition and origin [Citation3,Citation8–Citation10]. Exosomes are typically appreciated to range between 30 and 150 nm in diameter and originate as intraluminal vesicles (ILVs) formed within multivesicular bodies (MVBs) [Citation3,Citation8–Citation10]. The process of secretory autophagy leads to the release of an EV population similar to exosomes, which is known to be upregulated by lysosomal dysfunction [Citation11–Citation14]. In comparison, microvesicles have a more dynamic size range (i.e. 20–1000 nm in diameter) and bud directly from the plasma-membrane, while apoptotic bodies are much larger (>1000 nm) in diameter and originate from dying cells [Citation3,Citation8–Citation10]. In addition to size, researchers often validate the isolation of exosomes or EVs by demonstrating the presence of specific cellular proteins, including the tetraspanins CD9, CD63, and CD81 [Citation1,Citation8,Citation15–Citation17].
Experimentally, EV populations are typically isolated and separated from cell debris via a series of centrifugation steps [Citation17,Citation18]. Other commonly employed isolation methods include filtration and purification based on highly enriched EV markers. These isolated EVs can then be used for a variety of assays, such as western blots, ELISAs, or mass spectrometry to measure protein composition. Utilizing these techniques and defining EVs by these previously stated criterion has led to an impressive advancement in understanding the differences in EV composition and their potential impact on neighbouring cells [Citation19]. However, there is also accumulating evidence indicating that in spite of existing criteria to classify EVs, heterogeneous populations of EVs exist [Citation8–Citation10,Citation19,Citation20] and these subpopulations of EVs are insufficiently resolved using currently used approaches. Other studies reveal that alterations of cellular homoeostasis in EV producing cells can alter the quantity and quality of the EVs released from cells [Citation21]. These observations suggest that bulk analysis of EV populations following centrifugation or other methods that analyse the molecular composition of all EVs in a sample fail to reveal heterogeneity in EV populations, especially in cases where potentially pathological or therapeutic populations of EVs exist as a subpopulation within a larger population of EVs. Thus, it is increasingly important that methods be created to distinguish EV subpopulations.
To address this issue, we formulated an imaging-based workflow that utilises quantitative fluorescent microscopy to characterise individual EVs via Multiplexed Analysis of Co-localization (EV-MAC) of their protein and glycan determinants. This method extends on previous studies imaging studies which have demonstrated that fluorescent fusion proteins are incorporated into EVs [Citation22–Citation24] to provide a workflow to interrogate EV populations for the presence of native, endogenous cellular proteins and glycan determinants. Following validation of this methodology, we characterised EVs produced from different cell types or cells expressing different HIV-1 proteins which are reported to be extruded in pathological exosomes [Citation25] and observed differences in the presence of canonical EV markers in these EV populations. We also examined the EVs released from cells following inhibition of lysosomal degradation, which is known to induce the release of pathological EVs in the context of neurodegenerative disease [Citation26,Citation27] and observe that lysosomal inhibition alters the glycan signature of the EV population released from cells under these conditions. Finally, we show that utilization of lectin staining or fluorescent membrane dyes can allow for the interrogation of EVs from biological samples, including saliva and plasma. These results collectively provide a platform by which to interrogate the presence of proteins or glycans in specific EV subpopulations, which could potentially provide insight into the biogenesis of EV populations or aid in the discovery of biomarkers associated with pathological EVs.
Materials and methods
Tissue culture
The HEK293T (CRL-3216) and the THP-1 (TIB-202) immortalised cell-lines were purchased from the American Type Culture Collection (ATCC). HEK293T and THP-1 cells were cultured at 37°C and 5% CO2 in Dulbecco’s modified Eagle’s Medium (DMEM) containing phenol red (Invitrogen) or Roswell Park Memorial Institute (RPMI) 1640, supplemented with the 10% foetal bovine serum (FBS) (Hyclone), 10 µg/mL ciprofloxacin hydrochloride, 100IU/mL penicillin, and 100 µg/mL streptomycin. To generate EV depleted media, FBS was diluted 4x in DMEM or RPMI was ultracentrifuged for 18 h, depending on the intended cell type. Afterwards the supernatant was collected and added to either DMEM or RPMI and supplemented with antibiotics.
Stabile expression of S15 mCherry construct
HEK293Tand THP-1 cells were transduced to stably express S15-mCherry using the lentiviral vector (pLVX) backbone containing a CMV promoter to drive the expression of S15-mCherry. Lentiviral particles were generated by polyethylenimine (PEI) transfection of HEK293T cells. The transfection was performed overnight with equal DNA concentrations of VSV-g, ΔNRF or psPax2, and pLVX-CMV-S15-mCherry plasmid. The next morning the cell medium was changed. The cultured medium from the transfected HEK293T cells was collected 48 h later and filtered through a 0.45 µm syringe filter (Millipore). The purified medium was directly added to THP-1 cells. 72 h later the cells were selected for expression of our S15-mCherry construct by supplementing DMEM or RPMI 1640 with 5 µg/mL puromycin (Hyclone).
Generation of GFP fusion protein constructs
Expression plasmids containing HIV-1 proteins TAT, VPR, and NEF were all generated by PCR based cloning and restriction enzyme strategies. Primers against TAT, VPR, and NEF proteins were created and either first inserted into the pEGFP-N1 plasmid to create N-terminal GFP fusion constructs of TAT and NEF followed by subcloning into the lentiviral (pLVX) plasmid or directly inserted in pLVX C1-GFP in the case of VPR.
Transfection of HIV-1 GFP constructs
HEK293T cells were transfected at approximately 60% confluency using Polyethylenimine (PEI), and either pLVX TAT-GFP, GFP-VPR, or NEF-GFP plasmids overnight. The media was changed after overnight transfection and collected 48 h later. EVs in the cultured media was concentrated via ultracentrifugation as described below.
Purification of extracellular vesicles
HEK293T Cells were plated in a 10 cm or 15 cm tissue culture plate at 50% confluency with either 10 mL or 25 mL of media, respectively, for 48 h before media was collected. THP-1 cells were cultured in flasks at a concentration range of 400,000 to 600,000 cells per mL. EVs were isolated in a 15 mL or 50 mL conical which was centrifuged in a tabletop centrifuge at 2000× g for 20 min at 4°C. The supernatant was collected and added to either Beckman Coulter polycarbonate centrifuge tubes (#349622) or (#344058) and spun at 10,000× g with either SW41 TI or SW28 Beckman rotors, respectively, in an Optima L-90K ultracentrifuge at 4°C for 30 min. Subsequently, the supernatant was collected and ultracentrifuged at 100,000× g for 150 min at 4°C using new centrifuge tubes, as above. Afterwards, the supernatant was discarded, and the pellet was resuspended in PBS. The resuspended pellet was subjected to another round of 100,000× g centrifugation with same rotor and machine for 150 min at 4°C. The supernatant was discarded, and the pellet was resuspended overnight in 100 µL of PBS on an orbital shaker. The resuspended pellets were stored at 4°C and used within 2 weeks. Resuspended EVs were visually inspected before use to verify that a new pellet had not formed before use.
Non-reducing SDS-PAGE, western blots and western antibodies
Proteins from pelleted cells or concentrated media were isolated by the addition of lysis buffer composed of 100 mM Tris pH 8.0, 1% NP- 40, and 150 mM NaCl and protease inhibitor cocktail (Roche) on ice for 30 min. The lysates were centrifuged for 10 min at 10,000× g and afterwards the supernatant collected. The collected supernatants’ protein concentrations were determined by Pierce BCA protein assay kit (Thermo Scientific). An equal fraction of non-reducing SDS solution was added to the proteins and the contents were boiled on a dry-block for 5 min. Subsequently, the protein contents were equally loaded and ran on a 10% polyacrylamide gel for SDS-polyacrylamide gel electrophoresis (SDS-PAGE). After separation, the proteins were transferred to a nitrocellulose membrane (Bio-Rad), and probed overnight at 4°C with the respective primary antibodies diluted in powdered milk block solution at 2.5 g/50 mL of TBST: mouse anti-CD9 (BD Pharmingen #555370) 1:1000; mouse anti-CD63 (BD Pharmingen #5556019) 1:1000; mouse anti-CD81 (BD Pharmingen #555675) 1:1000; rabbit anti-TSG101 (Abcam ab125011) 1:1000; rabbit anti-LAMP1 antibodies (Abcam #24170) 1:2000; mouse anti-GAPDH (Santa Cruz SC-32233) 1:3000; or rabbit anti-mCherry (Novus bio NBP2-25157) 1:1000. The nitrocellulose was washed in TBST and probed with the respective HRP conjugated donkey anti-mouse or anti-rabbit (ThermoScientific) diluted in milk block solution at 1:10,000 for 30 min. HRP was detected with the addition of SuperSignal West Femto Chemiluminescent Substrate (Thermo Scientific) as measured by chemiluminescence levels using the FlourchemE Imaging System (Protein Simple).
Transmission electron microscopy and immunogold labelling
Concentrated EV samples were fixed in 2% paraformaldehyde for 30 min at room temperature. Formvar- and carbon-coated 200 mesh nickel grids (Electron Microscopy Sciences), pretreated with 0.002% Alcian blue in 0.03% acetic acid to increase the hydrophilicity of the grids, were floated on top of 50 µL drops of fixed EV samples for 20 min at room temperature. The grids were washed thrice in PBS then incubated with 50 mM glycine to quench free aldehyde groups. After the grids were thoroughly washed, they were incubated in PBS containing 5% bovine serum albumin (BSA), 0.1% cold water fish skin gelatin, and 5% normal goat serum (Electron Microscopy Sciences) for 30 min at room temperature. Grids were thoroughly washed with PBS containing 0.2% acetylated bovine serum albumin (BSA-c) (Electron Microscopy Sciences) then incubated with PBS-0.2% BSA-c containing 0.05% saponin and either mouse anti-human CD63 (BD Pharmingen #5,556,019) (1:20) or mouse anti-human CD81 (BD Pharmingen #555,675) (1:20) for 2 h at room temperature. The grids were thoroughly washed in PBS-0.2% BSA-c then incubated with goat anti-mouse IgG conjugated to 20 nm gold (Cytodiagnostics #AC-20-02) (1:20). The grids were incubated with 1% glutaraldehyde for 15 min at room temperature then thoroughly washed with deionised water. The sample was negatively stained by floating the grid on a 50 µL drop of uranyl-oxalate (pH 7) for 5 min at room temperature followed by floating the grid on an 50 µL drop of a methyl cellulose-uranyl acetate-phosphotungstic acid (MC-UA-PTA) solution (700 µL 2% methyl cellulose, 100 µL 3% uranyl acetate (pH 3.5), 25 µL 1% phosphortungstic acid (pH 7.2), and 75 µL deionised water) for 10 min on wet ice. After the grids were removed from the MC-UA-PTA solution with nichrome loops (3.5 mm internal diameter, Ted Pella, Inc), they were blotted against a sheet of Whatman filter paper so that a thin layer of film was left on the EV side of the grid. The sample was placed into a grid storage box and allowed to dry for 12 h prior to imaging with a Philips CM120 transmission electron microscope (TSS Microscopy) equipped with a BioSprint 16-megapixel digital camera (Advanced Microscopy Techniques).
Immunofluorescence staining
In order to adhere EVs to coverslips, either 80 µL of resuspended concentrated EV was added to 420 µL of PBS totalling 500 µL or, for unconcentrated EVs, 500 µL of supernatant cultured media was added into the well of 24-well plate containing a glass coverslip (Fischerbrand microscope cover slides, 12–545-J, 22 × 60–1). Coverslips were initially held in a 50 ml conical in 70% ethanol and were added to individual wells of a tissue culture, 24-well plate and subsequently washed with PBS three times. The final round of PBS was left in the well and aspirated immediately before continuing. The contents of the 24-well plate were spinoculated by centrifugation at 13°C for 2 h at 1200× g onto the coverslips and subsequently fixed in a solution of 0.1 M PIPES containing 3.7% formaldehyde (Polysciences) for 15 min and washed 3 times with PBS. The coverslips were permeabilised with a 0.1% solution of saponin in block solution composed of 500 mL of PBS supplemented with 10% normal donkey serum (NDS), and 0.01% NaN3 for 5 min. After washing 3 times, the coverslips were incubated with rabbit anti-LAMP1 antibodies (Abcam #24170) or rabbit anti-TSG101 (Abcam ab125011) and either mouse anti-CD9 (BD Pharmingen #555370), mouse anti-CD63 (BD Pharmingen #5556019), or mouse anti-CD81 (BD Pharmingen #555675), in the previously stated block solution for 1 h at room temperature. All primary antibodies were used at 1:1000. In experiments using lectins, biotin conjugated lectins (Vector Laboratories) were used at a working concentration of 5 μg/mL in place of primary antibodies for 1 h at room temperature. Afterwards the coverslips were washed with PBS and subsequently incubated with secondary antibodies of conjugated donkey anti-mouse 488 (Jackson ImmunoResearch Laboratories, Inc.) and donkey anti-rabbit 647 (Jackson ImmunoResearch Laboratories, Inc.) at a concentration of 1:400 for 30 min at room temperature diluted in PBS block solution and washed with PBS. Additionally, FITC conjugated streptavidin (SAV) (Jackson ImmunoResearch Laboratories, Inc. 016-600-084) at 1:1000 was added for 1 h at room temperature, diluted in PBS block, and washed with PBS. Afterwards, coverslips were fixed and mounted (Electron Microscopy Sciences, Fluoro-gel with Tris buffer, #17985-11) onto slides (Globe Scientific Inc., Diamond White Glass 25 × 75 × 1 mm, .5 gloss, #1380-30). In experiments using poly-L-lysine coated coverslips, coverslips were coated by adding 500 µL of 0.1% of poly-L-Lysine solution (Sigma Aldrich) to the well and incubated at 37°C for 1 h. Following incubation, the coverslips were washed 3x with PBS before continuing with spinoculations.
Indirect ELISA
LAMP1 (Abcam #24170) antibody was diluted in pH 9.6 carbonate buffer to a final concentration of 4 µg/mL and used to coat the wells of a 96-well Maxisorp ELISA Plate (NUNC) at 4°C for 16 h on orbital shaker. The wells were washed with PBS thrice before being blocked in equal portions of 10% BSA supplemented DMEM and PBS for 2 h at room temperature and subsequently washed 5x with PBS. 25 µL of concentrated EVs resuspended in PBS were added to each well for 24 h at 4°C. Wells were washed eight times with PBS. Detection antibodies, either CD9, CD63, CD81 (BD Pharmingen) diluted to a final concentration of 625 ng/mL in 1x ELISA Diluent Solution (eBioscience), were added to sample captured wells for 24 h at 4°C on orbital shaker. Afterwards, wells were washed with PBS five times before secondary anti-mouse HRP conjugated antibodies diluted in 1x ELISA Diluent Solution were added for 30 min at room temperature on rocker. A final five times wash of the plate with PBS was conducted before 100 µL of 1 x TMB (Invitrogen) was added for ~15 min before the reaction was quenched with 2N H2SO4 solution. The absorbance was read at 450 nm on BioTek PowerWave XS plate reader in conjunction with Gen5 software. Three independent replicates were conducted from independent preparations of S15-mCherry (S15Ch) isolated EVs that were concentrated by ultracentrifugation as described previously. The concentrated EVs were resuspended in 250 µL of PBS. The same PBS was used as a control and added to wells in which LAMP1 capture antibodies and either CD9, CD63, CD81 detection antibodies, followed by secondary anti-mouse HRP conjugated antibody solutions were used.
Human bodily fluid sample collection, preparation, and processing
Saliva
Whole saliva from a healthy male or female donor between the ages of 25 and 32 was collected according to a previously published saliva collection protocol [Citation28]. Samples were either stored at 4°C for no more than 36 h, or at −20°C until needed. If frozen, samples were thawed at room temperature. The saliva was sequentially centrifuged. The initial centrifuged using in 2 ml eppendorfs in a tabletop centrifuge at 2000× g for 20 min at 4°C. The supernatant was collected, pooled, and added to Beckman Coulter polycarbonate centrifuge tubes (#349622) and spun at 10,000× g with SW41 TI Beckman rotors in an Optima L-90K Ultracentrifuge at 4°C for 30 min. Subsequently, the supernatant was collected and ultracentrifuged at 100,000× g for 150 min at 4°C using new of the previously stated tubes, rotors, and ultracentrifuge. Afterwards, the supernatant was discarded, and the pellet was resuspended in PBS. The resuspended pellet was subjected to another round of 100,000× g centrifugation with same rotor and machine for 150 min at 4°C. The supernatant was discarded, and the pellet was resuspended overnight in 500 µL of PBS on an orbital shaker. The pelleted EVs were stored at −20°C until needed and thawed at room temperature.
In these experiments, 2 ml of saliva was subjected to differential ultracentrifugation, and 50 µL of concentrated saliva EVs were mixed with 450 µL of PBS so that a total volume of 500 µL was added to glass coverslips in a 24-well plate. The plate was spun at 13°C for 2 h at 1200× g to spinoculate the samples onto the coverslips. The coverslips were fixed in a solution of 0.1 M PIPES with 3.7% formaldehyde (Polysciences) for 15 min and washed 3 times with PBS, followed by a 5 min permeabilization step using a 0.1% saponin block solution composed of 500 mL of PBS supplemented with 10% normal donkey serum (NDS), and 0.01% NaN3 and washed another 3 times with PBS. The spinoculated saliva was incubated with biotin-conjugated wheat germ agglutinin (WGA) (Vector Laboratories, B-1025) (at working concentration of 5 µg/mL) at room temperature for 1 h resuspended in the block solution like the aforementioned one, but without the 0.1% saponin. After 1 h of incubation, the WGA solution was removed, and the samples washed 3 times with PBS. The samples were incubated with FITC conjugated streptavidin (SAV) (Jackson ImmunoResearch Laboratories, Inc. 016-600-084) (1:2000) at room temperature for 1 h, again in the saponin-free block solution. After another 3 washes of PBS, the samples were incubated with rabbit anti-Lamp1 antibody (Abcam #24170) (1:1000) and mouse anti-CD63 (BD Pharmingen #5556019) (1:1000) at room temperature for 1 h, again in the block solution without the saponin. Samples were washed 3 times with PBS, and incubated in the no saponin block with secondary Fab antibodies conjugated donkey anti-mouse 594 (Jackson ImmunoResearch Laboratories, Inc.) (1:400) and donkey anti-rabbit 647 (Jackson ImmunoResearch Laboratories, Inc.) (1:400) at room temperature for 30 min. Coverslips were washed 3 times with PBS and mounted onto to glass slides. This yielded on average 1245 WGA puncta per image.
Plasma
Whole blood from three healthy male donors between the ages of 22 and 36 was drawn into conicals containing 10%, by volume, of 3.8% sodium citrate, and subsequently homogenised in new concials. Lymphocyte separation medium (Corning 25-072-CV) was carefully layered into the bottom of the conical, and the whole blood was spun at 400× g for 15 min. The plasma layer was carefully pipetted out, aliquoted, and immediately stored at −80°C until needed. Frozen samples were thawed at room temperature and was sequentially centrifuged. The initial centrifugation was done using in 2 mL eppendorfs in a tabletop centrifuge at 2000× g for 20 min at 4°C. The supernatant was collected, pooled, and added to Beckman Coulter polycarbonate centrifuge tubes (#349622) and spun at 10,000× g with a SW41 TI Beckman rotor in an Optima L-90K Ultracentrifuge at 4°C for 30 min. Subsequently, the supernatant was collected and ultracentrifuged at 100,000× g for 150 min at 4°C using new of the previously stated tubes, rotors, and ultracentrifuge. Afterwards, the supernatant was discarded, and the pellet was resuspended in PBS. The resuspended pellet was subjected to another round of 100,000× g centrifugation with same rotor and machine for 150 min at 4°C. The supernatant was discarded, and the pellet was resuspended overnight in 500 µL of PBS on an orbital shaker. The pelleted EVs were stored at −20°C until needed and thawed at room temperature.
In these experiments, 2 mL of plasma was subjected to differential ultracentrifugation, and 50 µL of concentrated plasma EVs were mixed with 450 µL of PBS so that a total volume of 500 µL was added to glass coverslips in a 24-well plate. Plasma samples were spinoculated, fixed, and stained in the same manner as the saliva samples detailed above. This yielded on average 175 WGA puncta per image.
PKH dye labelling of EVs
EVs from saliva and plasma were isolated as previously described in the collection, preparation and processing methodology section. Similarly, wildtype or S15Ch 293Ts pelleted EVs were concentrated via previously described purification of extracellular vesicle methodology using starting volumes that filled SW28, Beckman Coulter polycarbonate centrifuge tubes (#344058). Afterwards, 293T concentrated EVs were directly resuspended in 100 µL of PBS, while saliva and plasma EVs were resuspended in 500 µL of PBS overnight on the orbital shake 4°C as described previously. To prepare the EVs for staining, 50 µL of either concentrated WT or S15Ch 293T EVs were added to 950 µL of Diluent C (Phanos Technologies) while 200 µL of concentrated saliva EVs or 500 µL of plasma EVs were added to 800 µL or 500 µL of Diluent C, respectively. Next, a master mix of 0.2 µL or 0.4 µL of PKH26 or PKH67 (Phanos Technologies) was added to 1 ml of Diluent C (Phanos Technologies) per sample to create a final concentration of 200 nM or 400 nM, respectively. A 200 nM PKH67 dye master mix was used for both saliva and plasma EVs. 1 ml of the PKH dye master mix was added to the 1 ml EVs and Diluent C mixture and was gently pipetted for 30 s, followed by being shaken at room temperate on an orbital shaker at 100rpm, for 5 min. Afterwards, the reaction was quenched by adding 2 ml of 10% BSA (Sigma-Aldrich, #05470) resuspended in PBS. 4.5 ml of serum free DMEM was added to the quenched reaction to a total volume of 8.5 ml. Next, to minimise turbulence, the 8.5 ml mixture was very gently floated on-top of a 1.5 ml .971 M sucrose (Sigma-Aldrich, #S9378) cushion in a Beckman Coulter polycarbonate centrifuge tube (#349622) and topped off with serum free DMEM. This was followed by centrifugation at 190,000× g for 2 h at 4°C via the SW41 TI rotor to pellet the EVs while removing excess dye. The supernatant and the sucrose cushion were carefully aspirated, and the pellet was resuspended in 500 µL of PBS by gentle pipetting. The resuspended S15Ch or WT 293T pellet was used immediately or stored at −20°C for later use. The resuspended saliva and plasma EVs were stored at −20°C until need and thawed at room temperature. In preparation for imaging, 250 µL of the WT or S15Ch resuspension was added to 250 µL of PBS and spinoculated onto uncoated coverslips per condition. Conversely, 50 µL of the thawed plasma or saliva EVs were added to 450 µL of PBS and spinoculated onto 0.1% Poly-L-Lysine (Sigma Aldrich) coated coverslips as described previously. EVs were then subjected to immunofluorescence staining as described in immunofluorescence staining methodology section.
Wide-field fluorescence deconvolution microscopy and analysis
Images of the EVs were taken with the DeltaVision wide field fluorescent microscope (Applied Precision, GE) outfitted with a digital camera (CoolSNAP HQ2; Photometrics), while using the oil immersion Olympus Plan Apo 60 × objective lens (1.42 numerical aperture) with ResolveTM immersion oil with a refraction index of 1.5150 (Richard Allen Scientific, #M3004). A 250 watt Xenon Arc lamp was used to direct excitation lighting from the back of the microscope and focused from below onto the coverslip held on an Olympus IX-71 stage. Dichroic filter set uses the Alexa setting: FITC Excitation: 475/28 Emission: 523/36; A594 Excitation: 575/25 Emission: 632/30; CY5 Excitation: 632/20 Emission: 676/34; DAPI Excitation: 390/18 Emission: 435/48. Exposure times range from experimental conditions depending on staining conditions. Conditions for S15Ch experiments use FITC exposure time of .05–.1 s; A594 exposure time of .08–.1 s; CY5 exposure time of .025–.1 s. 100% transmission was used for all exposure conditions. S15Ch EVs and WGA: FITC exposure time .05 s, 50% transmission; A594 exposure time of .1 s, 100% transmission. PKH26 Dye: FITC exposure time .01 s, 100% transmission; A594 exposure time of .05 s, 50% transmission; CY5 exposure time of .025 s, 100% transmission. PKH67 Dye: FITC exposure time .05 s, 50% transmission; A594 exposure time of .015 s, 100% transmission; CY5 exposure time of .025 s, 100% transmission. Exposure times were not altered among staining conditions of a collected sample. Exposure times were kept consistent among all collected samples and were only adjusted to prevent signal over-exposure. Secondary only conditions were collected and compared to determine thresholds for each collected sample.
The number of images taken per experiment is stated in the figure legend. Data were collected by Z-stack imaging and was analysed as maximum intensity projections. In each case, the images taken were from different locations on the coverslip with the intent of creating a representative sample of the total population. During some experiments, the “panels” function of the SoftWoRx software (Applied Precision) was used to take non-biased images with the same set of panels applied to each coverslip. In these cases, the z-stack distance was manually recalibrated for each coverslip to ensure that the images remained in focus.
Data were collected by capturing a total of 30–40 z-stacks at a depth of .2 µm between each stack. However, HIV-fusion protein data were collected by capturing 20 z-stacks at a depth of .5 µm. These dimensions were constant among coverslips and all data shown uses the same dimensional constants. Data were imaged so that Z-stacks started and ended on either side of the focal plane. The use of Z-stack imaging was used to facilitate the constrained Iterative deconvolution performed by SoftWoRx (Applied Precision, Inc.) a type of image restorative deconvolution to increase the signal-to-noise ratio (Lifting the Fog: Image Restoration by Deconvolution). The OTF used in the deconvolution process was a pre-recorded, empirically generated OTF for the 60 × 1.42NA Olympus Plan Apo objective created by Applied Precision Inc. for deconvolution. The CoolSnap HQ2 camera; the Olympus 60x Plan Apo Objective; the SoftWoRx deconvolution software and solid state illumination source; are all standard for the DeltaVision microscope system, which was initially purchased from Applied Precision, Inc. (Now GE Biosciences)
Collected Z-stack images were ultimately used as reconstructed 3D maximum intensity projections for analysis by with Bitplane: Imaris software version 7.6.4. These 3D reconstructions facilitated the formation of a 3D masking algorithms which we built around our signal of interest (i.e. S15Ch, an HIV-fusion protein, or a lectin) within the 3D deconvolved reconstructions. The deconvolved reconstructions were used for all data sets if not specifically addressed.
All S15 mCherry acquired 3D reconstructions were subjected to the same spots or surface masking algorithm or for HIV1 proteins, via the Batch Coordinator tool (Bitplane) to each respective signal. Non-representative images indicating that the focal plane containing EVs was not imaged as intended were removed. No more than 2 images per condition per replicate were excluded. Panels containing an example of a Spots algorithm are shown as maximum intensity projections (MIPs). Panels containing no spots algorithm are show as individual Z-Stacks within the 3D reconstruction.
Background levels of maximum intensity for each respective channel were determined based on secondary antibody controls for mouse (CD9, CD63, and CD81) or rabbit (LAMP1 or TSG101), and streptavidin(SAV)-only controls (WGA, LEL, etc) via a gating process analogous to flowcytometry. In cases where the threshold for above background signal was not visually obvious, the 99th percentile was determined and used as the threshold when all images collected from a single coverslip were pooled. When each image from a single coverslip was evaluated individually, the 95th percentile from each image was used and subsequently averaged to determine the above background signal value. The average number of THP-1 EVs among experiments was in the range of 50–800 per image depending on the condition and sample preparation.
To remove aggregates that were initially identified by our Spots masking algorithm, we exclude Spots with more than 85 voxels. This was conducted by excluding Spot’s masks’ data generated from the batching process which is provided under the “voxels” spreadsheet and contains the voxel number of each spot identified. The visualization of these excluded spots was conducted by going to the “Filters tab” of the Spots masking algorithm and changing the max inclusion threshold to 85 voxels. Afterwards, a secondary Spots algorithm was created with the applied voxel filter by “Replicating Spots”. A more in-depth explanation of how to exclude initially included spots and the advantages to doing this rather than adding increased exclusion criteria is provided in the legend of Supplemental Figure 3.
Bitplane Imaris spots and surface algorithm generation
The exact spots algorithm for our unconcentrated and concentrated Spots is as follows:
[Algorithm]
Enable Region Of Interest = false
Enable Region Growing = true
Enable Tracking = false
[Source Channel]
Source Channel Index = 2
Estimated XY Diameter = 0.300 um
Estimated Z Diameter = 0.600 um
Background Subtraction = true
[Classify Spots]
“Quality” above 25.0
“Distance to Image Border XY” between 2.00 um and 64.0 um
[Spot Region Type]
Region Growing Type = Local Contrast
[Spot Regions]
Region Growing Automatic Threshold = false
Region Growing Manual Threshold = 40
Region Growing Diameter = Diameter From Volume
Create Region Channel = false
Small variations of this algorithm were used for other experiments. However, the core gating variables remain relatively unchanged.
In experiments in which the surfaces mask feature in Imaris Bitplane was used, the surfaces mask algorithm was created using the same gating strategy as the spots mask, with the key parameter being “sphericity” instead of quality. A representative surfaces algorithm is shown below:
[Algorithm]
Enable Region Of Interest = false
Enable Region Growing = false
Enable Tracking = false
[Source Channel]
Source Channel Index = 1
Enable Smooth = true
Surface Grain Size = 0.100 um
Enable Eliminate Background = true
Diameter Of Largest Sphere = 0.400 um
[Threshold]
Enable Automatic Threshold = false
Manual Threshold Value = 234
Active Threshold = true
Enable Automatic Threshold B = false
Manual Threshold Value B = 5288.04
Active Threshold B = false
[Classify Surfaces]
“Sphericity” above 0.810
“Position X” between 2.00 um and 64.0 um
“Position Y” between 2.00 um and 64.0 um
Sensitivity and detection in deconvolved and undeconvolved images
15 fields from a dilute solution of tetraspecks, ranging from 1–6 beads, with increasing exposure times in the FITC channel stopping at .1 s exposure time (Supplemental Figure 4). To determine if the difference in spot number was a consequence of deconvolution artefacts, we manually compared the images and the relative ability of our algorithm to identify individual puncta. Our algorithm did not detect puncta in deconvolved images that were not identifiable in undeconvolved images at longer exposure conditions. between the undeconvolved and deconvolved counterparts; representative examples shown in Supplemental Figure 4(a)). the differences observed appeared to be from our Spots masking algorithm’s inability to distinguish the signal at our algorithm parameters. Collectively, the deconvolved’s images had a ~ 4.26-fold increase in signal compared to their undeconvolved counterpart, suggesting the differences in spot number were the result of increased signal-to-noise (Supplemental Figure 4(b)). To determine if these results were comparable under conditions that better simulate what we normally observe for EVs, we used the same experimental paradigm for two separate coverslips with more concentrated bead concentrationsthe number of spots recognised at each exposure condition for the undeconvolved and deconvolved counterparts, we observed that the spots algorithm quickly recognised the signal in the deconvolved fields and remained at the same number while the undeconvolved fields reached was less sensitive at lower exposure conditions (Supplemental Figure 4(c)).
Serial dilutions of S15Ch EVs
200 µL of concentrated S15Ch EVs, as previously described, were resuspended in 1 ml of PBS to generate the stock dilution of concentration X. 600 µL of our stock dilution was serially added to eppendorfs containing 600 µL of PBS to generate subsequent S15Ch dilutions of .5X, .25X, .125X, .0625X, and .03125X. From each dilution, 100 µL was saved for bicinchoninic acid (BCA) assay to determine initial protein concentration, while 500 µL of each dilution was spinoculated onto coverslips that were coated with 0.1% poly-L-lysine, as described previously. After spinoculation, the PBS and EV mixture was collected and reserved for BCA to determine the post-spinoculation protein concentration, and the coverslips were fixed and stained with CD81 and LAMP1 as previously explained. Z-stack images of the coverslips were collected using the points function to generate 15 unbiased 3D reconstructions and number of S15Ch puncta and CD81 puncta were measured using the following Spots algorithm:
[Algorithm]
Enable Region Of Interest = false
Enable Region Growing = true
Enable Tracking = false
[Source Channel]
Source Channel Index = 1 (CD81), 2 (S15Ch)
Estimated XY Diameter = 0.300 um
Estimated Z Diameter = 0.600 um
Background Subtraction = true
[Classify Spots]
“Quality” above 150
“Distance to Image Border XY” above 2.00 um
[Spot Region Type]
Region Growing Type = Local Contrast
[Spot Regions]
Region Growing Automatic Treshold = false
Region Growing Manual Threshold = 29
Region Growing Diameter = Diameter From Volume
Create Region Channel = false
To determine the initial and post-spinoculation protein concentration, a modified version of the PierceTM BCA Protein Assay Kit (ThermoScientific, #23225) protocol was used in conjunction with its kit. The bovine serum albumin (BSA) standard was initially serial diluted to create a standard curve to better assist in measuring protein concentrations within the expected protein concentrations of our EVs. To generate a standard curve, the initial standard was prepared by adding 8 µL of 20% SDS, to 4 µL of 2 mg/ml of BSA, and 108 µL of PBS. 60 µL was serial diluted by mixing with a mixture of 56 µL of PBS and 4 µL of 20% SDS. This was conducted 10 times. A negative control was also prepared by adding 4 µL of 20% SDS to 56 µL of PBS. Subsequently, 30 µL of each standard as well as the negative control were plated in duplicate in a 96-well plate (Pierce, #15041). Samples were prepared by adding 30 µL of each sample in duplicate with the addition of 2 µL of 20% SDS. The plate was added to an orbital shaker for 30 s. Afterwards, a 170 µL of Reagent A and Reagent B mixed at a ratio of 20:1 was added to each well by 12-well multichannel pipetter. A plate-sealer was added to the 96-well plate and the plate was incubated at 37 C for 4 h before being read on BioTek PowerWave XS plate reader in conjunction with Gen5 software at an absorbance wavelength of 562 nm.
Empirical measurement of the point spread function and binning
To measure the point spread function (PSF), 100 nm Tetraspeck (Invitrogen, T7279) Microspheres were originally diluted 1:5000 in purified water and applied to coverslips based on the manufacture’s protocol. Ten fields containing 1-6 microspheres were collected as Z-stack images at a depth of .2 µm per stack. Each field was collected with increasing exposure times ranging across 0.005, 0.010, 0.015, 0.025, 0.05, 0.08, and 0.1 s. The microspheres were imaged in the FITC channel with the excitation laser set to 100% laser transmission and the DeltaVision microscopes Alexa filter set with same size pinhole. All images were captured with the CoolSNAP HQ2 (Photometrics) digital camera from the Olympus Plan Apo 60 × objective lens (1.42 numerical aperture), while using ResolveTM immersion oil with a refraction index of 1.5150 (Richard Allen Scientific, #M3004).
The Point Spread Function (PSF) was calculated both before and after deconvolution which includes using a bin size of 2 × 2 to enhance sensitivity as in EV-MAC experiments (Supplemental Figure 5(a)). Fields containing 1-6 fluorospheres, with increasing exposure conditions were imaged to calculate the PSF by determining the full width half max (FWHM) from individual fluorospheres with the single pinhole function of the ImageJ plugin, Adrian’s FWHM. Adrian’s FWHM (Martin, A. (2008). (http://imagej.nih.gov/ij/plugins/ fwhm/index.html) uses a Levenburg-Marquardt implementation to apply a Gaussian fit to determine the PSF. This was conducted from 10 fields, and the same fluorosphere was measured for both undeconvolved and deconvolved images at all tested exposure conditions. As per the plugin designer’s recommendation, measured values with an error above 1e-6 were excluded. Undeconvolved images had lower PSF functions at all exposure conditions calculated when compared to the deconvolved (Supplemental Figure 5(a)). The PSF of S15Ch EVs and FITC tetraspecks (100 nm) revealed no significant differences, revealing that the majority of S15Ch EVs were below the resolution limit of our microscope (Supplemental Figure 5(b)). Similar resulted were observed using 1 × 1 binning (Supplemental Figure 5(c)). No differences were observed when images were analysed using 1 × 1 or 2 × 2 binning (Supplemental Figure 5(d)).
Results
In order to allow EVs secreted from cultured cells to be visualised, we transduced HEK 293T cells to express a S15-mCherry construct (S15Ch). The S15Ch construct contains the 15N-terminal amino acids of c-SRC appended to the N-terminal of the mCherry fluorescent protein. It has previously been shown that these 15 amino acids are necessary and sufficient for the addition of the myristoyl lipid anchor on the N-terminal glycine of c-SRC, leading to its plasma membrane localization [Citation29,Citation30]. In experiments in which this construct was used to label HIV-1 viral particles [Citation29,Citation30], we also observed that this construct is incorporated into EVs which lack HIV-1 p24 and is released from cells constitutively and independently of virus production [Citation29], similar to the manner in which a palmitoylated fluorescent protein is incorporated into EV populations when expressed in cells [Citation24]. To verify that this construct was incorporated into EVs, we collected culture supernatant from 293T cells expressing S15Ch following transient transfection and isolated EVs by differential ultracentrifugation. The S15Ch construct was observed within the ultracentrifuged EV fraction, which also contained the canonical exosomal proteins, CD9, CD63, and CD81 as well as LAMP1 and TSG101 () and Supplemental Figure 1). To determine if the S15Ch protein was associated with EV membranes, we also added 0.1% SDS to cultured medium prior to ultracentrifugation. The addition of SDS, which causes disruption of lipid membranes, eliminated the presence of S15Ch recovered following ultracentrifugation ()), demonstrating that S15Ch is incorporated into EVs. Transmission electron microscopy of EVs isolated by ultracentrifugation revealed lipid enclosed structures between 30 and 150 nm in diameter and were positive for CD63 and CD81 ()), consistent with what is reported for EVs [Citation3,Citation8–Citation10].
Figure 1. Detection of endogenous protein markers on EVs released from 293T cells. (a) Non-reducing SDS-Page transferred to nitrocellulose of mCherry positive 293T cell lysate or S15Ch concentrated extracellular vesicles (EVs) by ultracentrifugation with or without the addition of.1% SDS before the concentration. Nitrocellulose was probed with antibodies against mCherry (band shown at ~30kDA), CD9 (band shown at ~25 kDA), CD63 (centre of band shown at ~50kDA), CD81 (band shown at ~22 kDA), and GAPDH (band shown at ~37 kDA). (b) Representative transmission electron microscopy images of concentrated S15Ch EVs showing primary antibodies against CD63 and CD81, respectively, and secondary anti-mouse conjugated to 20 nm gold particles. (c) Representative z stack of EVs from S15Ch 293T cells spinoculated onto a coverslip. The individual mCherry, CD63, and LAMP1 channels are shown, with a merge. (d) Panel of representative 3D maximum intensity projection reconstruction from z stack images demonstrating the S15Ch (S15Ch, red) channel alone (top) as well as the S15Ch signal with the spots masking algorithm generated in Bitplane Imaris imaging software (bottom). (e) Spots masking algorithm in (d) was used to calculate the percent of S15Ch EVs positive for the indicated proteins. XY co-localization plots of S15Ch spots and the maximum intensity of the mouse anti-tetraspanin (CD9, CD63, CD81) or their secondary antibody as a control on the X-axis and the maximum intensity of the rabbit ant-LAMP1 antibody or its secondary antibody as a control. identical staining in the absence of primary antibody was performed. XY graphs show co-localization from a single 3D reconstructed image. Green and Blue lines show the value determined to be above background based on the secondary antibody only controls. (f) Graphs show mean co-localization percent of each of the antibody staining paradigms indicated in (e) from a single coverslip where 20 z-stack images were taken. + (positive) and/or – (negative) reference the percent found from each quadrant of the co-localization plot; for example, S15Ch (+), CD81 (+), LAMP1 (+) references the top, right quadrant of the graph. Percentage of S15Ch spots described as positive or negative for each marker is indicated. Error bars display the mean and the standard deviation.
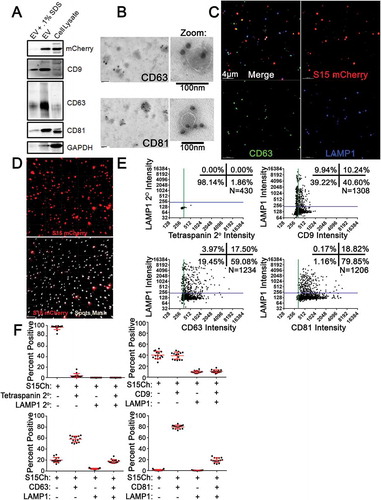
We next sought to determine if endogenous proteins which are known to be incorporated into EV populations could be detected on S15Ch+ EVs by immunofluorescence. To this end, we spinoculated [Citation31] EVs purified by ultracentrifugation or filtered tissue culture supernatant onto glass coverslips. This low-speed centrifugation (2 h at 1200× g) is sufficient to significantly increase viral binding to cells and coverslips, allowing them to be interrogated by immunofluorescence following fixation [Citation29,Citation31]. Following fixation, EVs were stained with a mouse antibody against the tetraspanin protein CD63 and a rabbit polyclonal antibody directed against LAMP1, two proteins known to be present in EV populations [Citation1,Citation8,Citation15,Citation16]. Following staining, coverslips were imaged using wide-field, fluorescent deconvolution microscopy, which is ideally suited for quantification of such specimens due to its sensitivity and field uniformity [Citation32]. Following acquisition of 3D z-stack images and deconvolution, a subset of S15Ch+ puncta could be observed to co-localise with both markers to some degree ()), although not all S15Ch+ puncta were positive for CD63 or LAMP1.
To further validate that the S15Ch signal observed represented intact EVs, we next asked if antibodies to mCherry could stain mCherry in the absence of detergent. We observed that labelling S15Ch EVs with α-mCherry antibody was detergent dependent, as the vast majority of the staining was eliminated in the absence of detergent (Supplemental Figure 2(a)).
Moreover, to independently validate our findings regarding the distribution of EVs double positive for LAMP1 and either CD9, CD63, or CD81, we utilised an indirect ELISA. CEVs from cultured media of S15Ch 293Ts were concentrated and subsequently captured on plates coated with LAMP1 antibodies. An equal amount of CD9, CD63, or CD81 was used as a detection antibody, followed by α-mouse antibody conjugated to HRP to determine the relative levels of each respective tetraspanin among the LAMP1 positive, captured EVs. We found that the ELISA signal generated correlated to the relative tetraspanin staining observed in EV-MAC analysis (Supplemental Figure 2(b,c)).
Immunofluorescence imaging to characterise EV populations by multiplexed analysis of co-localization (EV-MAC)
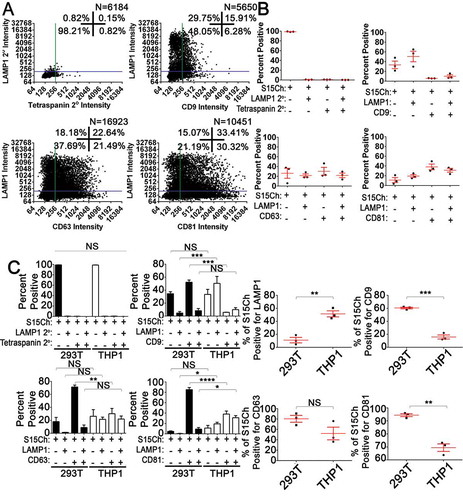
We next determined if this approach could allow for the reproducible multiplexed analysis of EV populations based on the markers present on EVs detected by indirect immunofluorescence. To this end, we stained individual coverslips with mouse antibodies to the tetraspanins CD63, CD81 and CD9 and a rabbit polyclonal antibody directed against LAMP1. Following acquisition of 3D z-stack images and deconvolution, software-based algorithms were generated to identify individual S15Ch+ puncta using defined size and intensity criteria and create individual 3D masks around these puncta ()). Following manual validation of the algorithm in a subset of images to ensure that individual puncta were reliably identified, the algorithm was applied to all images collected and the multiplexed intensity of tetraspanin and LAMP1 staining present in each S15Ch+ puncta in these images was determined. As a control, we performed an identical analysis on uncultured media depleted of EVs. In this situation, virtually all of the algorithm identified surfaces were eliminated, demonstrating that S15Ch EVs are effectively identified with minimal background (Supplemental Figure 3(a)). Secondary antibody controls were used as a negative control to define the background staining intensity in each channel and establish threshold intensities above which individual EVs were considered positive for individual tetraspanins or LAMP1 staining ()). For example, greater than 98% of the S15Ch+ EVs analysed exhibited CD81 staining above background, while approximately 50% were positive for CD9 ()). Regardless of the tetraspanin examined in parallel, the amount of LAMP1 signal on these EVs was observed to be consistent, with approximately 20% of S15Ch+ EVs exhibiting LAMP1 staining above background ()). Multiplex analysis of EV populations identified by masking events identified in the S15Ch channel revealed differential staining of tetraspanin markers on these populations when data from individual images was examined. When data from multiple images were compared as technical replicates, the percentage of EVs positive for one or both markers was highly reproducible ()). For comparative purposes, we refer to this type of analysis as “individual image measurement”.
We also observed that pooling data from the entire dataset yielded the same result obtained when individual images were analysed as independent technical replicates ()) hereafter “pooled image measurement”. We found that the mean values obtained via both methodologies were highly reproducible across multiple independent cultured media and coverslip preparations, as nearly identical outcomes could be obtained regardless of analysis approach ()).
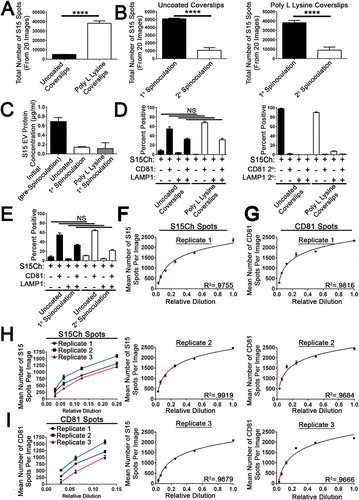
Figure 2. EV-MAC reproducibly stains EV populations following enrichment from tissue culture supernatant (a) Cultured media containing EVs were either left unconcentrated or concentrated via differential ultracentrifugation. The EVs were then stained with either CD9, CD63, CD81, in addition to LAMP1. Data show the mean value from three independently collected S15Ch 293T media preparations, where each of the media preparations were split among the four staining paradigms and spun onto a separate coverslip. 20 images were taken per coverslip. Error bars depict standard error of the mean. No significant differences were found among each respective staining paradigms among the unconcentrated and concentrated EVS when subjected to a two-way ANOVA with Tukey’s multiple comparison post-hoc test. (b) Data compares the mean value among three independent coverslips and media preparations for S15 mCherry co-localization as determined by either “each image measure” or “Pooled images measure. 20 images were taken per coverslip. All data shown was subjected to two-way ANOVA with Tukey’s multiple comparison post-hoc and found non-significant. All graphs depict error bars showing the mean with standard error of the mean.
Figure 3. Deconvolution does not change the co-localization distribution of S15Ch+ EVs with tetraspanins and LAMP1. (a) differential ultracentrifugation concentrated EVs from S15Ch 293T were spinoculated onto coverslips and subsequently stained with either CD9, CD63, CD81, in combination with LAMP1 or left unstained. Each condition was then subsequently stained with a mouse and rabbit secondary antibody. The secondary only control condition was used to determine the background fluorescence levels and the percent co-localization was determined for each image. Data shown is the mean value from three separate coverslips from independently collected media preparations. Within each preparation 15 images were taken per coverslip and the co-localization distribution was determined for each image and subsequently averaged to determine that samples co-localization. Data was found non-significant by one-way ANOVA when compared among the undeconvolved and deconvolved percent positive distribution of LAMP1 and tetraspanin, respectively. Error bars depict standard error of the mean. (b) Graphs show the relative number and percent difference of S15Ch spots as determined by the same spots masking algorithm from data collected in (a). Each replicate is an individual S15Ch EV sample preparation where a total of 45 images was taken among four coverslips. All data shows the mean value among replicates, error bars show the standard error of the mean. Significant differences between conditions were determined via two-tailed T-test. ***p < .001.
We next asked if EV-MAC could detect differences EV populations obtained through differential centrifugation and those spun directly onto glass from conditioned media. We did not detect a significant difference in the relative staining of tetraspanins or LAMP1 when S15mCh+ EVs were enriched by ultracentrifugation or spun directly onto coverslips from conditioned media ()). However, we did find that centrifugation did enrich the number of S15Ch puncta present in each image (Supplemental Figure 3(b)). We also noted that differential centrifugation tended to lead to the appearance of larger accumulations of fluorescent signal that likely represent EVs aggregated during centrifugation. However, these aggregations could be excluded from the analysis by incorporation of size constraints into the mask algorithm (Supplemental Figure 3(c)). The appearance of these aggregates could also be reduced by thorough resuspension of the pelleted material following centrifugation (data not shown).
To exclude the possibility that deconvolution was influencing our results, we also compared the undeconvolved images to the deconvolved counterparts. We found that the distribution of co-localization among the S15Ch EVs was unaffected for the LAMP1 and the respective tetraspanins between the deconvolved and undeconvolved counterparts (Fig 3A). However, we observed that deconvolved images did detect more spots than were observed in undevonvolved images (Fig 3B). We detected approximately 40% more puncta in deconvolved images compared to undeconvolved images in experiments in which varying number of puncta were observed in undeconvolved images (Fig 3B). The correlation between undeconvolved and deconvolved images at different EV concentrations was consistent with enhanced sensitivity of detection in deconvolved images rather than the spontaneous introduction of artifacts in deconvolved images. To ensure this deconvolution was not leading to the detection of artifactual surfaces, we further characterized how deconvolution was influencing the limit of detection of EV-MAC. To this end, a dilute solution of 100nm fluorospheres, ranging from 1-6 per field, was imaged in the GFP channel at increasing the exposure times stopping at 0.1 seconds, which is consistent with our EV imaging conditions. To determine if the difference in spot number was a consequence of deconvolution artifacts, we manually compared the images and the relative ability of our algorithm to identify individual puncta at each exposure condition. Our algorithm did not detect puncta in deconvolved images that were not identifiable in undeconvolved images at longer exposure conditions, as the number of puncta detected in deconvolved images plateaued and was eventually matched in undeconvolved images at longer exposure times (Supplemental Fig 5A). This is consistent with the ability of constrained iterative deconvolution to restore signal emanating from out of focus planes to their correct focal origin, thus enhancing signal to noise (32). Collectively, the deconvolved’s images had a ~4.26-fold increase in signal compared to their undeconvolved counterpart, suggesting the differences in spot number were the result of increased signal-to-noise (Supplemental Fig 5B). To determine if these results were comparable under conditions that better simulate the number of EVs imaged in a representative field in our experiments, we used the same experimental paradigm for two separate coverslips with more concentrated fluorospheres. Using the same masking algorithm, we determined the number of spots recognized for each image and compared that to the exposure time for the undeconvolved and deconvolved images (Supplemental Fig 5C). These conditions recapitulated the results obtained at lower bead concentration, where the number of puncta identified in deconvolved images plateaued at a lower exposure time while the number of puncta identified in undeconvolved images approaches the number of puncta identified in deconvolved images at longer exposure times. This suggests that despite a decreased ability to identify signal, EV-MAC can be utilized on both undeconvolved and deconvolved 3D reconstructed images, while deconvolution enhances the sensitivity of detection of EVs at lower exposure times.
The majority of EVs in solution are bound to coverslips following spinoculation
We next determined the fraction of EVs bound to coverslips by spinoculation. To understand the fraction of EVs bound to coverslips by spinnoculation, we examined EV binding using both untreated and poly-L-lysine (PLL) treated coverslips. PLL treatment significantly increased the amount S15Ch observed ()). When supernatants were spinoculated onto two coverslips in sequential spinoculations, we observed a reduction in the number of S15ch+ puncta in the second spinoculation onto both uncoated and PLL coverslips ()). This was mirrored by a reduction in the protein concentration in these samples measured before and after spinoculation ()). The similar protein loss in each sample suggests that the increased number of puncta observed in PLL treated coverslips is due to better retention of EVs on PLL coverlips during the staining procedure rather than increased binding of EVs during spinnoculation. No significant differences were observed when S15Ch+ EVs were stained for CD81 and LAMP1 following spinnoculation onto untreated or PLL treated coverslips ()). Furthermore, we observed no significant differences in marker co-localization in serial spinoculations, demonstrating that the population of EVs remaining in the media following the first spinoculation is not substantially different than the EV population adhered to coverslips )). Collectively, these data indicate that spinoculation binds a significant fraction of EVs to coverslips and this fraction of EVs which bind to the coverslip are representative of the EVs which do not bind the coverslip.
Figure 4. Analysis of EV recovery and quantification using EV-MAC. (a) Data shows the number of S15Ch puncta recovered as determined by EV-MAC workflow. The same algorithm was used for both poly L lysine and uncoated coverslips. (b) Sequential spinoculation of concentrated cultured media preparations where samples were first (1°) spinoculated and then samples were then re-spinoculated (2°) onto another coverslip. This was conducted for coverslips coated with poly L lysine. (c) Protein concentrations as determined by BCA for concentrated S15Ch EVs before and after spinoculation. The same initial (pre-Spinoculation) sample was used for both uncoated and poly L lysine coated coverslips, one of the poly L lysine wells was excluded due to pipetting error. (d) The co-localization of CD81 and LAMP1 was identified for S15Ch by the same spots masking algorithm for uncoated and poly L lysine coverslips to determine changes in EVs distribution, respectively. (e) The co-localization of CD81 and LAMP1 was identified for S15Ch by the same spots masking algorithm as (d) to determine changes in EVs distribution between the 1° and 2° spinoculation. Mean number of S15Ch spots detected in a 3D reconstructed image from serial dilutions of ultracentrifuge concentrated media preparations of S15Ch 293T EVs from three independent replicates (f). EVs were also stained for CD81 and mean number per image was also plotted (g). The same S15Ch spots algorithm and CD81 spots algorithm was applied for all dilutions and replicates (f, g) R2 shows the variance of a semilogarithmic line of best fit. (h, i) Graphs combine the replicates in (f, g) to show the mean number of S15Ch and CD81 spots per image from the last 4 and three dilutions, respectively. Data demonstrates a consistent measurable difference among the replicates. Replicates are defined as independent ultracentrifuge concentrated media preparations of S15Ch EVs from 293Ts that were spinoculated onto poly L lysine coated coverslips. 15 images were taken per serial dilution for each replicate. (a–e, h, i) All data shown is the mean percent of at three independent media preparations and coverslips. Significant differences between the number of (a, b) S15Ch spots were determined via two-tailed T-test. No significant differences in (d, e) co-localization among conditions were found as determined by two-way ANOVA. (a–i) All data shows the mean value among replicates, and error bars show standard error of the mean.
Serial dilution allows relative EV concentration to be determined using EV-MAC
To determine the degree to which EV-MAC can measure relative concentrations of EVs in a sample, we spinoculated serial dilutions of S15Ch EVs dilutions (X, 0.5X, 0.25X, 0.125X, 0.0625X, 0.03125X) onto (PLL Treated?) coverslips. We stained these EVs for CD81 and imaged the number of S15Ch and CD81 puncta present per field in each coverslip (,g)). The number of puncta observed did not exhibit linear changes in EV number corresponding to the EV dilution being analysed. However, there was a semilogarithmic relationship between the number of puncta observed and EV concentration in the range of dilutions analysed when either S15Ch or CD81+ spots were calculated (,)). Additionally, these differences remained constant among dilutions, suggesting that this semilogarithmic relationship was not dependent on EV concentration ((h,i)). These experiments demonstrate that EV-MAC analysis provides a semi-quantitative measurement of EV concentrations in a sample and that analysis of numerous sample dilutions can allow quantitative assessment of EV concentrations.
EV-MAC reveals producer cell and cargo specific changes in EV populations
To determine if EVs released from different cells types exhibited differences in tetraspanin or LAMP1 staining, we collected EVs from a monocytic cell line, THP-1, stably expressing S15Ch in parallel with our 293T cells. Pooled imaged analysis of S15Ch+ EVs released from our THP-1 cells revealed that this EV population appeared to be generally less positive for tetraspanins and more positive for LAMP1 (,b)). Indeed, when we compared the S15Ch+ EVs from our S15Ch 293T and S15Ch THP-1 cell-lines, respectively, a larger percent of THP-1 EVs were positive for LAMP1 and negative for CD9 or CD81 ()). A comparable percentage of the S15Ch+ EVs were triple positive for S15Ch, LAMP1, and either CD9 or CD63 but not for CD81 among both THP-1 and 293Ts. Finally, when we independently compared the total percent of S15Ch+ EVs positive for each respective marker, a significantly larger percentage of THP-1 EVs were positive for LAMP1 but a significantly lower percentage were positive for CD9 and CD81. These results demonstrate that EV-MAC can reliably and reproducibly identify differences in EV composition in EV populations from difference cell types.
Figure 5. S15-mCherry THP-1 EVs co-localise with canonical EV markers at differing rates compared to 293T mCherry EVs. (a) S15Ch+ EVs from THP-1s were stained for the indicated tetraspanin and LAMP1. Data from 15–20 images were pooled together from a single coverslip. (b) The mean percentage of S15Ch+ EVs positive for each indicated marker from three independent media preparations and coverslips was calculated. Error Bars represent standard error of the mean. (c) Comparison of tetraspanin and LAMP1 staining on EVs released from THP-1 and 293T cells. Left panel shows the data compared based on co-localization plot quadrants while the second set of graphs shows the total percent of EVs positive for each individual stain, respectively. Data shown compares the percentage of positive EVs collected from the cultured media of S15Ch THP-1 and S15Ch 293T cells which were then subjected to our staining paradigms. The same masking algorithm was used to evaluate the S15Ch EVs from both cell lines. The data from the first column of graphs shown was subjected to two-way ANOVA with Tukey’s multiple comparison post-hoc. The data from the second column of graphs was subjected to Student’s Two-tailed T-test. All graphs shown depict mean value among three independent coverslips and media preparations and error bars show the standard error of the mean. *p < .05, **p < .01, ***p < .001.
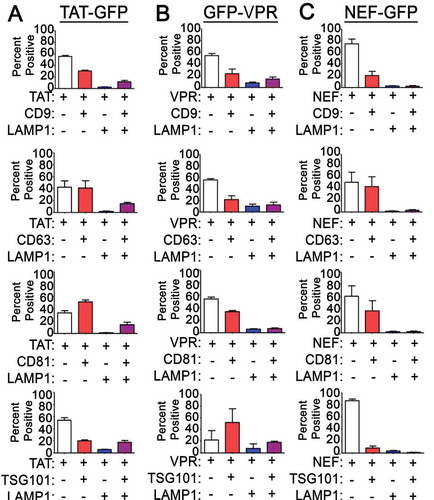
We next asked if we could use EV-MAC to characterise EVs containing different cargo released from the same cell type. To this end, we utilised GFP- tagged versions of the HIV-1 proteins Tat, Vpr and Nef, as these proteins have all been implicated as cargo in potentially pathogenic EVs released from HIV-1 infected cells [Citation25]. To determine if these cargos were released in EVs with discernable differences in canonical EV markers, we transfected these constructs into 293T cells and collected media from these cells for EV-MAC analysis. We created surface masks around GFP+ puncta and examined the degree of CD81, CD63, CD9, LAMP1, as previously described, and also stained EVs for the ESCRT protein TSG101, which is known to be incorporated into EVs [Citation33]. We observed that the association of GFP-Nef+ puncta with tetraspanin markers was generally similar to what was observed with S15ch+ puncta ()). However, Nef-GFP+ puncta exhibited comparatively little LAMP1 staining compared to S15ch+ puncta. Approximately 10% of Nef-GFP+ puncta exhibited TSG101 staining above background ()). By comparison, Tat-GFP+ puncta exhibited a greater degree of LAMP1 and TSG101 staining than Nef-GFP+ puncta ()), while a similar percentage of these EVs were positive for the tetraspanin markers examined. Finally, TSG101 staining was highest in GFP-Vpr+ EVs compared to Tat-GFP and Nef-GFP puncta and CD63 staining was reduced in these puncta. These data demonstrate that EV-MAC can reveal differences in EV populations containing specific cargo.
Figure 6. EVs containing different HIV-1 proteins exhibit differential tetraspanin and LAMP1 staining: The degree of co-localization of (a) TAT-GFP, (b) GFP-VPR, and (c) NEF-GFP EVs with tetraspanin markers, LAMP1 and TSG101. The data shown is the mean value from three independent media preparations and coverslips in which pooled data from a single coverslip was used to determine the mean co-localization percentages. Error bars show the standard error of the mean.
EV-MAC identified changes in lectin binding in EVs released following lysosomal dysfunction
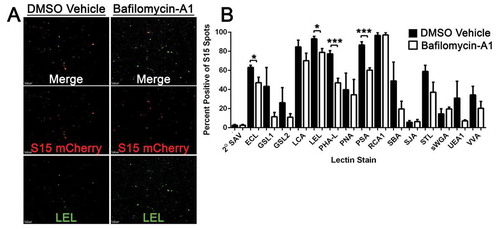
We also examined the glycan composition associated with S15Ch+ EVs by staining with a panel of biotinylated lectins which bind to carbohydrates of differing sugar linkages present on glycoproteins and glycolipids present in EVs. Furthermore, we also assessed whether inhibition of lysosomal acidification altered the glycan composition by treating cells with bafilomycin-A1. Bafilomycin-A1 has previously been shown to alter the secretion of both EVs and cargoes that undergo autophagic driven secretion [Citation13,Citation34]. Representative images of Lycopersicon esculentum (Tomato) Lectin (LEL) reveal S15Ch and LEL co-localization under vehicle and bafilomycin-A1 conditions ()). Among the lectins tested, we found that when lysosomes were not inhibited, ~85% of the S15Ch+ EVs were bound by Lens culinaris agglutinin (LCA), (LEL), Pisum sativum agglutinin (PSA) and Ricinus communis agglutinin-1 (RCA1); Erythrina cristagalli lectin (ECL), Phaseolus vulgaris leuco-agglutinin (PHA-L), soybean agglutinin (SBA), and Solanum tuberosum(Potato) lectin (STL) bound ~50–85% of S15ch+ EVs; Griffonia simplicifolia lectin 1&2 (GSL1), (GSL2), peanut agglutinin (PNA), Ulex europaeus agglutinin 1 (UEA1), and Viciavillosa agglutinin (VVA) bound ~25–50% of EVs; and Sophora japonica agglutinin (SJA) as well as Succinylated Wheat Germ agglutinin (sWGA) bounds less than 25% of EVs ()). Interestingly, we found that bafilomycin-A1 treatment altered the lectin binding of S15Ch+ EVs, with significant reductions measured in ECL, LEL, PHA-L and PSA staining, while the binding of other lectins was unaffected ()). Collectively our data show that lectin binding to EVs can be assessed microscopically in the context of the EV-MAC workflow and reveals that lysosomal inhibition alters the glycan composition of EVs released under basal conditions, based on the observed changes in lectin binding profile.
Figure 7. S15Ch+ EVs and Lectin co-localization is altered during lysosomal impairment. (a) The cultured media from S15Ch 293Ts was incubated with the indicated biotinylated lectins followed by Alexa 488 streptavidin to determine the glycan profile of EVs under both DMSO Vehicle (DMSO) and 100 nM Bafilomycin-A1 (BafA1) treated conditions. (b) Data shown is the mean percent co-localization summation of at least three independent media preparations and coverslips. Significant differences between control and BafA1 treated samples were determined via two-tailed T-test. *p < .05, **p < .01, ***p < .001.Error bars show standard error of the mean.
PKH Dye can be used in conjunction with EV-MAC to identify EVs
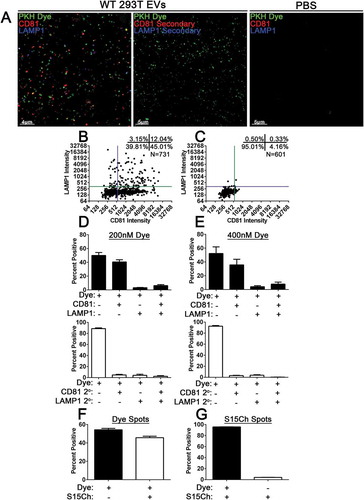
To move towards the ability to utilise EV-MAC to analyse EV populations lacking fluorescently labelled proteins produced in tissue culture, we next sought to utilise PKH fluorescent dyes to label EV populations. We collected and concentrated EVs from 293T cells labelled EVs by incubation with PKH26 dye at concentrations of 200 nM or 400 nM. We subsequently removed excess dye by ultracentrifugation through a sucrose cushion. Afterwards, the resuspended EVs were subjected to our EV-MAC workflow and their co-localization with CD81 and LAMP1 was determined (–)). We found that both concentrations of dye yielded similar co-localization with CD81 and LAMP1 markers (,)). When PKH67 was used to label S15Ch+ EVs produced from 293T cells, we observed that approximately half of the PKH67+ puncta were positive for S15Ch ()), suggesting that S15Ch labels a subset of EVs produced from 293T cells following transient transfection. To estimate the effectiveness of EV labelling, we asked what percentage of S15Ch surfaces were labelled with PKH67, finding that nearly 100% of S15Ch+ EVs were labelled with PKH67 ()). These data demonstrate that the fluorescent membrane dye PKH67 can be used to reliably label EVs for EV-MAC analysis.
Figure 8. PKH Dyed WT 293T EVs co-localise with CD81, LAMP1, and readily identify S15Ch 293T EVs. Concentrated EVs from WT 293T cells or PBS were dyed with PKH26 (PKH Dye, green) at an initial dye concentration of 200 nM or 400 nM. (a) Representative z-stack from WT 293T EVs or PBS demonstrating co-localization of PKH Dye(green), CD81(red), and LAMP1(Blue) or its respective secondary antibody control. The dye labelled EVs were imaged and 3D reconstructions were used to identify dye positive EVs using the same spots masking algorithm for both dye concentrations to determine their co-localization with CD81 and LAMP1. (b, c) Representative co-localization from a 200 nM PKH dye image demonstrate relative co-localization. A total of three (d) and five (e) independent replicates were conducted for the 200 nM and 400 nM conditions, respectively. 10–15 images were taken per coverslip for each condition for each replicate. The number of EVs identified per image ranged from ~200–780. Concentrated S15Ch 293T EVs were either dyed with PKH67 (Dye) with an initial dye concentration of 200 nM or remained unstained. Both the undyed and dye labelled S15Ch EVs were then imaged, and 3D reconstructions were used to generate a spots masking algorithm around the dye positive (f) or S15Ch positive (g) EVs. (f) The percent of Dye+ EVs, as identified by its spots, demonstrate that the S15Ch could be reproducible found within the concentrated EVs. (g) The percent of S15Ch positive EVs, as identified by its spots algorithm, show their co-localization with the dyed EVs (left) are undyed EVs (right). three independent replicates were conducted. 10–15 images were taken per replicate. The number of identified Dye EVs per image ranged, from ~1100–1500; number of S15Ch identified EVs per image ranged, ~350–600. All data shows the mean value among replicates, error bars show the standard error of the mean.
EV-MAC can be used to interrogate human biological samples
We next sought to apply EV-MAC to the analysis of biological samples. To this end, we labelled EVs from plasma and saliva using either PKH67 or the lectin WGA, using signals from these labels to create masks for subsequent analysis of CD63 and LAMP1 association. After validating this method with EVs collected from cell culture supernatants, we asked if our technique could be used to characterise EVs found in human bodily fluid samples. Samples of saliva and plasma were panelled with combinations of the lectin WGA and the LAMP1 and CD63 antibodies used in our cell culture studies ()). For analysis, masks were created around WGA+ signal and the degree of association of the CD63 and LAMP1 was determined (–)).
Figure 9. EV-MAC of Concentrated EVs Isolated from Plasma and Saliva. Concentrated EVs from plasma were bound to glass coverslips via spinoculation onto poly L lysine coated coverslips and stained with antibodies against CD63 and LAMP1 as well (a) 200 nM PKH67 or biotin conjugated wheat germ agglutinin (WGA) (b). Insets defined by the box in the merged image include arrows to indicate areas of colocalization between these markers EV-MAC localization of CD63 and LAMP1 was calculated for plasma samples stained with (c) PKH67 or (d) WGA and EVs isolated from saliva and stained with (e) PKH67 or (f) WGA. Data averaged from three or more technical replicates of the same sample; error bars are reported as standard error of the mean.
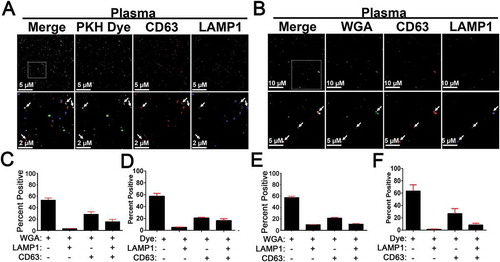
In the EVs isolated from saliva, we observed approximately 21% of WGA+ puncta were positive for CD63, approximately 10% were positive for LAMP1, and approximately 11% were positive for both CD63 and LAMP1 ()). In the EVs isolated from plasma, we observed approximately 28% of WGA+ puncta were positive for CD63, approximately 3% were positive for LAMP1, and approximately 15% were positive for both protein markers ()). These data demonstrate that EV-MAC can be used with biological samples and can reveal differences in the EVs obtained from different biological fluids. Subsequently, we further validated EV-MAC within the context of plasma and saliva EVs by dying them with 200 nM PKH67 dye ()). We found that the dye labelled EVs also co-localised with CD63 and LAMP1 resulting in a co-localization distribution analogous to the lectin labelled EVs for both the plasma and saliva samples (–)).
Discussion
In this study, we establish a method to determine the relative levels of exosomal markers and cargoes present in EV populations using quantitative fluorescent microscopy. Prior studies using fluorescent fusion proteins or dyes to label EVs have demonstrated that microscopic methods can be used to effectively visualise and quantify fluorescent signals associated with individual EVs [Citation22–Citation24]. An advantage of the EV-MAC approach described here is the relative ease by which EVs can be spinnoculated onto coverslips and subsequently analysed using conventional immunofluorescent imaging techniques [Citation29,Citation31]. Notably, other studies have previously demonstrated that immunofluorescent interrogation of EV populations is possible [Citation35–Citation43]. However, the workflow we describe allows the heterogeneity of EV populations to be rapidly assessed by investigators without super-resolution or single-molecule approaches described in prior studies. However, super-resolution techniques provide the opportunity to more accurately assess the size of individual EVs in a population, compared to EV-MAC, which is limited by the resolution limit of conventional light microscopy. Alternatively, single molecule techniques, including single molecule localization microscopy (qSMLM) [Citation42] have the advantage of allowing vesicle size to be more accurately assessed and allowing the precise number of molecules on an EV to approximated. However, such studies require access to super resolution instrumentation with single molecule sensitivity as well as antibodies labelled in a way that ensures antibodies are conjugated to a single fluorophore. EV-MAC may be an attractive alternative in cases where the relative differences in EV composition can be assessed without a need to appreciate the precise number of target proteins present on EVs. The utility of EV-MAC in characterizing EV populations using conventional microscopy, with our without deconvolution, using conventional combinations of primary and secondary antibodies commonly used in immunofluorescence studies, may make it more accessible and easily utilised to interrogate EV populations in many contexts.
In this workflow described in this manuscript, the generation of masks around individual fluorescent signal, such as S15Ch, allows quantitative, multiplexed analysis of EV populations according to their incorporation of canonical EV markers including tetraspanins, TSG101 and LAMP1. Additionally, the generation of this masking algorithm allowed us to analyse images in an unbiased, semi-high throughput manner and evaluate thousands of EVs in a short period of time with a small quantity of sample. This approach is highly reproducible across biological and technical replicates (, , and ). Furthermore, we demonstrate how it can be flexibly adapted to either evaluate images individually in a process analogous to technical replicates (Individual Image Measure) or by first pooling data from multiple images and then determining co-localization (Pooled Image Measure). This latter method becomes useful when few events of interest are observed in each image as determining co-localization from small sample sizes becomes impractical due to increased variance. However, we demonstrate that this can be overcome by pooling data from all the images when necessary to increase sample size. These experiments collectively reveal that EV populations are very heterogenous, consistent with previous studies using other approaches [Citation8–Citation10,Citation19,Citation20] and EV-MAC can reliably and reproducibly monitor these differences. In this regard, it should be noted that while EV-MAC can reproducibly characterise EVs following spinnoculation onto coverslips, it is possible that spinnoculation may not capture all EVs present in a sample. It is possible that EVs of extremely small size or those with electrostatic properties that make them less likely to bind coverslips could be underrepresented in EV-MAC analysis. Altering the spinnoculation conditions or coverslip treatment may be needed to overcome these issues if they are encountered.
As is the case with flow cytometry, this method requires control staining lacking primary antibodies specific for individual antigens, which we achieve by staining using secondary antibody controls. Wide field, deconvolution microscopy was applied in this approach because of its sensitivity and field uniformity [Citation32], and because algorithm based analysis using Imaris software requires 3D acquisition to establish reliable surface masks. Similar approaches using different acquisition systems and masking approaches are likely possible, so long as the fluorescent excitation field across an image is sufficiently uniform and the instrumentation is capable of quantifying differences between secondary negative control samples and experimental samples. Notably, it should be noted that the resolution limits of conventional fluorescent microscopy preclude meaningful analysis of EV size, surface area or volume, as the majority of EVs are below the 250 nm resolution limit of light microscopy. Moreover, as is the case with flow cytometry, such an analysis is dependent on the specificity of the antibody utilised. As such, this method should not be used to determine the precise number of proteins of interest in a given EV or used to infer that a given protein is completely absent from an EV or population of EVs. This approach is best suited to studies using fluorescent protein fusions to proteins of interest and imaging approaches capable of single molecule detection [Citation22]. However, the ability to define EV populations of interest, according to their incorporation of endogenously expressed, native proteins, provides a platform by which the composition of EVs containing specific cargoes of interest can be interrogated.
Our observation that changes in the tetraspanins and LAMP1 content occurs in a cargo specific manner in EVs containing different HIV-1 proteins suggests that EV-MAC may be particularly useful in characterizing exosomes with specific pathological or therapeutic cargo, such as viral proteins or amyloid proteins associated with neurodegenerative disease or other situations in which EVs containing a specific cargo may represent a small percentage of total EVs in a sample. As such, this workflow may be useful in the identification of EV biomarkers that might not be identified when populations of EVs are measured en mass via proteomics or western blot. The presence of individual proteins on specific EV subpopulations may also reflect differences in the secretory pathways utilised by individual EV populations of interest, and may therefore provide the opportunity to define individual EV secretory pathways driving the release of specific EV subpopulations of interest.
We also performed an assessment of lectin binding to EV populations. While we did observe that lysosomal inhibition altered the binding of some lectins to EVs released from THP-1 cells, we also identified lectins which did not change under such conditions and found that ~100% of EVs were identified by RCA1 staining. The differential binding of lectins may also be useful to understand the biogenesis of some EV populations and understanding the cell biology of the EV releasing cell [Citation44–Citation46]. It is tempting to speculate that glycomic differences in EV populations may be used to define EVs released from non-canonical EV pathways associated with secretory autophagy or lysosomal exocytosis, which are thought to be mechanisms by which pathological amyloid proteins are released from cells [Citation21,Citation47,Citation48].
We also exploited the broad staining ability of lectins and fluorescent dyes to serve as a pan-EV marker in the analysis of EVs from biological samples, including saliva and serum. These approaches yielded generally similar results (), providing a workflow to use EV-MAC to characterise EV populations from patients. These approaches provided similar results when saliva or plasma samples were analysed. Using both labelling approaches in parallel is particularly advantageous, as corroboration between methods can ensure that each label is being applied in a reliable and reproducible manner. In this regard, careful titration of each label using EVs at a defined concentration can ensure that these labelling methods are reliably detecting EVs and artefacts are not being measured. In the case of lectin staining, we have observed that the lectin staining must be performed prior to antibody labelling and carefully titrated, as excess lectin can interact with glycans present on many antibodies if these aspects of the workflow are not carefully controlled. Similarly, titration of PKH dye and removal of unbound dye is critical to prevent the detection of dye micelles. However, the corroboration of these methods () demonstrate that these potential issues can be controlled to provide reliable and reproducible multiplexed analysis of EV cargos. This approach is a highly attractive way to characterise EV populations, as the relative composition of EVs containing any given protein of interest can be compared to an internal control of all EVs labelled using these pan-EV markers, thus allowing the identification of proteins which are enriched in specific EV populations of interest. Cell-type specific markers may also be used in this way to identify EVs released from specific cell types within a heterogenous population of EVs in biological samples.
Declaration of interest
Authors have no declarations of interest regarding the authorship or publication of this article.
Supplemental Material
Download Zip (8.6 MB)Acknowledgments
EC was funded by the Michael J Fox Foundation. The authors thank Michael Hantak, Enya Qing and Tom Gallagher for assistance with methodology, technique and scientific discussion.
Funding
This work was supported by the Michael J. Fox Foundation for Parkinson’s Research [16470].
Supplementary material
Supplemental data for this article can be accessed here.
References
- Tan SS, Yin Y, Lee T, et al. Therapeutic MSC exosomes are derived from lipid raft microdomains in the plasma membrane. J Extracell Vesicles. 2013;2:10.3402/jev.v2i0.22614.
- Skotland T, Sandvig K, Llorente A. Lipids in exosomes: current knowledge and the way forward. Prog Lipid Res. 2017;66:30–25.
- Greening DW, Simpson RJ. Understanding extracellular vesicle diversity - current status. Expert Rev Proteomics. 2018;15:887–910.
- H Rashed M, Bayraktar E, K Helal G, et al. Exosomes: from garbage bins to promising therapeutic targets. Int J Mol Sci. 2017;18:538.
- Yanez-Mo M, Siljander PR, Andreu Z, et al. Biological properties of extracellular vesicles and their physiological functions. J Extracell Vesicles. 2015;4:27066.
- Skog J, Wurdinger T, van Rijn S, et al. Glioblastoma microvesicles transport RNA and proteins that promote tumour growth and provide diagnostic biomarkers. Nat Cell Biol. 2008;10:1470–1476.
- Webber J, Clayton A. How pure are your vesicles? J Extracell Vesicles. 2013;2:10.3402/jev.v2i0.19861.
- Kowal J, Arras G, Colombo M, et al. Proteomic comparison defines novel markers to characterize heterogeneous populations of extracellular vesicle subtypes. Proc Natl Acad Sci USA. 2016;113:E968–77.
- Willms E, Cabanas C, Mager I, et al. Extracellular vesicle heterogeneity: subpopulations, isolation techniques, and diverse functions in cancer progression. Front Immunol. 2018;9:738.
- Willms E, Johansson HJ, Mager I, et al. Cells release subpopulations of exosomes with distinct molecular and biological properties. Sci Rep. 2016;6:22519.
- Hessvik NP, Llorente A. Current knowledge on exosome biogenesis and release. Cell Mol Life Sci. 2018;75:193–208.
- Murrow L, Malhotra R, Debnath J. ATG12-ATG3 interacts with Alix to promote basal autophagic flux and late endosome function. Nat Cell Biol. 2015;17:300–310.
- Villarroya-Beltri C, Baixauli F, Mittelbrunn M, et al. ISGylation controls exosome secretion by promoting lysosomal degradation of MVB proteins. Nat Commun. 2016;7:13588.
- Xu J, Camfield R, Gorski SM. The interplay between exosomes and autophagy - partners in crime. J Cell Sci. 2018;131:jcs215210.
- Canfran-Duque A, Pastor O, Quintana-Portillo R, et al. Curcumin promotes exosomes/microvesicles secretion that attenuates lysosomal cholesterol traffic impairment. Mol Nutr Food Res. 2014;58:687–697.
- Tang Q, Zhang X, Zhang W, et al. Identification and characterization of cell-bound membrane vesicles. Biochim Biophys Acta Biomembr. 2017;1859:756–766.
- Thery C, Witwer KW, Aikawa E, et al. Minimal information for studies of extracellular vesicles 2018 (MISEV2018): a position statement of the international society for extracellular vesicles and update of the MISEV2014 guidelines. J Extracell Vesicles. 2018;7:1535750.
- Konoshenko MY, Lekchnov EA, Vlassov AV, et al. Isolation of extracellular vesicles: general methodologies and latest trends. Biomed Res Int. 2018;2018:8545347.
- Gould SJ, Raposo G. As we wait: coping with an imperfect nomenclature for extracellular vesicles. J Extracell Vesicles. 2013;2:20389.
- Jeppesen DK, Fenix AM, Franklin JL, et al. Reassessment of exosome composition. Cell. 2019;177:428–445 e18.
- Minakaki G, Menges S, Kittel A, et al. Autophagy inhibition promotes SNCA/alpha-synuclein release and transfer via extracellular vesicles with a hybrid autophagosome-exosome-like phenotype. Autophagy. 2018;14:98–119.
- Corso G, Heusermann W, Trojer D, et al. Systematic characterization of extracellular vesicle sorting domains and quantification at the single molecule - single vesicle level by fluorescence correlation spectroscopy and single particle imaging. J Extracell Vesicles. 2019;8:1663043.
- Chuo ST, Chien JC, Lai CP. Imaging extracellular vesicles: current and emerging methods. J Biomed Sci. 2018;25:91.
- Lai CP, Kim EY, Badr CE, et al. Visualization and tracking of tumour extracellular vesicle delivery and RNA translation using multiplexed reporters. Nat Commun. 2015;6:7029.
- Madison MN, Okeoma CM. Exosomes: implications in HIV-1 pathogenesis. Viruses. 2015;7:4093–4118.
- Grozdanov V, Danzer KM. Release and uptake of pathologic alpha-synuclein. Cell Tissue Res. 2018;373:175–182.
- Shi M, Sheng L, Stewart T, et al. New windows into the brain: central nervous system-derived extracellular vesicles in blood. Prog Neurobiol. 2019;175:96–106.
- Davidovich E, Aframian DJ, Shapira J, et al. A comparison of the sialochemistry, oral pH, and oral health status of Down syndrome children to healthy children. Int J Paediatr Dent. 2010;20:235–241.
- Campbell EM, Perez O, Melar M, et al. Labeling HIV-1 virions with two fluorescent proteins allows identification of virions that have productively entered the target cell. Virology. 2007;360:286–293.
- Rodgers W. Making membranes green: construction and characterization of GFP-fusion proteins targeted to discrete plasma membrane domains. Biotechniques. 2002;32:1044–1046, 1048, 1050–1051.
- O’Doherty U, Swiggard WJ, Malim MH. Human immunodeficiency virus type 1 spinoculation enhances infection through virus binding. J Virol. 2000;74:10074–10080.
- Murray JM, Appleton PL, Swedlow JR, et al. Evaluating performance in three-dimensional fluorescence microscopy. J Microsc. 2007;228:390–405.
- Stoorvogel W, Kleijmeer MJ, Geuze HJ, et al. The biogenesis and functions of exosomes. Traffic. 2002;3:321–330.
- Alvarez-Erviti L, Seow Y, Schapira AH, et al. Lysosomal dysfunction increases exosome-mediated alpha-synuclein release and transmission. Neurobiol Dis. 2011;42:360–367.
- Chen C, Zong S, Wang Z, et al. Imaging and intracellular tracking of cancer-derived exosomes using single-molecule localization-based super-resolution microscope. ACS Appl Mater Interfaces. 2016;8:25825–25833.
- Ji Y, Qi D, Li L, et al. Multiplexed profiling of single-cell extracellular vesicles secretion. Proc Natl Acad Sci USA. 2019;116:5979–5984.
- Lee K, Fraser K, Ghaddar B, et al. Multiplexed profiling of single extracellular vesicles. ACS Nano. 2018;12:494–503.
- Mondal A, Ashiq KA, Phulpagar P, et al. Effective visualization and easy tracking of extracellular vesicles in glioma cells. Biol Proced Online. 2019;21:4.
- Nizamudeen Z, Markus R, Lodge R, et al. Rapid and accurate analysis of stem cell-derived extracellular vesicles with super resolution microscopy and live imaging. Biochim Biophys Acta Mol Cell Res. 2018;1865:1891–1900.
- Tian T, Zhu YL, Zhou YY, et al. Exosome uptake through clathrin-mediated endocytosis and macropinocytosis and mediating miR-21 delivery. J Biol Chem. 2014;289:22258–22267.
- Verderio C, Muzio L, Turola E, et al. Myeloid microvesicles are a marker and therapeutic target for neuroinflammation. Ann Neurol. 2012;72:610–624.
- Lennon KM, Wakefield DL, Maddox AL, et al. Single molecule characterization of individual extracellular vesicles from pancreatic cancer. J Extracell Vesicles. 2019;8:1685634.
- Bianco F, Perrotta C, Novellino L, et al. Acid sphingomyelinase activity triggers microparticle release from glial cells. Embo J. 2009;28:1043–1054.
- Finkbeiner S. The autophagy lysosomal pathway and neurodegeneration. Cold Spring Harb Perspect Biol. 2019. DOI:10.1101/cshperspect.a033993
- Frake RA, Ricketts T, Menzies FM, et al. Autophagy and neurodegeneration. J Clin Invest. 2015;125:65–74.
- Tofaris GK. Lysosome-dependent pathways as a unifying theme in Parkinson’s disease. Mov Disord. 2012;27:1364–1369.
- Jang A, Lee HJ, Suk JE, et al. Non-classical exocytosis of alpha-synuclein is sensitive to folding states and promoted under stress conditions. J Neurochem. 2010;113:1263–1274.
- Lee HJ, Cho ED, Lee KW, et al. Autophagic failure promotes the exocytosis and intercellular transfer of alpha-synuclein. Exp Mol Med. 2013;45:e22.