
ABSTRACT
Pleural effusion is a common respiratory disease worldwide; however, rapid and accurate diagnoses of tuberculosis pleural effusion (TPE) and malignancy pleural effusion (MPE) remain challenging. Although extracellular vesicles (EVs) have been confirmed as promising sources of disease biomarkers, little is known about the metabolite compositions of its subpopulations and their roles in the diagnosis of pleural effusion. Here, we performed metabolomics and lipidomics analysis to investigate the metabolite characteristics of two EV subpopulations derived from pleural effusion by differential ultracentrifugation, namely large EVs (lEVs, pelleted at 20,000 × g) and small EVs (sEVs, pelleted at 110,000 × g), and assessed their metabolite differences between tuberculosis and malignancy. A total of 579 metabolites, including amino acids, acylcarnitines, organic acids, steroids, amides and various lipid species, were detected. The results showed that the metabolic profiles of lEVs and sEVs overlapped with and difference from each other but significantly differed from those of pleural effusion. Additionally, different type of vesicles and pleural effusion showed unique metabolic enrichments. Furthermore, lEVs displayed more significant and larger metabolic alterations between the tuberculosis and malignancy groups, and their differential metabolites were more closely related to clinical parameters than those of sEV. Finally, a panel of four biomarker candidates, including phenylalanine, leucine, phosphatidylcholine 35:0, and sphingomyelin 44:3, in pleural lEVs was defined based on the comprehensive discovery and validation workflow. This panel showed high performance for distinguishing TPE and MPE, particularly in patients with delayed or missed diagnosis, such as the area under the receiver-operating characteristic curve (AUC) >0.95 in both sets. We conducted comprehensive metabolic profiling analysis of EVs, and further explored the metabolic reprogramming of tuberculosis and malignancy at the level of metabolites in lEVs and sEVs, providing insight into the mechanism of pleural effusion, and identifying novel biomarkers for diagnosing TPE and MPE.
Introduction
Pleural effusion is a common respiratory disease worldwide, with malignant pleural effusion (MPE) caused by lung cancer and tuberculous pleural effusion (TPE) caused by mycobacterium tuberculosis infection as the most clinical commons [Citation1,Citation2]. Approximately 10 million incident cases and 1.3 million deaths were caused by tuberculosis in 2017, with nearly 9% of cases occurring in China [Citation3]. The mortality rate of lung cancer ranks first among different types of cancers worldwide [Citation4], and approximately 40% of patients develop pleural effusion [Citation1]. Rapid and accurate diagnoses at an early time point are crucial for implementing effective treatments and improving outcomes [Citation3,Citation5]. However, current clinical identification methods exhibit various limitations. Bacteriological or/and histopathological methods are the “gold standard” for diagnosing TPE and MPE [Citation2,Citation6]. However, the Mycobacterium tuberculosis culture test is not only time-consuming but also lack sensitivity [Citation7,Citation8]. Pleural biopsy is invasive, high-risk and not suitable for all patients. These methods often result in delayed or missed diagnosis, particularly in patients with a low load of M. tuberculosis or tumour cells in pleural fluid, or whom pleural tissue is difficult to obtain [Citation3,Citation6]; the positive rate of the M. tuberculosis test in case of TPE is less than 40% [Citation2,Citation9]. Therefore, highly sensitive non-invasive or less invasive diagnostic methods for TPE and MPE are urgently required.
Extracellular vesicles (EVs), a lipid bilayer structure released by most cells, are a promising source of biomarkers [Citation10–Citation12]. EVs have important roles in regulating cellular communication, growth, migration, angiogenesis and immune modulation [Citation13,Citation14]. Numerous studies have revealed that EVs in bodily fluids, such as the blood, urine, and cerebrospinal fluid can be used as promising biomarkers to avoid repeated biopsies, particularly for cancer diagnosis [Citation15,16]. Samples of pleural effusion have been widely used for screening to identify biomarkers of tuberculosis and lung cancer, given its anatomical proximity to the lung and key part role in the immune microenvironment in the chest [17,Citation18]. EVs in the pleural fluid may play an important role in lung damage because they can directly originate from pathologic lung tissue or cells [Citation19,Citation20]. Furthermore, the biochemical and biophysical properties of EVs from malignant effusions are similar to those of EVs from tumour cells [Citation21,Citation22]. Our previous clinical study also revealed that autologous tumour cell–derived EVs in the pleural effusion can be successfully utilized in the targeted chemotherapy of lung cancer [Citation23]. Therefore, EVs in the pleural effusion may provide insights into the diagnosis of TPE and MPE.
Small EVs (sEVs) and large EVs (lEVs) are commonly studied subpopulations of EVs [Citation24,Citation25]. sEVs, such as exosomes (~100 nm diameter), are demonstrated to carry bioactive molecules from parental cells, and modulate the metabolism of recipient cells [Citation13,Citation26]. lEVs, including microvesicles, ectosomes and/or large oncosomes (~100–1,000 nm and/or >1,000 nm diameter), have been found contain specific proteins, lipids and RNA, which are associated with disease progression, and used as potential biomarkers for disease diagnosis and monitoring [Citation24,Citation25,Citation27]. While the molecular content of sEVs and lEVs remains poor understood, particularly for the EVs from pleural effusion. Many previous studies focused on analysing RNA [Citation28,Citation29], or the protein profiles [Citation30,Citation31] of EVs. Few studies have investigated small molecule metabolites, although metabolites alterations occur downstream of genetic and proteomic regulation, and thus are more likely to reveal the dynamic changes of biological states [Citation32,Citation33]. Therefore, a detailed understanding of the metabolite composition of EV subgroups is necessary to further develop diagnostics and therapeutics. In our study, differential centrifugation, a widely used separation technique for EVs of different size and intensity [Citation24,Citation25,Citation34], was used to obtain the lEVs (sediment at 20,000 × g spin) and sEVs (sediment at 110,000 × g spin). Liquid chromatography–tandem mass spectrometry (LC-MS/MS)-based metabolomics and lipidomics analysis were utilized to assess the metabolite characteristics of sEVs and lEVs from pleural effusion, and further explore the metabolic reprogramming of tuberculosis and malignancy from the level of EVs metabolites, to provide new insights into the mechanism and diagnosis of pleural effusion.
Materials and methods
Subjects and study design
All participants were recruited from Union Hospital of Huazhong University of Science and Technology, and Wuhan Lung hospital (Wuhan, China). The study was approved by the ethics committee of these hospitals and registered in ClinicalTrials.gov database (NCT03997669), and written informed consent was obtained from each enrolled subject. A total of 80 pleural effusion specimens, including 20 in the discovery set and 60 in the validation set, were collected from 40 patients with pulmonary tuberculosis and 40 patients with lung cancer. All patients with TPE were diagnosed based on the M. tuberculosis detection in the specimens of sputum or pleural fluid, and/or pleural biopsy histopathologic test. All patients with MPE were confirmed by histopathology analysis of the pleural biopsy, or/and cytologic examination of the pleural effusion. About 50–100 ml pleural fluid was collected from each participant prior to treatment by thoracentesis as previously described [Citation35]. Briefly, the puncture site is generally located in the sixth or seventh intercostal space between the mid and posterior axillary line by the aid of ultrasound to reduce damage. The age and sex of subjects in the two groups were matched as much as possible, and the detailed clinical information of all subjects is listed in .
Table 1. Clinical Characteristics of study subjects in the discovery and validation set.
Isolation of EVs from pleural effusion
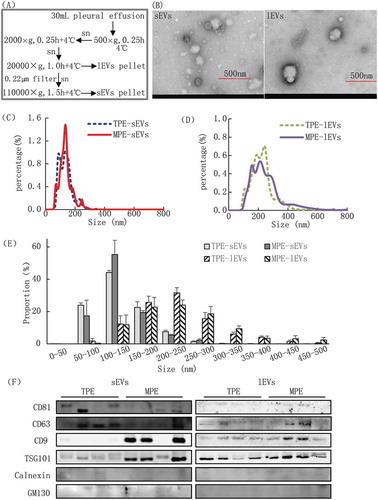
EVs were isolated by a modified differential ultracentrifugation method based on previously described methods [Citation29,Citation36]. Briefly, 30 mL of pleural fluid was centrifuged at 500 × g (4°C) for 15 min to remove pleural cell debris, and the supernatant was centrifuged at 2,000 × g (4°C) for 15 min to further remove cells and its debris. Next, the supernatant (~30 mL) were centrifuged at 20,000 × g (4°C) for 60 min to pellet the lEVs. Then, the lEVs-depleted supernatant was filtered through a 0.22 μm disposable membrane (Millipore, US), and sEVs were further recovered from this supernatant by a ultracentrifugation at 110,000 × g (4°C) for 90 min using Optima XPN-100 Ultracentrifuge with rotor 70 Ti, adjusted k-factor 201.6, and Optiseal polyallomer tube (Beckman Coulter) (). To obtain pure EVs, both pellets were carefully washed with 30 mL fresh phosphate-buffered saline (PBS), and then centrifuged at 20,000 × g (4°C) for 60 min or at 110,000 × g (4°C) for 90 min. These wash steps were repeated two times to clean lEVs and sEVs. Finally, the pellets were resuspended in 250 µL of fresh PBS. The isolated sEVs and lEVs were stored at −80°C until further analysis.
Figure 1. Validation of EV sample quality.
Electron microscopy of EVs
Aliquots (3 μL) of lEVs or sEVs were immediately dropped onto the carbon film copper grid and incubated for 5 min on ice for transmission electron microscopy (TEM) analysis. The grids were washed and excess liquid was dried with filter paper. The grids were negatively stained with 10 μL of 2% phosphotungstic acid (Servicebio, Woburn, MA, USA), and washed with distilled water and air-dried in the dark. Finally, the grids were examined with an HT 7700 transmission electron microscope (Hitachi, Tokyo, Japan) at an acceleration voltage of 80 kV.
Nanoparticle tracking analysis of EVs
The particle size and density distribution of lEVs or sEVs were analysed with a nanoparticle tracking analysis (NTA) instrument (Nanosight NS300, NanoSight Ltd., Minton Park, UK), which is equipped with a laser light source and a high-sensitivity video camera. Detections were controlled as follows: camera level of 14, temperature of 25.0°C, viscosity 0.91 cP, frames per second 25, measurement time 60 s and detection threshold 6. The samples were diluted in PBS to concentrations appropriate for the measurement, and the data were analysed with NanoSight NTA version 3.2 software.
Western blotting analysis of EVs
The pellets of sEVs and lEVs were lysed with RIPA buffer (Pierce, Rockford, IL, USA) on ice for 40 min. Insoluble material was pelleted by centrifugation for 15 min at 11,000 × g at 4°C. Supernatants were transferred to a new tube, and the protein concentrations were quantified with a BCA Protein Assay kit (Beyotime, Shanghai, China) according to the manufacture’s protocols. Next, 20 μg of protein was loaded into gels for separation by 10% sodium dodecyl sulphate polyacrylamide gel electrophoresis (Bio-Rad, Hercules, CA, USA) after which the proteins were transferred onto a polyvinylidene fluoride membrane (Millipore, Bedford, MA, USA). After blocking with 5% skimmed milk powder, primary antibodies were added, and the membrane was incubated at 4°C overnight. Primary antibodies used were CD9 (C4, Santa Cruz Biotechnology, Dallas, TX, USA; 1:500), CD81 (B11, Santa Cruz; 1:1000), CD63 (H5C6, BD Biosciences, Franklin Lakes, NJ, USA; 1:1000), Tsg101 (4A10, Abcam, Cambridge, UK; 1:2000), GM130 (4A10, Abcam, Cambridge, UK; 1:500) and Calnexin (Roteintech Group, INC; 1:1000). After washing with PBS, the membrane was further incubated with the secondary antibody for 1 h at room temperature. Proteins were visualized using an ECL chemiluminescence staining assay kit (Bio-Rad) and the density of each protein band was quantified.
Sample preparation and metabolite extraction
To extract EV metabolites as much as possible without increasing the amount of sample, a high-efficiency liquid–liquid extraction method was employed for our current study [Citation37]. Before the metabolite extraction, five freeze-thaw cycles (freezing in liquid nitrogen for 3 min, and then thawing on ice for 3 min) were performed to accelerate the release of metabolites from lEVs or sEVs. Next, 300 µL of methanol was added to 100 µL lEVs or sEVs or pleural effusion for metabolite extraction. Sequentially 1 mL methyl tert-butyl ether was added and for the sample was incubated with shaking for 1 h at room temperature to improve metabolite extraction from the vesicles. Next, 250 µL of water was added, vortexed for 1 min, and equilibrated at room temperature for 15 minutes, and then centrifuged at 12,000 × g (4°C) for 15 min. Then, 400 µL “mixture” (200 µL upper plus 200 µL lower fractions) were transferred to fresh tube for the metabolomics analysis. Another 400 uL upper fraction was separately transferred for hydrophobic metabolites (lipids) analysis. Finally, these fractions were lyophilized under vacuum.
LC-MS/MS-based metabolic profiling analysis
To obtain high-sensitivity and -coverage of the EVs in metabolic profiling analysis, previously reported pseudotargeted metabolomics and lipidomics methods were used to acquire the LC-MS/MS spectra [Citation38–Citation40]. Acquisition was performed with a Nexera LC-30AD UHPLC system (Shimadzu, Kyoto, Japan) coupled to a Q-Trap 5500 mass spectrometer system (AB SCIEX, Framingham, MA, USA). For metabolomics analysis in discovery and validation sets, the lyophilized metabolite extractions were reconstituted with 50 µL acetonitrile/H2O (1:4, v/v), and 5 µL was injected into the LC-MS system for detection. In positive and negative acquisition modes, the separations were performed using the ACQUITY BEH C8 columns (100 × 2.1 mm, 1.7 μm, Waters, Milford, MA, USA), and the column temperature was maintained at 50°C. The mobile phases A and B contained 0.1% (v/v) formic acid in aqueous solution and acetonitrile solution, respectively, and the flow rate was set to 0.35 mL/min. Details related to gradient elution and mass spectrometer parameters were shown in the Supplementary information.
In lipid analysis of discovery set and validation set, the lyophilized lipid extractions were reconstituted with 100 µL ACN/IPA/H2O (65:30:5, v/v/v/) containing 5 mM ammonium acetate, and 5 µL was injected into the LC-MS system for lipid detection. Separation was performed using ACQUITY BEH C8 columns (100 × 2.1 mm, 1.7 μm, Waters) with at a column temperature of 55°C. Both mobile phase C and D contained 10 mM ammonium acetate in a solution of acetonitrile/H2O (3:2, v/v) and acetonitrile/isopropanol (1:9, v/v), respectively. The gradient was started at a flow rate of 0.26 mL/min. Details related to gradient elution and mass spectrometer parameters were shown in the Supplementary information.
Data processing and statistical analysis
Peak alignment of the acquired raw data was performed using the software tool Analyst V1.6 software (AB SCIEX, Framingham, MA, USA). After removing missing values by the rule of 80% and background ions [Citation41], the signal drifts of the remaining matched peak ions were calibrated by total intensity signal calibration. Metabolites and lipids were identified as described in our previous studies [Citation32,Citation38].
Multivariable analysis was conducted using SIMCA-P software (version 11.0; Umetrics). Principal component analysis (PCA) was applied to detect global metabolic alterations among different samples [Citation42]. Univariate analysis of clinical and metabolic profiling data was performed by Multi Experiment Viewer software (MeV, version 4.7.4). The Wilcoxon Mann-Whitney test with benjamini–Hochberg-based false discovery rate (FDR) correction was utilized to evaluate the statistical significance, with p < 0.05 and FDR < 0.05 defined as statistically significant. Pearson correlation analysis among the clinical parameters and differential metabolites was implemented with SPSS software (version 18.0.0), and its network was displayed by Cytoscape software (version 3.7.1). The heat maps of differential metabolite alterations were generated by the software of MeV software version 4.7.4. Metabolite enriched pathway analysis was implemented with the online software of Metaboanalyst (https://www.metaboanalyst.ca/MetaboAnalyst/).
Results
Clinical characteristics of subjects
In our study, a total of 80 pleural fluid samples, including 20 in the discovery and 60 in the validation set, were recruited to identify the metabolic biomarker candidates for the diagnosis of TPE and MPE. The clinical characteristics of these patients were summarized in . The numbers of white blood cell, neutrophils, lymphocytes and pleural lactate dehydrogenase (pLDH) levels did not significantly differ between the two groups (p-values > 0.05) in the discovery and validation sets. Compared to patients with MPE, increased level of erythrocyte sedimentation rate (ESR), C-reactive protein (CRP), and pleural adenosine deaminase (pADA), and deceased level of pleural effusion carcinoembryonic antigen (pCEA) were found in patients with TPE. In our study, all patients with MPE were founded to have lung carcinomas according to cytology assessment in the discovery and validation set, respectively. For patients with TPE, pleural biopsy pathology of eight cases showed positive results, and only two cases showed positive tuberculosis culture in the sputum in the discovery set, and these results were verified by patients from the validation set. All samples were collected before treatment with anti-cancer, anti-tuberculosis or other anti-inflammatory medications.
Isolation and Validation of EVs
The EV subgroups of lEVs and sEVs were isolated from 30 mL of pleural effusion by differential ultracentrifugation. During centrifugations, the pellets of sEVs and lEVs were carefully removed and washed to guarantee that any extra-vesicular metabolites dissolved in the pleural effusion were eliminated from the pellets. TEM, NTA and western blotting were used to validate the quality of the isolated sEVs and lEVs from pleural effusion (). TEM showed that the size and morphology of lEVs were more heterogeneous than those of sEVs (), and the size of most lEVs (>150 nm) was larger than that of sEVs (50–150 nm), which is consistent with reported studies [Citation25]. Additionally, the size distribution analysed by NTA showed that 90.8% and 92.1% sEVs were between 50 and 200 nm in diameter from the TPE and MPE group, respectively. While more than 90% lEVs showed a wide range of 100–400 nm in diameter, and their size distribution between MPE and TPE did not show a significant difference (-E, Table S1). lEVs were larger than sEVs with an average diameter of 136.1 nm versus 224.2 nm in the TPE, and 136.4 nm versus 252.3 nm in the MEP. The membrane proteins CD9, CD63 (common EV markers), and TSG101 were detected in both EV subgroups by western blotting. Most markers showed higher levels in sEVs than in lEVs, which were consistent with previous reported studies [Citation24,Citation25,Citation34]. Furthermore, CD9 and TSG101 were highly enriched in EVs from patients with MPE compared to from patients with TPE, and no enrichment of non-EV markers of Calnexin, and GM130 in EVs samples in our study (, Figure S1A), which were further verified by the validation samples (Figure S1B). Related results have been submitted to the knowledge base of EV-TRACK (ID: EV200000) [Citation43].
Differential metabolic profiles of EVs and pleural effusion
To confirm that the metabolites within EVs were analysed rather than those dissolved in pleural effusion, the original matched pleural effusion samples were also analysed by LC-MS/MS. Because of the small size of EVs and limited volumes of clinical samples, high sensitivity is crucial for metabolome detection of EVs. Therefore, LC-MS/MS-based pseudotargeted metabolomics and lipidomics methods were employed to give high-sensitivity and wide-coverage of metabolites detections. A total of 579 metabolites were detected by metabolomics (118) and lipidomics (461) analyses. These detected metabolites were mainly amino acids and derivatives, acylcarnitines, organic acids, amides, steroids, and lipids species of glycerolipids, phosphoglycerolipids and sphingolipids.
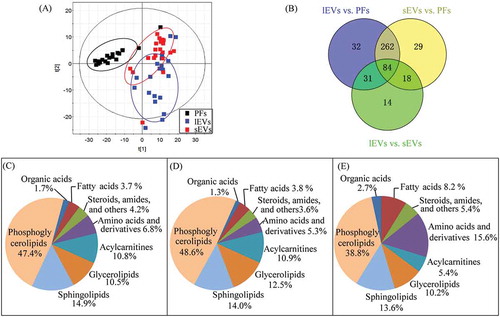
PCA was performed to give a snapshot of the metabolite characteristics of lEVs and sEVs samples. In the scores plot of PCA based on the data of 579 metabolites (), the samples of EVs were clustered well away from the pleural effusion samples, indicating that the metabolic composition of sEVs and lEVs were remarkable different from those of pleural effusion. Consistent with this, the levels of most metabolites were significantly different in lEVs (409) and sEVs (393) compared to in pleural effusion according to the univariate analysis (). Additionally, nearly 50% of these differential metabolites were phosphoglycerolipids, and approximately 14% were sphingolipids in both sEVs and lEVs. The proportions of phosphoglycerolipids, glycerolipids and fatty acids among differential metabolites in sEVs were higher than those in lEVs (, D). In contrast, more sphingolipids, amino acids and derivatives, organic acids, steroids, amides and others differed in lEVs compared to sEVs (). Compared to the metabolite alterations between EVs and pleural effusion, the differences between lEVs and sEVs were small, and 147 metabolites, including phosphoglycerolipids (38.8%), amino acids (15.6%), sphingolipids (13.6%), glycerolipids (10.2%) and fatty acids (8.2%) showed large differences between these groups, which were consistent with the results of PCA analysis (). These results demonstrate that the metabolic profiles of lEVs and sEVs overlapped and showed some differences, but were remarkably differential from those of pleural effusion.
Figure 2. Characterization of metabolic profiles from samples of lEVs, sEVs, and pleural effusions (PFs).
Enrichment of amino acids, acylcarnitines and lipids in lEVs and sEVs compared to in pleural effusion
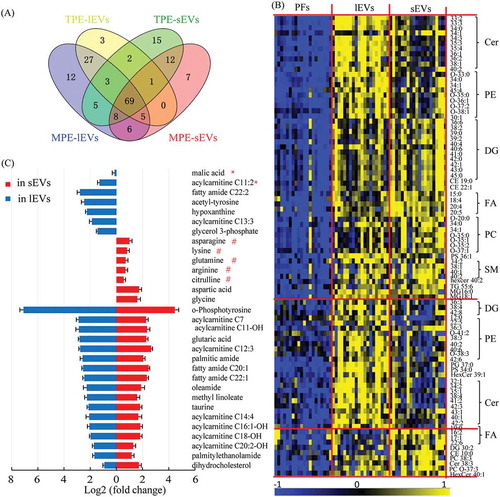
To evaluate the metabolic characteristics of lEVs and sEVs, enriched metabolites in EVs were further investigated according to the EV-type and pleural effusion-type. Compared to the pleural effusion samples, more metabolites were enriched in MPE-EVs than in TPE-EVs, such as 135 in MPE-lEVs versus 110 in TPE-lEVs. Additionally, 69 metabolites were commonly increased in these 4 groups (). As shown in –C, most commonly enriched metabolites were mainly sphingolipids of ceramides (Cer), and sphingomyelins (SM), glycerophospholipids of phosphatidylcholine (PC), and phosphatidylethanolamines (PE), glycerolipids of diacylglycerols (DG), fatty acids (FA), fatty amides and acylcarnitines (ACs). These results support the basic understanding that glycerophospholipids are among the main components in biological membranes, as well as in EVs, and more of sphingolipids are used in the biogenesis of EVs [Citation44]. Although most metabolites were commonly enriched in EVs samples, lEVs and sEVs also displayed unique metabolite characteristics; for example, 27 and 12 metabolites were only increased in lEVs and sEVs, respectively (). More Cers with long carbon acyl chains, PEs, DGs and ACs were elevated in the lEVs, whereas more FAs and amino acids were increased in the sEVs. Additionally, enrichment in lEVs and sEVs depends on the pleural effusion-type, such as 12 metabolites including PEs, DGs, hexa-Cer, malic acid, and palmitic acid were only raised in MPE-lEVs. In contrast, more triacylglycerols (TGs) were uniquely elevated in MPE-sEVs, while citrulline, arginine, lysine, asparagine, and linolenic acid were only enriched in TPE-sEVs (Table S2). In general, more sphingolipids and glycerophospholipids were enriched in lEVs, whereas more amino acids, fatty acids, and glycolipids were enriched in sEVs. Furthermore, EVs from TPE and MPE displayed unique metabolic enrichment signatures, which may be used to track the unique biogenesis and function of these two EVs subgroups in TPE and MPE.
Figure 3. Enrichment of metabolites in lEVs and sEVs compared to pleural effusions (PFs).
Differential metabolites between TPE and MPE vary in sEVs and lEVs
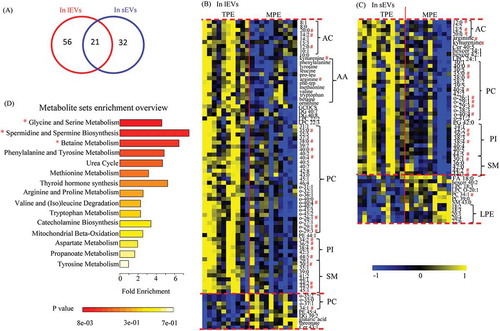
To understand the roles of EVs in the development of pleural effusion, the metabolic profiles between TPE and MPE were compared in the sEVs and lEVs samples, respectively. The results revealed that more metabolites were altered in lEVs than in sEVs (77 versus 53) (). Twenty-one of these differential metabolites overlapped in these two EV subgroups, such as kynurenine, arginine, AC C12:0, and lipids species of PCs, phosphatidylinositols (PIs), and SMs (–C). However, various metabolites were uniquely changed in lEVs and sEVs (–C). In the lEVs samples, more amino acids (AAs) and ACs were decreased in MPE, such as phenylalanine, tryptophan, leucine, valine, ornithine, betaine, and AC C10:0; in contrast, threonate, glutaric acid, and several PCs were elevated in the MPE lEVs samples (). In sEVs samples, more PIs were reduced in MPE, while stearic acid and more lysophosphatidylethanolamines (LPEs) were increased, and lipids were the main altered metabolites (). To further understand these changes in EVs metabolites, metabolite set enrichment analysis was performed to capture the biological meaning of these differential metabolites. These metabolic disturbances were mainly related to glycine and serine metabolism, spermidine and spermine biosynthesis, as well as betaine metabolism ().
Figure 4. Differential metabolites in comparison of TPE and MPE from samples of lEVs and sEVs.
Our results demonstrate that the metabolic characteristics of TPE and MPE can be represented by the metabolite levels in lEVs and sEVs. Additionally, most differential metabolites found in lEVs and sEVs were distinct, indicating their unique roles in the development of pleural effusion. Furthermore, these results show that metabolic alterations in EVs between TPE and MPE were more significant and larger in lEVs than those in sEVs, which may be useful for identifying novel biomarkers for distinguishing TPE and MPE.
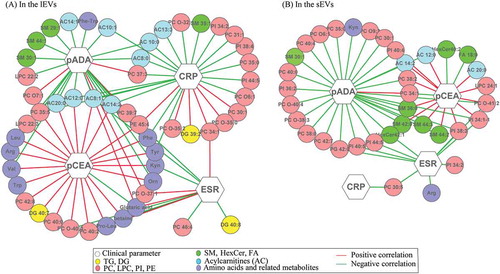
Associations of differential metabolites with clinical parameters
To improve the understanding of the physiology of these metabolite changes in EVs between MPE and TPE, the relationships between these differential metabolites and biological clinical parameters were investigated by correlation analysis. As shown in , in both sEVs and lEVs, most differential metabolites were closely associated with pCEA and pADA. For example, the levels of most PCs, SMs, and ACs in both lEVs and sEVs displayed a significant positive relationship with the level of pCEA. Additionally, the overlapped differential metabolites mainly displayed inverse relationships between pCEA and pADA. Further, the levels of pCEA and pADA show remarkable correlations with the levels of various amino acids in lEVs, which showed weak relationships in sEVs. Furthermore, except for pCEA and pADA, the differential metabolites in lEVs showed more complex associations with the ESR and CRP than those in sEVs.
Figure 5. Network of interactions between clinical parameters and differential metabolites identified in sEVs (A) and in lEVs (B) subgroups.
Defining metabolic biomarkers candidates in lEVs for distinguishing lung cancer and tuberculosis pleural effusion
According to results of differential metabolite analysis and correlation analysis, metabolic alterations between TPE and MPE in lEVs were more significant and larger than those in sEVs (), and their differential metabolites in lEV displayed closer relationships with clinical parameters than those in sEVs (). Therefore, lEVs were further selected as potential metabolic biomarkers cargo for the distinguishing of pulmonary tuberculosis and lung cancer pleural effusion.
In the discovery phase, multivariate and univariate analyses were used to select the biomarker candidates. First, the PLS-DA analysis () revealed obvious separations among TPE and MPE samples without over-fitting (Figure S3). Variable important in the projection (VIP) are used to evaluate the contribution of variables on the classification, and the VIP values of 67 metabolites were greater than 1.0 on two principal components, which were identified as important variables to contribute the classifications (). Subsequently, a univariate analysis was used to evaluate the difference of these 67 metabolites between the TPE group and MPE group. Finally, 14 of these metabolites exhibited p < 0.05, FDR < 0.05 and fold change (FC) > 2 in this comparisons ().
Figure 6. Identification of metabolic biomarkers candidates for distinguishing TPE and MPE in lEVs.
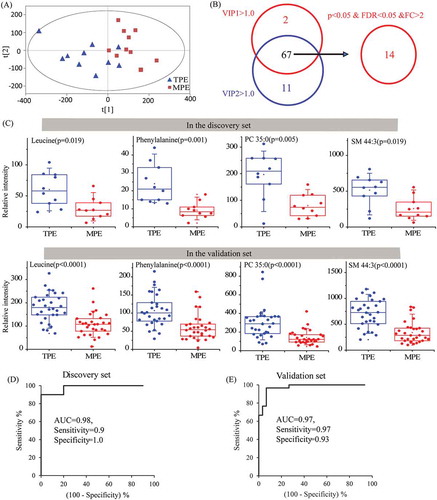
An independent test set of 60 subjects, including 30 patients with TPE and 30 patients with MPE, was used to assess the reliability of 14 biomarker candidates and define the useful biomarkers. Ultimately, nine metabolites still kept the significant differences between TPE and MPE. Subsequently, the diagnostic performance of these nine candidates was evaluated by the ROC analysis. The area under the curve (AUC) values of 4 candidates, including phenylalanine, leucine, PC 35:0, and SM 44:3, were larger than 0.8 in both discovery set and validation set. Furthermore, the combination of these four metabolites provided a more effective discrimination than any single biomarker candidates, for example, the AUC, sensitivity, and specificity of the panel were 0.98, 0.90, 1.00 in the discovery set, and 0.97, 0.97, 0.93 in the validation set, respectively, and the positive and negative likelihood ratio of this panel were 14.43 and 0.03 in the validation set (, Table S3). Therefore, an ideal biomarker panel based on the combination of phenylalanine, leucine, PC 35:0, and SM 44:3 () was defined to distinguish the patients with TPE and MPE.
Discussion
TPE and MPE are the two most common types of pleural effusions, and their treatments and prognosis are very different [Citation1,Citation2]. However, the current clinical diagnosis of TPE and MPE remains challenging, particularly for patients with a low load of M. tuberculosis or tumour cells in the pleural effusions, or in those who are unsuitable for or unwilling to undergo pleural biopsy [Citation6]. Therefore, new biomarkers for the rapid and accurate diagnosis of TPE and MPE are urgently needed.
Metabolomics analysis of EVs is a new research field with the potential to reveal novel biomarkers for disease diagnosis in a highly sensitive manner [Citation45]. EVs, which carry important cargos for cellular communication and transmission, have been confirmed as a promising source of biomarkers for disease diagnosis and monitoring [Citation15,Citation46]. In patients with pleural effusions, the biochemical composition of EVs in the pleural fluid can sensitively characterize biological states because of anatomical advantages of pleural fluid and direct secretion of EVs from pathologic lung tissue or cells [17,Citation18]. For example, some studies showed that the RNA and protein characteristics of EVs in MPE may aid the development of novel diagnostic tools for lung cancer [Citation19,Citation22]. Previous studies mainly focused on genes and proteins in EVs [Citation28,Citation47], while few studies have examined small molecule metabolites. However, small molecule metabolites downstream of genes and proteins are closely associated with phenotype and can sensitively reflect slight changes in biological states, which may not be reflected by the genes and proteins [Citation48–Citation50]. Therefore, metabolic profiling analysis, as the systematic study of endogenous small molecule metabolites, has been widely applied in disease biomarker discovery [Citation32,Citation33]. In the present study, metabolomics and pleural EVs were evaluated to determine the metabolite properties of two EVs subgroups, providing insight into the diverse functions of sEVs and lEVs in pleural effusions progression. This approach may reveal highly sensitive potential biomarkers for diagnosing TPE and MPE.
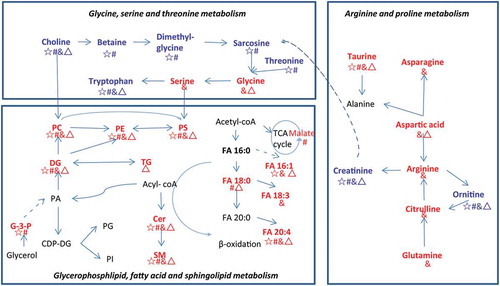
Our data showed that the metabolic profiles of lEVs and sEVs were significantly different from that of pleural effusion (), providing the possibility to explore new pathways of TPE and MPE. As showed in , the differential metabolites between EV and pleural effusion were mainly related to the pathways of glycerophosphlipid, fatty acid and sphingolipid metabolism, glycine, serine and threonine metabolism, and arginine and proline metabolism. Previous studies revealed that the lipid content of EVs and parental cells were different, such as the enriched level of DG, Cer, SM, PC, PE and FA in EVs [Citation31,Citation51,Citation52]. In line with these, we found phosphoglycerolipid, sphingolipids and glycerolipids were the major identified differential lipid species in the lEVs and sEVs when compared with pleural effusion (-D). Additionally, Cer, PE, DG, FA, PC and SM were the major enriched lipids in the EVs compared to pleural effusion (). Skotland et al. reported that there were selected enrichments of lipid species into exosomes, such as monounsaturated fatty acyl groups [Citation53]. Consistent with this, we found that most monounsaturated fatty acyl groups of Cer, PC, PE and SM were enriched in both sEVs and lEVs (). Lipids have been reported to play key roles in the formation, secretion, and biological functions of EVs. Phosphoglycerolipid of PC, PE and PS are key components of the lipid bilayer of EVs [Citation54]. Llorente et al. found PS 18:0/18:1 was the main species of urinary exosomes, and its hand-shaking with the very long-chain sphingolipids between the membrane leaflets plays an important role in the membrane biology of vesicles [Citation52,Citation55]. In our study, we found PS 36:1 was the major lipid species of PS in pleural EVs, and there was a significant enriched level of PS 36:1 in both sEVs and lEVs (). Sphingolipids, including Cers, are critical not only in the production and release of EVs [Citation56], but also in the regulation of cell survival, and inflammation [Citation57]. DGs are important lipid messengers in the intercellular communication [Citation58]. Arachidonic acid (FA 20:4) can modulate the inflammation by its metabolites of leukotriene B4, thromboxane A2, or prostaglandin E2 [Citation59]. Increased arachidonic acid has been found in lung adenocarcinoma tissue and may influence the cancer progression [Citation60]. Enrichment of these metabolites in EVs may affect cellular function of targeted cells, as well as reflect metabolism state of parent cells.
Figure 7. Metabolic pathways of differential metabolites between EVs and pleural fluid.
Previous studies revealed that the biochemistry and function of the two EV subgroups are distinct [Citation29,Citation31,Citation61]. Consistent with this, we found that different type of vesicles, as well as of pleural effusion showed unique metabolic enrichments. Hypoxanthine and G-3-P were elevated in the lEVs, whereas more amino acids were increased in the sEVs. Hypoxanthine is a purine derivative and the intermediate of adenosine metabolism and nucleic acids formation. G-3-P is an intermediate in the glycolysis. The elevated hypoxanthine and G-3-P may indicate the accelerated glycolysis and nucleic acids formation in the lEVs. Aspartate plays an important role in protein synthesis and is a precursor for cellular signalling compounds. Unique metabolic enrichment signatures of lEVs and sEVs may be useful for tracking the unique biogenesis and function of these two EVs subgroups. Additionally, more TGs and saturated fatty acids (FA 18:0) were accumulated in the MPE EVs, while arginine, citrulline and glutamine were increased in the TPE EVs. EVs have been identified as important metabolite cargos for the cancer cell metabolism [Citation46,Citation62]. TGs are main energy storage, interestingly elevated levels of TGs have been found in the tumour tissues of lung cancer [Citation63]. Fatty acids can be utilized to supply energy by β-oxidation, which can be mediated by acyl-CoA aynthetase long-chain 3 and accelerate the lung tumorigenesis [Citation64]. Accumulated TGs and fatty acids in MPE EVs may reflect the energy state of tumour cell in MPE. Arginine metabolism is a critical regulator of immune responses and may be involved in the survival of T cells and the suppression of inflammation [Citation65]. Rised arginine may be related to the cellular immune responses in patients with TPE. Together, alterations in the metabolite composition of EVs can reflect the state of parental cells, as well as affect the cellular function of target cells.
We further investigated the EVs metabolite characteristics according to the pleural effusion type. In the comparison of TPE and MPE, the levels of most differential metabolites were lower in MPE samples than in TPE samples. First, most amino acids, such as phenylalanine, tryptophan, tyrosine, leucine, and valine were decreased in MPE EVs. Because a higher demand for building blocks of proteins has commonly been found in cancer cells, their increased consumption may lead to reduced levels of amino acids, such as increased uptake of branch chain amino acids in tumours and may accelerate the production of intermediates in tricarboxylic acid cycle and β-oxidation [Citation66]. Consistent with this, the decreased levels of amino acids in MPE EVs may be related to tumour cell proliferation. Furthermore, some amino acids may be important in tumour progression. For example, tryptophan catabolism plays an important role in suppressing antitumor immunization by affecting the proliferation of T-cells [Citation67]. The depleted tryptophan in our study indicates enhanced immunosuppression in patients with MPE.
Second, long- and medium-chain acylcarnitines, which transport fatty acids from the cytoplasm to the mitochondria for β-oxidation, play an important role in the fatty acid oxidation pathway [Citation68]. These molecules were lower in MPE EVs, suggesting that more fatty acids were shut into the mitochondria for β-oxidation to supply energy for cancer cell growth. The Warburg effect is a crucial hallmark of various tumours in which higher levels of glucose are consumed by cancer cells compared to normal cells, which increases lipolysis and fatty acids provide energy via fatty acid oxidation [Citation69]. Consistent with this, we found FA18:0, one of main fatty acids, was increased in the MPE EVs, which may be ready for the β-oxidation.
Third, lipids are sensitive biomarkers for pathophysiological alterations [Citation52,Citation70]. In our study, three major lipids species of phosphoglycerolipids, sphingolipids and glycerolipids were significantly changed between TPE and MPE. The levels of PC, PI and SM were lower in MPE EVs compared to in TPE EVs. In contrast, the levels of several Cer, LPE and PC were increased in MPE EVs. Many studies revealed that these lipids are not only basic elements of cells but also play a key role in the immune response, cellular signalling and proliferation [Citation12,Citation54]. For example, Cers have been reported to be related to tumour cell metastasis and immune evasion in lung cancer cells [Citation71]. Consistent with these, we found that the levels of most PCs, PIs and SMs have close association with levels of clinical parameters of CRP, ESR and CEA (). Levels of CRP and ESR are increased in response to inflammation of body. CEA is a tumour marker for several carcinomas, involving cell adhesion, signal transduction and innate immunity [Citation72]. Their close relationships indicated that these metabolites were sensitive to characterize the phenotype of MPE and TPE.
We found that lEVs displayed more significant and lager metabolic alterations between TPE and MPE, and their differential metabolites were more closely related to clinical parameters compared to sEVs. Therefore, lEVs can be used to identify potential metabolic biomarkers for distinguishing lung cancer and pulmonary tuberculosis pleural effusion. A metabolite panel including four different metabolites for distinguishing TPE and MPE in lEVs showed high diagnostic performance, particularly for patients with TPE and low levels of ADA, such as its AUC larger than 0.95 in both discovery and validation sets. ADA is a presumptive diagnostic marker for TPE; however, its diagnostic accuracy is dependent on the TPE prevalence of the researched populations [Citation73]. In our study, the levels of pADA in three patients with TPE were less than 20 U/L in both sets, and 8 patients with MPE were higher than 20 U/L in the validation set, and the AUC of pADA for diagnosing TPE and MPE was 0.86 (Table S3), which may result in a missed diagnosis of TPE or MPE in the clinic. However, these patients can be distinguished by the metabolite panel, which showed good complementarity for clinical parameters, and their combination with clinical parameters may be effective for diagnosing TPE and MPE.
This metabolomics analysis of lEVs and sEVs study provides a practical strategy for screening biomarkers of pleural effusion. The results should be further validated for a large number of patients. However, there were some limitations to this study. For the analytical method, the metabolite coverage was limited because of the trade-off between throughput and sensitivity. Although we used LC-MS-based metabolomics and lipidomics methods to achieve relatively wide metabolite coverage measurement, some metabolites were still missed in these measurements, particularly those with low contents or those difficult to detect by LC-MS. However, more sensitive methods typically require greater sample volumes and complex sample treatment, which may be not suitable for further clinical applications. Therefore, for further clinic application, we will develop more rapid and convenient methods for EVs isolation and metabolome detection to improve the throughput of our study.
In summary, we characterized the metabolite signatures of sEVs and lEVs from pleural effusion. Additionally, the metabolite profiles obtained from the lEVs and sEVs showed overlaps and differences with each other and with the source materials, indicating the potential of EV-derived metabolomics and biomarker discovery. Furthermore, we also explored the metabolic reprogramming of tuberculosis and malignancy at the level of lEVs and sEVs rather than the level of conventional pleural fluid, providing new insight into the mechanism of pleural effusion. Finally, we evaluated the potential of EV metabolites for diagnosing TPE and MPE. In the diagnosis of TPE and MPE, using a combination of lEVs metabolite panel and clinical parameter may be effective, particularly for patients with the delayed or missed diagnosis.
Supplemental Material
Download MS Word (28.5 MB)Acknowledgments
We would like to thank Professor Guowang Xu, and Qiuhui Xuan for their technical assistance of the LC-MS/MS-based metabolomics and lipidomics analysis. The authors also thank managers of ultracentrifuge and LC-MS/MS at the Central Laboratory, and members of the Center for Translational Medicine of the Wuhan Union Hospital for their valuable help.
Disclosure statement
The authors report no conflicts of interest.
Supplementary data
Supplemental material for this article can be accessed here.
Additional information
Funding
References
- Porcel JM, Gasol A, Bielsa S, et al. Clinical features and survival of lung cancer patients with pleural effusions. Respirology. 2015;20(4):654–16.
- Light RW. Update on tuberculous pleural effusion. Respirology. 2010;15(3):451–458.
- Organization WH. Global Tuberculosis Report 2018. Geneva 2018; WHO 2018 Available at http://www.who.int/tb/publications/global_report/en
- Hirsch FR, Scagliotti GV, Mulshine JL, et al. Lung cancer: current therapies and new targeted treatments. Lancet. 2017;389(10066):299–311.
- Wang F, Wang Z, Tong Z, et al. A pilot study of autofluorescence in the diagnosis of pleural disease. Chest. 2015;147:1395–1400.
- Porcel JM. Biomarkers in the diagnosis of pleural diseases: a 2018 update. Ther Adv Respir Dis. 2018;12:1753466618808660.
- Gopi A, Madhavan SM, Sharma SK, et al. Diagnosis and treatment of tuberculous pleural effusion in 2006. Chest. 2007;131(3):880–889.
- Porcel JM. Tuberculous pleural effusion. Lung. 2009;187(5):263–270.
- Valdés L, Alvarez D, San José E, et al. Tuberculous pleurisy: a study of 254 patients. Arch Intern Med. 1998;158(18):2017–2021. .
- Sheridan C. Exosome cancer diagnostic reaches market. Nat Biotechnol. 2016;34(4):359–360.
- Tompkins AJ, Chatterjee D, Maddox M, et al. The emergence of extracellular vesicles in urology: fertility, cancer, biomarkers and targeted pharmacotherapy. J Extracell Vesicles. 2015;4(1):23815. .
- Yanez-Mo M, Siljander PR-M, Andreu Z, et al. Biological properties of extracellular vesicles and their physiological functions. J Extracell Vesicles. 2015;4(1):27066. .
- Gurunathan S, Kang MH, Jeyaraj M, et al. Review of the Isolation, Characterization, Biological Function, and Multifarious Therapeutic Approaches of Exosomes. Cells. 2019;8(4):E307.
- Exosomes MJ. Ectosomes in Intercellular Communication. Curr Biol. 2018;28(8):R435–R444.
- Clos-Garcia M, Loizaga-Iriarte A, Zuniga-Garcia P, et al. Metabolic alterations in urine extracellular vesicles are associated to prostate cancer pathogenesis and progression. J Extracell Vesicles. 2018;7(1):1470442. .
- McKiernan J, Donovan MJ, O’Neill V, et al. A Novel Urine Exosome Gene Expression Assay to Predict High-grade Prostate Cancer at Initial Biopsy. JAMA Oncol. 2016;2(7):882–889. .
- Wang W, Zhou Q, Zhai K, et al. Diagnostic accuracy of interleukin 27 for tuberculous pleural effusion: two prospective studies and one meta-analysis. Thorax. 2017;73:240–247.
- Lam CW, Law CY. Untargeted mass spectrometry-based metabolomic profiling of pleural effusions: fatty acids as novel cancer biomarkers for malignant pleural effusions. J Proteome Res. 2014;13(9):4040–4046.
- Park JO, Choi DY, Choi DS, et al. Identification and characterization of proteins isolated from microvesicles derived from human lung cancer pleural effusions. Proteomics. 2013;13(14):2125–2134. .
- Haggadone MD, Peters-Golden M. Microenvironmental Influences on Extracellular Vesicle-Mediated Communication in the Lung. Trends Mol Med. 2018;24(11):963–975.
- Andre F, Schartz NEC, Movassagh M, et al. Malignant effusions and immunogenic tumour-derived exosomes. Lancet. 2002;360(9329):295–305. .
- Bard MP, Hegmans JP, Hemmes A, et al. Proteomic analysis of exosomes isolated from human malignant pleural effusions. Am J Respir Cell Mol Biol. 2004;31(1):114–121. .
- Guo M, Wu F, Hu G, et al. Autologous tumor cell–derived microparticle-based targeted chemotherapy in lung cancer patients with malignant pleural effusion. Sci Transl Med. 2019;11(498):474. .
- Yekula A, Minciacchi VR, Morello M, et al. Large and small extracellular vesicles released by glioma cells in vitro and in vivo. J Extracell Vesicles. 2020;9(1):1689784. .
- Durcin M, Fleury A, Taillebois E, et al. Characterisation of adipocyte-derived extracellular vesicle subtypes identifies distinct protein and lipid signatures for large and small extracellular vesicles. J Extracell Vesicles. 2017;6(1):1305677. .
- Matsumoto A, Takahashi Y, Chang H-Y, et al. Blood concentrations of small extracellular vesicles are determined by a balance between abundant secretion and rapid clearance. J Extracell Vesicles. 2019;9(1):1696517.
- Vagner T, Spinelli C, Minciacchi VR, et al. Large extracellular vesicles carry most of the tumour DNA circulating in prostate cancer patient plasma. J Extracell Vesicles. 2018;7(1):1505403. .
- Min L, Zhu S, Chen L, et al. Evaluation of circulating small extracellular vesicles derived miRNAs as biomarkers of early colon cancer: a comparison with plasma total miRNAs. J Extracell Vesicles. 2019;8(1):1643670. .
- Lazaro-Ibanez E, Lunavat TR, Jang SC, et al. Distinct prostate cancer-related mRNA cargo in extracellular vesicle subsets from prostate cell lines. BMC Cancer. 2017;17(1):92. .
- Welton JL, Brennan P, Gurney M, et al. Proteomics analysis of vesicles isolated from plasma and urine of prostate cancer patients using a multiplex, aptamer-based protein array. J Extracell Vesicles. 2016;5(1):31209. .
- Haraszti RA, Didiot M-C, Sapp E, et al. High-resolution proteomic and lipidomic analysis of exosomes and microvesicles from different cell sources. J Extracell Vesicles. 2016;5:32570.
- Luo P, Yin P, Hua R, et al. A Large-scale, multicenter serum metabolite biomarker identification study for the early detection of hepatocellular carcinoma. Hepatology. 2018;67(2):662–675. .
- Tian Y, Wang Z, Liu X, et al. Prediction of Chemotherapeutic Efficacy in Non–Small Cell Lung Cancer by Serum Metabolomic Profiling. Clin Cancer Res. 2018;24(9):2100–2109. .
- Kanada M, Bachmann MH, Hardy JW, et al. Differential fates of biomolecules delivered to target cells via extracellular vesicles. Proc Natl Acad Sci U S A. 2015;112(12):E1433–1442. .
- Feller-Kopman DJ, Reddy CB, DeCamp MM, et al. Management of Malignant Pleural Effusions. An Official ATS/STS/STR Clinical Practice Guideline. Am J Respir Crit Care Med. 2018;198(7):839–849. .
- Palviainen M, Saari H, Karkkainen O, et al. Metabolic signature of extracellular vesicles depends on the cell culture conditions. J Extracell Vesicles. 2019;8(1):1596669. .
- Chen S, Hoene M, Li J, et al. Simultaneous extraction of metabolome and lipidome with methyl tert-butyl ether from a single small tissue sample for ultra-high performance liquid chromatography/mass spectrometry. J Chromatogr A. 2013;9:9–16.
- Xuan Q, Hu C, Yu D, et al. Development of a High Coverage Pseudotargeted Lipidomics Method Based on Ultra-High Performance Liquid Chromatography-Mass Spectrometry. Anal Chem. 2018;90(12):7608–7616. .
- Luo P, Yin P, Zhang W, et al. Optimization of large-scale pseudotargeted metabolomics method based on liquid chromatography–mass spectrometry. J Chromatogr A. 2016;1437:127–136.
- Chen S, Kong H, Lu X, et al. Pseudotargeted metabolomics method and its application in serum biomarker discovery for hepatocellular carcinoma based on ultra high-performance liquid chromatography/triple quadrupole mass spectrometry. Anal Chem. 2013;85(17):8326–8333.
- Smilde AK, van der Werf MJ, Bijlsma S, et al. Fusion of mass spectrometry-based metabolomics data. Anal Chem. 2020;9(20):1696517–1696536.
- Want EJ, Wilson ID, Gika H, et al. Global metabolic profiling procedures for urine using UPLC–MS. Nat Protoc. 2010;5(6):1005–1018. .
- Van Deun J, Mestdagh P, Agostinis P, et al. EV-TRACK: transparent reporting and centralizing knowledge in extracellular vesicle research. Nat Methods. 2017;14(3):228. .
- Brzozowski JS, Jankowski H, Bond DR, et al. Lipidomic profiling of extracellular vesicles derived from prostate and prostate cancer cell lines. Lipids Health Dis. 2018;17(1):211. .
- Puhka M, Takatalo M, Nordberg ME, et al. Metabolomic Profiling of Extracellular Vesicles and Alternative Normalization Methods Reveal Enriched Metabolites and Strategies to Study Prostate Cancer-Related Changes. Theranostics. 2017;7(16):3824–3841. .
- Achreja A, Zhao H, Yang L, et al. Exo-MFA - A 13C metabolic flux analysis framework to dissect tumor microenvironment-secreted exosome contributions towards cancer cell metabolism. Metab Eng. 2017;43:156–172.
- Welton JL, Khanna S, Giles PJ, et al. Proteomics Analysis of Bladder Cancer Exosomes. Mol Cell Proteomics. 2010;9(6):1324–1338. .
- Dunn WB, Broadhurst DI, Atherton HJ, et al. Systems level studies of mammalian metabolomes: the roles of mass spectrometry and nuclear magnetic resonance spectroscopy. Chem Soc Rev. 2011;40(1):387–426.
- German JB, Bauman DE, Burrin DG, et al. Metabolomics in the opening decade of the 21st century: building the roads to individualized health. J Nutr. 2004;134(10):2729–2732. .
- van der Greef J, Stroobant P. van der Heijden R. The role of analytical sciences in medical systems biology. Curr Opin Chem Biol. 2004;8(5):559–565.
- Choi DS, Kim DK, Kim YK, et al. Proteomics, transcriptomics and lipidomics of exosomes and ectosomes. Proteomics. 2013;13(10–11):1554–1571.
- Skotland T, Ekroos K, Kauhanen D, et al. Molecular lipid species in urinary exosomes as potential prostate cancer biomarkers. Eur J Cancer. 2017;70:122–132.
- Llorente A, Skotland T, Sylvänne T, et al. Molecular lipidomics of exosomes released by PC-3 prostate cancer cells. Biochim Biophys Acta. 2013;1831(7):1302–1309. .
- Skotland T, Sandvig K, Llorente A. Lipids in exosomes: current knowledge and the way forward. Prog Lipid Res. 2017;66:30–41.
- Róg T, Orłowski A, Llorente A, et al. Interdigitation of long-chain sphingomyelin induces coupling of membrane leaflets in a cholesterol dependent manner. Biochim Biophys Acta. 2015;1858(2):281–288. .
- Trajkovic K, Hsu C, Chiantia S, et al. Ceramide Triggers Budding of Exosome Vesicles into Multivesicular Endosomes. Science. 2008;29:5867.
- Hannun YA, Obeid LM. Principles of bioactive lipid signalling: lessons from sphingolipids. Nat Rev Mol Cell Biol. 2008;9(2):139–150.
- Almena M, Merida I. Shaping up the membrane: diacylglycerol coordinates spatial orientation of signaling. Trends Biochem Sci. 2011;36(11):593–603.
- Bogatcheva NV, Sergeeva MG, Dudek SM, et al. Arachidonic acid cascade in endothelial pathobiology. Microvasc Res. 2005;69(3):107–127.
- Liu J, Mazzone PJ, Cata JP, et al. Serum free fatty acid biomarkers of lung cancer. Chest. 2014;146(3):670–679.
- Xu R, Greening DW, Rai A, et al. Highly-purified exosomes and shed microvesicles isolated from the human colon cancer cell line LIM1863 by sequential centrifugal ultrafiltration are biochemically and functionally distinct. Methods. 2015;87:11–25.
- Zhao H, Yang L, Baddour J, et al. Tumor microenvironment derived exosomes pleiotropically modulate cancer cell metabolism. Elife. 2016;5:e10250.
- Eggers LF, Muller J, Marella C, et al. Lipidomes of lung cancer and tumour-free lung tissues reveal distinct molecular signatures for cancer differentiation, age, inflammation, and pulmonary emphysema. Sci Rep. 2017;7(1):11087. .
- Padanad MS, Konstantinidou G, Venkateswaran N, et al. Fatty Acid Oxidation Mediated by Acyl-CoA Synthetase Long Chain 3 Is Required for Mutant KRAS Lung Tumorigenesis. Cell Rep. 2016;16(6):1614–1628. .
- Geiger R, Rieckmann JC, Wolf T, et al. L-Arginine Modulates T Cell Metabolism and Enhances Survival and Anti-tumor Activity. Cell. 2016;167(3):829–842 e813. .
- Shao Y, Ye G, Ren S, et al. Metabolomics and transcriptomics profiles reveal the dysregulation of the tricarboxylic acid cycle and related mechanisms in prostate cancer. Int J Cancer. 2018;143(2):396–407. .
- Platten M, Wick W, Van den Eynde BJ. Van den Eynde BJ. Tryptophan catabolism in cancer: beyond IDO and tryptophan depletion. Cancer Res. 2012;72(21):5435–5440.
- Mihalik SJ, Goodpaster BH, Kelley DE, et al. Increased levels of plasma acylcarnitines in obesity and type 2 diabetes and identification of a marker of glucolipotoxicity. Obesity (Silver Spring). 2010;18(9):1695–1700.
- Nie H, Li J, Yang X-M, et al. Mineralocorticoid receptor suppresses cancer progression and the Warburg effect by modulating the miR-338-3p-PKLR axis in hepatocellular carcinoma. Hepatology. 2015;62(4):1145–1159. .
- Wang W, Yang J, Zhang J, et al. Lipidomic profiling reveals soluble epoxide hydrolase as a therapeutic target of obesity-induced colonic inflammation. Proc Natl Acad Sci U S A. 2018;115(20):5283–5288. .
- Kachler K, Bailer M, Heim L, et al. Enhanced acid sphingomyelinase activity drives immune evasion and tumor growth in non-small cell lung carcinoma. Cancer Res. 2017;77(21):5963–5976. .
- Hammarström S. The carcinoembryonic antigen (CEA) family: structures, suggested functions and expression in normal and malignant tissues. Semin Cancer Biol. 1999;9(2):67–81.
- Caylà JA, Garcia-Zamalloa A, Taboada-Gomez J. Diagnostic Accuracy of Adenosine Deaminase and Lymphocyte Proportion in Pleural Fluid for Tuberculous Pleurisy in Different Prevalence Scenarios. PLoS ONE. 2012;7:e38729.