
ABSTRACT
Extracellular vesicles (EV) are membrane encapsulated nanoparticles that can function in intercellular communication, and their presence in biofluids can be indicative for (patho)physiological conditions. Studies aiming to resolve functionalities of EV or to discover EV-associated biomarkers for disease in liquid biopsies are hampered by limitations of current protocols to isolate EV from biofluids or cell culture medium. EV isolation is complicated by the >105-fold numerical excess of other types of particles, including lipoproteins and protein complexes. In addition to persisting contaminants, currently available EV isolation methods may suffer from inefficient EV recovery, bias for EV subtypes, interference with the integrity of EV membranes, and loss of EV functionality. In this study, we established a novel three-step non-selective method to isolate EV from blood or cell culture media with both high yield and purity, resulting in 71% recovery and near to complete elimination of unrelated (lipo)proteins. This EV isolation procedure is independent of ill-defined commercial kits, and apart from an ultracentrifuge, does not require specialised expensive equipment.
Introduction
Extracellular vesicles (EV) are membrane encapsulated nanoparticles that are released by all cell types [Citation1]. EV have been categorised into different subtypes based on their cellular or subcellular origin, size, or molecular composition. Although many names have been coined to define EV from different origins, it is now widely accepted that exosomes are secreted by multivesicular bodies (MVBs) as 40–120 nm vesicles, while microvesicles pinch directly from the plasma membrane and can range in diameter from 40 nm up to 1 µm [Citation2]. EV are present in all body fluids, including blood [Citation3], lymph [Citation4], ascites [Citation5], cerebrospinal fluid [Citation6], semen [Citation7], and breast milk [Citation8]. EV transfer their constituents, including cytosolic- and membrane proteins, lipids and RNA molecules, from their producing cells to acceptor cells. In this capacity, EV function as multicomponent intercellular signalling devices in a diverse range of physiological and pathophysiological processes, including immune regulation, angiogenesis, cancer metastasis and neuro-degeneration [Citation9–Citation13]. The molecular composition of EV is determined by their originating cell type and cell differentiation [Citation1,Citation14]. Both quantitative and qualitative changes in molecular composition have been reported for EV isolated from patient blood, indicating perspectives for their use as biomarkers of disease [Citation15–Citation18].
The amount of EV in blood plasma has been estimated between 107 and 1012 EV/mL [Citation19,Citation20]. This huge variation in concentration between studies has multifactorial causes, including loss of EV during their isolation, false assignment of contaminating particles as EV in isolates, and failure to detect small EV. When MVBs fuse with the plasma membrane, a proportion of the released exosomes may remain attached to the cell surface, for example, by tetherin [Citation21]. Alternatively, released EV may rebind directly to the releasing cell or to bystander cells, as exemplified by the ICAM-I dependent recruitment of EV from dendritic cells by bystander dendritic cells, B cells or T cells [Citation22,Citation23]. Thus, the concentration of EV is determined not only by the release of EV by their producing cells but also by the rate of their clearance by target cells. From that perspective, a relative low equilibrium concentration of EV in plasma is understandable and not indicative for their relevance in intercellular communication. Plasma contains, in addition to EV, also many other types of particles with biological activities, including lipoprotein particles and protein complexes. For example, while some miRNAs can be transferred by EV [Citation24], others are bound to high-density lipoprotein particles (HDL) [Citation25] or extracellular protein complexes [Citation26]. Similarly, intercellular transfer of some signalling proteins, including Wnt [Citation27], and bioactive lipids [Citation28], can be mediated by either EV, protein complexes, or lipoprotein particles. Human blood contains 6 × 10¹⁶ very low density lipoprotein particles (VLDL)/mL, 6 × 10¹⁴ low-density lipoprotein particles (LDL)/mL, and 2 × 10¹⁶ HDL/mL [Citation29], collectively outnumbering EV by at least 105 fold. This alone already illustrates the challenges for isolating EV from blood. Since current isolation protocols fail to isolate EV to homogeneity, it cannot be excluded that biological effects that have been assigned to EV in some studies may in fact have been caused by contaminating constituents [Citation30]. To confirm signalling potential of EV, as well as for the discovery of low abundant EV-associated biomarkers of disease, it is essential to be able to effectively isolate EV from other, much more abundant, plasma constituents. Unbiased isolation of EV remains a challenge, however, due to their population heterogeneity and overlapping characteristics with other constituents of biological fluids [Citation31].
For example, although immunocapture by immobilised monoclonal antibodies may yield highly purified EV, this isolation method relies on the presence of a capturing antigen [Citation32]. Given the heterogeneity in protein composition of EV from different origins, only subpopulations of EV can be isolated with this approach. Moreover, elution of EV from immune complexes may compromise their biological activity. Alternatively, various unbiased methods have been used to isolate EV from body fluids or cell culture media, including pelleting by ultracentrifugation (UC), polymeric precipitation, density gradient fractionation, filtration, size exclusion chromatography (SEC), and aqueous two-phase separation systems [Citation33–Citation35]. However, due to overlapping characteristics of EV compared to lipoprotein particles and protein complexes, including size distributions and equilibrium buoyant densities [Citation36], all of these methods fail to isolate EV to homogeneity. Other complications include poor recovery and losses due to non-specific binding of EV to plastics [Citation37]. Pelleting by UC provides low yields of EV [Citation38], induces EV aggregation and membrane rupture during resuspension of UC pellets [Citation39], and may interfere with the biological activities of EV [Citation40]. Moreover, protein complexes [Citation41] and some HDL [Citation42] are also pelleted at the same centrifugal force. Alternatively, polymeric precipitation methods allow for high yield recovery of EV at low centrifugal force [Citation43]. However, with these methods many other plasma constituents are co-precipitated with EV, resulting in poor isolation characteristics [Citation36,Citation44]. UC into density gradients can separate EV from soluble proteins and protein complexes [Citation45,Citation46], but inefficiently from HDL [Citation42] or LDL [Citation20]. SEC can separate EV from ~8 nm HDL, but is less efficient in separating EV from much larger (V)LDL, chylomicrons or protein complexes [Citation47–Citation49]. UC of EV into density gradients followed by SEC, or vice versa, improved isolation of EV from contaminating particles [Citation36,Citation50], illustrating the power of sequential appliance of different EV isolation techniques. In our current study, we extend on this idea and demonstrate that EV can be isolated to unmatched yield and purity from plasma or cell culture media by sequential use of PEG precipitation, upward displacement into linear iohexol density gradients, and SEC. The international Society for EV (ISEV) has emphasised the urgent need for more effective methods to isolate EV [Citation51–Citation53], and we believe that this procedure can fulfill that void.
Results
EV precipitation by PEG
Human blood was collected in sodium citrate tubes and depleted from cells and the majority of platelets by sequential centrifugation steps up to 3,000× g. Cell free plasma was then diluted with an equal volume of PBS and centrifuged at 10,000× g, a procedure that removed any remaining platelets. Inevitably, similarly sized large EV are also removed by this procedure. Samples of diluted platelet free plasma were then mixed with a PEG solution, and after incubation centrifuged for 15 min at 4,000× g to collect aggregated material (see Supplementary Figure 1 for schematic representation). PEG and salt concentrations, as well as buffer conditions were varied, and maximal recovery of EV from plasma was achieved when diluted plasma was mixed with an equal volume containing 20% PEG, 200 mM NaCl, 10 mM EDTA, 200 mM Tris-HCl, pH 7.0. Addition of EDTA to the PEG solution facilitated resuspension of the pelleted material. For comparison, EV were also collected by UC from diluted 10,000 × g supernatants of plasma. While UC pellets were invisible by the naked eye and yielded only 0.5 ± 0.1 mg protein per mL plasma (), PEG induced pellets were clearly visible and yielded as much as 9.9 ± 1.3 mg protein per mL plasma. UC and PEG induced precipitation yielded 2.0 × 10¹¹ and 2.3 × 10¹² particles per mL plasma, respectively, as determined by Nanoparticle Tracking Analysis (NTA) (). According to their measured size (), these particles may represent EV (70–300 nm), but could also represent large protein aggregates or lipoprotein particles, including chylomicrons and VLDL. It should also be noted that NTA has an estimated lower limit of detection of about 70 nm for EV [Citation54], meaning that some small EV, LDL and HDL were not detected by NTA. The relative high protein yield after PEG precipitation was confirmed by SDS-PAGE followed by total protein staining (). Also, the yield of the EV markers CD9 and CD81 was much higher with PEG precipitation as compared to UC (). ApoB100 is an apolipoprotein B isoform associated with both VLDL and LDL particles, and could be detected by immunoblotting in UC pellets, but was much more abundantly present in PEG precipitates (). Similarly, apoA1, a lipoprotein associated with both HDL and chylomicrons, was also more efficiently collected by PEG precipitation than by UC (). Precipitation of EV and lipoprotein particles in plasma required only 30 min incubation in 10% PEG at these conditions, as their marker protein signals were not increased further by prolonging the incubation time for up to 16 h (). In contrast to EV in plasma, previously isolated EV were inefficiently precipitated after 1 h incubation, and required overnight incubation with PEG for quantitative recovery (Supplementary Figure 2), indicating that PEG precipitation of EV from plasma is facilitated by the presence of other precipitating plasma constituents. EV and lipoprotein particles could be discerned by transmission electron microscopy (TEM) (). Both UC and PEG pellets contained structures reminiscent of EV, with a characteristic cup shaped appearance. In addition, homogeneously negatively stained smaller spherical structures could be discerned, which are characteristic for lipoprotein particles. The latter were relatively more abundant in PEG precipitates, consistent with the biochemical data. Combined, these results indicate that the yield of EV is about 7 fold higher by PEG precipitation in comparison to UC, although PEG precipitated material also contained more contaminating material, including lipoprotein particles.
Figure 1. Comparison of EV isolation by PEG precipitation or UC. EV were collected from equal volumes of blood. For PEG precipitation, 250 µL of 1:1 diluted plasma was mixed with an equal volume of 20% PEG. For UC, 250 µL of 1:1 diluted plasma was first diluted further with 4 mL PBS. Pellets were resuspended in PBS. (a), total protein was determined by BCA (expressed as mg/mL originating plasma; mean ± SD, n = 3). (b), the concentration of particles as detected by NTA (particles/mL originating plasma; mean ± SD, n = 3). (c), size distribution of particles detected in B (representative for n = 3). Particle size at peak optimum is indicated. (d and e), protein was collected either by centrifugation after incubation with PEG for the time indicated, or by UC. PEG and UC samples were normalised to equivalent volumes of originating plasma, or, where indicated, 2.5 × concentrated. Molecular weight markers are indicated on the left in kDa. (d), samples were analysed by SDS-PAGE followed by Sypro ruby total protein staining. (E), the same samples were analysed by Western blotting for the presence of the EV markers CD9 or CD81, the LDL marker apoB100, or the HDL marker apoA1. Experiment shown is representative for 3 independent experiments. (f), Whole amount TEM images of particles collected by either PEG precipitation or UC. Due to the high concentration of particles, PEG pellets were resuspended in 10 × higher volume of PBS than UC pellets. Scale bars, 100 nm. Arrows indicate EV, arrowheads exemplify some of the many lipoprotein particles.
EV isolation by iohexol density gradient centrifugation
As a second step, we used iohexol density gradients to separate EV from contaminating constituents that were also collected by either UC or PEG precipitation. Hereto, UC pellets or PEG precipitates were resuspended in 60% iohexol and overlaid with a 50–0% iohexol density gradient. EV were floated upward into the gradient by UC for 16 h at 200,000 × gmax, after which gradient fractions were analysed for their contents. EV that were first collected by UC and then centrifuged into the gradient, floated upwards to a density of 1,07–1,13 g/mL, as determined by the presence of CD9 and CD63 (). Most protein, however, failed to float up during density gradient UC, as can be expected for soluble proteins and protein complexes (). As indicated by its marker apoA1, HDL was retained in denser gradient fractions, well separated from CD9 (). Only little apoB100 was collected by UC (), but the little apoB100 that was pelleted floated up to the top of the density gradient, as can be expected for LDL (). Consistent with these results, TEM revealed that the top gradient fractions exclusively contained negatively stained spherical particles of ~50 nm, characteristic for LDL, while the bottom gradient fractions were enriched in ~10 nm particles, reminiscent of HDL (). The 5th and 6th fractions contained ~100 nm EV, but still also some smaller sized electron lucent lipoprotein-like particles.
Figure 2. Fractionation of UC isolates in iohexol density gradients. EV were collected by UC of a diluted equivalent of 2 mL plasma, loaded at the bottom of the gradient and separated during 16 h centrifugation at 200,000 × gmax. Fractions were collected from the top and analysed by Western blotting for the presence of CD9, CD63, apoA1, and apoB100 (a), BCA for protein quantification (b), and SDS-PAGE followed by total protein staining using Sypro ruby (c). Molecular weight markers are indicated on the left in kDa. (d), Particles from the indicated gradient fractions were adsorbed to grids and analysed by TEM. White bars indicate 200 nm, black bar in the enlarged insert indicates 100 nm. In fractions 5 and 6, EV are indicated by arrows, while lipoprotein particles are exemplified by arrowheads. Note the many small electron lucent lipoprotein particles in fractions 2 and 9. All data are representative for 3 independent experiments.
EV that were collected by PEG precipitation were floated into iohexol density gradients for either 4, 16, or 65 h UC at 200,000 × gmax (). Again, most proteins failed to float upward into the gradients, as can be expected based on the high buoyant density of freely soluble proteins and protein complexes (). CD9-containing EV were recovered at a density of 1.06–1.12 g/mL (), similar to the density of EV that were collected by UC, and consistent with reported equilibrium buoyant densities for EV [Citation45]. This position was independent of centrifugation time, indicating that the equilibrium buoyant density of CD9 carrying EV was reached already after 4 h of gradient centrifugation. ApoA1 was detected throughout the gradient, but mostly in the top 3 and bottom 4 gradient fractions after 4 h gradient centrifugation. ApoA1 that migrated to the top of the gradient (~1.02 g/mL) is most likely associated with lipoprotein particles with a low density and relatively large diameter, such as chylomicrons. ApoA1 that was retained in the bottom fractions after 4 h of gradient centrifugation gradually floated up into the EV containing fractions when the centrifugation time was increased from 4 h to 65 h, consistent with the expected behaviour of HDL. Although HDL and EV have overlapping equilibrium buoyant densities, the migration velocity of HDL is lower due to its relatively small size (7–12 nm). LDL (18–25 nm), VLDL (27–200 nm) and chylomicrons (up to 1 µm) have a lower density but are larger than HDL [Citation55]. As a consequence, the LDL marker apoB100 reached its equilibrium density of ~1,02–1.06 g/mL already after 16 h of centrifugation, well-separated from CD9. After 4 h of centrifugation, however, the majority of LDL was still present in higher density fractions, and overlapping with the distribution of CD9. Considering the distinct equilibrium densities and velocities of EV, HDL, and LDL, we conclude that 16 h centrifugation was most optimal to separate EV from most lipoprotein particles. To determine the relative distribution of other EV markers in the gradient, we next increased the sample load by a factor 8, now representing PEG precipitated material from 1 mL of plasma (-). After centrifugation for 16 h, the EV markers CD9, CD63 and CD81 co-distributed into gradient fractions 5 and 6 (), suggesting that EV from different (sub)cellular sources can be co-fractionated at these conditions. These EV confining fractions contained very little total protein as compared to the other gradient fractions (), again consistent with good separation of EV from its contaminants. As detected by TEM, fraction 3 contained negatively stained g ~ 20 nm and ~ 200 nm particles, presumably representing (V)LDL and chylomicrons, respectively (). Fractions 1 and 8 contained only small lipoprotein particles with sizes characteristic for LDL and HDL, respectively. Consistent with the distribution of EV marker proteins, EV were exclusively detected in fractions 5 and 6. However, these EV containing fractions (5th and 6th) also contained relatively small amounts of lipoprotein-like particles. Together with the detection in these fractions of trace amounts of apoA1 by immunoblotting, this indicated that the EV containing gradient fractions were contaminated by limited amounts of HDL particles.
Figure 3. Fractionation of PEG precipitates in iohexol density gradients. (a and b), For PEG precipitation, 250 µL of 1:1 diluted plasma was mixed with an equal volume of 20% PEG, and aggregates collected by low speed centrifugation, resuspended, and loaded on the bottom of iohexol density gradients. The gradients were centrifuged as indicated for either 4, 16, or 64 hr. Fractions were collected from the top of the gradients (left) and analysed by SDS-PAGE followed by Sypro ruby for total protein staining (a), or by Western blotting for detection of CD9, apoA1 and apoB100 (b). Molecular weight markers are indicated on the left in kDa. (c, d, e and f), after 1 hr incubation with PEG, aggregates in diluted equivalents of 1 mL plasma were collected by low speed centrifugation, resuspended, and loaded on the bottom of iohexol density gradients. The gradients were centrifuged for 16 hr, and gradient fractions were analysed by Western blotting for CD9, CD81 and CD63 (c), total protein in mg/mL plasma (d), SDS-PAGE followed by Sypro ruby for total protein staining (e), and TEM (f). White bars, 200 nm; black bars in the enlarged inserts, 100 nm. Note the abundance of EV indicated by arrows in fractions 5 and 6, relative to presumable lipoprotein particles (as exemplified by arrowheads), and the predominant presence of electron lucent lipoprotein particles in fractions 1 and 8. The very large lipoprotein particles in fraction 3 (asterixis) may represent chylomicrons. All data are representative for 3 independent experiments.
To validate our method for EV isolation from cell culture media, we used a B lymphocyte cell line that produces abundant amounts of EV [Citation45]. We have previously determined characteristics of these EV [Citation46,Citation56] and found that they are enriched in CD81, CD63 and major histocompatibility complex class II (MHC-II), but lack CD9. The cells were cultured in EV-depleted FCS containing medium. FCS contains LDL and HDL, but not VLDL or chylomicrons. The EV from these B cells were PEG precipitated from 20 mL cell free cell culture medium, and then floated into a iohexol density gradient during 16 h centrifugation (Supplementary Figure 3), similar to the procedure that was used above for plasma EV. As expected, the majority of PEG precipitated protein remained at the bottom of the gradient while all EV markers floated up to an equilibrium buoyant density of 1.07–1.15 g/mL. Bovine apoA1 was found both at the bottom and the top of the gradient. The indicated dominant high molecular weight protein in fractions 2–4 was identified by mass spectrometry as bovine apoB100 (data not shown), demonstrating the position of bovine LDL from FCS. TEM data confirmed the distribution of EV and lipoprotein particles in the gradient. Collectively, these data validate the use of this method for EV isolation from cell culture media.
EV isolation by SEC
Next, we isolated EV by combining PEG precipitation with SEC. When PEG precipitated material from human plasma was resuspended and directly applied onto Sepharose CL-2B columns, CD9 and CD63 carrying EV were collected in void volume fractions 9–12, while most protein, including apoA1 and apoB100, was collected in fractions 12–26, consistent with the notion that EV are larger than most lipoprotein particles and protein (complexes) (). The EV containing fractions did not display a clear peak in the distribution of total protein within the gradient. Moreover, EV carrying fractions were not entirely negative for apoA1 or apoB100. The presence of lipoprotein particles in EV carrying fractions was confirmed by TEM (). When PEG precipitated EV were first isolated by iohexol density gradient centrifugation and then applied to SEC (; see Supplementary Figure 1 for schematic representation), CD9 and CD63 again eluted into column fractions 9–12 (). SDS-PAGE followed by Sypro ruby protein staining now indicated a few protein bands uniquely present in fractions 9–12 (). The little apoA1 and apoB100 that contaminated the EV containing iohexol density gradient fractions was largely removed by SEC (). Separation of EV and contaminating lipoprotein particles by SEC was confirmed by TEM (). Detection of particles by TEM relies on non-specific binding of such particles to carbon coated grids, and differences in binding efficiencies of EV (subtypes) and lipoprotein particles may thus generate a bias in detection. Therefore, TEM is not a reliable method to determine relative contributions of distinct particles in isolates. To further determine the purity of our isolated EV and characterise their morphology with maximal resolution, we resorted to cryo-electron microscopy (cryo-EM). With this method, excess liquid is blotted away with a filter paper, leaving EV being contained within a thin (~50–200 nm) layer of vitrified ice. Some of the particles appeared to be adsorbed to the glow-discharged lacey carbon. For that reason, although far less so compared to TEM, some bias in particle detection cannot be excluded. Another advantage of cryo-EM is its unmatched resolution and particle preservation. EV can be clearly distinguished by their delimiting lipid bilayer, while lipoprotein particles are surrounded by a single layer of phospholipids (). We analysed 1310 randomly encountered particles from SEC fraction 10, and 90% of these could be identified as EV by the presence of a lipid bilayer. EV ranged between 30–400 nm, with an average diameter of 120 nm (). Of all EV, 61% had a single membrane, while 39% had one or more internal membrane(s) in addition to their delimiting membrane.
Figure 4. Fractionation of PEG precipitates by SEC. For PEG precipitation, 2 mL of 1:1 diluted plasma was mixed with an equal volume of 20% PEG. Aggregates were collected by low speed centrifugation, resuspended, and fractionated on a Sepharose CL-2B column. Total protein was determined by BCA (a) and SDS-PAGE followed by Sypro ruby staining (b), the presence CD9, CD63, apoA1, and apoB100 by Western blotting (c). Molecular weight markers are indicated on the left in kDa. (d), TEM images of EV in SEC fractions 9 and 10. Scare bars, 100 nm. Arrows indicate EV, arrowheads exemplify presumable lipoprotein particles. All data are representative for three independent experiments.
Figure 5. Fractionation by SEC after PEG precipitation and iohexol density gradient fractionation. For PEG precipitation, 2 mL of 1:1 diluted plasma was mixed with an equal volume of 20% PEG. Aggregates were collected by low speed centrifugation, resuspended, and loaded at the bottom of an iohexol density gradient. After 16 hr centrifugation, EV containing fractions were pooled and applied onto a Sepharose CL-2B column. SEC fractions were analysed by SDS-PAGE followed by Sypro ruby staining for total protein (a), and by Western blotting for the presence of CD9, CD63, apoA1 and apoB100 (b). Molecular weight markers are indicated on the left in kDa. (c), TEM images of particles in the indicated SEC fractions. White bars, 200 nm; black bar in the enlarged insert, 100 nm. EV are indicated by arrows, lipoprotein particles are exemplified by arrowheads. Fraction 18 shows lipoprotein particles only. These data are representative for 3 independent experiments. (d), Cryo-EM analysis of SEC fraction 10. EV (arrows), and one lipoprotein particle (arrowhead) are indicated. Scale bars, 100 nm. Black dots represent 5 nm gold particles that were spiked in for the purpose of image tracking. White asterisks point areas of the supporting carbon net. (E), Size distribution of randomly encountered EV by cryo-EM as in D.
To test whether our three-step isolation procedure can also be applied to isolate EV from cell culture media, EV from 20 mL B-cell culture medium were precipitated by PEG, and then floated into an iohexol density gradient during 16 h centrifugation. EV containing gradient fractions were pooled and applied for SEC. By SEC, the majority of protein fractionated together with MHC-II, CD63 and CD81, and was well separated from the majority of apoA1 (Supplementary Figure 4A and 4B). TEM data confirmed the presence of EV in these SEC fractions and minimal contamination with lipoprotein particles (Supplementary Figure 4C). Collectively, these data validate this method for EV isolation from cell culture media.
EV enrichment and recovery
Finally, we determined the enrichment and recovery of EV isolated by the entire three step procedure, involving PEG precipitation followed by iohexol gradient centrifugation and SEC. Based on our data, we conclude that the amount of EV in human plasma is very low relative to both soluble protein and EV unrelated particulate material. Assessment of EV recovery and enrichment during isolation from human plasma is complicated due to the low signals of EV markers in unfractionated plasma relative to total protein. Nevertheless, CD9, apoA1 and apoB100 could be detected in unfractionated human plasma by Western blotting (). Other EV markers could not be detected in unfractionated plasma by Western blotting due to the overwhelming excess of other proteins. To resolve this experimental problem, we introduced an independent marker, by spiking EV isolated from B-cell culture media into human plasma. EV from B cells contain a strong signal for MHC-II [Citation45] and have similar sizes and buoyant density distributions as EV from human plasma. EV from 100 mL B-cell media were collected by UC, yielding ~1013 NTA detectable particles, and resuspended in diluted plasma equivalent to 1 mL undiluted plasma. After spiking with B-cell-derived EV, total EV were isolated from plasma using PEG precipitation followed by iohexol gradient fractionation and SEC. As expected, MHC-II on B-cell EV co-fractionated with plasma EV markers on density gradients () and by subsequently performed SEC (). MHC-II was detected only when B-cell EV were spiked in, while CD9 was contributed exclusively by plasma EV (, lanes 1 and 2). After PEG precipitation, MHC-II and CD9 were collected quantitatively in the pellet (, lanes 3), indicating near to absolute recovery. As much as 20% of total plasma protein was collected in the pellet after PEG precipitation, indicating ~5 fold enrichment of EV over total protein in plasma (). When PEG precipitates were resuspended and fractionated on iohexol gradients, 77% of the original amount of MHC-II together with only 0.2% of the original amount of plasma protein was recovered in EV containing fractions, indicating a ~ 500 fold enrichment of EV by this two-step procedure (, lanes 4; 6 H). As a third and final isolation step, SEC was employed to remove iohexol as well as many of the remaining lipoproteins from the EV containing iohexol gradient fractions. After SEC, only 7 µg (0.01% of the original amount of plasma protein) was isolated while the recovery of EV, as determined by the MHC-II marker, was down to 35% due to losses by non-specific binding to the column material (, lanes 5). These data indicate a final ~3400 fold enrichment of EV relative to total plasma protein. The efficacy of SEC as a third EV isolation step, following PEG precipitation and iohexol gradient fractionation, was confirmed by comparing the protein compositions of EV samples before and after SEC using label free quantitative LC-MS/MS ( and Supplementary Table 1). In this case we isolated EV from unspiked plasma, to exclude contributions from B-cell EV. In total 287 proteins were identified, 37 of which were completely removed by SEC, leaving 250 proteins in EV containing SEC fractions. Relative quantification and linear regression analysis () revealed that on average 80% of the EV proteins was lost by SEC, consistent with Western blotting analysis (), which can be explained by non-specific binding of EV to the column resin. We also detected 15 lipoproteins (, indicated in red), most of which were reduced relative to EV associated proteins by SEC (see also Supplementary Table 2). Together, these data confirm that EV were purified further by SEC as a third isolation step. Gene ontology (GO) analysis linked 63% of the identified proteins to the cellular component “extracellular exosomes” (Supplementary Figure 5A). Molecular function analysis indicates that 18% of the proteins are linked to “antigen binding” (Supplementary Figure 5B). Biological process analysis confirmed that many detected proteins are involved in immune regulatory processes, while 22% of the EV associated proteins could be assigned to “complement activation” (Supplementary Figure 5C).
Figure 6. EV enrichment and recovery. (A, B, C and D), For PEG precipitation, 2 mL of 1:1 diluted plasma was spiked with EV isolated from 100 mL B cell culture medium, which are highly enriched for MHC-II. EV were then isolated from the spiked plasma by PEG precipitation, followed by floatation into iohexol gradients, and then SEC. (a), Fractions from the iohexol density gradients were analysed by Western blotting for the presence of the B cell EV specific marker MHC-II and the plasma EV specific marker CD9. (b), Fractions after SEC were analysed by Western blotting for the presence of MHC-II, CD9, CD63 and CD81. For each sequential isolation step, the recovery of total protein was monitored by SDS-PAGE (c) and for CD9, MHC-II, apoA1 and apoB100 by Western blotting (d). Samples from non-spiked plasma (lanes 1), plasma spiked with B cell EV (lanes 2), PEG precipitates (lanes 3), pooled EV containing iohexol density gradient fractions (lanes 4), and pooled EV containing SEC fractions (lanes 5) were all normalised to reach the same input relative to plasma. MHC-II was undetectable in non-spiked plasma, while CD9 could not be detected on B cell derived EV (not shown) and hence was not enhanced in spiked plasma. The quantification for recovery of MHC-II was determined for each step of the isolation procedure and is depicted in Fig. 6 H. (e), Scatterplot of the relative intensities of proteins detected by LC-MS/MS in EV containing density gradient fractions (DG) and after SEC (for their identity see Supplementary Table 1). The in red coloured named dots represent apolipoproteins (see also Supplementary Table 2), the open circles represent proteins that were undetectable after SEC and presumably not associated with EV (see Supplementary Table 1). The dotted line Y = X would represent quantitative retrieval. The solid line is generated by linear regression analysis for all proteins except apolipoproteins and those proteins that were not detected after SEC, and is indicative for 8.4 fold loss of EV due to non-specific binding of EV to the SEC column. (f), EV from 100 mL B cell culture media were isolated by UC followed by iohexol density gradient (DG) centrifugation and SEC, either using a qEV column or a Sepharose CL-2B column that was equilibrated and eluted in the absence or presence of access BSA, as indicated. After SEC, EV containing fractions were pooled and normalised to the input, and analysed by Western blotting for MHC-II. (g), EV were isolated from plasma spiked with B cell EV by PEG precipitation followed by iohexol density gradient fractionation and SEC using Sepharose CL-2B columns that were equilibrated and eluted either in the absence or presence of 1 mg/mL BSA. For each sequential isolation step, the recovery of MHC-II was monitored by SDS-PAGE and Western blotting using normalised samples, as indicated. Molecular weight markers are indicated on the left in kDa. All data are representative for 3 independent experiments. (H), Recovery and enrichment of EV from plasma after PEG precipitation, subsequent iohexol gradient fractionation and SEC. Total isolated protein was determined by BCA and is expressed as mg/mL originating plasma (±SD, n = 3). Recovery of MHC-II was determined by quantification of Western blotting signals as in Fig. 6D, and is expressed as percentage relative to the signal in originating plasma spiked with EV from B cells (mean ± SD, n = 3). Enrichment of MHC-II carrying EV was calculated relative to total protein in the same fraction (mean ± SD, n = 3). Enrichment could not be determined after SEC in the presence of BSA due to the excess of BSA (N.D.).
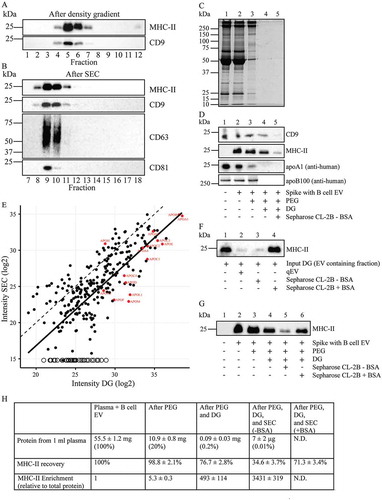
Finally, we investigated whether loss of EV as a consequence of non-specific binding to SEC columns could be prevented. Irrespective of the type of column used, Sepharose CL-2B or qEV, ~ 65% of the MHC-II signal of the column input material was lost during SEC (). EV loss could be largely prevented, however, when the SEC columns were preequilibrated and eluted with PBS containing 1 mg/mL BSA (). For obvious reasons, we could not determine the enrichment of EV over total plasma protein when BSA was used as a blocking reagent.
Discussion
Methods that are used to isolate EV are often poorly characterised for the yield and purity of isolated EV. We here describe a novel method that allows for the isolation of EV from either plasma or cell culture medium with both high yield and purity. This method is relatively simple and highly reproducible. It relies on relative inexpensive reagents that can be purchased in bulk quantities. PEG is non-toxic and even used in medicine, for example, to treat constipation or as drug delivery system. Similarly, iohexol is a non-toxic contrasting reagent used in X-ray imaging and CT scanning. Non-toxicity is of importance when isolated EV are used in in vivo experiments or for medical applications. PEG is far less expensive than commercial polymer-based EV precipitation kits, while the molecular composition of these kits is not public. Finally, it should be realised that EV isolated by commercial isolation kits are highly contaminated by co-precipitated plasma constituents, similar to PEG precipitated EV. To exclude contributions from platelets, we here isolated EV from human plasma from which platelets had been removed by centrifugation at 10,000 × g. It should be noted that this procedure also removed large EV, including large microvesicles and apoptotic bodies. However, our method can also be applied to 1,500–2,500 × g supernatants of human plasma, which in addition to small EV also contains large EV together with residual amounts of platelets. We here demonstrate that EV could be captured from 10,000 × g supernatants by PEG precipitation with near to 100% efficiency, and that 20% of all plasma protein, including lipoprotein particles, was co-precipitated with this procedure. PEG precipitation takes less than 1 h, and although this first simple step in our EV isolation protocol resulted in only ~5 fold enrichment of EV over total plasma protein, it allowed for rapid concentration of EV into a small volume with maximal efficacy. Our optimised PEG precipitation conditions are somewhat distinct from other studies who have used PEG to precipitate EV [Citation43,Citation57,Citation58], or employed PEG precipitation for the isolation of lipoprotein particles [Citation59–Citation61]. PEG is a non-denaturing water-soluble polymer whose ability to precipitate proteins and particles is based on excluded volume interactions. This is why it is also widely used for protein crystallisation [Citation62]. Reduction in protein solubility by the presence of PEG is dependent on PEG concentration as well as on protein/particle size and protein concentrations [Citation63]. Indeed, efficient precipitation of EV in the absence of excess plasma protein required longer incubation time with PEG (Supplementary Figure 2). Macromolecules and particles that are aggregated by the presence of PEG can be collected by low speed centrifugation. PEG itself is not precipitated and pelleted particle/protein aggregates are readily disaggregated upon their resuspension in a PEG lacking buffer. Low concentrations of PEG remain after resuspension of the pelleted material, but this may in fact help to prevent non-specific binding of proteins/particles to each other or to plastics [Citation64]. In our hands, EDTA facilitated rapid dispersion of PEG precipitated EV, possibly by preventing Ca2+ dependent processes such as integrin binding. Our TEM analysis confirmed that PEG precipitated EV were evenly dispersed after resuspension in PEG lacking buffer (). In contrast, EV collection by UC results in poor EV recovery () and in irreversible EV aggregation, while membrane rupture during resuspension of the pellet may occur [Citation39]. In conclusion, we here demonstrate that PEG precipitation is superior to UC for concentrating EV.
To remove contaminants from PEG precipitated EV, we employed density gradient centrifugation. The density at which EV accumulate and the degree by which they can be separated from contaminating particles are determined by the gradient material. Iohexol is a non-toxic, small, iodinated, high molecular weight molecule (821 g/mol). Iodixanol (Optiprep) is commonly employed to generate density gradients for the purpose of EV isolation, and this compound is essentially a dimer of iohexol. However, we found that the linearity of precasted iohexol gradients was preserved much better than for iodixanol gradients during UC, as a consequence of the lower molecular weight of the former compound. Both iohexol and iodixanol gradients display better separation characteristics as compared to sucrose density gradients, probably due to the much higher osmolarity and viscosity of sucrose gradients [Citation61]. Moreover, due to the high viscosity of sucrose density gradients, higher g forces or longer centrifugation times are required for EV to reach their equilibrium buoyant density [Citation7]. PEG precipitated pellets readily disaggregated in the low viscosity buffer containing 60% iohexol, thus allowing loading at the bottom of an overlaid linear iohexol density gradient. With this approach, soluble proteins and protein complexes were retained by definition at the bottom of the gradient during centrifugation, due to their high buoyancy. We avoided top loading of the density gradients because top loaded large protein (complexes) migrated, albeit with low velocity, into EV containing fractions, never reaching their equilibrium buoyant density at the bottom of the gradient, thereby contaminating the EV containing fractions (data not shown). After centrifuging bottom loaded gradients for 16 h at 200,000 × gmax of, EV were recovered at their equilibrium buoyant density in the middle of the gradient, well separated from soluble protein (complexes) and HDL in the lower part of the gradient and LDL at the top of the gradient. After 4 h centrifugation, slowly migrating LDL had not yet reached its equilibrium density at the top of the gradient and consequently was not well separated from EV. HDL had an even lower velocity than LDL and required 65 h of centrifugation time to reach its equilibrium buoyant density, which is overlapping with that of EV. These data illustrate the importance of monitoring the migration of lipoprotein particles during density gradient centrifugation and tuning of the centrifugation force and time for optimal separation of EV from both LDL and HDL.
As a final step, we used SEC to remove remaining lipoprotein particles as well as iohexol. Single-step isolation of EV from plasma by SEC with Sepharose CL-2B was first described by Boing et al [Citation48]. These authors reported a 330-fold enrichment of EV over total plasma protein and 19-fold enrichment relative to HDL, with 31% recovery of EV. The same protocol was used in a later study, confirming contamination of EV fractions with both HDL and LDL [Citation36]. Sepharose CL-2B has a pore size of ~70 nm, and most EV eluted in the void volume, consistent with a diameter > 70 nm. With a diameter < 70 nm, most HDL and LDL were retained by the column, with limiting amounts eluting into the EV containing fractions. Other SEC columns such as qEV TM (Izon) also failed to completely separate EV from lipoprotein particles (data not shown and [Citation20,Citation65]). With our three-step approach, by far most lipoprotein particles were already removed in the second step by iohexol density gradient fractionation. Subsequent fractionation by SEC of EV containing gradient fractions removed most of the remaining HDL and LDL, as determined both by Western blotting, label free quantitative mass spectrometry, and cryo-EM. The latter indicated that after the three step purification, 90% of all particles detected represented EV, as determined by the presence of a delimiting lipid bilayer, with the remaining 10% representing lipoprotein particles. Others reported that some EV isolated from plasma may physically associate to lipoprotein particles [Citation20,Citation66], but we detected only three examples of such chimeras in our SEC fractions by cryo-electron microscopy. We noted significant losses of EV when EV from iohexol gradient fractions were purified further by SEC, either by Sepharose CL-2B or qEV TM, probably as a consequence of non-specific binding to the surface of the column beads. This loss could be prevented by saturating non-specific binding sites in the column with excess BSA prior to applying the EV samples, consistent with results by others [Citation37]. SEC also removed iohexol and can be used to switch at will to any buffer, which is important for molecular or functional analysis of isolated EV. With LC-MS/MS we identified 287 proteins before SEC and 250 proteins after SEC in EV containing fractions (Supplementary Table 1). The 37 identified proteins that were quantitatively removed by SEC (Supplementary Table 1) are nearly all extracellular proteins that potentially can associate transiently to protein complexes such as complement or extracellular matrix, or with membranes, explaining how they may contaminate EV-containing fractions. Of the 250 proteins that were identified in EV containing SEC fractions, 65% was linked to “extracellular exosomes” (Supplementary Figure 5A). Although 15 apolipoproteins could still be detected after SEC, their relative abundance was significantly decreased relative to EV fractions before SEC (; Supplementary Figure 2). Interestingly, the amount of apoH was not decreased by SEC. However, apoH is a misnomer, also known as beta-2-glycoprotein 1, a protein that is associated with cardiolipin containing membranes rather than to lipoprotein particles. Plasma EV have diverse cellular origins and are thus heterogeneous in protein composition [Citation67]. Among the 250 proteins that we detected in highly purified EV, many are associated with GO terms that are related to complement or immune regulation. These observations are consistent with well-established observations that immune cells in circulation, including monocytes and lymphocytes, abundantly release EV [Citation68].
Collectively, our data demonstrate the benefit of using SEC to purify EV after density gradient centrifugation. EV losses by non-specific binding to SEC columns should be considered, but this can easily be prevented by using BSA containing equilibration and elution buffers (). Considering a total loss of 65% of EV during the entire isolation procedure (), we estimate that 1 mL of a 10,000 × g plasma supernatant contained ~11 µg of EV, equalling 1,5 × 10¹¹ NTA detectable particles. Importantly, the B-cell-derived EV that were spiked into the plasma as a marker were numerically outnumbered > 10 fold by the plasma EV (data not shown). We conclude that 1 µg EV consists of ~1.4 × 10¹⁰ NTA detectable particles. A similar number can be calculated when assuming an average EV diameter of 100 nm and average EV protein density of 100 mg/mL, and this amount is also close to the number of EV per µg protein that was determined by others [Citation69]. It must be borne in mind, however, that EV < 50 nm cannot be detected by NTA and that large EV were lost together with platelets during the 10,000 × g centrifugation of plasma prior to EV isolation. Furthermore, it cannot be excluded that some particles other than EV were still present in the final isolate. The least biased method to date for particle sampling and EV identification by electron microscopy is cryo-EM, and using this method we identified 90% of the isolated particles as EV and the remaining 10% as lipoprotein particles. Human blood contains 6 × 10¹⁶ VLDL, 6 × 10¹⁴ LDL, and 2 × 10¹⁶ HDL particles per mL29. Given our estimation of 1.5 × 10¹¹ NTA detectable small EV per mL plasma, EV in plasma are outnumbered at least 105 fold by lipoprotein particles, explaining why it is so difficult to isolate EV to absolute purity. Nevertheless, these numbers also indicate that we were able to enrich for EV at least 106 fold relative to lipoprotein particles.
In conclusion, we showed that unbiased isolation of EV from plasma to very high purity could be accomplished by three sequentially performed isolation steps: PEG-precipitation, iohexol gradient centrifugation, and SEC in the presence of excess blocking protein. This method can also be applied to isolate EV from cell culture media. The required reagents can be purchased in bulk quantities and are relatively cheap as compared, for example, to commercial EV isolation kits. Our three-step protocol takes a maximum of two working days, separated by an overnight centrifugation step. Efficient and effective isolation of EV from contaminating particles is essential to accelerate the discovery of EV-based biomarkers, to validate functions of EV in biological processes, and for the translation of EV to diagnostic, prognostic and therapeutic applications. This protocol provides such requirements and to our best knowledge is unmatched by any other EV isolation procedure.
Methods
Preparation of human plasma and conditioned B-cell culture medium
Blood from healthy volunteers was obtained following institutional ethical approval (www.umcutrecht.nl/METC; protocol number 07–125/C). The experiments abide by the declaration of Helsinki principles for human research ethics. Blood was collected in trisodium citrate containing anticoagulant tubes (BD, UK). Cells and platelets were removed by centrifugation at 2,500 × g for 15 min at room temperature. The supernatant was collected and re-centrifuged at 3,000 × g for 15 min. The supernatant was collected, diluted with an equal volume of PBS, and centrifuged at 10,000 × g for 30 min at 4°C to remove any remaining platelets.
RN cells (HLA-DR15+ B cells) were cultured as described [Citation45]. EV were isolated from 3 day cell cultures. Hereto, cells were washed with PBS by centrifugation, and cultured in IMDM (Gibco, 1956942) supplemented with 10% EV depleted foetal calf serum (FCS). EV-depleted FCS was generated from 30% FCS diluted in IMDM by UC at 100,000 × g for 16 h at 4°C. After centrifugation, EV depleted FCS was carefully pipetted from the top of the tube, discarding the bottom 10% of the volume. After 3 day culturing in EV-depleted FCS containing medium, cell concentrations were typically ~1 × 10⁶ cells/mL. Cells were removed from media by centrifugation twice at 200 × g for 10 min. The medium was collected and centrifuged twice for 10 min at 500 × g, and 30 min at 10,000 × g at 4°C. The final supernatant was collected and stored at −20°C until use.
EV collection by UC
For EV collection from platelet free plasma by UC, 250 µL was diluted with 4 mL sterile PBS and centrifuged for 1 h at 100,000 × g in a Beckman SW60 rotor at 4°C. To collect EV from B-cell culture medium by UC, 10,000 × g supernatant was centrifuged for 1 h at 100,000 × g in a Beckman SW40 rotor at 4°C. Supernatants were carefully removed and discarded, and the pellets resuspended in either SDS sample buffer, PBS, or iohexol containing buffer, for applications indicated below.
EV collection by PEG precipitation
For PEG precipitation, samples of platelet free plasma or B-cell-conditioned medium were mixed with an equal volume of PEG buffer and rotated end-over-end at 4°C for 1 h, unless indicated otherwise. PEG buffer contained 20% w/v PEG6000 (Sigma, BCBT1548) in 200 mM NaCl, 10 mM EDTA, 200 mM Tris-HCl, pH 7.0. Samples were then centrifuged for 15 min at 4,000 × g in an Eppendorf centrifuge. Supernatants were carefully removed, and pellets resuspended in either SDS sample buffer for protein analysis, or in PBS for NTA or SEC, or in iohexol containing buffer for density gradient centrifugation (see below).
Iohexol density gradient centrifugation
Pellets from UC or PEG precipitation were resuspended in 700 µL 60% (w/v) iohexol (Nycodenz from Axis-Shield, 10179579) in 100 mM NaCl, 5 mM EDTA, 10 mM Tris-HCl, pH 7.0, and placed at the bottom of a SW60 tube (Beckman). Gradients were made by sequential layering of 300 µL samples of 50%, 45%, 40%, 35%, 30%, 25%, 20%, 15%, 10%, 5% and 0% iohexol, each in 100 mM NaCl, 5 mM EDTA, 10 mM Tris-HCl, pH 7.0. The gradients were centrifuged at 200,000 × gmax at 4°C for either 4, 16 or 65 h, as indicated. After centrifugation, 11 fractions of 300 µL were collected by pipetting from the top of the tube, with a bottom 12th fraction of around 700 µL. Densities were determined by refractometry.
Size exclusion chromatography
Sepharose CL-2B (GE healthcare, 17014001) was packed in 6.2 cm long columns with diameter of 1.5 cm (Econo-Pac chromatography columns from Bio-Rad), and washed with 5 column volumes of PBS, 5 mM EDTA. When indicated, the washing buffer was supplemented with 1 mg/mL BSA. For this purpose, a 10% BSA stock solution was used that had been depleted from any particulate material by UC for 16 h at 200,000 × gmax at 4°C. EV containing fractions from the iohexol gradient were pooled, loaded on the column, and eluted with PBS, 5 mM EDTA. Similarly, PEG precipitates were resuspended in 1 mL PBS containing 5 mM EDTA and applied to the column. When indicated, qEV TM columns (Izon) were used instead. 26 Fractions of 0.5 mL were collected and stored at −20°C until use.
SDS-PAGE, Western blotting and protein concentration measurement
For protein analysis of iohexol density gradient fractions or SEC column fractions, proteins were first concentrated by trichloroacetic acid (TCA) precipitation. Hereto, iohexol gradient fractions were first diluted 2 fold with PBS containing 5 mM EDTA to reduce the density and viscosity of the samples. To increase the efficacy of TCA precipitation at low protein concentrations [Citation70], sodium deoxycholate was added as a carrier to reach a final concentration of 2 mg/mL. Thereafter, a solution of ice cold 100% (w/v) TCA (Merck, 1008070250) was added to a final concentration of 20%, and mixed immediately. After 30 min at 4°C, precipitates were pelleted by centrifugation for 10 min at 16,000 × g at 4°C in an Eppendorf centrifuge. The supernatant was removed, and the pellet washed twice by resuspension in 1 mL acetone at −20°C and centrifugation as above. The final pellets were air dried, resuspended in non-reducing SDS sample buffer and heated for 5 min at 95°C.
For total protein analysis, samples were separated by 10% SDS-polyacrylamide gel electrophoresis (PAGE), stained with Sypro ruby (Invitrogen, 1890270) according to the manufacturer instructions, and detected using a Bio-Rad ChemiDoc imager. Pre-stained protein marker (Bio-Rad) was used as a molecular weight standard. For Western blotting, proteins were separated either by 6% or 10% SDS-PAGE and transferred by electrophoresis to PVDF membranes (Millipore, Billerica, MA). The blots were blocked for 1 h in PBS containing 0.1% Tween-20, and either 0.2% cold fish skin gelatin or 5% non-fat milk powder, and incubated overnight with antigen-specific antibodies in the same buffer. CD9 was detected using mouse anti-human CD9 (HI9a, 312102, Biolegend, 1:2,000); CD63 with mouse anti-human CD63 (H5 C6, 556019, BD Biosciences, 1:250); CD81 with mouse anti-human CD81 (B11, sc-166029, Santa Cruz Biotechnology, 1:500); MHC-II with mouse anti-human MHC-II (CR3/43, M077501-2, Dako, 1:10,000); apoB100 with goat anti-human apoB100 (AF3260, R&D systems, 1:1,000); and apoA1 with mouse anti-human apoA1 (b10, sc-376818, Santa Cruz Biotechnology, 1:1,000). Primary antibodies were labelled for 1 h with HRP-conjugated goat anti-mouse Ig (Jackson Immuno Research, 1:10,000) or donkey anti-goat Ig (Dako, 1:5,000). HRP was detected with Super Signal West Dura Chemiluminescent Substrate (Thermo Fisher Scientific, TF267375) using a Bio-Rad Chemidoc imager. Relative signal intensities were determined using Bio-Rad image lab 5.1 software. All antibodies used revealed specific protein signals as determined by appropriate molecular weights and lack of signal with negative control primary antibodies.
Protein concentrations were determined by BCA protein assay (Thermo Fisher Scientific, TD265235) or microBCA protein assay (Thermo Fisher Scientific, KH133946), according to the manufacturer’s instructions. It should be noted that the BCA assay is sensitive not only for protein but to a minor extent also for lipids [Citation71]. Lipoprotein particle detection by BCA thus results from both protein and lipids that are associated with these particles. PEG containing samples were diluted prior to analysis to eliminate significant contribution of PEG in protein quantification [Citation72]. Iohexol did not interfere with the BCA protein assay [Citation73].
Nano particle tracking analysis (NTA)
The concentration and size distribution of isolated particles was determined by NTA using a NS500 model (Nanosight Technology, Malvern, UK), configured with a high-sensitivity sCMOS camera. The camera level was set at 14 and the detection threshold was 3. The fractions were diluted to obtain < 200 particles/frame. Triplicate videos of 30 s were recorded and analysed for each sample by NTA 3.1 software.
Electron microscopy
For TEM, 150-mesh copper grids coated with formvar and carbon were used. Sample droplets of 20 µL were placed on parafilm, covered with a grid, incubated for 10 min at room temperature to allow non-specific particle binding and then transferred to a drop of 2% paraformaldehyde in 0.1 M phosphate buffer for 5 min at RT. Subsequently, the grids were washed 3 × 1 min with milliQ water. For negative staining, the grids were transferred onto a 10 µL drop containing 0.4% uranyl acetate and 1.8% methylcellulose, and incubated for 5 min on ice. Excess fluid was removed using filter paper and the grids were dried on air. Samples were imaged using a transmission electron microscope (Fei, Tecnai-12, Eindhoven, the Netherlands) operating at 80 kV.
For cryo-electron microscopy, 3 μl samples of SEC fractions were applied to 200 mesh lacey carbon copper grids (Quantifoil, Germany) that had been glow-discharged for 25 s prior to use. After 1 min incubation at 23°C in a 100% humidified atmosphere, samples were diluted 1:1 with 10 nm fiducial gold particles in PBS, for tracing purposes, and vitrified using a Vitrobot Mark IV (FEI Company, The Netherlands). Micrographs were recorded on a FEI Talos Arctica transmission electron microscope equipped with a “K2 Summit” direct electron detector (Gatan, USA). The electron microscope was operated at 200 kV, spot size 8. The SerialEM software [Citation74] was used for data acquisition. For statistical evaluation, maps of full grid squares were recorded at ~15,000 × magnification with a nominal defocus value of 23.2 μm, resulting in a pixel spacing of 0.9 nm on the detector. Higher magnification snapshots were recorded at ~79,000 × magnification and a nominal defocus of 3 μm using dose fractionation (5 s total exposure at 1.44 e-/Ås, 0.2 s per frame). Images were motion corrected using motioncor 2 [Citation75]. To analyse vesicle morphology and distribution, grid square maps at 15,000 × magnification were systematically inspected using IMOD 4.9.4 [Citation76]. Figures from 79,000 × magnification snapshots were prepared in IMOD, as well. Vesicle diameter, morphology, and aggregation state were determined manually from these maps. Lipoprotein particles were identified visually based on their morphology. Only grid squares with little ice crystal contamination were taken into account since some ice crystals can have a morphology similar to lipoprotein particles. Nevertheless, for this reason overestimation of the contribution of lipoprotein particles relative to EV cannot be excluded.
Mass spectrometry
LC-MS/MS was performed to analyse the proteome of EV isolates from human plasma. EV were isolated from 1 mL human plasma by PEG precipitation followed by iohexol gradient fractionation and SEC. Protein from EV containing iohexol gradient fractions (fractions 5 and 6) or SEC fractions (fractions 8, 9 and 10) were pooled and concentrated by TCA precipitation as indicated above. The proteins in TCA pellets were resuspended and alkylated in 8 M Urea, containing 1 M ammonium bicarbonate, 10 mM Tris (2-carboxyethyl) phosphine hydrochloride (TCEP) and 40 mM 2-chloro-acetamide, diluted 4 times with 1 M ammonium bicarbonate, and digested with trypsin (500 ng). The resulting peptides were desalted with homemade C-18 stagetips (3 M, St Paul, MN). Using high pH elution, three fractions were prepared (5, 10 and 30% acetonitrile, set to pH = 10 with 10 mM Ammonium Formate), which were dried in the speedvac and dissolved in buffer A (0,1% Formic Acid). Peptides were separated on a 30 cm pico-tip column (75 µm ID, New Objective) in-house packed with 1.9 µm aquapur gold C-18 material (dr. Maisch) using 140 gradient (7% to 80% ACN 0.1% FA), delivered by an easy-nLC 1000 (Thermo), and electro-sprayed directly into a Orbitrap Fusion Tribrid Mass Spectrometer (Thermo Scientific). The latter was set in data dependent Top speed mode with a cycle time of 1 s, in which the full scan over the 400–1500 mass range was performed at a resolution of 240,000. Most intense ions (intensity threshold of 15000 ions) were isolated by the quadrupole and fragmented with a HCD collision energy of 30%. The maximum injection time of the ion trap was set to 50 ms with injection of ions for all available parallelizable time. Raw files were analysed with Maxquant software, version 1.6.3.4 [Citation77]. For identification, the Human Uniprot database (Jan 2019) was searched with oxidation and protein N-terminus acetylation set as variable and carbamidomethylation of cysteine set as fixed modification, while peptide and protein false discovery rates were set to 1%. The data are deposited at the ProteomeXchange Consortium via the PRIDE partner repository with the dataset identifier PXD015283.
EV-TRACK
The relevant data of our experiments were submitted to the EV-TRACK knowledgebase (EV-TRACK ID: EV200037) [Citation78].
Author contributions
W.S. conceived the study. W.S. and X.G.Z. designed experiments. X.G.Z. and E.G.F.B. performed experiments. A.M.L. performed cryo-electron microscopy. H.R.V. performed protein mass-spectrometry analysis. X.G.Z. and W.S. wrote the manuscript, and all authors contributed to revision and editing of the manuscript.
Competing interests
The authors declare no competing interests.
Supplemental Material
Download Zip (35.9 MB)Acknowledgments
Xiaogang Zhang is the recipient of a doctoral scholarship from China Scholarship Council (No. 201606300042). The authors thank Dr. George Posthuma for his assistance with transmission electron microscopy, and Robert M. van Es for his assistance with mass spectrometry analysis which was financially supported by the “Proteins at Work” program of The Netherlands Organization for Scientific Research (NWO) (project number 184.032.201). A. Manuel Liaci is funded by the ERC Consolidator Grant 724425. The authors would like to thank Prof. Friedrich Förster (Utrecht University) for continuous support.
Supplementary material
Supplemental data for this article can be accessed here
Correction Statement
This article has been republished with minor changes. These changes do not impact the academic content of the article.
Additional information
Funding
References
- van Niel G, D’Angelo G, Raposo G. Shedding light on the cell biology of extracellular vesicles. Nat Rev Mol Cell Biol. 2018;19(4):213–19.
- Raposo G, Stoorvogel W. Extracellular vesicles: exosomes, microvesicles, and friends. J Cell Biol. 2013;200(4):373–383.
- Caby MP, Lankar D, Vincendeau-Scherrer C, et al. Exosomal-like vesicles are present in human blood plasma. Int Immunol. 2005;17(7):879–887.
- Milasan A, Tessandier N, Tan S, et al. Extracellular vesicles are present in mouse lymph and their level differs in atherosclerosis. J Extracell Vesicles. 2016;5:31427.
- Shenoy GN, Loyall J, Berenson CS, et al. Sialic acid-dependent inhibition of T cells by exosomal ganglioside GD3 in ovarian tumor microenvironments. J Immunol (Baltimore, Md: 1950). 2018;201(12):3750–3758.
- Manek R, Moghieb A, Yang Z, et al. Protein biomarkers and neuroproteomics characterization of microvesicles/exosomes from human cerebrospinal fluid following traumatic brain injury. Mol Neurobiol. 2018;55(7):6112–6128.
- Aalberts M, van Dissel-emiliani FM, van Adrichem NP, et al. Identification of distinct populations of prostasomes that differentially express prostate stem cell antigen, annexin A1, and GLIPR2 in humans. Biol Reprod. 2012;86(3):82.
- van Herwijnen MJ, Zonneveld MI, Goerdayal S, et al. Comprehensive proteomic analysis of human milk-derived extracellular vesicles unveils a novel functional proteome distinct from other milk components. Mol Cell Proteomics. 2016;15(11):3412–3423.
- Lindenbergh MFS, Stoorvogel W. Antigen presentation by extracellular vesicles from professional antigen-presenting cells. Annu Rev Immunol. 2018;36:435–459.
- Tominaga N, Kosaka N, Ono M, et al. Brain metastatic cancer cells release microRNA-181c-containing extracellular vesicles capable of destructing blood-brain barrier. Nat Commun. 2015;6:6716.
- Xu R, Rai A, Chen M, et al. Extracellular vesicles in cancer - implications for future improvements in cancer care. Nat Rev Clin Oncol. 2018;15(10):617–638.
- Kalluri R. The biology and function of exosomes in cancer. J Clin Invest. 2016;126(4):1208–1215.
- Becker A, Thakur BK, Weiss JM, et al. Extracellular vesicles in cancer: cell-to-cell mediators of metastasis. Cancer Cell. 2016;30(6):836–848.
- Mathieu M, Martin-Jaular L, Lavieu G, et al. Specificities of secretion and uptake of exosomes and other extracellular vesicles for cell-to-cell communication. Nat Cell Biol. 2019;21(1):9–17.
- Boukouris S, Mathivanan S. Exosomes in bodily fluids are a highly stable resource of disease biomarkers. Proteomics Clin Appl. 2015;9(3–4):358–367.
- De Toro J, Herschlik L, Waldner C, et al. Emerging roles of exosomes in normal and pathological conditions: new insights for diagnosis and therapeutic applications. Front Immunol. 2015;6:203.
- Pitt JM, Kroemer G, Zitvogel L. Extracellular vesicles: masters of intercellular communication and potential clinical interventions. J Clin Invest. 2016;126(4):1139–1143.
- He Y, Lin J, Kong D, et al. Current state of circulating microRNAs as Cancer Biomarkers. Clin Chem. 2015;61(9):1138–1155.
- Arraud N, Linares R, Tan S, et al. Extracellular vesicles from blood plasma: determination of their morphology, size, phenotype and concentration. J Thromb Haemost. 2014;12(5):614–627.
- Sodar BW, Kittel A, Paloczi K, et al. Low-density lipoprotein mimics blood plasma-derived exosomes and microvesicles during isolation and detection. Sci Rep. 2016;6:24316.
- Edgar JR, Manna PT, Nishimura S, et al. Tetherin is an exosomal tether. eLife. 2016;5:e17180.
- Nolte-’t Hoen EN, Buschow SI, Anderton SM, et al. Activated T cells recruit exosomes secreted by dendritic cells via LFA-1. Blood. 2009;113(9):1977–1981.
- Segura E, Nicco C, Lombard B, et al. ICAM-1 on exosomes from mature dendritic cells is critical for efficient naive T-cell priming. Blood. 2005;106(1):216–223.
- Montecalvo A, Larregina AT, Shufesky WJ, et al. Mechanism of transfer of functional microRNAs between mouse dendritic cells via exosomes. Blood. 2012;119(3):756–766.
- Vickers KC, Palmisano BT, Shoucri BM, et al. MicroRNAs are transported in plasma and delivered to recipient cells by high-density lipoproteins. Nat Cell Biol. 2011;13(4):423–433.
- Arroyo JD, Chevillet JR, Kroh EM, et al. Argonaute2 complexes carry a population of circulating microRNAs independent of vesicles in human plasma. Proc Natl Acad Sci U S A. 2011;108(12):5003–5008.
- Routledge D, Scholpp S. Mechanisms of intercellular Wnt transport. Development. 2019;146(10):dev176073.
- Record M, Poirot M, Silvente-Poirot S. Emerging concepts on the role of exosomes in lipid metabolic diseases. Biochimie. 2014;96:67–74.
- Garvey WT, Kwon S, Zheng D, et al. Effects of insulin resistance and type 2 diabetes on lipoprotein subclass particle size and concentration determined by nuclear magnetic resonance. Diabetes. 2003;52(2):453–462.
- Gyorgy B, Modos K, Pallinger E, et al. Detection and isolation of cell-derived microparticles are compromised by protein complexes resulting from shared biophysical parameters. Blood. 2011;117(4):e39–48.
- Ludwig N, Whiteside TL, Reichert TE. Challenges in exosome isolation and analysis in health and disease. Int J Mol Sci. 2019;20:19.
- Pedersen KW, Kierulf B, Neurauter A. Specific and generic isolation of extracellular vesicles with magnetic beads. Methods Mol Biol. 2017;1660:65–87.
- Xu R, Greening DW, Zhu H-J, et al. Extracellular vesicle isolation and characterization: toward clinical application. J Clin Invest. 2016;126(4):1152–1162.
- Momen-Heravi F, Balaj L, Alian S, et al. Current methods for the isolation of extracellular vesicles. Biol Chem. 2013;394(10):1253–1262.
- Li P, Kaslan M, Lee SH, et al. Progress in exosome isolation techniques. Theranostics. 2017;7(3):789.
- Karimi N, Cvjetkovic A, Jang SC, et al. Detailed analysis of the plasma extracellular vesicle proteome after separation from lipoproteins. Cell Mol Life Sci. 2018;75(15):2873–2886.
- Yamashita T, Takahashi Y, Nishikawa M, et al. Effect of exosome isolation methods on physicochemical properties of exosomes and clearance of exosomes from the blood circulation. Eur J Pharm Biopharm. 2016;98:1–8.
- Driedonks TAP, Nijen Twilhaar MK, Nolte-’t Hoen ENM. Technical approaches to reduce interference of Fetal calf serum derived RNA in the analysis of extracellular vesicle RNA from cultured cells. J Extracell Vesicles. 2019;8(1):1552059.
- Linares R, Tan S, Gounou C, et al. High-speed centrifugation induces aggregation of extracellular vesicles. J Extracell Vesicles. 2015;4:29509.
- Mol EA, Goumans MJ, Doevendans PA, et al. Higher functionality of extracellular vesicles isolated using size-exclusion chromatography compared to ultracentrifugation. Nanomed. 2017;13(6):2061–2065.
- Wachalska M, Koppers-Lalic D, van Eijndhoven M, et al. Protein complexes in urine interfere with extracellular vesicle biomarker studies. J Circ Biomark. 2016;5:4.
- Yuana Y, Levels J, Grootemaat A, et al. Co-isolation of extracellular vesicles and high-density lipoproteins using density gradient ultracentrifugation. J Extracell Vesicles. 2014;3(1):23262.
- Rider MA, Hurwitz SN, Meckes DG Jr. ExtraPEG: a polyethylene glycol-based method for enrichment of extracellular vesicles. Sci Rep. 2016;6:23978.
- Kalra H, Adda CG, Liem M, et al. Comparative proteomics evaluation of plasma exosome isolation techniques and assessment of the stability of exosomes in normal human blood plasma. Proteomics. 2013;13(22):3354–3364.
- Raposo G, Nijman HW, Stoorvogel W, et al. B lymphocytes secrete antigen-presenting vesicles. J Exp Med. 1996;183(3):1161–1172.
- Wubbolts R, Leckie RS, Veenhuizen PT, et al. Proteomic and biochemical analyses of human B cell-derived exosomes. Potential implications for their function and multivesicular body formation. J Biol Chem. 2003;278(13):10963–10972.
- Zhang J, Hawari FI, Shamburek RD, et al. Circulating TNFR1 exosome-like vesicles partition with the LDL fraction of human plasma. Biochem Biophys Res Commun. 2008;366(2):579–584.
- Boing AN, van der Pol E, Grootemaat AE, et al. Single-step isolation of extracellular vesicles by size-exclusion chromatography. J Extracell Vesicles. 2014;3(1):23430.
- Nordin JZ, Lee Y, Vader P, et al. Ultrafiltration with size-exclusion liquid chromatography for high yield isolation of extracellular vesicles preserving intact biophysical and functional properties. Nanomed. 2015;11(4):879–883.
- Geeurickx E, Tulkens J, Dhondt B, et al. The generation and use of recombinant extracellular vesicles as biological reference material. Nat Commun. 2019;10(1):1–12.
- Thery C, Witwer KW, Aikawa E, et al. Minimal information for studies of extracellular vesicles 2018 (MISEV2018): a position statement of the international society for extracellular vesicles and update of the MISEV2014 guidelines. J Extracell Vesicles. 2018;7(1):1535750.
- Witwer KW, Buzas EI, Bemis LT, et al. Standardization of sample collection, isolation and analysis methods in extracellular vesicle research. J Extracell Vesicles. 2013;2(1):20360.
- Lotvall J, Hill AF, Hochberg F, et al. Minimal experimental requirements for definition of extracellular vesicles and their functions: a position statement from the international society for extracellular vesicles. J Extracell Vesicles. 2014;3:26913.
- Gardiner C, Ferreira YJ, Dragovic RA, et al. Extracellular vesicle sizing and enumeration by nanoparticle tracking analysis. J Extracell Vesicles. 2013;2(1):19671.
- Aru V, Lam C, Khakimov B, et al. Quantification of lipoprotein profiles by nuclear magnetic resonance spectroscopy and multivariate data analysis. Trends Analyt Chem. 2017;94:210–219.
- Escola JM, Kleijmeer MJ, Stoorvogel W, et al. Selective enrichment of tetraspan proteins on the internal vesicles of multivesicular endosomes and on exosomes secreted by human B-lymphocytes. J Biol Chem. 1998;273(32):20121–20127.
- Weng Y, Sui Z, Shan Y, et al. Effective isolation of exosomes with polyethylene glycol from cell culture supernatant for in-depth proteome profiling. Analyst. 2016;141(15):4640–4646.
- Ludwig AK, De Miroschedji K, Doeppner TR, et al. Precipitation with polyethylene glycol followed by washing and pelleting by ultracentrifugation enriches extracellular vesicles from tissue culture supernatants in small and large scales. J Extracell Vesicles. 2018;7(1):1528109.
- Vikari J. Precipitation of plasma lipoproteins by PEG-6000 and its evaluation with electrophoresis and ultracentrifugation. Scand J Clin Lab Invest. 1976;36(3):265–268.
- Izzo C, Grillo F, Murador E. Improved method for determination of high-density-lipoprotein cholesterol I. Isolation of high-density lipoproteins by use of polyethylene glycol 6000. Clin Chem. 1981;27(3):371–374.
- Demacker PN, Hijmans AG, Vos-Janssen HE. A study of the use of polyethylene glycol in estimating cholesterol in high-density lipoprotein. Clin Chem. 1980;26(13):1775–1779.
- Radaev S, Li S, Sun PD. A survey of protein-protein complex crystallizations. Acta Crystallograph D Biol Crystallograph. 2006;62(Pt 6):605–612.
- Ingham KC. Protein precipitation with polyethylene glycol. Methods Enzymol. 1984;104:351–356.
- Liu B, Huang PJ, Zhang X, et al. Parts-per-million of polyethylene glycol as a non-interfering blocking agent for homogeneous biosensor development. Anal Chem. 2013;85(21):10045–10050.
- Takov K, Yellon DM, Davidson SM. Comparison of small extracellular vesicles isolated from plasma by ultracentrifugation or size-exclusion chromatography: yield, purity and functional potential. J Extracell Vesicles. 2019;8(1):1560809.
- Yuana Y, Koning RI, Kuil ME, et al. Cryo-electron microscopy of extracellular vesicles in fresh plasma. J Extracell Vesicles. 2013;2(1):21494.
- Panteleev M, Abaeva A, Balandina A, et al. Extracellular vesicles of blood plasma: content, origin, and properties. Biochem Suppl A: Membrane Cell Bio. 2017;11(3):187–192.
- Halim ATA, Ariffin NAFM, Azlan MJ. the multiple roles of monocytic microparticles. Inflammation. 2016;39(4):1277–1284.
- Webber J, Clayton A. How pure are your vesicles? J Extracell Vesicles. 2013;2(1):19861.
- Luo S, Takano M, Takasaki Y, et al. Measurement of low level membrane proteins using bicinchoninic acid: modified procedures to eliminate interfering substances. Fukuoka Igaku Zasshi = Hukuoka Acta Medica. 2002;93(11):236–246.
- Kessler RJ, Fanestil DD. Interference by lipids in the determination of protein using bicinchoninic acid. Anal Biochem. 1986;159(1):138–142.
- Glyk A, Heinisch SL, Scheper T, et al. Comparison of colorimetric methods for the quantification of model proteins in aqueous two-phase systems. Anal Biochem. 2015;477:35–37.
- Tanyalçın T, Kutay FZ, Aslan DJA, et al. Interference study should be performed for every protein measurement method used. Accreditat Qual Assur. 2001;6(9):427–430.
- Mastronarde DN. Automated electron microscope tomography using robust prediction of specimen movements. J Struct Biol. 2005;152(1):36–51.
- Zheng SQ, Palovcak E, Armache JP, et al. MotionCor2: anisotropic correction of beam-induced motion for improved cryo-electron microscopy. Nat Methods. 2017;14(4):331–332.
- Bykov YS, Schaffer M, Dodonova SO, et al. The structure of the COPI coat determined within the cell. eLife. 2017;6:e32493.
- Cox J, Mann M. MaxQuant enables high peptide identification rates, individualized p.p.b.-range mass accuracies and proteome-wide protein quantification. Nat Biotechnol. 2008;26(12):1367–1372.
- Van Deun J, Mestdagh P, Agostinis P, et al. EV-TRACK: transparent reporting and centralizing knowledge in extracellular vesicle research. Nat Methods. 2017;14(3):228–232.