
ABSTRACT
The in vivo detection of dead cells remains a major challenge due to technical hurdles. Here, we present a novel method, where injection of fluorescent milk fat globule-EGF factor 8 protein (MFG-E8) in vivo combined with imaging flow cytometry and deep learning allows the identification of dead cells based on their surface exposure of phosphatidylserine (PS) and other image parameters. A convolutional autoencoder (CAE) was trained on defined pictures and successfully used to identify apoptotic cells in vivo. However, unexpectedly, these analyses also revealed that the great majority of PS+ cells were not apoptotic, but rather live cells associated with PS+ extracellular vesicles (EVs). During acute viral infection apoptotic cells increased slightly, while up to 30% of lymphocytes were decorated with PS+ EVs of antigen-presenting cell (APC) exosomal origin. The combination of recombinant fluorescent MFG-E8 and the CAE-method will greatly facilitate analyses of cell death and EVs in vivo.
Introduction
Billions of cells die every day in physiological and developmental processes [Citation1]. Also, during viral infections cells are killed either directly by pathogens or by the immune system to limit pathogen expansion. However, despite high frequencies of cell death, it is extremely difficult to detect apoptotic cells in vivo [Citation2] due to lack of appropriate detection methods and highly efficient removal of dead cells by phagocytic macrophages [Citation3].
One hallmark of apoptotic cell death is the exposure of phosphatidylserine (PS) on the outer membrane surface of cells [Citation4,Citation5]. In addition to apoptotic cells, also extracellular vesicles (EVs) are PS+ [Citation6–Citation10]. EVs are very heterogeneous [Citation11] and contain distinct nucleic acid, lipid and protein cargo derived from parental cells [Citation12]. They may contribute to cell-to-cell communication and modulate physiological functions such as immunity, cancer progression, metastasis and transfer of viral genomes [Citation13–Citation15]. The concentration of EVs in bodily fluids can increase during cell death, cancer or infections [Citation13,Citation14]. However, the major challenge to understand the role of EVs in biological processes is to study naturally occurring EVs in vivo as well as their target cells. This challenge remains unsolved, as specific reagents and analysis methods are lacking.
Fluorescently labelled Annexin V, which binds to PS, has been used to detect both, PS+ apoptotic cells and EVs [Citation16]. However, Annexin V requires elevated Ca2+-concentrations for PS-binding, which generates Ca2+-phosphate microprecipitates of EV-size, which can be mistaken for EVs [Citation17]. Furthermore, the Ca2+-requirement might make in vivo applications of Annexin V difficult and could interfere with many downstream applications [Citation18].
To reliably analyse PS+ EVs and dead cells in vivo, we have developed a recombinant PS-staining reagent by fusing Milk fat globule-EGF factor 8 protein (MFG-E8) [Citation19] to enhanced green fluorescent protein (eGFP). MFG-E8 binds PS in a Ca2+-independent fashion with high sensitivity [Citation20] and already on early apoptotic cells [Citation21]. Furthermore, it binds to highly curved membranes [Citation22], as those of small EVs.
Upon intravenous injection of MFG-E8-eGFP we performed imaging flow cytometry of fresh tissue cells on an ImageStreamx MarkII imaging cytometer, which allows detection of small particles with high sensitivity [Citation23] and generates detailed images of individual cells [Citation24]. To automatically classify apoptotic vs. EV-decorated (EV+) cells, we developed a convolutional autoencoder (CAE) [Citation25–Citation27], which combines the advantages of traditional feature extraction [Citation28–Citation30] and deep learning [Citation31] for imaging flow cytometry. Using this pipeline, we show that MFG-E8-eGFP detects apoptotic as well as EV+ cells in vivo. In untreated mice EV+ haematopoietic cells are readily detectable at low frequencies in vivo. In contrast, irradiation or infection of mice with Lymphocytic choriomeningitis virus (LCMV) dramatically raised the frequencies of apoptotic and EV+ cells. Here, we analysed B cells, DCs and T cells among, which we detected a striking increase of EV+ cells and determined markers present on EVs to determine their origins.
We provide a novel recombinant PS-binding molecule MFG-E8-eGFP, which, in combination with the deep learning CAE tool will give valuable information on the generation and function of EVs as well as on their target-cell specificities and will be most suitable to identify cell death in vivo.
Materials and methods
Mice
C56BL/6 mice were analysed in sex and age-matched groups of 8–10 weeks of age. The SPF-status of the facility was tested according to the Federation for Laboratory Animal Science Associations (FELASA) recommendations. Animal experiment permissions were granted by the animal ethics committee of the Regierung von Oberbayern, Munich, Germany. All mice were bred and maintained at the animal facility of the Institute for Immunology, Ludwig-Maximillians-Universität München.
Generation of recombinant MFG-E8 reporter proteins
Murine MFG-E8 full length (MFG-E8 isoform 1, NCBI Reference Sequence: NP_032620.2, AA 1-M to AA 463-C) and MFG-E8 C1C2-variant (MFG-E8 isoform 1, NCBI Reference Sequence: NP_032620.2, aminoacid position 1(M) to 22(A) and 146(S) to 463(C) were fused to eGFP (GenBank: AAB02576) or mCherry (GenBank: AST15061.1) and cloned into mammalian expression vector pcDNA3.1 (ThermoFischer). Recombinant proteins were either produced from stably transfected HEK293 cells or purchased (#2,002,100; Bioconduct, France). Cells were grown in a Labfors Bioreactor (Infors, Switzerland) in 3.5 L serum-free medium (Ex-Cell 293, Sigma) for 5 days. Cells were removed from the cell culture supernatant (SN) by centrifugation (300 g, 10 min). 0.1% Triton-X 100 was added to solubilize membrane vesicles. SN was incubated under agitation for 1 h. Debris was cleared by high-speed centrifugation (40.000 g, 90 min) and filtration (0.2 µm). MFG-E8-eGFP was then purified by FLAG affinity chromatography using 10 ml of M2-FLAG agarose beads (Sigma). Bound protein was eluted using an excess of FLAG peptide (Genscript, China) in 25 mM HEPES 2% Glycerol, 200 mM L-Arginine, 200 mM L-Glutamic acid and 150 mM NaCl, pH 7.4. The eluate was concentrated using Sartorius spin columns with a cut-off of 30kDa (Sartorius). Lastly, MFG-E8-eGFP was further purified by gel filtration on an Äkta prime system with a Superdex 200 Increase 10/300 GL column (GE Healthcare). Protein was stored in 25 mM HEPES 2% Glycerol, 200 mM L-Arginine, 200 mM L-Glutamic acid and 150 mM NaCl, pH 7.4 at −80°C. Protein yield was up to 1 mg/L of culture.
LCMV infections
LCMV Armstrong was propagated on L929 cells. Stocks were frozen at −80°C. For quantitation of virus titres focus-forming assays using Vero cells were performed as described previously [Citation32]. For injections, viral stocks were diluted in sterile PBS. 2 × 10⁵ p.f.u. were injected intraperitonially per mouse.
Preparation of single cells suspensions
Single cell suspensions of spleen and thymocytes were prepared by meshing organs through a 100 µm nylon mesh. BM cells were flushed out from femur and tibia with PBS + 2%FCS using syringes. Erythrocytes were either removed by ACK (150 mM NH4Cl 10 mM KHCO3 0.1 mM Na2EDTA) lysis or centrifugation through a Pancoll cushion (Pancoll, PAN Biotech). Number of live cells was determined using a CASY cell counter (OMNI Life Science).
FACS sorting of MFG-E8+ splenocytes and subsequent TEM
Single cell suspensions of splenocytes from LCMV infected, MFG-E8-eGFP injected mice were prepared by meshing organs through a nylon mesh and placed in PBS + 0.5% BSA. Erythrocytes were removed by centrifugation through a Pancoll cushion (Pancoll, PAN Biotech). Number of live cells was determined using a CASY cell counter (OMNI Life Science). Cells were stained with anti-CD45 APC, LIVE/DEADTM violet (Thermo Fisher, #L34955) and anti-GFP FITC. After washing, cells were prefixed in 4% EM-grade PFA (Science Services) for 20 min before sorting. Cells were sorted on a FACSAriaIII (BD Biosciences) using a 130 µm nozzle to keep shear forces to a minimum to avoid tearing off of the EVs. Cells were sorted into PBS + 0.5% BSA and pelleted at 300 g. The cells were kept pelleted throughout all fixation, contrasting and embedding steps. Cells were fixed for 15 min in 2.5% glutaraldehyde (EM-grade, Science Services) in 0.1 M sodium cacodylate buffer (pH 7.4) (Sigma Aldrich), washed three times in 0.1 M sodium cacodylate buffer before post-fixation in reduced osmium (1% osmium tetroxide (Science Services), 0.8% potassium ferrocyanide (Sigma Aldrich) in 0.1 M sodium cacodylate buffer). After contrasting in 0.5% uranylacetate in water (Science Services), the pellet was dehydrated in an ascending ethanol series, embedded in epon (Serva) and cured for 48 h at 60°C. Ultrathin sections (50 nm) were deposited onto formvar-coated copper grids (Plano) and post-contrasted using 1% uranyl acetate in water and ultrostain (Leica). TEM images were acquired on a JEM 1400plus (JEOL) using the TEMCenter and tile scans with the ShotMeister software packages (JEOL), respectively.
Imaging flow cytometry and data analysis
5x10⁶ cells were stained with appropriate antibodies for 20 min on ice in PBS + 2% FCS and analysed on an ImageStreamX MKII imaging flow cytometer (Merck). MFG-E8-eGFP+ cells were gated using the IDEAS software. Then TIF-images of MFG-E8-eGFP+ cells from each sample were exported (16-bit, raw) and analysed by the CAE algorithm. The results were stored in two separated *.pop files containing the object numbers of apoptotic and EV+ cells. These object numbers were re-imported into IDEAS and two separate files containing only apoptotic or EV+ cells were generated. Next, from each sample, three files (containing either all cells, only apoptotic or only EV+ cells) were exported as fcs-files which were then further analysed using FlowJo.
Spot analysis
A spot mask was generated to identify MFG-E8+ ((Dilate(Peak(M02_Channel02_Bright_3)_1)_4) spots or EV-marker+ ((Dilate(Peak(M11_Channel11_Bright_3)_1)_4) spots. The spot count feature of the IDEAS mask was used to quantify the number of spots. To determine if EV-marker+ and MFG-E8+ spots colocalised the bright detail similarity (BDS) feature of the IDEAS software was used on the spot masks.
Preparation of PKH26-stained EVs
40x106 thymocytes were labelled with PKH26 red (Sigma Aldrich) according to the manufacturer’s protocol. Briefly, the cell suspension was washed with serum-free DMEM medium (GIBCO) and resuspended in 1 ml of dilution buffer from the manufacturer’s labelling kit. The cell suspension was mixed with an equal volume of the labelling solution in the dilution buffer and incubated for 5 min at RT. Labelling reaction was stopped by addition of 2 ml foetal bovine serum (FBS) followed by washing with complete DMEM (10% FBS, 1% Penicillin). To induce apoptosis, cells were treated with 1 μg/ml of Staurosporine (Sigma Aldrich) in serum free DMEM for 2 h at 37°c followed by three washes. Cells were removed by centrifugation (500 g). To collect PKH26-labelled vesicles, including apoptotic bodies, supernatant was ultra-centrifuged at 100,000 g for 90 min. Prior to injection into mice, vesicles were resuspended in PBS.
Data sets used for deep learning
All datasets examined in this study were acquired using the ImageStreamX MKII (Luminex). For the machine learning approach only brightfield images and MFG-E8-eGFP+ or PKH26+ fluorescent images were used. All images were cropped to 32 × 32 pixels and exported as 16-bit raw TIF images. No further pre-processing was performed on the pixel intensities (e.g. normalization or scaling). The in vitro annotated training dataset D1 consists of 27,639 cells (27,224 apoptotic, 415 EV+). The apoptotic cells in this dataset were stained with MFG-E8-eGFP in vitro, while the 415 EV+ cells were prepared from splenocytes after injection of PKH26-labelled vesicles. The in vivo annotated dataset D2 consists of 200 cells (100 apoptotic, 100 EV+). The M4 in vivo dataset consists of 382 cells (199 apoptotic, 183 EV+). The M1, M2, and M3 datasets were BM cells acquired from 3 irradiated mice and consist of 14,922, 16,545 and 17,111 unannotated cells, respectively. The M5 and M6 datasets were acquired from BM of two non-irradiated mice and consist of 5805 and 5046 unannotated cells, respectively. Datasets D1 and D2 were imaged with a 40x objective, while datasets M1, M2, M3, M4, M5 and M6 were imaged with a 60x objective.
Data analysis strategy
A novel pipeline combining unsupervised deep learning with supervised classification is used for cell classification, and compared to deep learning and classical feature-based classification.
Convolutional autoencoder (CAE)
The CAE used in this study consists of a typical encoder-decoder scheme but with a channel-wise adaption: the encoder part is different for each input channel, while the decoder part of the network is used only during training, not for testing. The CAE was trained on 90% of M1 for 300 epochs, while the instance of the network that performed the best on the 10% validation set of M1 was saved and used for feature extraction in all subsequent experiments. The CAE consists of approximately 200,000 parameters and the exact architecture is shown in supplementary Figure S2. Each convolutional layer is followed by a batch normalization layer [batchnorm] and a ReLU activation [relu-glorot], with the exception of the last convolutional layer which is followed by a linear (activation) function (and no batch normalization). The mean squared error (MSE) of the reconstructed image was used as a loss function for training, while the mean absolute error (MAE) produced similar results in terms of classification accuracy. Adam [adam] was used to train the network, using a batch size of 64.
Convolutional neural network (CNN)
The CNN used in this study for comparison is the exact same architecture as in [Citation31] and consists of approximately 3 million parameters. For comparison to the CAE, we also implemented a smaller version of the CNN architecture where each layer of the original architecture had 1/4 of the parameters, which resulted in a model with approximately 200 thousand parameters (same as the CAE). There was no significant difference between the performance of the original and downsized variants of the CNN in any of the experiments. As such, only the results of the original variant of the CNN are reported. This specific CNN architecture receives 64 × 64 images as input, while the available images are 32 × 32. As a result, all input images were padded with their edge values to fit the input dimension of the network. In all experiments the CNN was trained using Adam [Citation33].
Cell-profiler features
To compare to classical machine learning, the Cell-Profiler (CP) [Citation29] pipeline from Blasi et al. [Citation28] was used for feature extraction. However, in our case the second channel corresponds to fluorescence intensity instead of darkfield.
Random forest
The scikit-learn [Citation34] Python implementation of the Random Forest [Citation35] algorithm was used. The number of trees (n_estimators) was set to 1000, while the number of features to assess at each split (max_features) was set to “sqrt”. In all subsequent experiments when we refer to CAE or CP accuracy, we mean the accuracy obtained by a Random Forest trained on the pretrained CAE (CAE-RF model) features or CP features (CP-RF model), respectively.
CAE-RF/CP-RF
Both terms refer to a random forest trained on top of the features extracted using the pre-trained CAE introduced above or using Cell-Profiler, respectively. As such, training CAE-RF/CP-RF refers to training only the classification part of the method (RF).
Confidence intervals
Wilson’s method [Citation36] was used to calculate the proportion confidence intervals for classification accuracy.
Code availability
The source code of this study is freely available at “https://github.com/theislab/dali”
Results
MFG-E8-eGFP stains dying and PS+ live cells in vivo
To develop a robust, buffer-insensitive, fluorescent in vivo detection reagent for apoptotic cells, we fused murine MFG-E8 to enhanced green fluorescent protein (eGFP) for recombinant expression (Suppl. Fig. 1). The recombinant protein consisted of the full length MFG-E8 protein containing both C-domains (C1 and C2), of which especially the C2 domain confers PS-binding [Citation37]. In addition, it contained the RGD-motif, which mediates binding to αvβ3 integrin and facilitates phagocytosis of dead cells by macrophages [Citation19]. The purified MFG-E8-eGFP could identify similar frequencies of dying cells in vitro, as compared to the commercially available Annexin V (). Double staining with both reagents showed that the same apoptotic cells bind Annexin V and MFG-E8-eGFP, when tested in a Ca2+-rich Annexin V-binding buffer (). However, when conventional buffer was used, only MFG-E8-eGFP, but not Annexin V could detect apoptotic cells (). These data indicate that MFG-E8-eGFP detects the entirety of dying cells similar to the reference reagent independently of specific buffer conditions.
The RGD-motif present in MFG-E8-eGFP can potentially also bind to αvβ3 and αvβ5 integrins [Citation19]. To test if such binding might cause false-positive labelling of cells, we next stained spleen cells with anti-αv (CD51) antibody, which mainly stained CD11b+ macrophages and monocytes (, left panel). However, MFG-E8-eGFP only revealed CD11b+CD51+ cells, which were also Annexin V+ (, right panel), indicating PS-specificity of MFG-E8-eGFP rather than binding via integrins.
Figure 1. MFG-E8-eGFP stains apoptotic and EV+ cells in vitro and in vivo. (A) Staurosporine-treated (1 µg/ml, 2 h) apoptotic Jurkat cells were stained either with Annexin V-Cy5 or MFG-E8-eGFP or both reagents together in Ca2+-containing or Ca2+-free buffer as indicated. (B) To determine the degree of MFG-E8-eGFP binding by integrins via its RGD-motif by CD51 expressing cells, freshly isolated splenocytes were stained with MFG-E8-eGFP, AnnexinV, CD11b and CD51. Left dot plot shows gating of CD11b+CD51+ cells, middle plot shows MFG-E8-eGFP and Annexin V staining of CD11b+CD51+ cells, right plot shows unstained control. (C-D) To test MFG-E8-eGFP in vivo non-irradiated (n = 3) and irradiated mice (1000 rad, n = 3) were injected with 100 µg MFG-E8-eGFP i.v. 24 h after the irradiation. 30 min after the MFG-E8 injection mice were sacrificed and bone marrow (BM) cells were stained with LIVE/DEADTM violet followed by imaging flow cytometry on an ImagestreamX Mark II. Left bar graph shows total numbers of BM cells, middle bar and right bar graphs display the total numbers and frequencies of MFGE-E8+ cells with and without irradiation, respectively. Averages ± SD are shown. (E) BF and MFG-E8 images of live, MFG-E8− (top), MFG-E8+ apoptotic (middle) and MFG-E8+EV+ (bottom) are shown. Scale bar: 7 µm. (F) MFG-E8+ splenocytes were FACS-sorted (sorting strategy see Supplemental ) and imaged by TEM. Two representative images of cells with attached extracellular vesicles (indicated by blue arrows) are shown. Scale bars: 500 nm.
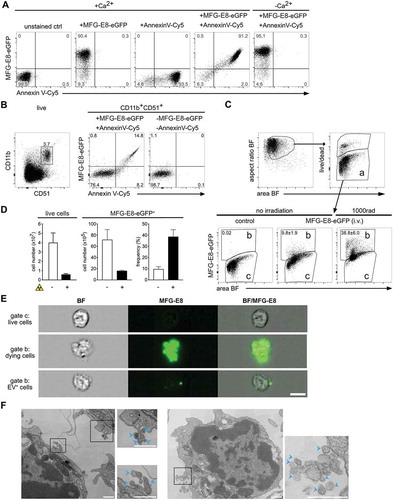
Next, we administered MFG-E8-eGFP i.v. for in vivo labelling to avoid detection of artefacts generated during organ preparation, cell straining and other stress by in vitro handling. 30 min after injection of MFG-E8-eGFP, bone marrow (BM) cells were harvested, stained in vitro with a viability dye to exclude necrotic cells (, gate a). Due to their ruptured cell membranes, we considered necrotic cells to be too damaged to extract reliable information and we focused only on cells in the live gate (, gate a). Dying cells are rare in intact tissues due to their rapid removal [Citation38]. Accordingly, only approximately 10% of all BM cells in non-irradiated mice were MFG-E8-eGFP+ (, gate b). To increase the rate of cell death, mice were γ-irradiated, which causes DNA damage and p53-mediated mechanisms of apoptosis within hours [Citation39]. Therefore, while after irradiation the absolute numbers of cells in the BM decreased due to cell death (), the frequencies of MFG-E8-eGFP+ cells strongly increased (,d). This indicated the general feasibility and specificity of an MFG-E8-eGFP in vivo application.
The individual images taken from cells within the live populations of (gates a,b) showed that MFG-E8-eGFP− cells had an intact rounded morphology typical for live cells (). In contrast, MFG-E8-eGFP+ cells had cell bodies that were stained almost completely with MFG-E8-eGFP and showed densely stained apoptotic blebs indicating that cells are undergoing apoptosis (, middle panel). However, within the same gate (, gate b) we also found high numbers of cells that only showed very few, or even only one intensely stained MFG-E8-eGFP+ structure of subcellular size, whereas their cell body was unstained and had the rounded morphology of live, intact cells (, lower panel). These particles were reminiscent of EVs and we next sorted MFG-E8+ lymphocytes from spleens for analysis by transmission electron microscopy (TEM). Attached to the sorted cells we could readily identify extracellular particles of 50–100 nm diameter, a size typical for EVs (). Therefore, MFG-E8-eGFP allows the analysis of apoptotic and PS+ EV-decorated live cells, and we next set out to characterise them in more detail.
An interpretable deep learning approach is able to discriminate EV-decorated cells from dying cells
The imaging analysis software IDEAS is very powerful in extracting and identifying features that help to discriminate different cell subsets [Citation40]. To generate a mask for separation of MFG-E8-eGFP+ cells into PS+ EV+ live or PS+ apoptotic cells, we manually selected 50 images of each type of MFG-E8-eGFP+ cells and analysed their brightfield and fluorescence characteristics (Suppl. Fig. 3A). Based on the manually selected MFG-E8-eGFP+ apoptotic and EV+ cells, we generated gates that included the majority of each cell type (Suppl. Fig. 3B). However, when we applied these definitions to cells without manual preselection in an unbiased fashion, these gates were insufficient to classify all events, leaving many cells uncategorised (Suppl. Fig. 3 C).
To identify more reliable features for apoptotic cell discrimination from EV+ cells, we defined a ’ground truth’ as a basis for training different classification methods for cell sorting. For this, we generated EVs in vitro, fluorescently labelled them with PKH26 and injected these EVs into mice (). Dead cells were defined using staurosporine-treated thymocytes stained with MFG-E8-eGFP in addition to the apoptotic marker active caspase-8 (aCas8) [Citation41] in vitro (). Based on this ground truth dataset, it is possible to train a machine learning model for classification. Thus, after training is complete the machine learning method is able to separate apoptotic cells from EV+ cells in an automated fashion. In general, machine learning methods either operate directly on the images, or on numerical features (such as a cell’s radius and intensity) extracted from the images [Citation42].
We next tested three different machine learning approaches with these data: (i) a Convolutional Neural Network (CNN) for imaging flow cytometry [Citation31], (ii) our proposed method CAE-RF (a classifier trained on features learned by a CAE as displayed in the scheme of (C,D) (iii) CP-RF, a classifier trained on pre-defined Cell Profiler features [Citation28]. In order to estimate the effect of inter-experiment batch effects on classification performance, all methods were tested twice on the same in vivo stained dataset (manually selected apoptotic and EV+ cells from irradiated mice) and their performance was assessed using the Area Under of the receiver operating characteristic curve (AUC) [Citation43]. The AUC metric ranges from zero to one and higher values are better since they reflect classification models with better predictive capability. An AUC score of one reflects perfect cell-sorting, while a method that randomly decides whether a cell is apoptotic or EV+ would achieve an AUC of 0.5. Furthermore, a batch effect can reflect slight differences in the acquired datasets, for example due to different human operators, slight differences in the stains used in independent experiments or datasets acquired by different labs. Thus, it is desirable to develop a machine learning method for cell-sorting that can overcome such batch effects.
Figure 2. Discrimination of apoptotic vs. EV+ cell using machine learning. (A) To define a truth population for cells carrying EVs, PKH26-labelled EVs from staurosporine-treated thymocytes were injected i.v. into C56BL/6 mice. After 1 h spleens were removed and analysed by imaging flow cytometry. Images show splenocytes that are decorated with in vitro generated, PKH26-labelled EVs. (B) To define a truth population for apoptotic cells, staurosporine-treated thymocytes (1 µg/ml for 2 h) were stained with MFG-E8-eGFP (200 ng/ml) and anti-aCas8 and analysed by imaging flow cytometry. Images show MFG-E8-eGFP+aCas8+ apoptotic cells. (C) Using a Convolutional Autoencoder (CAE), both channels of the same image are separately encoded and then concatenated to form a 256-dimensional feature vector. During training features are learned in an unsupervised manner, by reconstructing the input images. In order to perform cell sorting, a classifier (Random Forest) is trained on a small subset of annotated cells. (D) Each input image consists of 32 × 32 pixels and 2 channels (Brightfield, Fluorescence). Every arrow in the figure corresponds to a data tensor. Each channel is encoded separately by an encoder network consisting of alternating convolutional and pooling layers. The encoder compresses each 32x32x1 (32x32 pixels, 1 channel) image into a 4x4x8 tensor. The encoded tensors of both channels are concatenated in a 4x4x16 tensor: the bottleneck of the CAE, which has a dual purpose. At training time, it is fed into the decoder part of the network which aims to reconstruct the input image in an unsupervised manner. At test time, the 4x4x16 bottleneck tensor is reshaped into the 256-dimensional feature vector of the input image that can be used in downstream tasks, such as classification of cell-subtypes. Each Convolutional layer performs 3 × 3 convolutions and is followed by a Batch Normalisation layer and a ReLU activation function. The only exception to this rule is the last Convolutional layer (Conv3x3, 2), which is directly followed by Linear (identity) activation function. (E) Left: All models were trained on an in vivo stained dataset of 401 cells (M4), then tested on an independent in vivo stained dataset of 200 cells (D2). Right: the same models were trained on a new dataset of 27,639 cells (D1), where the apoptotic cells were stained in vitro, introducing a batch effect. Next, they were tested on the same 200 cell dataset as before (D2). Sorting performance is displayed as area under curve (AUC). (F) Demonstration of the batch effect introduced by in vitro staining of apoptotic cells. Right column: random subset of in vivo stained apoptotic cells. Left column: random subset of in vitro stained apoptotic cells. In vitro stained cells fluorescent staining is evenly distributed inside the cell, while in vivo stained cells exhibit more complex shapes and abnormalities in the distribution of the fluorescent dye. Error-bars correspond to 95% Wilson confidence intervals (n = 200).
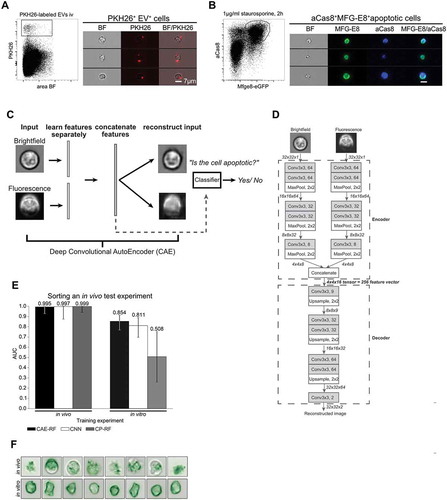
During the first trial both, the training (MFG-E8-eGFP+ BM cells from irradiated mice) and test experiments were stained in vivo. In this case, all methods achieved near perfect classification performance of AUC>0.99 (). During the second trial, the apoptotic cells of the training experiment were stained in vitro (), introducing a batch effect for the classifiers to overcome (). In this case, CAE-RF generalised the best (; AUC = 0.854), followed by the CNN (; AUC = 0.811), while CP-RF failed to generalise to the new experiment and was comparable to random guessing (; AUC = 0.508). CAE-RF was as accurate as a CNN in identifying apoptotic cells in a new experiment ().
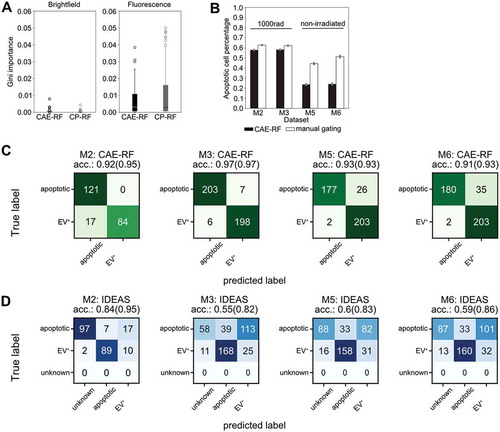
For classification MFG-E8 fluorescence is more important than brightfield
The CAE-RF and CP-RF methods were trained using 5-fold cross validation [Citation43]. Both CAE-RF and CP-RF agreed that features derived from the fluorescence channel were more important than brightfield features, for the task of apoptotic cell identification (). Quantitative assessment of CAE-RF performance was done first by training on in vivo stained BM cells from irradiated mice. Then, it was used to identify apoptotic and non-apoptotic cells in new experiments with data from irradiated (; M2, M3) and non-irradiated mice (; M5, M6). The performance of CAE-RF sorting was compared to standard gating on manually defined features (). Both methods agree that more apoptotic cells are present in irradiated than in non-irradiated mice (). Subsequently, a subset of cells was manually annotated for each dataset, to quantitatively assess the classification performance of both methods CAE-RF () and manual gating using IDEAS features (). In all cases, sorting with CAE-RF was more accurate than performing gating (,d). Moreover, CAE-RF always characterised all cells, while manual gating resulted in some cells characterised as ’unknown’ since they did not correspond to any of the gates (). Nonetheless, even if we discard the unknown cells from the calculation of classification accuracy (providing an advantage to gating), using CAE-RF was still more accurate ().
Figure 3. Convolutional Autoencoder performance. (a) Both CAE-RF and CP-RF identify the fluorescence channel (FL) features as more important than brightfield features (BF) for the task of apoptotic cell detection. Each boxplot visualises the Gini importance of features belonging to the corresponding channel (FL or BF), as calculated by the random forest for each feature extraction method (CAE or CP). Fluorescence features have larger values of Gini importance than BF features. (b) When predicting on new non-annotated data, both CAE-RF classification and manual gating on IDEAS features predict more apoptotic cells in irradiated mice (M2, M3) and more cells with attached vesicles in healthy mice (M5, M6). Error bars correspond to 95% Wilson confidence intervals (nM2 = 16,545, nM3 = 17,111, nM5 = 5805, nM6 = 5046). A subset of cells was annotated manually for each dataset and sorting was performed using the CAE-RF (c) and IDEAS gating (d). “Unknown” cells fail to lie on the apoptotic or EV+ gate using IDEAS gating. The classification accuracy reported in parentheses for each confusion matrix corresponds to the accuracy if “unknown” cells are omitted.
True dead and live EV+ cells can be sorted automatically by the novel deep learning approach
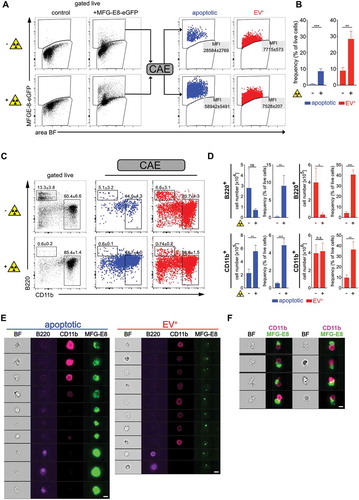
To challenge the accuracy of the CAE classifier, we next submitted image information from BM cells after irradiation to CAE-RF based sorting. As expected, the frequencies of MFG-E8-eGFP+ apoptotic cells strongly increased upon irradiation (). Here, only cells were included that were live/dead− apoptotic cells with intact cell membranes. MFG-E8-eGFP+ dying apoptotic cells had a higher MFG-E8-eGFP median fluorescence intensity (MFI) than EV+ cells and both types could be clearly separated from each other by using CAE-RF (). Although the rates of both, apoptotic as well as live EV+ cells increased upon irradiation, the EV+ cells were by far more frequent than dying cells (10x more in steady-state, 3x more after irradiation, ). We analysed both cell types further and used antibodies to CD11b+ myeloid cells and B220+ B lymphocytes, as prominent representatives of BM populations (). As expected, we could detect only few B220+ B cells in irradiated mice (), but a high frequency of them was classified as apoptotic (, upper panel). This reflected the high sensitivity of B cells to γ-irradiation [Citation44]. In contrast, total numbers of myeloid CD11b+ cells were less decreased, as they have lower sensitivity to γ-irradiation [Citation45] (, lower panel). However, also in the CD11b+ myeloid compartment, the frequencies of dying cells increased significantly upon irradiation (). Frequencies of EV+ live cells also increased significantly in both, CD11b+ and B220+ cells during irradiation (). Randomly selected images illustrate the different MFG-E8 staining patterns of apoptotic and EV+ cells (). Strikingly, in irradiated mice, we frequently detected apoptotic cells that were attached to CD11b+ phagocytes (). Hence, the CAE classification also correctly detects dying cells that are most likely in the process of being phagocytosed. Taken together, the combination of in vivo applied MFG-E8-eGFP, imaging cytometry and CAE-RF module analysis is able to reliably separate EV+ cells from PS+ dying cells in the live cell gate and can assist in more precise analyses of cell death and EVs in vivo.
Figure 4. Using deep learning to discriminate apoptotic and EV+ cells. Non-irradiated controls (n = 3) and lethally irradiated mice (1000 rad, n = 3) were injected with 100 µg MFG-E8-eGFP i.v. 24 h after the irradiation. 30 min later mice were sacrificed. Bone marrow (BM) cells were analysed by imaging flow cytometry. (a) To identify apoptotic and EV+ cells, cells were analysed using IDEAS, CAE-RF and FlowJo. First, single cells were gated using the brightfield (BF) aspect ratio and the area of the BF signal. Then necrotic cells (live/dead+) were excluded from further analysis (Suppl. Fig. 4A). MFG-E8-eGFP+ cells were gated and their TIF images (16-bit, raw) exported using the IDEAS software. CAE-RF results with the classification apoptotic/EV+ were re-imported into IDEAS and separate fcs-files containing all cells or only MFG-E8-eGFP+/apoptotic cells and MFG-E8-eGFP+/EV+ cells were generated for further analysis in FlowJo. Apoptotic (blue) and EV+ (red) cells are shown in dot plots and their MFI of the MFG-E8 signal is displayed. (b) Bar graphs show apoptotic (blue) and EV+ (red) cells as frequency of live cells in non-irradiated and irradiated mice. Averages ± SD are shown. (c) Left dot plots show B220 and CD11b stained BM cells, gated on non-necrotic live/dead− cells. Middle and right dot plots show B220 and CD11b expression of MFG-E8-eGFP+ cells classified by the CAE as apoptotic (blue) or EV+ (red), respectively. Numbers next to the gate show the mean percentage ± SD of all cells depicted inside the dot plot that lie within the respective gate. (D) Bar graphs show total numbers and frequencies of B220+ and CD11b+ apoptotic (blue) and EV+ (red) cells in non-irradiated and irradiated mice. Bar graphs show means ± SD, n = 3. (e) Example images of cells that are classified as apoptotic (left) or EV± (right) are shown. (f) Example images of cells that are classified as apoptotic and are attached to CD11b+cells in irradiated mice. Scale bar 7 µm. Representative results of 3 independent experiments are shown. Statistical significance is indicated by asterisks (*P ≤ 0.05; **P ≤ 0.01; ***P ≤ 0.001; two-tailed unpaired t-test).
Distinction of dying from EV-decorated cells during acute infection with LCMV
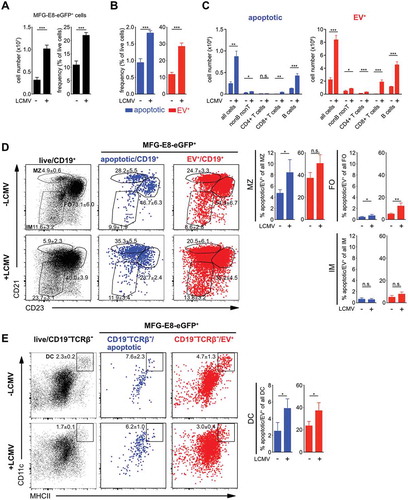
Having developed a reliable automated method to discriminate apoptotic from EV+ cells, we next analysed spleens of mice during an LCMV infection, which is known to induce cell death during the acute infection phase [Citation46]. Here, cell death is mainly caused by innate and adaptive immune mechanisms [Citation46–Citation48]. LCMV infection caused a strong increase in frequencies and total numbers of live MFG-E8-eGFP+ cells (). To differentiate apoptotic from EV+ live cells we CAE-sorted their images. This revealed that both, apoptotic as well as EV+ cells significantly increased upon LCMV infection (). However, the frequencies of EV+ live cells were more than 10-fold higher as compared to those of apoptotic cells, before, as well as during LCMV infection (). The paucity of apoptotic cells is striking, but also expected. In healthy mice, we detected approx. 250,000 apoptotic cells per spleen. This number increased to approx. 1 Mio. in infected mice. This low number highlights the importance of a reliable and specific method to identify dying cells. More detailed analyses showed that the highest numbers of dying cells in non-infected mice were present within the CD19+ B cell and CD19−TCRβ− non-B/T cell populations (). Upon LCMV infection, both, dying and live EV+CD19+ B cells and CD19−TCRβ− non-B/T cells further increased, but live EV+ B cells outnumbered dying B cells approximately 10-fold (). In addition, especially CD8+ T cells showed increased frequencies of apoptosis and EV-decoration upon LCMV infection (). Among CD19+ B cells, mainly marginal zone (MZ, CD19+CD21hiCD23lo) and follicular (CD19+CD21+CD23hi) B cells showed increased apoptosis, while only follicular B cells also showed a significant increase in EV+ cells during LCMV-infection (). MZ B cells showed a very high degree of EV-decoration in both infected and non-infected animals (). Among the CD19−TCRβ− non-B/T cell populations CD11c+MHC-II+ DCs showed slight but significant increases of both, apoptotic and EV+ cells ().
Figure 5. Identification of dying cells and EV+ cells during LCMV infection. Non-infected and LCMVArm (2x10⁵ PFU, i.p.) infected mice were injected with 100 µg MFG-E8-eGFP on day 5 post infection. 1 h later mice were sacrificed and splenic B, T and non-B/T cell subsets were analysed by imaging flow cytometry (gating strategy shown in suppl. ). (A) Bar graphs show total numbers (left) and frequencies (right) of all MFG-E8-eGFP+ splenocytes in non-infected and infected mice. (B) Frequencies of MFG-E8-eGFP+ apoptotic (blue) and EV+ (red) cells were determined using the CAE. (C) MFG-E8-eGFP+ CD19−TCRb− nonB/T cells, CD4+ and CD8+ T cells and CD19+ B cells were classified as apoptotic (blue) or EV+ (red) using the CAE and their total numbers in the spleen were calculated. (D) MFG-E-eGFP+ CD19+ B cell subsets (MZ = marginal zone, FO = follicular, IM = immature B cells), (B) CD19−TCR −CD11 c+MHC-II+ DCs were analysed using the CAE. Numbers next to the gate show the mean percentage ± SD of all cells depicted inside the dot plot that lie within the respective gate, while the bar graphs show the average frequency ± SD of apoptotic or EV+ cells within the analysed subpopulation (n = 3). Statistical significance is indicated by asterisks (ns P > 0.5; *P ≤ 0.05; **P ≤ 0.01; ***P ≤ 0.001; two-tailed unpaired t-test). Representative results of 3 independent experiments are shown.
CD8+ T effector cells preferentially become EV-decorated
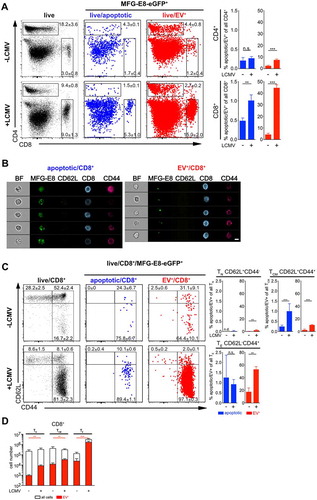
CD4+ and CD8+ T lymphocytes play central roles in controlling viral infections [Citation49,Citation50]. Analysis of spleens from LCMV infected mice showed that the frequencies of apoptotic cells increased during viral infection only among CD8+ T cells, but not CD4+ T cells (). While EV-decoration increased only slightly, but with statistical significance also in CD4+ T cells, it augmented drastically in CD8+ T cells during LCMV infection, when 40–50% of all CD8+ T cells were EV+ (). Flow cytometry images confirmed the morphological differences of the MFG-E8-eGFP staining between apoptotic and EV+ CD8+ T cells (). The strong EV-association with CD8+ T cells was very striking and warranted further investigation. We thus assessed which CD8+ T cell subsets become EV-decorated. In lymphoid organs of mice functionally homologous populations are defined as naïve (TN, CD62LhiCD44lo), central memory (TCM, CD62LhiCD44hi) and terminally differentiated effector memory cells (TE, CD62LloCD44hi) [Citation51]. In steady state, the frequencies of apoptotic and EV+ cells were extremely low and mostly found within antigen-experienced CD44hi cells, but not TN cells (). Upon LCMV-infection, CD62LloCD44hi TE cells expanded strongly without showing an increased rate of cell death as compared to uninfected mice (). Only CD62LhiCD44hi TCM cells significantly increased their rate of apoptosis (). The reduction of total TCM cell numbers confirmed this finding () and has been described earlier as type I interferon depend attrition of memory T cells [Citation52–Citation54]. In contrast to the relatively low numbers of bona fide apoptotic CD8+ T cells, EV-decoration of CD8+ T cells increased significantly in all populations, TN, TCM and TE cells upon infection by frequency () and cell number (). The highest EV-decoration frequencies were detected in CD44hi TCM and TE, the latter reached around 50% EV-decoration and more (). Likewise, the frequencies of apoptotic CD4+ T cells were generally low in non-infected mice, where only around 2% CD62L+CD44+CD4+ TCM cells and 10% antigen-experienced CD62L−CD44+CD4+ TE cells were EV+ (Suppl. Fig. 5B). Upon LCMV infection EV-decoration augmented in all CD4+ T cell subsets, the strongest increase was observed in antigen-experienced CD44hiCD4+ TCM and TE cells (Suppl. Fig. 5A, B). Also in the CD4 compartment, total CD4+ TCM cell numbers declined and the frequencies of apoptotic cells increased, suggesting that CD4+ TCM were eliminated by apoptosis in the early phase of infection (Suppl. Fig. 5A, B, C). Analysis of total cell numbers of EV+ T cells revealed significant increases in EV+ cells in all CD4+ (Suppl. Fig. 5 C) and CD8+ () T cell subsets upon LCMV infection. However, the strongest increase was found in CD8+ TE cells, which exceeded all other T cell subsets in terms of EV-decoration (, Suppl. Fig. 5 C), indicating a high disposition of CD8+ T cells to associate with EVs.
Figure 6. CAE analysis of T cells during LCMV infection. Non-infected and LCMVArm (2x10⁵ PFU, i.p.) infected mice were injected with 100 µg MFG-E8-eGFP on day 5 post infection. 1 h later mice were sacrificed and (A) CD4+ and CD8+ T cells and (C) CD62L+CD44− naïve (TN), CD62L+CD44+ central memory (TCM) and CD62L−CD44+ effector memory TE CD8+ T cells were analysed using the CAE and the percentages of apoptotic and EV+ cells determined. Numbers next to the gates show the mean percentage ± SD of cells that lie within the respective gate. Bar graphs show the average percentage ± SD of apoptotic or EV+ CD4+ and CD8+ T cells within the analysed subpopulation. (B) Representative imaging flow cytometry images of apoptotic (left) and EV+ (right) CD8+ T cells are shown. Scale bar 7 µm. (D) Total numbers of CD8+ TN, TCM and TE cells were determined (white bar) and plotted against the total numbers of EV+ subsets (red bar). Representative results of three independent experiments are shown. Bar graphs show the average frequency ± SD of apoptotic or EV+ cells within the analysed subpopulation (n = 3). Statistical significance is indicated by asterisks (ns P > 0.5; *P ≤ 0.05; **P ≤ 0.01; ***P ≤ 0.001; two-tailed unpaired t-test).
EV-decoration of activated CD8+ T cells is not mediated through RGD-motif
To address the possibility that the RGD-motif present in full-length MFG-E8-eGFP mediates attachment of EVs to activated T cells, we assessed binding of EVs stained with an MFG-E8 variant lacking the PT, E1 and E2 domains, the latter of which contains the integrin-binding RGD-motif (C1C2-eGFP, Suppl. Fig. 6A). Upon i.v. injection of equimolar amounts of full-length MFG-E8-eGFP or C1C2-eGFP similar amounts of eGFP+ cells were detected (Suppl. Fig. 6B), although the C1C2-variant of MFG-E8 was reported to have decreased affinity to PS as compared to full length MFG-E8 [Citation19]. Both MFG-E8 versions detected the same frequencies of apoptotic and EV+ cells (Suppl. Fig. 6B). Also, the ability of CD8+ TE to bind EVs was not affected by the absence of the RGD-motif, as a similar frequency to EV+CD44+CD8+ TE were detected, regardless of the presence of the RGD-motif in the MFG-E8 construct (Suppl. Fig. 6 C). Therefore, MFG-E8, with or without RGD-motiv, binds to T cells already associated with EVs rather than inducing this association.
In vivo MFG-E8 staining mirrors PS+ EVs and PS+ apoptotic cells more reliably than in vitro staining
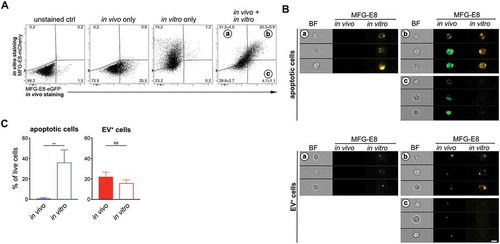
For our analyses we chose in vivo stainings of PS+ cells, because we were concerned that the organ preparation not only could cause cell death, but also could generate PS+ membrane fragments that could attach to cells and render them EV+. However, in vivo staining is more elaborate and expensive due to the relatively high amounts of recombinant MFG-E8-eGFP required. Therefore, we next assessed whether in vitro staining of PS+ cells with MFG-E8-eGFP would produce similar results in LCMV-infected mice as the in vivo staining. For this, we injected LCMVArm-infected mice with MFG-E8-eGFP prior to their sacrifice to detect the PS+ structures which were present in vivo. We then prepared single cell suspensions and lysed erythrocytes using ammonium chloride (ACK). The cells were then stained again in vitro using MFG-E8-mCherry to differentiate those PS+ structures that might have been generated during the tissue preparation. Approx. 30% of all live cells stained double positive for both, MFG-E8-eGFP and MFG-E8-mCherry (). While only few cells (approx. 5%) were stained only in vivo, more than 30% were stained only in vitro (). This shows that after organ removal and preparation many cells become PS+ and that consequently, the in vitro staining detected many more PS+ cells than the in vivo staining (). To assess whether these cells had become apoptotic or bound EVs during the organ preparation, we applied the CAE analysis twice on the same samples, first on in vivo stained cells using the eGFP images and then on in vitro stained cells using the mCherry images (). This analysis revealed that the frequency of EV+ cells did not increase, apoptotic cells however, dramatically increased approx. 40-fold (). These results show the importance of the in vivo labelling approach, since the organ preparation leads to strong PS+ exposure on 40% of all live cells so that they are classified as apoptotic by the CAE analysis.
Figure 7. Comparison of in vivo and in vitro MFG-E8 staining. LCMVArm-infected mice received 100 µg MFG-E8-eGFP iv on day 5 after infection (n = 3). 1h later mice were sacrificed and their spleens homogenised by meshing them through nylon meshes and erythrocytes lysed using standard ACK lysis buffer. Single cell suspensions were further stained with MFG-E8-mCherry followed by imaging flow cytometry analysis. (a) Dot plots show gating of MFG-E8 double-negative, double-positive (gate B), mCherry single positive (gate A) and eGFP single positive (gate C) populations using appropriate unstained and single-stained controls. Double positive cells are cells that were both stained with MFG-E8 in vivo and in vitro, mCherry single positive cells were only stained in vitro, while eGFP single positive cells were only stained in vivo. Bar graphs show the result of the CAE analysis that was performed either on MFG-E8-eGFP+ (in vivo stained) cells (filled bars) or on MFG-E8-mCherry+ (in vitro stained) cells (open bars). Means ± SDs are shown, apoptotic cells are shown in blue, EV+ cells are shown in red. (b) Representative BF, eGFP and mCherry images of MFG-E8-mCherry+MFG-E8-eGFP− (gate A), MFG-E8-mCherry+MFG-E8-eGFP+ (gate B), MFG-E8-mCherry−MFG-E8-eGFP+ (gate C) are shown. Scale bar 7 µm. Statistical significance is indicated by asterisks (ns P > 0.05; **P ≤ 0.01; two-tailed unpaired t-test).
EVs carry markers of exosomes and antigen-presenting cells
We next set out to further characterise cell-attached EVs generated during LCMV-infection in vivo using the flow microscopy CAE pipeline. EVs originating from APCs like DCs or B cells carry exosomal markers such as tetraspanins CD9 and CD63 related to endosomal vesicle trafficking [Citation55,Citation56]. In addition, they are enriched for APC-markers such as CD86, MHC-II and CD54 [Citation57]. We therefore evaluated next if EV+ T cells are positive for these APC-exosome markers. Analysis of naïve CD44−CD62L+ TN cells and effector CD44+CD62L− TE cells from the same LCMV-infected animal showed that EVs bound specifically to activated CD44+ TE cells, but not to resting CD44− TN cells (, Suppl. Fig. 5A,B). We first compared the MFIs of CD9/CD63 (combined in one staining), CD54, MHC-II, CD86 and CD31 between CD8+ TN, MFG-E8−CD8+ TE and EV+CD8+ TE (). We found strongly increased MFIs of CD9/CD63, CD54 and MHC-II on EV+CD8+ TE cells as compared to MFG-E8− CD8+ TE or CD8+ TN (), which were statistically significantly elevated on EV+CD8+ TE cells for CD9/CD63, CD54, MHC-II (Suppl. Fig. 7A). As T cells of the mouse do not express MHC-II themselves [Citation58], this supports the possibility that TE acquire these molecules through EVs.
Indeed, all markers showed a spot-like staining pattern on T cells, similar to MFG-E8+ EVs (). An exception was CD86, where CD8+ TN showed a complete surface staining, while its staining pattern on CD8+ TE changed to a spot-like appearance (). The MFI of CD86 was higher on CD8+ TN cells, as they express this molecule themselves and downregulate CD86 in the CD44+ memory state, as published previously [Citation59]. Yet, EV+ TE cells had a higher CD86 MFI than MFG-E8− TE ( Suppl. Fig 7A) suggesting accumulation of CD86 via EV-association to TE cells. These observations were not only restricted to CD8+ T cells, but were also true for CD4+ T cells (Supplemental Fig. 8A,B). To further investigate whether TE cells acquired the marker molecules through EVs, we generated a spot mask in the IDEAS software to quantify the number of MFG-E8+ and EV-marker+ spots. The spot count was significantly increased for all analysed markers on EV+ TE compared to MFG-E8− TE or TN of the CD8+ (, Suppl. Fig. 7B) or CD4+ (Suppl. Fig. 8B) T cell compartment, further supporting the idea that CD8+ and CD4+ TE cells acquire these molecules through EVs. If this was indeed the case, substantial colocalisation between MFG-E8 and the EV-markers should occur. For quantifying the degree of colocalisation we used the bright detail similarity (BDS) feature on the peak masks in the IDEAS software. When a cells’ BDS score was >0.7, we found substantial colocalisation between the MFG-E8 and the EV-marker staining. This analysis revealed that approximately 73% of all EV+ CD8+ TE showed high colocalisation of MFG-E8 with CD9/CD63+, 82% with CD54, 66% with MHC-II and 86% with CD86 (). CD4+ EV+ TE showed similar results (Suppl. Fig. 8 C). As mouse T cells do not express MHC-II, neither as naïve, nor as activated cells, these molecules found on the surface of T cells and colocalising with MFG-E8-eGFP must be of APC-origin. Furthermore, CD44+CD8+ TE cells do not express CD86 on their surface [Citation59] and CD86 colocalises to a great part with MFG-E8, the spot-like CD86 staining in TE most likely is the result of binding of CD86+PS+ EVs to T cells. There was also a certain percentage of CD8+ () and CD4+ (Suppl. Fig. 8 C) T cells with a BDS score <0.7 detected. Here we found EVs where MFG-E8 did not colocalise with any of the above markers. This argues either for the existence of PS – EVs where MFG-E8 staining was absent or below the detection limit or other processes of protein transfer to activated T cells such as trogocytosis [Citation60]. However, these EVs were in the minority.
Figure 8. EVs bound to CD8+ T cells originate from APCs. (a) Splenic TN and TE CD8+ T cells of LCMV-infected mice (day 5 post infection, n = 3) were analysed for staining with MFG-E8 and for expression of potential EV-markers CD9/CD63 (combined in one staining), MHC-II, CD54, CD86 and CD31. Median fluorescence intensities (MFI) ± SD of these proteins are indicated in the histograms. (B) Spot Analysis: Histograms show the number of identified spots on TN, EV+ TE and MFG-E8− TE CD8+ cells. The average number of spots are shown in each histogram. (C) Cells with a BDS < 0.7 did not show any significant co-localisation as determined by visual inspection. Cells with a BDS > 0.7 showed substantial colocalisation of MFG-E8 and the respective EV-marker. BDS scores are shown in the representative example images. Histograms show the BDS scores of EV+ TE CD8+ cells. The median BDS score and the percentage of cells showing co-localisation (BDS > 0.7) are indicated within histograms. Representative results of two independent experiments are shown.
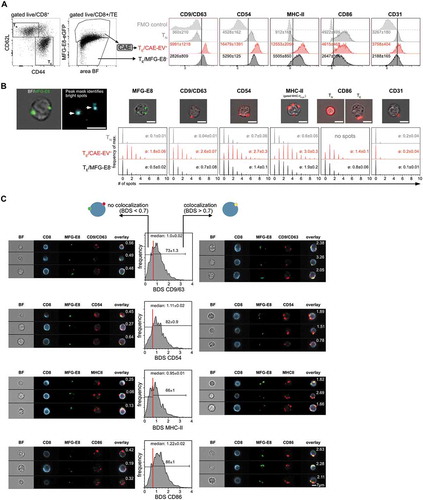
The endothelial cell marker CD31 was included in the analysis as potential marker for apoptotic bodies, since many CD31+ endothelial cells die by apoptosis early during LCMV infection [Citation61]. We only found weak staining for CD31 on CD8+ T cells (), and hardly any CD31+ spots (). To the contrary, CD4+ T cells showed CD31 surface expression (Suppl. Fig. 8A), but also no CD31+ spots. These results indicate that most EVs detected on activated T cells are not apoptotic bodies, but rather exosomes that are derived from APCs.
Discussion
Here we report the in vivo application of recombinant MFG-E8-eGFP for the detection of PS+ cells using conventional and image flow cytometry. We show that MFG-E8-eGFP binds similar fractions of PS+ apoptotic cells in vitro as compared to the more widely used Annexin V. However, PS-binding of Mge8-eGFP is calcium independent and works after in vivo injection. Surprisingly, we found the majority of PS+ cells in irradiated and LCMV-infected mice being not apoptotic, but alive and decorated with PS+ EVs. Upon development of a deep learning autoencoder, we can faithfully separate both, true apoptotic cells and EV-decorated cells for further analyses.
The detection of cell death in tissues in vivo is challenging. Therefore, dead cell analyses are mostly performed ex vivo with single cell suspensions derived from the organs of interest after biopsies or sacrifice of experimental animals. However, this procedure exposes cells to additional stress factors such as shear forces by tissue homogenisation, enzymes, temperature and pH changes, salt compositions of working solutions and many more. We can demonstrate that tissue preparation for dead cell analysis ex vivo artificially increases cell death rates due to handling. In addition, most methods to measure apoptotic cells have intrinsic restrictions, adding to their imprecision of analysing cell death. For example, labelling of fragmented DNA by TUNEL (terminal deoxynucleotidyl transferase dUTP nick end labelling) mostly detects late stage apoptotic cells only [Citation62], which are very rapidly cleared in situ, as most DNA fragmentation of dying cells occurs inside phagocytes [Citation63]. Using the analysis pipeline presented in this report, we could detect many phagocytes attached to apoptotic cells, probably for engulfment and efferocytosis [Citation3]. Furthermore, measuring the active form of caspase-3 using fluorescent substrates is not completely specific, as caspase-3 is also activated independently of cell death in certain cell types [Citation64]. The ex vivo staining of cells for surface PS using Annexin V has the disadvantage to require high Ca2+-levels, precluding it from most in vivo applications and interfering with many other downstream applications [Citation18]. MFG-E8, also known as lactadherin, also binds to PS on apoptotic cells [Citation19]. However, translocation of PS to the outer membrane not only occurs during apoptosis, but also during the formation of microvesicles [Citation6,Citation8] and exosomes [Citation9], allowing detection of PS+ EVs by MFG-E8-eGFP.
Although we could detect many MFG-E8+ cells, true apoptotic cells were relatively rare in spleens and BM of control mice, while the great majority were EV-decorated live cells. Due to their great morphological variability, a reliable discrimination was not possible using fluorescent intensity of the MFG-E8 signal only. Also, a combination of two features that worked well on manually selected apoptotic and EV-decorated cells failed in more complex samples. Only in vivo administered MFG-E8-eGFP in combination with imaging flow cytometry and a deep learning approach using a CAE-RF allowed us to reliably classify the MFG-E8+ cells into PS+ apoptotic or PS+ EV-decorated cells. Using this pipeline, we detected significant cell death during LCMV-infection specifically among CD4+ and CD8+ TCM cells. Previous reports showed substantial death among CD44+CD4+ and CD8+ memory T cells during the early phase (day 2–4) of LCMV infection. Such attrition depended on type I interferon production [Citation52–Citation54]. Our novel method, using a single staining reagent, therefore confirmed previous findings obtained with other, more laborious methods involving combinations of in vitro culture, Annexin V-staining, TUNEL-assays and active Caspase detection [Citation52–Citation54].
Another striking finding is the dramatic increase in cells that bind EVs. On the one hand these vesicles could be virus-containing particles infecting new cells, or apoptotic bodies reflecting the increased amount of cell death. However, given the wide range of immunoregulatory functions of EVs [Citation14], the increase in EVs could also be a consequence of the ongoing immune response. The fact that especially B cells and activated CD8+ T cells bind these EVs, supports this idea. It has been shown previously that activated DCs secrete MHC-II containing exosomes, which bind to activated CD4+ T cells via LFA-1 [Citation65] and could play a role in T cell activation [Citation55]. Evidence for their strong immunostimulatory function came from early exosome studies demonstrating the capability of tumour-antigen bearing exosomes secreted from DCs to trigger T-cell dependent anti-tumour responses [Citation56]. In LCMV-infected mice CD4+ T cells were not as strongly EV-decorated as compared to CD8+ T cells. Previous reports showed that vesicles derived from DCs were able to stimulate CD8 T cells in vitro [Citation66] and transfer exogenous antigen to DCs for CD8+ [Citation67] and CD4+ T cell priming [Citation68].
Approximately half of all CD8+ T cells were EV-decorated during LCMV infection. This could indicate that either those T cells were targeted by EVs produced by other cells, or that we detected nascent EVs produced by T cells themselves. Both scenarios are possible. It has been shown that TNFα-containing exosomes were able to delay activation-induced cell death in T cells [Citation69]. On the other hand, T cells release EVs constitutively and EV secretion is enhanced by TCR triggering [Citation70,Citation71], which causes increased intracellular calcium levels for enhanced EV-production [Citation72]. Moreover, EVs from CD8+ T cells may also contain granzyme and perforin [Citation73] and can inhibit antigen presentation and survival of DCs to downmodulate immune responses in mouse models of cancer and diabetes [Citation74]. In addition, microvesicles budding from the immunological synapses of CD4+ T cells in vitro do contain TCR, which may transfer signals to B cells expressing cognate peptide MHC-II [Citation75]. However, our finding that MFG-E8+ EVs carry APC-markers such as MHC-II, CD86, CD54 and tetraspanins rather argue for the exosomal APC-origin of these EVs. Especially the fact that MHC-II is not made by murine CD4+ or CD8+ T cells strongly argues for the fact that these EVs are APC-derived.
Also, many B cells carried vesicles, even in non-infected mice. EVs can be a source of native, unprocessed antigen [Citation76] and in the case of virus infections they could carry intact viral proteins [Citation77] for recognition by cognate B-cell receptors causing B cell activation. In addition, previous studies described B cells becoming Annexin V positive, without undergoing apoptosis [Citation78]. While the authors described that PS-exposure was selective for B cells upon their IgM-mediated positive selection, they did not determine, if PS-exposure was cell-intrinsic or by EV-decoration.
Further studies are necessary to determine if EV binding is restricted to certain zones of lymphatic organs, such as the MZ, where blood is filtered. Cells locating to the MZ, such as MZ B cells, CD11 c+CD11b− DCs and activated T cells could therefore be preferentially exposed to EVs. However, the fact that also follicular B cells are EV-decorated argues against this possibility.
To our knowledge, this is the first report that identifies cell subsets binding naturally occurring EVs in vivo. In vivo staining of dying cells and EV-decorated cells using MFG-E8-eGFP is a valuable tool, not only to reliably identify cells that undergo cell death in different pathological conditions, but also to clarify the function of EVs on different cell types in various tissues under normal and pathological conditions, such as viral infections, autoimmunity and cancer.
Author contributions
N.K.C. and F.J.T. developed the deep learning model and the data analysis pipeline. T.B. and J.K. planned experiments and wrote the paper. L.R., A.L., A.F.-A.K. and T.K. performed experiments. M.SCH. and M.S. provided electron microscopy expertise.
Declaration of interests
The authors declare no competing financial interests. T.B. and J.K. consult Bioconduct (France).
Supplemental Material
Download MS Word (3.5 MB)Acknowledgments
We acknowledge the Core Facility Flow Cytometry at the Biomedical Center, Ludwig-Maxmilians-Universität München, for providing the ImageStreamX MKII imaging flow cytometer. N.K.C., A.L., T.K. were supported by a Deutsche Forschungsgemeinschaft (DFG, German Research Foundation) fellowship through the Graduate School of Quantitative Biosciences Munich (QBM) and N.K.C. is supported additionally through the School of Life Sciences Weihenstephan, Technical University of Munich, Germany. F.J.T. acknowledges financial support by the Graduate School QBM, the DFG within the Collaborative Research Centre (CRC) 1243 (Subproject A17), by the Helmholtz Association (Incubator grant sparse2big, grant # ZT-I-0007), by the BMBF (grant# 01IS18036A and grant# 01IS18053A) and by the Chan Zuckerberg Initiative DAF (advised fund of Silicon Valley Community Foundation, 182835). T.B. is supported by the DFG CRC 1054 (TP B03) and Graduate School QBM. This work was funded by the DFG under Germany’s Excellence Strategy within the framework of the Munich Cluster for Systems Neurology (EXC 2145 SyNergy – ID 390857198) to M.K.
Supplemental Material
Supplemental data for this article can be accessed here.
Correction Statement
This article has been republished with minor changes. These changes do not impact the academic content of the article.
Additional information
Funding
References
- Nagata S. Apoptosis and clearance of apoptotic cells. Annu Rev Immunol. 2018;36:489–20.
- Surh CD, Sprent J. T-cell apoptosis detected in situ during positive and negative selection in the thymus. Nature. 1994;372:100–103.
- deCathelineau AM, Henson PM. The final step in programmed cell death: phagocytes carry apoptotic cells to the grave. Essays Biochem. 2003;39:105–117.
- Fadok VA, Voelker DR, Campbell PA, et al. Exposure of phosphatidylserine on the surface of apoptotic lymphocytes triggers specific recognition and removal by macrophages. J Immunol. 1992;148:2207–2216.
- Martin SJ, Reutelingsperger CP, McGahon AJ, et al. Early redistribution of plasma membrane phosphatidylserine is a general feature of apoptosis regardless of the initiating stimulus: inhibition by overexpression of Bcl-2 and Abl. J Exp Med. 1995;182:1545–1556.
- Hugel B, Martinez MC, Kunzelmann C, et al. Membrane microparticles: two sides of the coin. Physiology (Bethesda). 2005;20:22–27.
- Llorente A, Skotland T, Sylvanne T, et al. Molecular lipidomics of exosomes released by PC-3 prostate cancer cells. Biochim Biophys Acta. 2013;1831:1302–1309.
- Martinez MC, Freyssinet JM. Deciphering the plasma membrane hallmarks of apoptotic cells: phosphatidylserine transverse redistribution and calcium entry. BMC Cell Biol. 2001;2:20.
- Thery C, Zitvogel L, Amigorena S. Exosomes: composition, biogenesis and function. Nat Rev Immunol. 2002;2:569–579.
- Wubbolts R, Leckie RS, Veenhuizen PT, et al. Proteomic and biochemical analyses of human B cell-derived exosomes. Potential implications for their function and multivesicular body formation. J Biol Chem. 2003;278:10963–10972.
- Mathieu M, Martin-Jaular L, Lavieu G, et al. Specificities of secretion and uptake of exosomes and other extracellular vesicles for cell-to-cell communication. Nat Cell Biol. 2019;21:9–17.
- Jeppesen DK, Fenix AM, Franklin JL, et al. Reassessment of Exosome Composition. Cell. 2019;177:428–445 e418.
- Altan-Bonnet N. Extracellular vesicles are the Trojan horses of viral infection. Curr Opin Microbiol. 2016;32:77–81.
- Robbins PD, Morelli AE. Regulation of immune responses by extracellular vesicles. Nat Rev Immunol. 2014;14:195–208.
- Tkach M, Thery C. Communication by extracellular vesicles: where we are and where we need to go. Cell. 2016;164:1226–1232.
- Heijnen HF, Schiel AE, Fijnheer R, et al. Activated platelets release two types of membrane vesicles: microvesicles by surface shedding and exosomes derived from exocytosis of multivesicular bodies and alpha-granules. Blood. 1999;94:3791–3799.
- Larson MC, Luthi MR, Hogg N, et al. Calcium-phosphate microprecipitates mimic microparticles when examined with flow cytometry. Cytometry A. 2013;83:242–250.
- van Engeland M, Nieland LJ, Ramaekers FC, et al. Annexin V-affinity assay: a review on an apoptosis detection system based on phosphatidylserine exposure. Cytometry. 1998;31:1–9.
- Hanayama R, Tanaka M, Miwa K, et al. Identification of a factor that links apoptotic cells to phagocytes. Nature. 2002;417:182–187.
- Otzen DE, Blans K, Wang H, et al. Lactadherin binds to phosphatidylserine-containing vesicles in a two-step mechanism sensitive to vesicle size and composition. Biochim Biophys Acta. 2012;1818:1019–1027.
- Shi J, Shi Y, Waehrens LN, et al. Lactadherin detects early phosphatidylserine exposure on immortalized leukemia cells undergoing programmed cell death. Cytometry A. 2006;69:1193–1201.
- Shi J, Heegaard CW, Rasmussen JT, et al. Lactadherin binds selectively to membranes containing phosphatidyl-L-serine and increased curvature. Biochim Biophys Acta. 2004;1667:82–90.
- Headland SE, Jones HR, D’Sa AS, et al. Cutting-edge analysis of extracellular microparticles using ImageStream(X) imaging flow cytometry. Sci Rep. 2014;4:5237.
- Pepperkok R, Ellenberg J. High-throughput fluorescence microscopy for systems biology. Nat Rev Mol Cell Biol. 2006;7:690–696.
- Hinton GE, Salakhutdinov RR. Reducing the dimensionality of data with neural networks. Science (New York, NY). 2006;313:504–507.
- Masci J, Meier U, Cireşan D, et al. Stacked convolutional auto-encoders for hierarchical feature extraction. Berlin, Heidelberg: Springer Berlin Heidelberg; 2011.
- Ranzato M, Huang FJ, Boureau YL, et al. Unsupervised learning of invariant feature hierarchies with applications to object recognition. In: 2007 IEEE Conference on computer vision and pattern recognition. Minneapolis, MN; 2007. p. 1–8.
- Blasi T, Hennig H, Summers HD, et al. Label-free cell cycle analysis for high-throughput imaging flow cytometry. Nat Commun. 2016;7:10256.
- Dao D, Fraser AN, Hung J, et al. CellProfiler Analyst: interactive data exploration, analysis and classification of large biological image sets. Bioinformatics. 2016;32:3210–3212.
- Eliceiri KW, Berthold MR, Goldberg IG, et al. Biological imaging software tools. Nat Methods. 2012;9:697–710.
- Eulenberg P, Kohler N, Blasi T, et al. Reconstructing cell cycle and disease progression using deep learning. Nat Commun. 2017;8:463.
- Pellegrini M, Calzascia T, Toe JG, et al. IL-7 engages multiple mechanisms to overcome chronic viral infection and limit organ pathology. Cell. 2011;144:601–613.
- Kingma DP, Ba JL. Adam: a method for stochastic optimization. abs/1412.6980: Computing Research Repository (CoRR); 2014.
- Pedregosa F, Varoquaux G, Gramfort A, et al. Scikit-learn: machine Learning in Python. J Mach Learn Res. 2011;12:2825–2830.
- Breiman L. Random Forests. Mach Learn. 2001;45:5–32.
- Wilson EB. Probable inference, the law of succession, and statistical inference. J Am Stat Assoc. 1927;22:209–212.
- Andersen MH, Graversen H, Fedosov SN, et al. Functional analyses of two cellular binding domains of bovine lactadherin†. Biochemistry. 2000;39(20):6200–6206.
- Henson PM, Hume DA. Apoptotic cell removal in development and tissue homeostasis. Trends Immunol. 2006;27:244–250.
- Eriksson D, Stigbrand T. Radiation-induced cell death mechanisms. Tumour Biol. 2010;31:363–372.
- George TC, Basiji DA, Hall BE, et al. Distinguishing modes of cell death using the ImageStream multispectral imaging flow cytometer. Cytometry A. 2004;59:237–245.
- Ashkenazi A, Salvesen G. Regulated cell death: signaling and mechanisms. Annu Rev Cell Dev Biol. 2014;30:337–356.
- LeCun Y, Bengio Y, Hinton G. Deep learning. Nature. 2015;521:436–444.
- Hastie TJ, Tibshirani RJ, Friedman JH. The elements of statistical learning: data mining, inference, and prediction. 2 ed. New York: Springer; 2009.
- Heylmann D, Rodel F, Kindler T, et al. Radiation sensitivity of human and murine peripheral blood lymphocytes, stem and progenitor cells. Biochim Biophys Acta. 2014;1846:121–129.
- Rodrigues-Moreira S, Moreno SG, Ghinatti G, et al. Low-dose irradiation promotes persistent oxidative stress and decreases self-renewal in hematopoietic stem cells. Cell Rep. 2017;20:3199–3211.
- Matter M, Odermatt B, Yagita H, et al. Elimination of chronic viral infection by blocking CD27 signaling. J Exp Med. 2006;203:2145–2155.
- Borrow P, Evans CF, Oldstone MB. Virus-induced immunosuppression: immune system-mediated destruction of virus-infected dendritic cells results in generalized immune suppression. J Virol. 1995;69:1059–1070.
- Odermatt B, Eppler M, Leist TP, et al. Virus-triggered acquired immunodeficiency by cytotoxic T-cell-dependent destruction of antigen-presenting cells and lymph follicle structure. Proc Natl Acad Sci U S A. 1991;88:8252–8256.
- Swain SL, McKinstry KK, Strutt TM. Expanding roles for CD4(+) T cells in immunity to viruses. Nat Rev Immunol. 2012;12:136–148.
- Wong P, Pamer EG. CD8 T cell responses to infectious pathogens. Annu Rev Immunol. 2003;21:29–70.
- Jameson SC, Masopust D. Understanding subset diversity in T cell memory. Immunity. 2018;48:214–226.
- Bahl K, Huebner A, Davis RJ, et al. Analysis of apoptosis of memory T cells and dendritic cells during the early stages of viral infection or exposure to toll-like receptor agonists. J Virol. 2010;84:4866–4877.
- Bahl K, Kim SK, Calcagno C, et al. IFN-induced attrition of CD8 T cells in the presence or absence of cognate antigen during the early stages of viral infections. J Immunol. 2006;176:4284–4295.
- Crouse J, Kalinke U, Oxenius A. Regulation of antiviral T cell responses by type I interferons. Nat Rev Immunol. 2015;15:231–242.
- Buschow SI, Nolte-’t Hoen EN, van Niel G, et al. MHC II in dendritic cells is targeted to lysosomes or T cell-induced exosomes via distinct multivesicular body pathways. Traffic. 2009;10:1528–1542.
- Zitvogel L, Regnault A, Lozier A, et al. Eradication of established murine tumors using a novel cell-free vaccine: dendritic cell-derived exosomes. Nat Med. 1998;4:594–600.
- Segura E, Nicco C, Lombard B, et al. ICAM-1 on exosomes from mature dendritic cells is critical for efficient naive T-cell priming. Blood. 2005;106:216–223.
- Benoist C, Mathis D. Regulation of major histocompatibility complex class-II genes: X, Y and other letters of the alphabet. Annu Rev Immunol. 1990;8:681–715.
- Eberlein J, Davenport B, Nguyen TT, et al. Multiple layers of CD80/86-dependent costimulatory activity regulate primary, memory, and secondary lymphocytic choriomeningitis virus-specific T cell immunity. J Virol. 2012;86:1955–1970.
- Huang JF, Yang Y, Sepulveda H, et al. TCR-Mediated internalization of peptide-MHC complexes acquired by T cells. Science (New York, NY). 1999;286:952–954.
- Frebel H, Nindl V, Schuepbach RA, et al. Programmed death 1 protects from fatal circulatory failure during systemic virus infection of mice. J Exp Med. 2012;209:2485–2499.
- Negoescu A, Lorimier P, Labat-Moleur F, et al. In situ apoptotic cell labeling by the TUNEL method: improvement and evaluation on cell preparations. J Histochem Cytochem. 1996;44:959–968.
- Odaka C, Mizuochi T. Macrophages are involved in DNA degradation of apoptotic cells in murine thymus after administration of hydrocortisone. Cell Death Differ. 2002;9:104–112.
- McComb S, Mulligan R, Sad S. Caspase-3 is transiently activated without cell death during early antigen driven expansion of CD8(+) T cells in vivo. PloS One. 2010;5:e15328.
- Nolte-’t Hoen EN, Buschow SI, Anderton SM, et al. Activated T cells recruit exosomes secreted by dendritic cells via LFA-1. Blood. 2009;113:1977–1981.
- Kovar M, Boyman O, Shen X, et al. Direct stimulation of T cells by membrane vesicles from antigen-presenting cells. Proc Natl Acad Sci U S A. 2006;103:11671–11676.
- Winau F, Weber S, Sad S, et al. Apoptotic vesicles crossprime CD8 T cells and protect against tuberculosis. Immunity. 2006;24:105–117.
- Montecalvo A, Shufesky WJ, Stolz DB, et al. Exosomes as a short-range mechanism to spread alloantigen between dendritic cells during T cell allorecognition. J Immunol. 2008;180:3081–3090.
- Zhang HG, Liu C, Su K, et al. A membrane form of TNF-alpha presented by exosomes delays T cell activation-induced cell death. J Immunol. 2006;176:7385–7393.
- Blanchard N, Lankar D, Faure F, et al. TCR activation of human T cells induces the production of exosomes bearing the TCR/CD3/zeta complex. J Immunol. 2002;168:3235–3241.
- van der Vlist EJ, Arkesteijn GJ, van de Lest CH, et al. CD4+ T cell activation promotes the differential release of distinct populations of nanosized vesicles. J Extracell Vesicles. 2012;1:18364.
- Savina A, Furlan M, Vidal M, et al. Exosome release is regulated by a calcium-dependent mechanism in K562 cells. J Biol Chem. 2003;278:20083–20090.
- Peters PJ, Borst J, Oorschot V, et al. Cytotoxic T lymphocyte granules are secretory lysosomes, containing both perforin and granzymes. J Exp Med. 1991;173:1099–1109.
- Xie Y, Zhang H, Li W, et al. Dendritic cells recruit T cell exosomes via exosomal LFA-1 leading to inhibition of CD8+ CTL responses through downregulation of peptide/MHC class I and Fas ligand-mediated cytotoxicity. J Immunol. 2010;185:5268–5278.
- Choudhuri K, Llodra J, Roth EW, et al. Polarized release of T-cell-receptor-enriched microvesicles at the immunological synapse. Nature. 2014;507:118–123.
- Qazi KR, Gehrmann U, Domange Jordo E, et al. Antigen-loaded exosomes alone induce Th1-type memory through a B-cell-dependent mechanism. Blood. 2009;113:2673–2683.
- Nolte-’t Hoen E, Cremer T, Gallo RC, et al. Extracellular vesicles and viruses: are they close relatives? Proc Natl Acad Sci U S A. 2016;113:9155–9161.
- Dillon SR, Constantinescu A, Schlissel MS. Annexin V binds to positively selected B cells. J Immunol. 2001;166:58–71.