
ABSTRACT
Dendritic cells (DC) have the unique capacity to activate naïve T cells by presenting T cell receptor specific peptides from exogenously acquired antigens bound to Major Histocompatibility Complex (MHC) molecules. MHC molecules are displayed on the DC plasma membrane as well as on extracellular vesicles (EV) that are released by DC, and both have antigen-presenting capacities. However, the physiological role of antigen presentation by EV is still unclear. We here demonstrate that the release of small EV by activated DC is strongly stimulated by phagocytic events. We show that, concomitant with the enhanced release of EV, a significant proportion of phagocytosed bacteria was expulsed back into the medium. High-resolution fluorescence microscopic images revealed that bacteria in phagosomes were surrounded by EV marker-proteins. Moreover, expulsed bacteria were often found associated with clustered HLA II and CD63. Together, these observations suggest that exosomes may be formed by the inward budding into phagosomes, whereupon they are secreted together with the phagosomal content. These findings may have important implications for selective loading of peptides derived from phagocytosed pathogens onto exosome associated HLA molecules, and have important implications for vaccine design.
Introduction
Dendritic cells (DC) are professional antigen presenting cells that use their innate immune functions to drive adaptive immune responses [Citation1]. Once activated, for example upon recognition of components from invading pathogens by Toll-like receptors (TLRs), DC have unique abilities to excise peptides from proteins of exogenous origin that are acquired by endocytic processes, load these peptides onto major histocompatibility complex (MHC) molecules, and present the resulting complexes to activate cognate naïve T cells. Like most cell types, DC release heterogeneous populations of extracellular vesicles (EV). EV include microvesicles (MV) that pinch off from the plasma membrane, and exosomes that are secreted by multivesicular endosomes [Citation2–Citation4]. EV from activated DC carry MHC-peptide complexes that can activate T cells by their own right or after being recruited by and in association with bystander DC [Citation5–Citation7]. DC-derived EV are heterogeneous in size and molecular composition, and in their capacities to stimulate T cells [Citation8–Citation10]. Their functionality is also dependent on the status of maturation of the producing DC [Citation10–Citation12]. EV isolated from cultured DC have been tested for their potential use as vaccine against cancer and pathogens [Citation2,Citation6,Citation13–Citation15]. Yet, the precise role that DC-derived EV play in vivo remains unclear. Previously, we reported that interactions of DC with activated T-cells stimulated the release of antigen presenting EV, suggesting a role EV in dissemination and reinforcement of antigen presenting potential within lymphoid tissues [Citation16,Citation17]. Another hint for antigen presenting functions of EV came from observations that both macrophages and epithelial cells can release phagocytosed pathogens through non-lytic expulsion, involving direct fusion of the phagosome with the plasma membrane [Citation18–Citation24]. Interestingly, it has been described that exosomes may be co- released by that process [Citation25]. In our current study we demonstrate for the first time that in response to being challenged by Escherichia coli, DC expulse a significant proportion of previously phagocytosed E. coli. Moreover, we show that this process coincides with the release of exosomes. Potentially, these observations have implications for preferential loading of pathogen-derived antigens onto exosome associated MHC molecules, and the efficacy of such generated exosomes in antigen presentation.
Materials and methods
Cell culture and processing
Blood from healthy volunteers was obtained following institutional ethical approval (METC protocol number 07–125/C). The experiments abide by the Declaration of Helsinki principles for human research ethics. Peripheral blood mononuclear cells (PBMCs) were isolated from lithium heparinized blood samples using Ficoll isopaque density gradient centrifugation (GE Healthcare). CD14+ monocytes were isolated by positive selection using CD14+ MicroBeads (Miltenyi Biotec). The purity of CD14+ sorted cells was determined using flow cytometry after staining for CD14 and CD3. Only cultures containing ≥90% CD14+ cells prior to differentiation towards monocyte derived DC (moDC) were used for further experimentation. For differentiation into moDC [Citation26], CD14+ cells were cultured in 6-wells plates (Nunclon, Thermo Scientific) at a concentration of 1–1.5 × 10⁶/ml in 2–3ml per well at 37°C and 5% CO2 in RPMI 1640 GlutaMAX (Gibco), 1% Penicillin/Streptomycin (Gibco) and 20% heat inactivated, 0,2 µM filtered FCS (Biowest), supplemented with 450U/ml rhGM-CSF (Immunotools) and 300U/ml IL-4 (Immunotools) for a total of five days. EV-depleted FCS was prepared after fivefold dilution in RPMI by centrifugation for 18 hours at 100,000 × g in polyallomer tubes (Beckman Coulter) using a swing-out rotor (SW-28, Beckman Coulter). Cytokines were replenished after three days. Prior to experiments, the immature moDC, which were in suspension, were harvested by subtle resuspension in culture medium, and washed once with PBS by centrifugation for 10 min at 330 × g. After washing, the immature moDC were resuspended in culture medium containing EV depleted FCS for further culture/experimentation. When indicated, moDC were cultured for 16 hours in the presence or absence of 100 ng/ml ultrapure LPS (from E. coli strain O111:B4, Invivogen) and/or heat inactivated E. coli (see below). For these experiments, cells were seeded in 6 wells plates in 2ml/well at a density of 100,000 cells/ml.
E. coli preparation
E. coli strain DH5α was cultured in LB medium (MP Biomedicals) to a OD600 of 0.5 and then heat-killed by incubating for 30 min at 75°C. Heat killed bacteria were pelleted by centrifugation for 5 min at 13,300 × g, resuspended in 0.2M bicarbonate buffer at pH 8.3 using a 23G syringe, and washed in the same buffer using the same procedure. Washed bacteria were labelled either with Cy3B-NHS (200µg/ml, Thermo Fisher), or with a combination of AlexaFluor405-NHS (200µg/ml Thermo Fisher) and EZ-Link NHS-LC-Biotin (88µg/ml Thermo Fisher) for 45 min at 4°C under constant rotation. In case of double labelling, EZ-Link NHS-LC-Biotin was added 10 min after the NHS-AlexaFluor405-NHS ester. After labelling, bacteria were washed three times by centrifugation for 5 min at 13,300 × g and resuspension in PBS (phosphate buffered saline, Gibco) containing 100 mM glycine (Sigma). Glycine was added to ensure quenching of non-reacted NHS-groups. Finally, the bacteria were washed three times in PBS prior to storage at 4°C. Bacteria were quantified using a haemocytometer.
Flow cytometry
After incubation, detached moDC were harvested in excess ice cold PBS. Adherent cells were gently dissociated from the plastic by pipetting in ice cold PBS and pooled with the already detached cells. Viability was probed using 7-Aminoactinomycin D (7-AAD) (1:25, BD) according to manufacturer instructions. All subsequent immune-labelling steps were performed on unfixed cells at 4°C. Prior to incubation with antibodies, cells were blocked in 0.5% NMS (Fitzgerald 88R-M002) diluted in flow cytometry buffer (PBS with 0.5% BSA and 0.02% NaN3). HLA-II was detected with PE-Cy7-labelled mouse-anti human HLA-DR (clone L243; 1:200; BioLegend), CD86 with PE-labelled mouse anti-human CD86 (clone 2331/FUN-1, 1:50, BD), CD11c with fluorescein-5-isothiaocyanate (FITC)-labelled mouse anti-human CD11c (clone BU15, 1:50, Invitrogen), CD14 with FITC-labelled mouse anti-human CD14 (clone Tük 4, 1:100, Miltenyi), and CD3 with pacific blue (PB)-labelled mouse anti-human CD3 (clone UCHT-1, 1:50, Beckman Coulter). PE-labelled murine IgG1,k (clone MOPC-21; BD) and PE-Cy7-labelled murine IgG2a,k (clone MOPC-173; BioLegend) were used as isotype controls. Flow cytometry was performed on a FacsCanto II (BD) flow cytometer and the data were analysed with FlowJo 10.0 software (Treestar).
Flow cytometry-based analysis of expulsed E. coli
MoDC were incubated for 3 hours with E. coli that were both biotinylated-, and labelled with AF405 (25 E. coli per moDC). The moDC were then resuspended in ice cold PBS, and collected by centrifugation at 240 × g for 4 min at 4°C in a tabletop centrifuge. The majority of non-phagocytosed E. coli remained in the supernatant by this procedure. The pelleted moDC were resuspended and washed in PBS by centrifugation at 240 × g, and probed for 10 min with Streptavidin-labelled allophycocyanin (APC) (1:50, eBiosciences) on ice to label any remaining extracellular non-phagocytosed biotin and AF405 double labelled E. coli. After washing away excess streptavidin-APC, the moDC were re-incubated at cell culture conditions for another 3 hours to allow expulsion of phagocytosed APC-negative E. coli. Hereafter the samples were centrifuged for 4 min at 240 × g to remove moDC. Expulsed E. coli was collected from the supernatant by centrifugation at 13,300 × g for 8 min and labelled with streptavidin-phycoerythrin (PE) (1:50, eBiosciences) for 10 min on ice. After labelling, E. coli was washed once in cold medium and once in PBS, and resuspended in flow cytometry buffer (PBS with 0.5% BSA and 0.02% NaN3) for flow cytometric analysis, as described above.
EV isolation and Western blotting analysis
EV were collected from cell culture media by differential (ultra)centrifugation at 4°C, as reported earlier [Citation27]. MoDC were removed in two subsequent centrifugation steps of 10 min at 200 × g. Next, supernatants were centrifuged sequentially two times for 10 min at 500 × g, once for 30 min at 10,000 × g, and finally for 65 min at 100,000 × g. The last two centrifugation steps were performed in polyallomer tubes (Beckman Coulter) using a swing-out rotor (SW-40, Beckman Coulter). The 10,000 × g and 100,000 × g pellets, predominantly containing large and small EV respectively, were lysed in non-reducing SDS-PAGE sample buffer and incubated for 5 min at 100°C. After separation by 10% SDS-PAGE, proteins were transferred to 0.45 µm polyvinylidene difluoride membranes (Merck Millipore). The blots were blocked in PBS containing 0.2% cold water fish skin gelatin (Sigma) and 0.1% Tween-20. Immuno-labelling was performed in the same buffer using mouse anti-human CD9 (clone HI9a; 1:2000; Biolegend), mouse anti-human CD63 (clone TS63; 1:2000; Abcam), mouse anti-human CD81 (clone B-11; 1:400; Santa Cruz), mouse anti-human HLA-B,C (clone HC-10; 1:400; kindly provided by E.J.H.J. Wiertz), or mouse anti-human HLA II (clone CR3/43; 1:10,000; Dako). Primary antibodies were labelled with HRP-conjugated goat anti-mouse IgG and IgM (1:10,000; Jackson). HRP activity was monitored using ECL (SuperSignal West Dura Extended Duration Substrate, Thermo Scientific) and detected with a ChemiDoc MP Imaging System (BioRad). Relative signal strengths were determined using Image Lab V5.1 (BioRad).
Structured illumination microscopy (SIM)
MoDC were cultured for approximately 16 hours either in presence or absence of Cy3B-labelled E. coli (10 E. coli/moDC) in 6-wells culture plates, and subsequently harvested in ice cold PBS. The harvested moDC were pelleted by centrifugation for 10 min at 330 × g, and resuspended to 0.5×10⁶ cell/ml in cell culture medium. Next, 200 µl samples of the cell suspension were placed onto 12 mm glass coverslips (World Precision Instruments) using a custom made adaptor (3D design available upon request) fitted onto cuvettes (Shandon-Elliott) that were pre-wetted with 50 µL 2% bovine serum albumin in PBS, and centrifuged for 3 min at 800 rpm and room temperature using a cytocentrifuge (Shandon-Elliott). Subsequently, the coverslips were fixed for 30 min in 4% paraformaldehyde in 0,1 M phosphate buffer, pH 7.4. Fixed cells were washed with PBS and permeabilized for 5 min in PBS containing 0,1% Saponin (Sigma), 2% bovine serum albumin (BSA), and quenched for 20 min in 20mM NH4Cl. Subsequent washing and labelling was performed in PBS containing 2% BSA and 0.1% saponin. Cells were labelled with mouse anti human HLA II (CR3/43; 0.4µg/ml, Dako) or mouse anti human CD63 (H5C6, 1µg/ml, BD) for 45 min at room temperature, washed three times and incubated with goat anti-mouse AlexaFluor488 (1µg/ml, Invitrogen). Labelled cells were washed twice in labelling buffer, twice with PBS, and finally in deionized water. Coverslips were mounted onto object glasses in Prolong Diamond embedding media (Thermo Fisher) and left to solidify overnight. Images were acquired using a DeltaVision OMX V4 Blaze imaging system in SIM imaging modus with a 60× objective (Olympus U-PLAN APO, NA 1.42) and oil with a refractive index of 1.516, with the factory-supplied BGR filter tray and 125 nm step size in the Z-axis. Acquisition was executed by the OMX Deltavision software package and images were reconstructed using SoftWoRx (Cytiva) with OTFs generated by GE Healthcare service engineers (raw data, alignment parameters available on request). Movies and maximum intensity projections were prepared in Imaris 8.1 (Andor/Bitplane) with linear intensity adjustments for labelled channels and a gamma correction of 1.4 was applied for E. coli channels to highlight bacteria. Cropped regions of reconstructed and channel aligned SIM images of bacteria were generated using FIJI, using its scripting tools to adjust linearly for the different labels (Alx488 1000/15000); Cy3B 7500/60000).
Live confocal microscopy-based expulsion analysis
MoDC were labelled with cell trace yellow (CTY) (1µM, Thermo Fisher) in PBS at room temperature for 5 min, followed by addition of cold culture medium 1:1 and a further 5 min incubation on ice. Subsequently, cells were pelleted by spinning 10 min at 330 × g and resuspended in warm medium. Next, the moDC were seeded in Eppendorf tubes and incubated with biotinylated, AlexaFluor405-labelled E. coli (10/moDC) at regular culture conditions. After three hours, moDC were pelleted by centrifugation for 4 at 240 × g, washed two times with cold PBS, and stained with AlexaFluor647-labelled streptavidin (1:100, Invitrogen) for 10 min on ice. Subsequently, cells were washed twice with cold medium, resuspended in cold medium and seeded in a Fluorodish (35–100, World Precision Instruments). Fluorodishes were kept on ice until the start of imaging. Imaging was performed on a NIKON A1R confocal microscope with a 40× Plan Apo objective (NA 1.3) while maintaining cell culture conditions (37°C, 5% CO2) in a tabletop culture control unit (TOKAI Hit). Confocal scanning was performed using the resonance mode with a pinhole set 4× the airy disk and a pixel size of 0.62 µm. Diode laser and filter settings were used to detect AlexaFluor405, CTY, and AlexaFluor647 sequentially using bidirectional line switching. Differential interference contrast (DIC) images were collected along with the CTY channel. Overviews of the cultures were generated every 2 min by automated scanning of 4×4 image fields in 5 positions along the Z-axis at 1.5µm steps. Imaging data were acquired over a period of up to 11 hours and processed in NIS elements 5.02 (Nikon Microsystems). Images were pre-processed by subtracting the average intensity in the Z-stack before maximal internal projection. Objects were isolated using the spot isolation procedure in NIS elements with background subtraction and median filtering. Alexa647 binary isolates were dilated by 1 pixel to compensate spectral and motion shifts due to sequential recording. Isolated objects were classified based on co-incidence of the channels. Expulsed E. coli objects were defined as Alexa405-positive, Alexa647-negative, CTY-negative events, counted over time, normalized to number of counted moDC, and related relative to the average total Alexa 405-positive, Alexa647-negative events (both CTY-positive and CTY-negative) that were recorded in the first hour of imaging.
Statistical analysis
Significance of difference was determined using Wilcoxon’s signed rank test with GraphPadPrism 7 software. P values ≤0.05 were considered statistically significant.
Results
MoDC phagocytose E. coli and become activated in the process
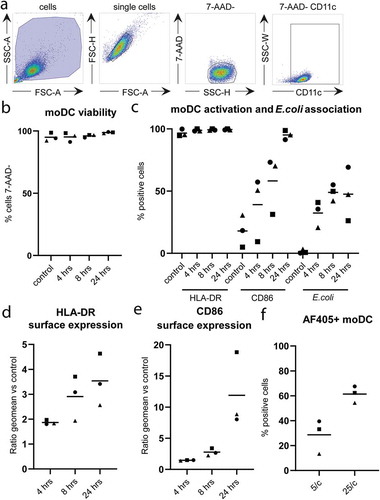
To study long-term effects of phagocytosis on the release of EV by moDC, we used fluorescently (AF405) labelled E. coli that were heat killed to prevent overgrowth of moDC. CD11c-expressing moDC were detected by flow cytometry ()). The viability of the moDC, as determined by 7-AAD-exclusion, remained unaffected by 24 hours incubation in the presence of 25 bacteria per moDC ()). HLA-DR and CD86 were increasingly expressed over time, and nearly all moDC had matured after 24 hours (, supplementary figures 1 and 2). Approximately 50% of the moDC contained a measurable signal for phagocytosed E. coli after 8 hours incubation with 25 bacteria per moDC (, supplementary figure 2). Of note, this percentage was significantly lower when moDC were incubated with fewer E. coli ()). The amount of 25 E. coli per moDC provided a maximal activation signal, as determined by the observation that the additional presence of LPS did not further enhance surface expression of moDC maturation markers (supplementary figure 1).
Figure 1. Phagocytosis of E. coli and activation of moDC.
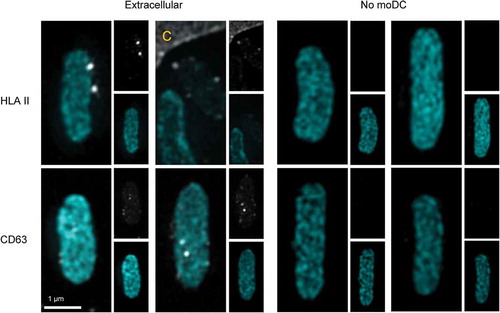
Phagocytosis of Cy3B-labelled E. coli by moDC was confirmed using structured illumination microscopy (SIM) 3D imaging, wherein moDC were stained for HLA II or CD63 ( and supplementary movies 1 and 2). In immature, unstimulated moDC () left panel), HLA II (grey) was mostly intracellular. As expected, moDC were activated by 16-hour incubation with E. coli, resulting in transfer of HLA II to the plasma membrane. Importantly, phagocytosed E. coli (cyan) was often found surrounded by a ring of small HLA II labelled puncta (), middle and right panels, and supplementary movie 1 for 3D rotation). Similar to HLA II, also CD63 (grey) was found throughout the cell in immature moDC () left panel). After phagocytosis of E. coli, CD63 redistributed to the phagosome containing areas of the cell, some of which distributed into puncta at the E. coli containing phagosomes () middle and right panels, and supplementary movie 2 for 3D rotation). CD63 is known to be highly enriched in endosomes as well as in exosomes [Citation28] and thought to be instrumental for cargo selection into exosomes [Citation28,Citation29], triggering the question whether exosomes could be expulsed along with phagocytosed bacteria. Consistent with this idea, some extracellular E. coli that had the opportunity to be phagocytosed and expulsed by moDC were decorated with discrete HLA II and CD63 labelled puncta ().
Figure 2. Subcellular distributions of HLA II and CD63 relative to phagocytosed E. coli.
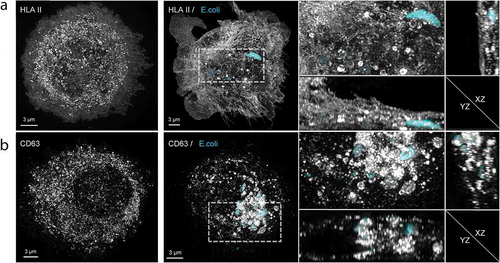
Figure 3. EV markers on expulsed E. coli.
Phagocytosis induced release of EV
To test whether phagocytosis of E. coli influenced the release of free EV, moDC were activated by LPS, either in the absence or presence of 5 or 25 heat inactivated E. coli per moDC. Activation of moDC by LPS alone may already affect the release of EV, although this idea is still controversial since only minor stimulatory as well as minor inhibitory effects of LPS on EV release by DC have been reported [Citation30,Citation31]. Therefore, to eliminate any potential bias introduced by moDC activation on EV release, LPS only was taken as control condition. EV were collected from the culture media by differential centrifugation. After removal of cells and cell debris, large EV were pelleted together with any remaining free E. coli, when present, by centrifugation at 10,000 × g. The supernatant was then re-centrifuged at 100,000 × g to collect small EV, including exosomes [Citation12,Citation27]. The 10,000 × g and 100,000 × g pellets were analysed by immunoblotting for the presence of EV-associated proteins. The antigen presenting molecules HLA-I and HLA-II, and the tetraspanins CD9, CD63, and CD81, were more abundantly present in the 100,000 × g compared to 10,000 × g pellets ()). This observation is consistent with predominant association of these markers with small EV [Citation12]. Interestingly, as compared LPS alone, the additional presence of E. coli stimulated the release of HLA-I, HLA-II, CD63 and CD81, but not CD9, in association with small EV. These observations indicate that the release of small EV is triggered by phagocytosis of bacteria independently of moDC activation. To determine the kinetics of secretion, moDC were stimulated for 4, 8 or 24 hour with LPS only or in the additional presence of 5 or 25 E. coli per moDC. HLA I, HLA II, and CD63 were most abundantly present in the 100,000 × g pellet after 24 hours incubation with E. coli, whereas the amount of CD9 did not increase over time ()). These data were collected from 11 independent experiments, in which cells from different donors were used. The high variability between these experiments may be due to donor differences. Additionally, it should be noted that, although only batches of moDC with >90% viability were selected for these experiments (as determined by 7-AAD exclusion, see )), the release of EV from a minor population of dying cells can result in a dramatic increase in background signal for EV release. Indeed, we observed that signals for EV markers increased, most prominently in 10,000 × g pellets but also in 100,000 × g pellets, when moDC preparations with viability scores < 90% were used (data not shown). The majority of EV released by lesser quality moDC may represent apoptotic vesicles, and the high background signals imposed by such apoptotic bodies masked contributions of EV that were released by healthy cells in response to E. coli phagocytosis. It is likely that even in our moDC preparations that were selected for high viability scores, slight variation in the quality of the cell cultures contributed to variation between the 11 replicates. Nonetheless, we found a dose dependent (5 versus 25 E. coli per moDC) and significant increase for CD63, CD81, HLA I, and HLA II in 100,000 × g pellets in response to E. coli + LPS, as compared to LPS alone ()). In contrast, the release of CD9 remained unaffected. This is consistent with the notion that CD9 may be predominantly associated with plasma membrane-derived MV rather than with exosomes [Citation12].
Figure 4. E. coli -induced EV release by moDC.
Expulsion of phagocytosed E. coli by moDC
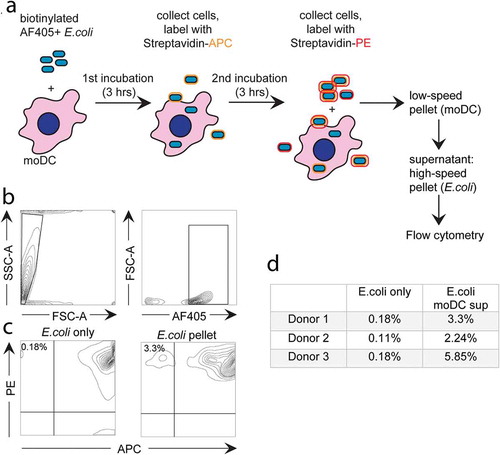
When exosomes can indeed be formed as ILV in phagosomes, their release by secreting phagosomes would imply that phagocytosed E. coli can be secreted back into the extracellular environment. To investigate this possibility, we first used a flow cytometry-based approach (schematic representation in )). First, moDC were incubated for 3 hours with E. coli that were both labelled with AF405 and biotinylated. The moDC were then separated from the majority of non-phagocytosed extracellular E. coli by centrifugation. Those bacteria that were not phagocytosed but co-pelleted with the moDC, either in association with the moDC plasma membrane or as free bacteria, were labelled with streptavidin-APC, leaving truly phagocytosed E. coli unlabelled by the streptavidin conjugate. The moDC were then chased for 3 hours at 37°C allowing expulsion of phagocytosed, APC-negative, E. coli. After cooling, expulsed E. coli were separated from their originating moDC by differential centrifugation, stained with streptavidin-PE, and identified by flow cytometry as AF405+, APC−, PE+ gated events. The AF405+ gating strategy is illustrated for a control E. coli sample that was labelled in the absence of moDC, demonstrating the efficacy of labelling (,), left panels). With this strategy, we detected a small but significant population of E. coli that had been expulsed after being phagocytosed by moDC () right panel, and )). These values reflect the amount of recycled E. coli relative to the amount of E. coli that was not phagocytosed and failed to be removed after pulse loading the moDC. Therefore, although this approach demonstrated that expulsion of phagocytosed bacteria does occur, it did not enable us to quantify the relative amount of phagocytosed E. coli that was expulsed.
Figure 5. Flow cytometry-based analysis of E. coli expulsion by moDC.
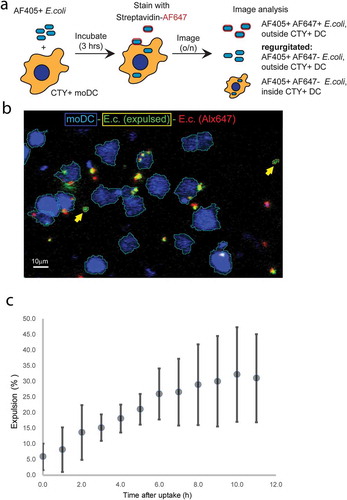
To quantify E. coli expulsion we resorted to live fluorescence microscopy (). Cell Trace Yellow (CTY)-labelled moDC were pulsed for 3 hours with biotinylated AF405-labelled E. coli. Subsequently, the moDC were washed, after which remaining extracellular E. coli were labelled at 4°C with streptavidin-AF647. The moDC were then chased and continuously monitored for 11 hours by live fluorescence microscopy ()). The AF405 signal was used to segment all E. coli objects (AF405+), and CTY fluorescence was used to segment moDC occupied areas in the images (CTY+). AF405-positive E.coli that were also labelled with AF647 (AF405+AF647+) were classified not to be phagocytosed directly after pulse loading. Phagocytosed E. coli were classified as AF405+CTY+AF647− objects. Automated logical gating with different colour-combinations was used to identify and follow individual events during the chase ()). Phagocytosed E. coli were identified to be expulsed when appearing outside CTY-labelled moDC during the 11-hour chase as AF405+CTY−AF647− objects. The percentage of phagocytosed E. coli that was expulsed increased over time, reaching 32.2±15.1% (mean ± SEM from 3 independent experiments) after 11 hours ()).
Figure 6. Confocal microscopy-based dynamic analysis of E. coli expulsion.
Importantly, the rate of expulsion of phagocytosed E. coli correlated with the E. coli stimulated release of EV associated HLA-I, HLA-II, CD81 and CD63, further supporting the idea that exosomes are expulsed by E. coli containing phagosomes that fuse with the plasma membrane.
Discussion
We here demonstrate that up to ~30% of E. coli that were phagocytosed by moDC were expulsed back into the culture medium (), and that phagocytosis by these cells stimulated the release of EV associated markers up to sixfold with comparable kinetics (). The concomitant release of phagocytosed E. coli and small EV, together with the accumulation of HLA II and CD63, well-established exosomal markers, in discrete puncta within the perimeter of E. coli containing phagosomes (), and the association of HLA II and CD63 positive puncta on regurgitated bacteria (), strongly suggests that the released EV were generated as ILV by inward budding into phagosomes, and secreted as exosomes as a consequence of fusion of phagosomes with the plasma membrane. In contrast to CD63 and CD81, the tetraspanin CD9 is thought to be primarily associated with plasma membrane-derived microvesicles (MV) rather than with exosomes [Citation12], and the release of CD9 was indeed not stimulated by E. coli (), consistent with enhanced release of exosomes rather than MV. We were unable to directly visualize secretion of exosomes from phagosomes, as the required live cell technologies are not advanced enough yet. We attempted but failed to detect phagosome-plasma membrane fusion using tetraspanin-based pH-sensitive optical reporters in combination with live total internal reflection fluorescence microscopy, a technique that was recently developed by Verweij and co-workers to demonstrate exosome secretion by MVB [Citation32]. This technique relies on sensing a shift in pH of the environment by the pH sensitive fluorescent probe when expelled from acidic endocytic compartments into a pH neutral extracellular environment. However, acidification of phagosomes in DC is limited by NOX2 [Citation33], and TLR4 engagement restrains phagosome fusion with lysosomes to prevent full antigen degradation and promote cross-presentation [Citation34]. This method thus cannot be applied to monitor the fusion of pH neutral phagosomes with the plasma membrane. Consistent with our observations for moDC, DC protruding into the gastrointestinal epithelium has been shown to secrete apically phagocytosed E. coli at their basolateral side [Citation35]. The concept of non-lytic extrusion of phagosomal content has also been demonstrated for macrophages after phagocytic uptake of Cryptococcus neoformans [Citation21,Citation24], Candida albicans [Citation23], or yeast [Citation22]. Similar to phagosomes, also autophagosomes can secrete their contents. For example, uropathogenic E. coli was demonstrated to be expelled from infected bladder epithelial cells through expulsion of the content of autophagosomes [Citation25]. In the same study, transmission electron microscopic pictures revealed the presence of small vesicles within the autophagosomal lumen, between its delimiting membrane and the autophagocytosed pathogen, consistent with a pre-exosomal identity [Citation25]. Similar to phagosomes in DC, these autophagosomes have a neutral pH, which prevents degradation of their content by lysosomal proteases and stimulates exocytosis via TRP channel 3 (TRPML3), a transient receptor potential cation channel, resulting in expulsion of the bacteria together with associated exosomes [Citation25]. Triggering of TLR4 in these autophagosomes stimulates polyubiquitination of TRAF, which on its turn stimulated RalGDS, a guanine nucleotide exchange factor (GEF), to assemble the exocyst complex [Citation36]. Whether similar mechanisms drive the extrusion of phagosomes by DC or other cell types remains to be established. However, the release of exosomes by gastroendothelial cells was stimulated by infection with the protozoan parasite Cryptosporidium parvum, in a process involving TLR4/IKK2 signalling and a SNAP23-dependent exocytosis [Citation18]. Interestingly, the secretion of exosomes by MVB also relies on the plasma membrane SNARE SNAP23 [Citation32], suggesting parallel mechanisms of exosome secretion by MVB and phagosomes.
DC-derived EV are capable of inducing T-cell responses, through presentation of antigenic peptides on MHC molecules [Citation2,Citation4,Citation5,Citation10,Citation11,Citation17,Citation37,Citation38]. We recently demonstrated that non-cognate interactions between DC and bystander T-cells modulates third party antigen-specific T-cell responses via EV, possibly also involving EV mediated transfer of miR-155 [Citation17]. The microRNA miR-155 is a critical regulator of adaptive immune responses [Citation39], exemplifying a mechanism of how antigen presentation via intercellular transfer of EV may promote adaptive immunity.
Our current finding that exosomes can be generated in and secreted by phagosomes adds a new perspective of how exosomes may contribute in antigen presentation. HLA II molecules in pathogen loaded phagosomes can be expected to be preferentially loaded with pathogen-derived peptides, as compared to HLA II molecules residing in the hundreds or even thousands of other compartments composing the endocytic pathway within a single cell. As a consequence, HLA II molecules that are on exosomes that are generated as ILV in phagosomes can be expected to be preferentially loaded with pathogen derived peptides. In contrast, HLA II molecules that are on the plasma membrane are preferentially loaded with self-peptides as they are mostly recruited from all other, pathogen lacking, endocytic compartments. Hypothetically, the peptidome that is presented by HLA II molecules from isolated exosomes versus plasma membrane could be determined by mass spectrometry [Citation40,Citation41]. However, this is technically challenging, if not impossible at this time, given the limitations for obtaining sufficient quantities of exosomes from human moDC as source for peptide HLA II complexes. Moreover, separation of exosomes from plasma membranes is complicated by the fact that many EV are associated with the plasma membrane of their originating cell, either by tetherin [Citation42] or after being recruited via integrin binding [Citation43]. Further optimization of the separation of exosomes and plasma membranes, as well as of the isolation of peptide-MHC complexes from exosomes and the sensitivity of MS techniques, may enable such experiments in the future.
In conclusion, we hypothesize that HLA II molecules on exosomes that are secreted by phagosomes are preferentially loaded with pathogen-derived peptides, and thus excellently suited to stimulate adaptive immune responses. Importantly, T-cell receptors undergo dimerization before activation and this property might be essential for T-cell activation [Citation44]. Consistent with this idea, it has been proposed that dimerization of MHC II molecules might be critical for TCR dimerization and T-cell activation [Citation45,Citation46]. However, given that less than 0.1% of all MHC II molecules on antigen loaded DC are loaded with a TCR-specific peptide [Citation47], the probability that two identical peptide–MHC complexes reside in the same microdomain at the plasma membrane is neglectable. Preferential loading of pathogen derived peptides onto exosome associated MHC II in phagosomes may solve that problem, as this would both increase the density and force proximity of such pathogen peptide-MHC II complexes. This scenario could apply to DC exosomes that after secretion remain associated to the plasma membrane of their producing cell as well as to secreted exosomes that are recruited by bystander antigen presenting cells, resulting in rapid dissemination of the immune response.
Supplemental Material
Download Zip (9.6 MB)Disclosure statement
The authors report no conflict of interest.
Supplementary material
Supplemental data for this article can be accessed here.
Additional information
Funding
References
- Savina A, Amigorena S. Phagocytosis and antigen presentation in dendritic cells. Immunol Rev. 2007;219:143–14.
- Zitvogel L, Regnault A, Lozier A, et al. Eradication of established murine tumors using a novel cell-free vaccine: dendritic cell-derived exosomes. Nat Med. 1998;4:594–600.
- Théry C, Ostrowski M, Segura E. Membrane vesicles as conveyors of immune responses. Nat Rev Immunol. 2009;9:581–593.
- Lindenbergh MFS, Stoorvogel W. Antigen presentation by extracellular vesicles from professional antigen-presenting cells. Annu Rev Immunol. 2018;36:435–459.
- Théry C, Duban L, Segura E, et al. Indirect activation of naïve CD4+T cells by dendritic cell-derived exosomes. Nat Immunol. 2002;3:1156–1162.
- Andre F, Chaput N, Schartz NEC, et al. Exosomes as potent cell-free peptide-based vaccine. I. dendritic cell-derived exosomes transfer functional MHC class I/peptide complexes to dendritic cells. J Immunol. 2004;172:2126–2136.
- Naslund TI, Gehrmann U, Qazi KR, et al. Dendritic cell-derived exosomes need to activate both T- and B-cells to induce antitumor immunity. J Immunol. 2013;190:2712–2719.
- Tkach M, Kowal J, Théry C. Why the need and how to approach the functional diversity of extracellular vesicles. Philos Trans R Soc B Biol Sci. 2018 Jan 5;373(1737):20160479.
- Wahlund CJE, Güclüler G, Hiltbrunner S, et al. Exosomes from antigen-pulsed dendritic cells induce stronger antigen-specific immune responses than microvesicles in vivo. Sci Rep. 2017;7:1–9.
- Tkach M, Kowal J, Zucchetti AE, et al. Qualitative differences in T‐cell activation by dendritic cell‐derived extracellular vesicle subtypes. Embo J. 2017;36:3012–3028.
- Segura E, Amigorena S, Théry C. Mature dendritic cells secrete exosomes with strong ability to induce antigen-specific effector immune responses. Blood Cells Mol Dis. 2005;35:89–93.
- Kowal J, Arras G, Colombo M, et al. Proteomic comparison defines novel markers to characterize heterogeneous populations of extracellular vesicle subtypes. Proc Natl Acad Sci. 2016;113:E968–E977.
- Damo M, Wilson DS, Simeoni E, et al. TLR-3 stimulation improves anti-tumor immunity elicited by dendritic cell exosome-based vaccines in a murine model of melanoma. Sci Rep. 2015;5:1–15.
- Aline F, Bout D, Amigorena S, et al. Toxoplasma gondii antigen-pulsed-dendritic cell-derived exosomes induce a protective immune response against T. gondii Infection. Infect Immun. 2004;72:4127–4137.
- Beauvillain C, Ruiz S, Guiton R, et al. A vaccine based on exosomes secreted by a dendritic cell line confers protection against T. gondii infection in syngeneic and allogeneic mice. Microbes Infect. 2007;9:1614–1622.
- Buschow SI, Nolte-‘t Hoen ENM, van Niel G, et al. MHC II In dendritic cells is targeted to lysosomes or T cell-induced exosomes via distinct multivesicular body pathways. Traffic. 2009;10:1528–1542.
- Lindenbergh MFS, Koerhuis DGJ, Borg EGF. Bystander T-cells support clonal T-cell activation by controlling the release of dendritic cell-derived immune-stimulatory extracellular vesicles. Front Immunol. 2019;10:1–11.
- Hu G, Gong A-Y, Roth AL, et al. Release of luminal exosomes contributes to TLR4-mediated epithelial antimicrobial defense. PLoS Pathog. 2013;9:e1003261.
- Qu C, Nguyen VA, Merad M, et al. MHC class I/peptide transfer between dendritic cells overcomes poor cross-presentation by monocyte-derived APCs that engulf dying cells. J Immunol. 2009;182:3650–3659.
- Ramachandra L, Qu Y, Wang Y, et al. Mycobacterium tuberculosis synergizes with ATP to induce release of microvesicles and exosomes containing major histocompatibility complex class II molecules capable of antigen presentation. Infect Immun. 2010;78:5116–5125.
- Alvarez M, Casadevall A. Phagosome extrusion and host-cell survival after cryptococcus neoformans phagocytosis by macrophages. Curr Biol. 2006;16:2161–2165.
- Ma H, Croudace JE, Lammas DA, et al. Expulsion of live pathogenic yeast by macrophages. Curr Biol. 2006;16:2156–2160.
- Bain JM, Lewis LE, Okai B, et al. Non-lytic expulsion/exocytosis of Candida albicans from macrophages. Fungal Genet Biol. 2012;49:677–678.
- Johnston SA, May RC. The human fungal pathogen Cryptococcus neoformans escapes macrophages by a phagosome emptying mechanism that is inhibited by arp2/3 complex- mediated actin polymerisation. PLoS Pathog. 2010;6:27–28.
- Miao Y, Li G, Zhang X, et al. A TRP channel senses lysosome neutralization by pathogens to trigger their expulsion. Cell. 2015;161:1306–1319.
- Sallusto BF, Lanzavecchia A. Efficient presentation of soluble antigen by cultured human dendritic cells is maintained by granulocyte/macrophage colony-stimulating factor plus iuterleukin 4 and downregulated by tumor necrosis factor a. J Exp Med. 1994;179:1109–1118.
- Raposo G, Nijman HW, Stoorvogel W. B lymphocytes secrete antigen-presenting vesicles. J Exp Med. 1996;183:1161–1172.
- Latysheva N, Muratov G, Rajesh S, et al. Syntenin-1 is a new component of tetraspanin-enriched microdomains: mechanisms and consequences of the interaction of syntenin-1 with CD63. Mol Cell Biol. 2006;26:7707–7718.
- Hurwitz SN, Nkosi D, Conlon MM, et al. CD63 regulates epstein-barr virus LMP1 exosomal packaging, enhancement of vesicle production, and noncanonical NF-kB signaling. J Virol. 2017;91:1–19.
- Théry C, Regnault A, Garin J, et al. Molecular characterization of dendritic cell-derived exosomes: selective accumulation of the heat shock protein hsc73. J Cell Biol. 1999;147:599–610.
- Nolte-’t Hoen ENM, Buschow SI, Anderton SM, et al. Activated T cells recruit exosomes secreted by dendritic cells via LFA-1. Blood. 2009;113:1977–1981.
- Verweij FJ, Bebelman MP, Jimenez CR, et al. Quantifying exosome secretion from single cells reveals a modulatory role for GPCR signaling. J Cell Biol. 2018;217:1129–1142.
- Savina A, Jancic C, Hugues S, et al. NOX2 controls phagosomal pH to regulate antigen processing during crosspresentation by dendritic cells. Cell. 2006;126:205–218.
- Alloatti A, Kotsias F, Pauwels A-M, et al. Toll-like receptor 4 engagement on dendritic cells restrains phago-lysosome fusion and promotes cross-presentation of antigens. Immunity. 2015;43:1087–1100.
- Rescigno M, Urbano M, Valzasina B, et al. Dendritic cells express tight junction proteins and penetrate gut epithelial monolayers to sample bacteria. Nat Immunol. 2001;2:361–367.
- Miao Y, Wu J, Abraham SN. Ubiquitination of Innate immune regulator TRAF3 orchestrates expulsion of intracellular bacteria by exocyst complex. Immunity. 2016;45:94–105.
- Morelli AE, Larregina AT, Shufesky WJ, et al. Endocytosis, intracellular sorting, and processing of exosomes by dendritic cells. Blood. 2004;104:3257–3266.
- Smith VL, Cheng Y, Bryant BR, et al. Exosomes function in antigen presentation during an in vivo Mycobacterium tuberculosis infection. Sci Rep. 2017;7:1–12.
- Rodriguez A, Vigorito E, Clare S, et al. Requirement of bic/microRNA-155 for normal immune function. Science. 2007;981:608–611.
- Caron E, Kowalewski DJ, Chiek Koh C, et al. Analysis of Major Histocompatibility Complex (MHC) immunopeptidomes using mass spectrometry. Mol Cell Proteomics. 2015;14:3105–3117.
- Mommen GPM, Marino F, Meiring HD, et al. Sampling from the proteome to the human leukocyte antigen-DR (HLA-DR) ligandome proceeds via high specificity. Mol Cell Proteomics. 2016;15:1412–1423.
- Edgar JR, Manna PT, Nishimura S, et al. Tetherin is an exosomal tether. Elife. 2016;5:1–19.
- Segura E, Guerin C, Hogg N, et al. CD8+ dendritic cells use LFA-1 to capture MHC-peptide complexes from exosomes in vivo. J Immunol. 2007;179:1489–1496.
- Bachmann MF, Ohashi PS. The role of T-cell receptor dimerization in T-cell activation. Immunol Today. 1999;20:568–575.
- Brown JH, Jardetzky TS, Gorga JC, et al. Three-dimensional structure of the human class II histocompatibility antigen LA-DR1. Nature. 1993;364:33–39.
- Schafer PH, Pierce SK. Evidence for dimers of MHC class II molecules in B lymphocytes and their role in low affinity T cell responses. Immunity. 1994;1:699–707.
- Harding CV, Unanue ER. Quantitation of antigen- presenting cell MHC class II/peptide complexes necessary for T-cell stimulation. Nature. 1990;346:574–576.