
ABSTRACT
Substantial research has been devoted to discovering the translational potential of extracellular vesicles (EV) as a reliable liquid biopsy in the diagnosis and monitoring of several life-affecting diseases, including chronic inflammatory diseases (CID). So far, the role of EV in the development of CID remains largely unknown due to the lack of specific tools to separate the disease-associated EV subtypes. Therefore, this study aims to fractionate inflammation-associated EV (sub)populations using a two-step separation strategy based on their size combined with a specific inflammatory marker (ICAM-1) and to unravel their proteome signature and functional integrity at the onset of vascular inflammation.
Here, we report that vascular endothelial cells upon inflammation release two heterogeneous size-based populations of EV (EV-10 K and EV-110 K) sharing a cocktail of inflammatory proteins, chemokines, and cytokines (chiefly: ICAM-1, CCL-2, CCL-4, CCL-5, IL-8 and CXCL-10). The co-enrichment of ICAM-1 and classical EV markers within these two size-based populations gave us a promising opportunity to further separate the inflammation-associated EV subpopulations, using an immuno-affinity methodology. Protein profiling of EV subpopulations highlighted that the phenotypic state of inflamed endothelial cells is preferentially mirrored in secreted medium- and large-sized ICAM-1 (+) EV. As functional players, the smaller-sized EV and especially their ICAM-1 (+) EV subpopulation promote the migration of THP-1 monocytes, whereas the large ICAM-1 (+) EV were more potent to induce ICAM-1 expression in recipient endothelial cells. This study provides new insights into the immunomodulatory content of inflammation-associated EV (sub)populations and their functional contributions to the initiation of vascular inflammation (ICAM-1 expression) and monocyte mobilization.
Introduction
Inflammation is traditionally defined as the body’s natural response to harmful stimuli [Citation1]. However, a prolonged and pervasive state of inflammation can cause irreversible cell injury and tissue destruction that eventually leads to the development of chronic inflammatory diseases (CID) [Citation2]. Worldwide, nearly 60% of deaths is due to a CID such as stroke, atherosclerosis, cancer, chronic respiratory diseases, arthritis, obesity, diabetes and autoimmune diseases [Citation2,Citation3]. Insights into the mechanistic aspects of molecular signalling networks between cellular contributors and effectors in inflammation are still evolving. In the mid-1960s, Peter Wolf revolutionized the understanding of intercellular communication by introducing for the first time tiny entities, extracellular vesicles (EV), as cell free-signalling conveyers [Citation4]. EV are submicron-sized membranous biological vesicles that are involved in the exchange of a wide range of functional biomolecules (lipid, protein, mRNA and miRNA) between cells [Citation5,Citation6]. Several studies now appreciate that the cargo of EV is a mirror of the physiological condition of the cell of origin and is tightly linked to the stage of chronic diseases [Citation7].
In recent decades, substantial experimental and clinical studies have acknowledged the translational potential of EV as a reliable liquid biopsy for the diagnosis and monitoring of life-affecting diseases including CID [Citation8]. EV-based diagnostic platforms are now in an exciting transition phase to be applied clinically. Still, there is a long-standing gap between initial EV biomarker discovery towards clinical translation due to the challenges in the purification of disease-associated EV subpopulations [Citation9]. So far, EV populations have been intensively purified based on (i) their size/site of cellular origin, as exosomes (30–100 nm), microvesicles (100 nm–1 μm) and apoptotic bodies (>1 μm); (ii) their density gradient or (iii) their tetraspanin surface markers [Citation5,Citation10,Citation11]. Recently, the International Society for Extracellular Vesicles (ISEV) has indeed highlighted that EV subpopulations may be partially separated based on their physicochemical properties. In addition, specific tools for the isolation of disease-associated EV (sub)populations are missing in the field [Citation12]. Most likely, there are additional EV subpopulations present in both size- or density-based separated EV fractions that are functionally more related to a certain disease [Citation13]. The purity, and hence the functionality of EV subpopulations are still under debate [Citation12,Citation14]. Therefore, purifying disease-associated EV (sub)populations and the subsequent profiling of their specific biomarkers are the two key challenges in developing EV diagnostic platforms.
Our previous research demonstrated that inflamed vascular endothelial cells release EV that carry pro-inflammatory markers, particularly the Intercellular Adhesion Molecule-1 (ICAM‐1), on their surface [Citation15,Citation16]. At the onset of vascular inflammation, ICAM-1 is known to play a significant role in the firm adhesion and recruitment of circulating immune cells into the intima and in the activation of pro-inflammatory signalling cascades, contributing to the progression of several inflammatory-associated diseases [Citation17,Citation18]. In vitro and in vivo, a multitude of both inflamed and healthy cells are constitutively releasing EV, resulting in a heterogeneous mixture of EV and hence hampering disease-relevant information and any downstream diagnostic analysis. Therefore, the overall aim of this study was to fractionate inflammation-associated EV (sub)populations using a two-step approach based on their size and the specific surface marker (ICAM-1) and to unravel the proteome content and functional integrity of the isolated EV (sub)sets at the onset of inflammation.
In the present study, we first performed a size selection resulting in two populations of EV based on the sedimentation speed at low (10,000 × g; EV-10 K) and ultracentrifugal force (110,000 × g; EV-110 K). Next, the inflammation-associated EVsubpopulations were further separated from both EV-10 K and EV-110 K fractions using an immune-affinity isolation procedure for ICAM-1. To obtain a reliable molecular profile of EV in line with the MISEV 2018 guidelines, a series of quality control experiments was performed on the inflammation-associated EV (sub)populations released from TNF-α treated human vascular endothelial cells (HUVEC). First, EV morphology, size distribution profile and produced quantities were analysed using transmission electron microscopy (TEM) and nanoparticle tracking analysis (NTA), respectively. Then, to confirm the purity of the EV fractions, a quality control analysis of classical EV markers (CD9 and CD63), an EV cytosolic marker (Annexin II) and BAX (a pro-apoptotic marker as the negative control) was performed on the EV (sub)sets using western blotting assays. Depletion and enrichment of inflammatory EV (sub)populations were assessed using an ELISA for ICAM-1. Based on our results, size-based EV populations released from TNF-α–triggered vascular endothelial cells contain inflammatory markers particularly a set of chemoattractant cytokines, interleukins and endothelial cell adhesion molecules (ICAM-1). This study provides evidence that the physiological state of the inflamed endothelial cells is more mirrored in the medium and large-sized EV (EV-10 K) and more specifically into their ICAM-1 (+) EV subpopulations as compared to the small-sized EV (EV-110 K). At the onset of inflammation, the small-sized EV population and especially their ICAM-1 (+) EV subpopulation, can promote migration of immune cells (monocytes), whereas the larger EV are capable of stimulating ICAM-1 expression in recipient endothelial cells. Altogether, the presence of ICAM-1 in the majority of EV released from inflamed endothelial cells suggests that this protein can be used as a potential discriminatory biomarker to purify inflammation-associated EV from non-inflammatory EV and also from protein impurities that may co-precipitate during ultracentrifugation. In addition, the integration of the proposed two-step approach (size and surface marker) in the purification of EV may help to improve the efficacy of downstream cargo analysis.
Materials and methods
Antibodies and reagents
The following primary antibodies were used: mouse monoclonal anti-human ICAM-1 (clone 15.2, sc-107, Santa Cruz Biotechnology), Annexin II (clone C-10, sc-28385, Santa Cruz Biotechnology), CD63 (clone Ts63, Thermo Fisher), CD9 (clone Ts9, Life Technologies) and rabbit anti-BAX antibody (clone E63, ab32503, Abcam). Polyclonal rabbit anti-mouse HRP-conjugated antibody (DAKO), polyclonal goat anti-rabbit HRP-conjugated antibody (DAKO), donkey anti-mouse IgG, Alexa Fluor® 488 – antibody (clone A-21,202, Thermo Fisher) and Alexa Fluor® 488 anti-human ICAM-1 (clone 15.2, sc-107, AF488, Santa Cruz Biotechnology) were used as secondary antibodies.
Cell culture and treatment
HUVEC (BD Bioscience, cat # 354,151) at passage 3–5 were grown in EBM-2 (Lonza) supplemented with EGM-2 MV SingleQuot Kit (Lonza; except the SingleQuot Kit foetal bovine serum) and 5% exosome-depleted foetal bovine serum (EXO-FBS-250A-1, System Bioscience) up to 70–75% confluency to minimize apoptosis. Confluent cells were rinsed twice with PBS (Lonza) and TNF-α (ImmunoTools, cat: 11,343,015)–based inflammation induction in cells was then performed at a final concentration of 10 ng/mL in a refreshed medium for 24 h [Citation19]. Cells were incubated in a humidified atmosphere condition of 5% CO2/95% O2 at 37°C and routinely checked to be free of mycoplasma contamination.
Isolation of size-based EV populations
Sized-based fractionation of small, medium and large EV was performed by differential (ultra)centrifugation method from 15 mL of cell culture supernatant. To prevent the induction of apoptosis in cells and the presence of apoptotic bodies in EV preparation steps, cell culture supernatants were collected after 24h from approximately 1.8- 2 × 10⁶ cells/mL (from ~ 70-75% confluency) with ~98 % viability. Briefly, all conditioned media were collected and spun at 300 × g for 10 min at 4°C to remove cell debris. A second centrifugation step was done for 10 min at 2000 × g at 4°C, to eliminate remaining debris and apoptotic bodies. Afterwards, supernatants were transferred to new tubes and centrifuged in an S-4-72 fixed angle rotor (Eppendorf- VWR) at 10,000 × g for 30 min at 4°C to obtain the EV-10 K pellet. To pellet, the smaller-sized EV (EV-110 K), the supernatant of 10 K-free media was ultracentrifuged in a Ti-70 rotor (L-90 Beckman centrifuge, Fullerton, CA, USA) at 110,000 × g for 3 h at 4°C. Depending on the downstream analysis, pellets were suspended in either 1 mL of exosome-depleted medium, PBS (Lonza), RIPA (ab156034, Abcam) or extraction buffers (ab193970, Abcam) and stored at – 80°C.
EV depletion and enrichment using exosome isolation Pan kit
The CD9, CD63, CD81 enriched and depleted subpopulations (CDs (+) and CDs (-) EV, respectively) were fractionated from EV-10 K and EV-110 K using the commercially available Exosome Isolation Pan kit (cat: 130–10-912, MACS, Miltenyi Biotech, Germany) according to the supplier’s instructions.
Isolation of inflammation-associated EV subpopulations
ICAM-1(+) EV were enriched from EV-10 K and EV-110 K using an immuno-affinity-based procedure. Anti-ICAM-1 antibodies were coupled on “Dynabeads® MyOne™ Carboxylic Acid” (Thermo Fisher Scientific, Norway) according to the standard amine covalent coupling procedures. Briefly, surface carboxyl groups were activated using 1-ethyl-3-(3-dimethylaminopropyl) carbodiimide hydrochloride (EDC) (1.25 M) in 15 mM MES (pH 6.0) for 30 min at RT. A total of 400 µg of ICAM-1 mouse monoclonal antibodies was incubated with 1 mL activated beads overnight at 4°C. The residual-activated carboxyl groups were then quenched with 1 M ethanolamine, pH 8.5 for 1 h. For preservation, anti-ICAM-1-antibody-coated beads were kept in PBS containing 0.1% Tween-20 and 0.1% BSA at 4°C. For isolation of inflammation-associated EV (ICAM-1 (+)) subpopulation, 50 µL of prepared beads was first washed three times with PBS and then incubated with 1 mL EV-10 K or EV-110 K for 4 h at RT while gently rotating. The remaining ICAM-1 (-) EV were separated from the anti-ICAM-1-antibody-coated beads by a side-pull magnetic system (DynaMag2, Invitrogen).
Nanoparticle tracking analysis (NTA)
EV size and concentration profiles were determined using the NanoSight NS300 system (Malvern Ltd, Sysmex Belgium N.V.) equipped with a 532 nm laser. EV suspensions were diluted with PBS over a range of concentrations to obtain between 10 and 100 particles per frame. Samples were injected into the sample chamber and measured five times for 60 s with a syringe pump speed of 80 and camera level and thresholds were adjusted for the individual samples. Acquisitions were captured and analysed using NTA software 3.2 (NanoSight. Malvern Ltd). EV concentration was reported as particles/mL and EV size in mean values.
Transmission electron microscopy (TEM)
Five microlitres of the EV sample solution in 2% glutaraldehyde was placed on Formvar–copper-coated EM grids (Polyscience, Inc, Warrington, PA). Air-dried samples were washed twice with distilled H2O. Grids were negatively contrasted with 2% uranyl acetate (Sigma-Aldrich, USA) for 10 min. Two grids for each EV (sub)population were prepared from two independent EV isolation procedures (n = 2). Images (n ≥ 4) from each grid were captured using a Tecnai G2 transmission electron microscope (TEM; Tecnai G2 spirit twin, FEI, Eindhoven, the Netherlands) at 120 kV and analysed with FEI imaging software (TEM Imaging & Analysis version 3.2 SP4 build 419).
Total protein quantification
The total protein content of EV and EV lysates was determined using the micro Pierce BCA Protein Assay Reagent Kit (Thermo Scientific Pierce, Rockford, IL, USA) following the manufacturer’s specifications. Optical densities of standards and samples were read at OD595 nm using an iMark Microplate Absorbance Reader (Bio-Rad, Temse, Belgium).
SDS-PAGE and western blot analysis
Western blotting for classical EV markers (CD63 and CD9), a cytosolic EV maker (Annexin II) and an inflammation-associated marker (ICAM-1) was performed in non-reducing conditions. BAX (a pro-apoptotic marker), used as a quality control for EV, was blotted under reducing conditions. Briefly, EV and cell pellets were lysed in RIPA buffer (Abcam) supplemented with a proteinase inhibitor cocktail (Roche, Germany) and preheated at 95°C for 5 min. One microgram total protein of lysates (EV and cells) was loaded and separated by SDS-PAGE in 12% polyacrylamide gels at 150 V for 60 minutes and transferred onto a polyvinylidene fluoride membrane (Immobilon R, Merck Millipore Ltd) for a minimum of 1 h at 20 V. The membranes were blocked with 5% w/v fat-free milk powder (Marvel) in PBS for 2 h, and then the membranes were incubated with 1:500 dilution of primary antibody in 5% w/v fat-free milk powder (Marvel) overnight at 4°C. Next, a polyclonal rabbit anti-mouse HRP-conjugated (P0260, Dako, Denmark) or goat anti-rabbit HRP-conjugated (Dako, Denmark) in 5% w/v fat-free milk powder (Marvel) at a 1:1000 dilution was added to the membrane as secondary antibody and was incubated for 1 h at room temperature. The blots were developed using a western blotting detection kit (WesternBrightTM, Sirius, USA, K-12,043-D10) and were imaged using the ImagerQuant™TL (Amersham Imager 680, GE Healthcare) detection system.
ELISA
Quantification of ICAM-1 (ab100640, Abcam), inflammatory cytokines [IL-6 (ab46027), IL-8 (ab46032), CCL-2 (MCP1, ab179886)], chemokines [CCL-4 (MIP1β, ab100597), CCL-5 (RANTES, ab174446) and CXCL-10 (IP10, ab83700)] was performed on both intact EV or EV lysates in an extraction buffer (Abcam) using the indicated human ELISA kits, according to the respective manufacturer’s instructions. Cell-free medium-derived EV (cEV) and naked magnetic beads incubated with EV served as negative controls.
Inflammatory cytokine arrays
The expression of 40 inflammatory markers in EV lysates in extraction buffer (Abcam) was analysed using the human inflammation antibody C3 arrays (C-Series – AAH-INF-3 – RayBiotech Norcross-GA) as described previously [Citation15]. Briefly, 5 µg of total EV proteins in extraction buffer (Abcam) was added to a pre-blocked membrane and incubated overnight at 4°C with gentle shaking. Afterwards, the membrane was incubated with the primary biotin-conjugated antibody for 2 h, followed by incubation with HRP-conjugated streptavidin antibodies for 1 h at room temperature. Finally, the signal intensity of each array was scanned and quantified by densitometry using the ImageQuant™TL detection system.
High-resolution immunofluorescence imaging of CDs (+) EV fraction
Ten microlitres of CDs (+) magnetically labelled EV fractions from two independent isolation procedures (n = 2) were fixed with 4% formaldehyde in PBS for 10 min, then they were magnetically collected and washed twice in PBS. To visualize the presence of ICAM-1 in the CDs (+) EV, samples were diluted in 1 mL PBS and incubated with ICAM-1 anti-mouse Alexa 488 (1:500) overnight at room temperature. Three hundred microlitres of magnetic beads bearing EV were then mounted onto a #1 circular cover glass. At least four images (n ≥ 4) were taken for each biological sample using a Zeiss LSM 880 confocal laser scanning microscope (Jena, Germany) on an Axiovert 200 M motorized frame. The microscope was coupled to a 30-mW, air-cooled argon-ion laser emitting at 488 nm under the control of an acousto-optic modulator (~11 μW irradiance at the sample position) for one-photon excitation. EV-depleted cell culture supernatant (sEV (-)) incubated with CDs decorated magnetic beads and served as a negative control.
Analysis of ICAM-1 expression in recipient cells
To verify whether EV (sub)populations can induce inflammation in vascular endothelial cells, the expression of ICAM-1 as a hallmark of inflammation was quantitatively measured. HUVEC were first grown in 6-well plates up to 70 − 75% confluency (greiner Bio-One, Belgium). Then, confluent monolayer cells were washed and stimulated with three different concentrations of size-based EV subpopulations (6.6 E07, 3.3 E08 and1 E09 particles/mL), as well as with two concentrations of their respective ICAM-1 and CDs depleted EV fractions (6.6 E07 and 3.3 E08 particles/mL) for 24 h. Cells treated with 10 ng/mL TNF-α (ImmunoTools) served as a positive control and cells treated with PBS or EV-depleted cell culture supernatant (sEV (-)) in 1:15, 1:3 and 1:1 ratio reflecting equally sized volumes of the 6.5 E07, 3.3 E08 and 1E09 concentrations of EV (sub)populations were used as negative controls. After treatment, ICAM-1 concentration in collected HUVEC in extraction buffer (ab193970, Abcam) was determined using ELISA for ICAM-1 (ab100640, Abcam), as described above.
Transwell THP-1 migration assay
THP-1 were grown in RPMI-1640 (Thermo Fisher) medium supplemented with 5% vesicles-depleted foetal bovine serum (System Bioscience) and 1% Penicillin-Streptomycin-Amphotericin B (Lonza). The migration capacity of THP1 was determined using 8 μm pore polycarbonate filter transwell plates (HTS Transwell 96 well-permeable support, CORNING, USA). Briefly, the top of the transwell insert was seeded with 50 μL pre-starved THP1 in serum-free RPMI1640 medium (1 × 10⁶ cells/mL) and the lower chamber was filled with 100 μL serum-free RPMI1640 medium supplemented with either 0% FBS (negative control), a serial dilution of EV samples or 50 ng/mL recombinant human MCP1 (PeproTECH, Rocky Hill, CT, USA) as a positive control. For the EV samples, a serial dilution of size-based EV population (6.25 E07, 1.25 E08, 2.5 E08, 5E08 and 1 E09 particles/mL) or 2.5 E08 particles/mL of the immuno-depleted fractions in RPMI1640 medium supplemented with 0% FBS was placed directly into the lower chamber. Again the equally sized volumes of EV-depleted cell culture supernatant (sEV (-)) were used as a control. The number of cells that passed through the membrane was counted in the lower chambers using trypan blue 0.4% (Thermo Fisher Scientific) after overnight incubation (~16 h) at 37°C. The percentage of migrated cells was calculated for each condition in three independent experiments with three technical replicates (n = 3).
Protein array analysis
Venn diagrams and heat maps of inflammation-related protein expression were constructed and analysed using an online tool provided by Ghent University (http://bioinformatics.psb.ugent.be/webtools/Venn/) and GENE-E open-source software, respectively.
Statistical analysis
All quantitative data are presented as mean ± standard deviation (SD) of at least two (n = 2) or three (n = 3) independent biological experiments. Each data point in the figures represents the mean of two or three technical replicates for each biological independent experiment. The statistical significance was measured using either one-way analysis of variance (ANOVA) for comparison of multiple groups with a control group (Dunnett’s test) (),,, and Supplementary Figure 5) or Tukey’s test for comparison between groups (),,,,, and Supplementary Figure 1A–D and Supplementary Figure 4C and D) using the statistical package, GraphPad Prism 8.04 software (GraphPad Softward Inc., La Jolla, CA, USA). The p-values <0.05 were considered statistically significant. No significant differences with p > 0.05 are represented as n.s.
Figure 1. Characterization of size-based populations of EV released by TNF-α treated HUVEC. (a) Histograms of particle size distribution and concentration of EV fractionated based on their size at low (10,000 × g = EV-10 K) and ultracentrifugal force (110,000 × g = EV-110 K) and a mixture of EV-10 K + EV-110 K using NTA. (b) The percentage of size-based EV populations in the size range of small EV (0–100 nm), medium EV (100–200 nm) and large EV (>200 nm). Data were obtained from six independent biological experiments (n = 6). (c) Western blot analysis of the classical EV membrane-bound marker (CD9 ~ 24 kDa and CD63 ~ 30–70 kDa), the cytosolic EV maker (Annexin II~ 37 kDa), the inflammatory-associated marker (ICAM-1 ~ 90 kDa) and pro-apoptotic -associated protein (BAX~ 25 kDa) as a negative control in EV-10 K, EV-110 K, EV-10 K + EV-110 K and TNF-α treated HUVEC treated for 24 h and 72 h. The same trends were detected in western blot data of at least three independent samples (n = 3). (d) Representative TEM image of negatively stained EV-10 K, EV-110 K and EV-10 K + EV-110 K (scale bar: 200 nm and 100 nm). (e) Each data point represents the amount of ICAM-1 per 1 E 09 particle of at least three independent biological experiments (n = 3; in the case of EV10K: n = 6) of the size-based EV populations. Values are given as mean ± SD. p values of p < 0.05 are considered as statistically significant as determined by ANOVA (Tukey’s test). The expression level of ICAM-1 was measured by ELISA (data presented in ) and normalized to 1 E09 particles/mL of EV based on their corresponding concentration (data presented in Supplementary Figure 1A). (f–g) The inflammatory proteome of the size-based EV populations in comparison with their corresponding parental cells (TNF-α treated HUVEC). (F) Venn diagram display the overlap of expressed inflammatory effectors in the EV of different sizes and TNF-α– treated HUVEC. (g) Heat map and hierarchical clustering of the inflammatory protein intensities (rows) in size-based fractionated EV, untreated HUVEC and TNF-α–treated HUVEC (columns) using the Euclidean distance metric and a complete linkage method. The colours of the heat map indicate the highly expressed (red) and the basal expression levels (green). Euclidean distance represents the close neighbours to the selected column (TNF-α– treated HUVEC) according to their overall similarity.
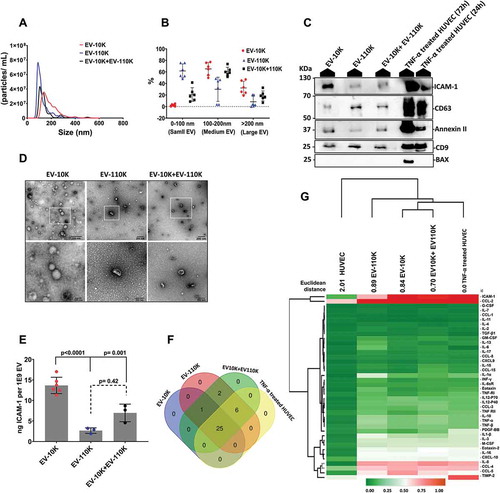
Figure 2. The CD9, CD61, CD81 positive EV subpopulation fractionated from size-based EV population carry an inflammation-associated marker (ICAM-1). (a) Immunocaptured EV on the surface of tetraspanin proteins (cocktail of CD9, CD61 and CD81) coated magnetic beads were fluorescently stained against ICAM-1 (green) and visualized by confocal microscopy at 20X magnitude and the EV- depleted cell culture supernatant (sEV (-)) was applied as a negative control. The right panels show the enlarged area of magnetic beads covered with the green fluorescent signal of the anti-ICAM-1-Alexa488. (b) NTA analysis of size-based EV fractions (EV-10 K, EV-110 K and EV-10 K+ EV-110 K) and their corresponding EV-depleted fractions (CDs (-)). (c) EV enriched and depleted fraction were subjected to SDS-PAGE and qualified using Western blot against the classical EV membrane-bound marker (CD9 ~ 24 kDa and CD63 ~ 30–70 kDa), the cytosolic EV maker (Annexin II ~37 kDa) and the inflammatory-associated marker (ICAM-1 ~ 90 kDa). The ICAM-1 distribution in size-based EV population (EV −10 K, EV-110 K and EV-10 K+ EV-110 K) and their corresponding EV-depleted and -enriched fractions was analysed using (C) Western blot and (d) ELISA. For data of ELISA, values are given as mean ± SD of at least three independent experiments (n = 3, in the case of EV10K; n = 6). p < 0.05 is considered as statistically significant as determined by ANOVA (Dunnett’s test) for comparison between depleted and enriched groups with their control group (EV10K, EV-110 K and EV10K+EV110 K) and ANOVA (Tukey’s test) for comparison between multiple groups (EV10K, EV-110 K and EV10K+EV110 K).
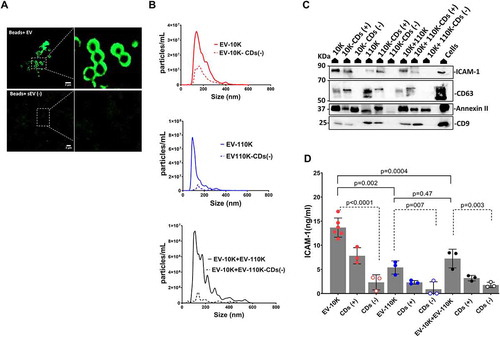
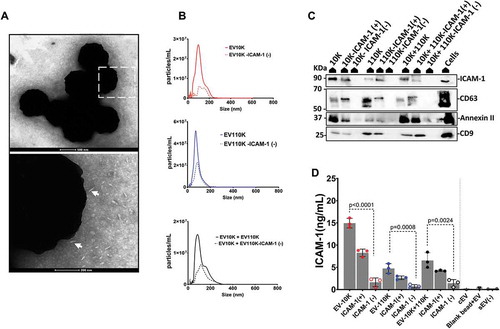
Figure 3. Immuno- affinity enrichment and depletion of inflammation-associated EV from all size- based EV fractions using magnetic microbeads coated with antibodies against ICAM-1. (a) TEM image of negatively stained EV captured on the surface of microbeads coated with antibody against ICAM-1 (white arrowheads point towards EV-like particles). (b) NTA analysis of size-based EV fractions (EV-10 K, EV-110 K and EV-10 K+ EV-110 K) and their corresponding ICAM-1 depleted fractions. (c) All EV fraction lysates and TNF-α treated HUVEC cell lysates were subjected to SDS-PAGE and analysed by western blot for the classical EV membrane-bound marker (CD9 ~ 24 kDa and CD63 ~ 30–70 kDa), the cytosolic EV maker (Annexin II~ 37 kDa) and the inflammatory-associated marker (ICAM-1 ~ 90 kDa). (d) Validation of enrichment and depletion of ICAM-1 subpopulation using ELISA for ICAM-1. Values are given in ELISA as mean ± SD of three independent experiments (n = 3) and p < 0.05 is considered as statistically significant as determined by ANOVA (Dunnett’s test).
EV-TRACK: All relevant data of our experiments were submitted to the EV-TRACK knowledge database (EV TRACK ID: EV190072) [Citation20].
Results
TNF-α–triggered vascular endothelial cells release two heterogeneous size-based populations of EV containing inflammatory mediators
We have previously shown that a combination of small and large EV together is associated with inflammation, leading to adhesion and recruiting of monocytes [Citation15]. In order to find the key EV players in inflammation, different fractions of EV subsets derived from the cell culture supernatant of TNF-α triggered HUVEC were prepared through a two-step purification procedure. Total EV population was first fractionated based on their size at low (10,000 × g; EV-10 K) and ultracentrifugal force (110,000 × g; EV-110 K). To define whether EV-10 K and EV-110 K have a synergistic effect in inflammation, we also prepared a mixture of EV-10 K and EV-110 K subsets in a 1:1 ratio. As quality control, NTA, TEM and western blotting were applied to characterize these three size-based EV populations.
The EV-10 K subsets predominantly contained a mixture of 65.2 ± 11.1% medium-sized (100–200 nm) and 32.3 ± 11.6% large-sized (>200 nm) vesicles, while the EV-110 K were dominated by small- (50–100 nm) and medium-sized EV (with a distribution of 61.8 ± 12.1% and 29.8 ± 21.1%, respectively). A mixture of EV-10 K and EV-110 K subsets (EV-10 K + EV-110 K) contained small-, medium- and large-sized EV distributed as 26.3 ± 12.6, 59.4 ± 8.4% and 14.25 ± 6.3%, respectively (). In addition, NTA detected one major peak in the size range of small EV (50–100 nm) for EV-110 K and a broad peak around the size range of medium to large EV (100–400 nm) for EV-10 K. In the case of EV-10 K+ EV-110 K, three individual peaks corresponding to the size described as small-, medium- and large-sized EV were detected (). TEM images further indicate that EV-10 K, EV-110 K and EV-10 K+ EV-110 K fractions were enriched in heterogeneous populations of bilayer membrane-encapsulated vesicle structures. TEM images also confirmed that the EV-110 K subsets generally contained cup-shaped smaller EV, whereas a heterogeneous population of vesicles differing in size (mainly containing medium and large EV), shape and electron density was detected in EV-10 K ()).
TNF-α–triggered inflamed HUVEC released a higher concentration (~2.45 fold, p = 0.001) of smaller-sized vesicles (EV-110 K; 2.03 E09 ± 9.7 E08 particles/mL) than medium-/large-sized EV (EV-10 K; 9.8 E + 08 ± 4.3 E08 particles/mL) (Supplementary Figure 1A). In a similar manner, a higher number (~2.1 fold, p = 0.001) of smaller-sized vesicles per cell were released (EV-110 K; 1105.1 ± 509 particle/cell) as compared to larger-sized EV (EV-10 K; 516.1 ± 227 particles/cell) (Supplementary Figure 1B). On the other hand, the protein concentration of large-sized EV (EV-10 K) turned out to be ~2.1 fold (p < 0.0001) higher than EV-110 K (Supplementary Figure 1C), in which the total amount of protein per particle of EV-10 K was ~4.7 times more than EV-110 K and EV-10 K+ EV-110 K (p < 0.0001 and p = 0.005, respectively) (Supplementary Figure 1D). Furthermore, the EV preparations were validated usingwestern blotting. As shown in ), all three fractions were enriched for the classical EV markers CD63 and CD9 and the cytosolic EV maker (Annexin II) ()). The proapoptotic-associated protein (BAX) used as negative control was absent in all EV fractions ()). It should be noted that BAX was not detected in HUVEC triggered with 10 ng/ml TNF-α for 24 h, clearly showing that this treatment does not induce apoptosis in cells and hence the release of apoptotic bodies. But, HUVEC cells undergoing the same TNF-α treatment for a long period of 72 h (included as a non-EV negative control) did eventually suffer from apoptosis and hence showed the BAX expression ()). Among the EV classical markers, the tetraspanins CD9 and CD63 are more prevalent in small EV (EV-110 K), while the cytosolic EV maker (Annexin II) is more associated with large EV (EV-10 K). Moreover, we observed a higher level of the inflammatory-associated marker (ICAM-1) in the EV-10 K as compared with the EV-110 K fractions using western blotting ()). As shown in ), the ICAM-1 level per 1E09 EV was also much higher in the EV-10 K fraction (~5 folds, p < 0.0001) as compared with the small-sized EV (EV-110 K) and EV10K+EV-110 K fractions (~2 folds, p = 0.001). These results show that ICAM-1 is more abundant in medium and large EV (EV-10 K) as compared to small EV (EV-110 K) ()).
The inflammatory proteome of the size-based EV populations in comparison with their corresponding parental cells was first profiled using a systemic membrane – based antibody array for key inflammation proteins. To analyse the distribution of the inflammation patterns between cells and their size-based EV derivatives, clustered heat maps and Venn diagrams were generated. As shown in ), comparing inflammation profiles of size-based EV populations (EV-10 K, EV-110 K and EV-10 K+ EV-110 K) and their inflamed parental cells (TNF- α treated HUVEC) resulted in the identification of 25 out of 34 proteins (73.5%) mutually expressed immunomodulators. Among these 25 proteins, ICAM-1, IL-1α, IL-1β, IL-3, IL-8, IL-12p40, IL-12p70, IL-10, IL-16, MCP-1 (CCL-2), M-CSF, MIP-β (CCL-4), RANTES (CCL-5), IP-10 (CXCL-10) and Eotaxin-2 were highly abundant in both EV populations andthe parental inflamed cells (), Supplementary Figure 2 and Supplementary Table 1). These proteins are mainly involved in initiating inflammation and chemotaxis in target cells. Moreover, IL-2, IL-6 and IL-7 were exclusively present in EV of different sizes () and Supplementary Table 1). In total six proteins were commonly expressed in EV-110 K, EV-10 K+ EV-110 K and TNF-α treated HUVECs ( and Supplementary Table 1). We also evaluated the inflammation proteome of EV-associated proteins and EV external proteins by analysing both intact and lysate EV fractions using an inflammation array (Supplementary Figure 3) and ELISA (Supplementary Figure 4). In general, inflamed HUVECs may encapsulate several pro-inflammatory proteins such as ICAM-1, cytokines (CCL-5 and CXCL-10) and interleukins within EV rather than on the outside of EV (Supplementary Figures 3 and 4A-B). Interestingly, the level of IL-8 and CCL-2 were the same in the lysed and intact EV fractions (Supplementary Figures 3 and 4C and D), indicating that these cytokines are most likely co-isolated with the EV fractions. Furthermore, an unsupervised hierarchical clustering was performed to identify the relationship between the EV cargo and their corresponding parental cells. The obtained Euclidean distance represents the close neighbours to the selected column (TNF-α treated HUVEC) according to their overall similarity. Altogether, the inflammatory protein composition of TNF-α treated HUVEC is more identical to the EV subsets containing medium and large EV (EV-10 K and EV10K +EV-110 K) ()). These results confirm that inflamed vascular endothelial cells release two heterogeneous size-based populations of EV overlapping in inflammation profiles, with particular differences in the expression of chemoattractant cytokines, interleukins and endothelial cell adhesion molecule (ICAM-1).
Most of ICAM-1 is packed into the CDs (+) EV fractions
Our data thus far suggest that the main chemotaxis factors and inflammatory proteins particularly ICAM-1 are significantly present in both size-based EV populations. To unravel whether ICAM-1 is an EV-associated protein or rather is a co-isolated contaminant during ultracentrifugation, we performed additional separation steps on the size-based fractions using immuno-isolation techniques. We first pulled down EV from all size-based EV fractions using a cocktail of magnetic beads conjugated with antibodies against three different transmembrane tetraspanin proteins CD9, CD63 and CD81. We assessed the ICAM-1 distribution in both CDs (+) and CDs (-) fractions using western blotting and ELISA. Additionally, the presence of ICAM-1 in the CDs (+) EV-enriched fractions bound to magnetic beads was optically confirmed by high-resolution LSM 880 confocal laser scanning microscope ()). The observed green fluorescent signal of the anti-ICAM-1-Alexa488 antibody around the rim of the magnetic beads was only detected when ICAM (+) EV were bound to the beads, whereas only a very low fluorescent signal was detected in the negative control (sEV (-)) ()). The yield of captured EV from different size-fractionated EV samples was quantified using NTA. As shown in ) and Supplementary Figure 1A and 1E, a larger part (48.1 ± 5.1%) of the EV are captured from the EV-110 K samples, while only 34.3 ± 8.2% of large- and medium-sized EV were pulled out from the EV-10 K sample by magnetic beads coated with anti-CD9, CD63 and CD81 (Supplementary Figure 1E). In addition, western blot analysis for selected EV classical markers (CD9 and CD63) confirmed that a successful enrichment/depletion of EV from all size-based EV fractions was achieved using this approach ()). Most interestingly, the inflammation-associated marker (ICAM-1) in the EV bulk of all EV size-based EV fractions was mainly detected in the CDs (+) enriched fractions, but not in the EV-depleted fractions ()). This indicates that ICAM1 is firmly associated with EV. To further confirm and to quantify the presence of ICAM-1 in the EV enriched fractions in comparison to their bulk and depleted fractions, a high-sensitive ELISA analysis for ICAM-1 was performed. ELISA confirmed that ICAM-1 levels decreased statistically significant in all CDs (-) fractions after depleting EV from their crude samples ()). Taken together, these data indicate that most of the ICAM-1 marker co-segregates with the CDs (+) EV fractions as revealed by Western blot, NTA analysis and ELISA. Therefore, ICAM-1 can be used as a potential discriminatory biomarker to isolate inflammation-associated EV subpopulations from (size-fractioned) EV samples, which inspired us to develop an immuno-affinity method using this marker.
ICAM-1 (+) EV as a key candidate subpopulation of inflammation- associated EV
Our findings indicated that EV carry most of the adhesion molecules (ICAM-1) upon vascular inflammation [Citation15], but the contribution of ICAM-1 (+) bearing EV subpopulation in inflammation remains unclear. In order to understand their role in inflammation, we applied an immuno-affinity method using magnetic beads to capture ICAM-1 (+) subpopulations from all of the size-based EV fractions. EV-10 K, EV-110 K, EV-10 K+ EV-110 K fractions were treated with magnetic beads coated with human ICAM-1 antibody. All ICAM-1 (+) fractions were pulled down magnetically. In the TEM images of negatively stained ICAM-1 (+) EV fractions, the magnetic beads and EV were detected as a ring of high electron density black dots and transparent vesicle-shaped particles with a grey background, respectively (), white arrowheads point towards EV-like particles). EV were detected near to the beads, but they were not shown to be physically attached to the beads. Therefore, the enrichment of ICAM-1 (+) EV from all size-based EV populations using these magnetic beads was quantitatively confirmed by NTA and ELISA. Based on NTA, 72.7 ± 15.5% of ICAM-1 (+) EV were captured from EV-10 K samples, while only 52.8 ± 6.8% of the particles were pulled out from the EV-110 K sample by magnetic beads coated with anti- ICAM-1 (), Supplementary Figure 1A and 1E). Next, the distribution of EV markers (CD63 and CD9), a cytosolic EV maker (Annexin II) and ICAM-1 between ICAM-1 depleted and enriched fractions was analysed using Western blot in comparison to their corresponding size-based separated fractions. Neither CD63, CD9 and Annexin II nor ICAM-1 were detected in the ICAM-1 (-) fraction ()). To augment our findings, the ICAM-1 level in each crude sample and their corresponding depleted and enriched fractions were quantitatively determined using ELISA ()). Indeed, ELISA data confirmed that ICAM-1 was significantly depleted from all size-based EV populations using these antibody-decorated magnetic beads. In addition, only negligible amounts of ICAM-1 were detected in all control conditions including EV isolated from cell-free medium (cEV), EV-depleted supernatant (sEV (-)) and the pre-incubated EV-10 K with naked beads ()).
Taken together, these findings demonstrate that upon vascular inflammation, ICAM-1 is more loaded into the large- and medium-sized EV as a membrane-bound isoform, providing an opportunity to purify the inflammatory EV subpopulations for future diagnostic purposes.
The inflammation signature of TNF-α–triggered vascular endothelial cells is reflected into EV subpopulations
To further discover the best portrayer of vascular inflammation among the EV subpopulations, the inflammatory protein pattern of ICAM-1 and CDs enriched and depleted fractions were profiled, and clustered heat maps and Venn diagrams were generated as described above (). A total of 28 and 35 inflammatory proteins was found to be differentially expressed across EV-10 K and EV-110 K and their subpopulations, respectively (Supplementary Tables 2 and 3). Of these, 6 of 28 (21.4%) and 8 of 35 (22.8%) inflammatory proteins were shared among the EV-10 K and EV-110 K and their marker-based EV subpopulations, respectively (). Among the differentially expressed inflammatory proteins in size-based EV populations ()), a series of cytokines and adhesion markers including ICAM-1, CCL-4, CCL-5, CXCL-10, IL-12p40 and p70, IFN-γ and PDGF-BB were mutually enriched in all ICAM-1 (+) EV subsets, but with significant differences. Importantly, several ILs (e.g. IL1- α, IL1-β, IL-4, IL-6, IL-8, IL-10, Il-13, IL-15 and IL-16) and CCL-2 were eliminated from the ICAM-1 (+) fractions ()). On the other hand, ICAM-1 was specifically enriched in both ICAM-1 (+) and CDs (+) fractions and in their respective original EV populations of EV-10 K and EV-110 K. Consistent with these observations, unsupervised clustering using Pearson centred correlation revealed that the majority of the highly expressed inflammatory proteins in size-based EV fractions was also detected in their respective inflammatory enriched ICAM-1 (+) fractions. Although a similarity in the inflammation pattern of the mixture of EV-10 K and EV-110 K with inflamed HUVEC was clearly seen, the inflammation profile of TNF-α– triggered HUVEC is more mirrored in the large ICAM-1/CDs bearing EV (EV10K-ICAM-1 (+)/CD (+)) and to a lesser extent in small-sized EV (EV110 K-ICAM-1 (+)/CD (+)) ()). Interestingly, the highly enriched inflammatory chemokine CCL-2 and IL-8 in size-based EV-populations were completely depleted from ICAM-1 (+)/CD (+) EV (Supplementary Figure 4), showing that they are not associated with EV. Therefore, size-based EV (containing CCL-2 and IL-8) preparation may act functionally different in comparison to immune-isolated EV subsets.
Figure 4. Comparison the inflammation profile of CDs and ICAM-1 EV subpopulations with their size- based EV sources (EV10K and EV-110 K) and TNF-α treated HUVEC. (a–b) Venn diagrams display the overlap of expressed inflammatory proteins in EV-10 K (A), EV-110 K (b) with their CDs/ICAM-1 (+)/(-) fractions. (c) Heat map and hierarchical clustering of the inflammatory protein intensities (rows) in CDs and ICAM-1 EV subpopulations, size-based EV populations, TNF-α treated HUVEC (columns) using the Euclidean distance metric and complete linkage method. The colours of the heat map indicate the highly expressed (red) and the basal expression level (green). Euclidean distance represents the close neighbours to the selected column (TNF-α treated HUVEC) according to their overall similarity. (d) STRING PPI networks of the EV-10 K ICAM-1 (+). Confidence score threshold was set at 0.4 (medium) to create the network.
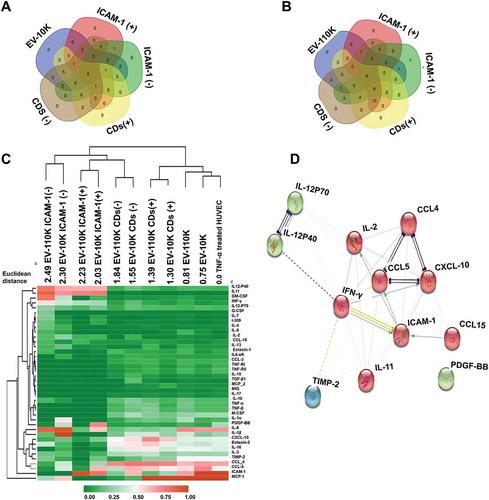
As shown in ), ICAM-1, CCL-4, CCL-5, CXCL-10, IL-12p40 and p70, IFN-γ and IL-2, IL-11 and PDGF-BB are in common between all ICAM-1 (+) fractions. Therefore, to gain insight into the protein network connectivity of these expressed inflammatory proteins, we have performed a STRING PPI analysis ()) with an interacting confidence score threshold of 0.4 (medium confidence). PPI analysis yielded significant protein interactions (PPI enrichment p-value <0.0001 as: Expected number of edges: 3, number of nodes: 12, number of edges: 31, PPI enriched p-value: 1.0e −16 and average node degree: 5.17). In addition, gene ontology term enrichment analysis of this unique subpopulation showed that the majority of its protein content was engaged in cytokine-mediated signalling pathways, immune responses and leukocyte chemotaxis (see Supplementary Table 4).
Taken together, these results indicate that the inflammatory cargo of large- and medium-sized EV more strongly reflects the physiological state of inflamed endothelial cells, which can be used as the most relevant signatures for vascular inflammation. In addition, the inflammatory subpopulations carry mainly immune cell-signalling and migration-promoting triggers. Thus, we further investigated whether the inflammatory EV (sub)populations are actively involved in the initiation of inflammation in vascular endothelial cells and in navigating the migration of monocytes in vitro.
Size-based EV and their ICAM-1 subpopulations induce vascular inflammation
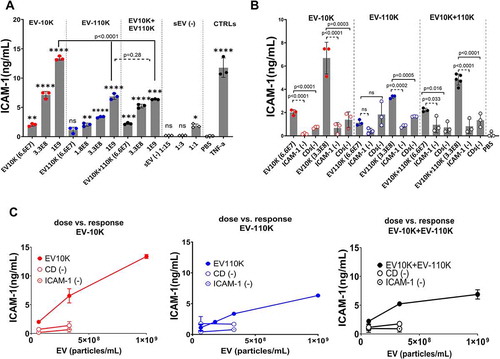
In our previous study, we already demonstrated the contribution of EV bulk (a mixture of small and large EV) to many aspects of inflammation by triggering ICAM-1 overexpression (one of the key biomarkers of inflammation) in endothelial cells and by promoting the adhesion and mobilization of monocytes [Citation15]. In order to reveal which EV (sub)populations are the key players in the initiation of inflammation in vascular endothelial cells, the ICAM-1 expression level was quantified in recipient cells (HUVEC) in response to different doses of the size-based EV fractions (EV-10 K, EV-110 K and EV10K+ EV-110 K), and the two-step depleted CDs (-) and ICAM-1 (-) fractions using an ELISA. As shown in ,c), the expression level of ICAM-1 in HUVEC after treatment with three increasing concentrations of all size-based fractions (EV-10 K, EV-110 K and EV10 K+EV-110 K) significantly increased in a dose-dependent manner in comparison to PBS as negative control (p-value < 0.05). Only the lowest concentration (6.6 E07 particles/mL) of small vesicles (EV-110 K) did not differ from the negative control (p = 0.18). Interestingly, EV fractions that contain larger-sized EV (EV-10 K) are more potent in increasing the ICAM-1 expression in targeted HUVEC (p < 0.0001), confirming their key role in priming inflammation in vascular endothelial cells. Moreover, mixtures of EV-10 K and EV-110 K induce a lower level of ICAM-1 expression at all concentrations in comparison to the respective EV-10 K fractions (p < 0.0001), suggesting that EV of different size populations do not act synergistically in initiating ICAM-1 expression in target cells and hence in inflammation ()). Accordingly, ELISA analyses revealed a dose-dependent upregulation of ICAM-1 in vascular endothelial cells (HUVEC) following treatment with EV size-based population (,b)), whereas this trend was not detected in the HUVEC cells treated with EV-free supernatant (sEV (-)) ()). Moreover, this effect was lost when either CDs or ICAM-1 bearing EV were removed from the EV-10 K containing fractions ()). In summary, our quantitative assessments of adhesion molecule expression indicate that the large-sized EV (EV-10 K) are more potent in inducing ICAM-1 expression in vascular endothelial cells as compared to small-sized EV (EV-110 K).
Figure 5. The effect of size-based EV populations and their immuno-depleted fractions on the expression of the inflammatory adhesive marker (ICAM-1) in HUVEC. (a) The expression of ICAM-1 in HUVEC in response to increasing doses (6.6 E07, 3.3 E08 and 1 E09 particles/mL) of size- based EV fractions (EV-10 K, EV-110 K, EV-10 K + 110 K) and in comparison to TNF-α and PBS treated HUVEC as positive and negative controls, respectively. (b) ICAM expression in HUVEC after treatment with two concentrations (6.6 E07 and 3.3 E08 particles/mL) of EV fractions in comparison with their corresponding CDs (-) and ICAM-1 (-) fractions. (c) Dose response of ICAM-1 expression in HUVEC after treatment with size-based EV populations and their depleted fractions (CD (-) and ICAM1(-)). Data are given as mean ± SD of three independent biological experiments (n = 3). One-way analysis of variance with a multiple comparisons test (Dunnet test, p-value < 0.05 considered significant) was used to evaluate the statistical significance between treatment versus negative control (0% FBS, 5a), and Tukey’s test at the value of *p < 0.05 (5a and 5b) was applied to evaluate the statistical significance between different treatments; *, **, ***, ****: significantly different from controls (p < 0.05, p < 0.01, p < 0.001 and p < 0.0001, respectively).
Small-sized EV and their ICAM-1 subpopulations promote monocyte migration
Finally, the contribution of different inflammatory EV (sub)populations in the recruitment of THP-1 cells was verified using an in vitro transwell migration assay. As shown in ), the migration capacity of THP-1 was mainly increased following treatment with EV-110 K in comparison with the EV-10 K (*p value <0.05). More importantly, EV containing the smaller-sized EV (EV-110 K) induced a robust THP-1 migration in a bell-shaped response as compared to 0% FBS ()). It should be noted that THP-1 cell migration was not induced by equal volumes of EV-free supernatant (sEV (-)) in comparison with 0% FBS as a negative control and 50 ng/mL MCP-1 as a positive control (Supplementary Figure 5).
Figure 6. The pro-migratory impact of size-based EV populations and their immuno-depleted fractions on THP-1. (a) THP-1 mobilization in the response to increasing doses (6.25 E07, 1.25 E08, 2.5 E08, 5E08 and 1 E09 particles/mL) of size -based EV populations (EV-10 K, EV-110 K, EV-10 K + 110 K) in comparison with 0% FBS, 50 ng/mL MCP-1 as negative and positive controls, respectively (n = 3). (b) The migratory response of THP-1 to 2.5 E08 particles/mL of CDs (-) fractions and ICAM-1 (-) EV subpopulations in comparison with their crude EV samples (n = 3). (c) The bell -shaped pro-migratory response of THP-1 to the increasing doses of size-based EV populations. Data are given as mean ± SD of three independent biological experiments (n = 3) and one-way analysis of variance with a multiple comparisons test (Dunnet test, p value < 0.05 considered significant) was used to evaluate the statistical significance between treatments versus negative control (0% FBS, 6a) and Tukey’s test at the value of *p < 0.05 was applied to evaluate the statistical significance between different treatments (6b);*, **, ***, ****: significantly different from controls (p < 0.05, p < 0.01, p < 0.001 and p < 0.0001 respectively).
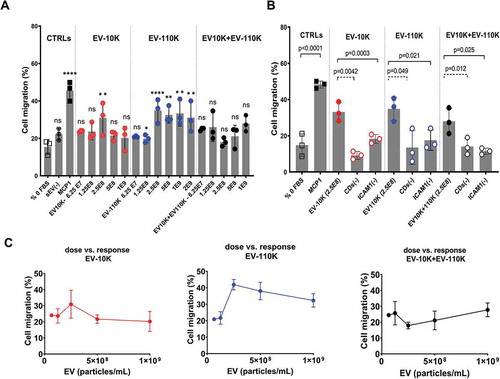
All size-based fractions at a concentration of 2.5 E08 particles/mL significantly enhanced the THP-1 migration in vitro. Adding the same concentrations of either depleted CDs or ICAM-1 EV to the lower compartment of the transwell assay resulted in a dramatic decrease in the THP-1 mobilization as compared to the original EV fractions ()). These results indicate the key role of EV and more specifically ICAM-1 (+) EV subpopulations in transferring chemotactic factors to recipient cells at the onset of inflammation. Taken together, these results suggest that smaller- sized EV (EV-110 K) and specifically their ICAM-1 (+) EV subpopulation are more responsible for recruiting monocytes.
Our findings provide new insights about the biology and different functions of inflammation-associated EV subpopulations in transferring or inducing biologically active inflammatory modulators into their recipients and contributing to the vascular inflammation process and recruiting monocytes.
Discussion
Previously, we demonstrated that the endothelial-derived EV bulk serves as a carrier of pro/anti-inflammatory proteins upon vascular inflammation and also triggers the recruiting and adhesion of monocytes to endothelial cells [Citation15]. As highlighted by the International Society for Extracellular Vesicles, the understanding of the biology and functional properties of EV key players is still unclear due to the lack of standard procedures for the purification of specific EV subpopulations [Citation12]. So far, EV populations have been extensively isolated in bulk and classified either based on their size/site of cellular origin and density gradient, as exosomes (40–100 nm), microvesicles (100 nm–1 μm), apoptotic bodies (>1 μm), or based on their tetraspanin surface markers [Citation5,Citation10,Citation11]. The EV bulk can be partially separated based on these properties, and there are most likely further subdivisions among the size- or density-based populations with more relevant functional activities associated with a certain physiological condition [Citation12,Citation13]. A limited number of studies have been devoted to isolating disease-related EV subpopulations based on specific markers. To our knowledge, this is the first study to apply a two-step purification procedure to improve the purity of key EV subpopulations associated with vascular inflammation. As a first step, two size-based EV populations derived from inflamed endothelial cells were separated using low (EV-10 K) and ultracentrifugal forces (EV-110 K). In addition to the presence of EV classical markers (CD9, CD63, CD81), our data indicate that these EV are enriched in the inflammation-specific marker (ICAM-1) in comparison to EV derived from non-inflamed endothelial cells, with the highest concentration in EV-10 K. In a second step, the isolation of inflammation-associated EV subpopulations with greater purity was achieved using either ICAM-1 or tetraspanin-decorated (CDs) magnetic beads. A close look at the inflammatory content revealed that CDs (+) EV and ICAM-1 (+) subpopulations share similar inflammatory protein compositions. More importantly, our results identified the ICAM-1 bearing EV-10 K as the key portrayer of the inflamed status of the EV producing cell, because they carry most of the inflammatory markers expressed in these cells (chiefly ICAM-1, CCL-4, CCL-5, and CXCL-10). Functionally, the small-sized EV (EV-110 K) can act as key modulators in the recruitment and migration of immune cells (monocytes), and the large-sized EV (EV-10 K) have the strongest effect on the ICAM-1 expression in recipient endothelial cells. Moreover, a mixture of EV of different sizes does not act synergistically in either initiating ICAM-1 expression or promoting THP-1 migration.
In the current study, to discover the contribution and function of EV (sub)populations in a vascular inflammation milieu, we generated supernatant from TNFα-induced HUVEC, a well-documented in vitro reference model for inflammation-mediated diseases [Citation21]. First, the differential centrifugation protocol was applied for the pre-enrichment of size-based EV populations. This quick, cost‐efficient procedure has largely been used for pre-up-concentration of large-sized EV and small-sized EV fractions derived from different cell types at g-forces of 10,000–20,000 × g (10–20 K) and >100,000 × g (100 K), respectively [Citation22]. Nevertheless, our results indicated that mixed populations of large, medium and small vesicles within two size-based populations of EV (EV-10 K and EV-110 K) could be partially separated using differential centrifugation. As reported before, co-pelleting of EV can happen during the serial centrifugation steps, causing heterogeneity and an overlap in size distribution paradigm of different EV populations [Citation12,Citation23]. Here, the co-enrichment of medium-sized EV in both populations can explain the wide overlap in their inflammatory protein pattern ()). Moreover, our findings highlighted that the EV of different sizes released from inflamed vascular endothelial cells were enriched with a cocktail of inflammatory proteins and mainly chemotaxis factors. More importantly, we demonstrated that both EV-10 K and EV-110 K from inflamed cells were co-enriched with EV-classical markers and inflammation-specific marker (ICAM-1) as validated by western blot, an antibody-based inflammation array and ELISA, suggesting that ICAM-1 is mainly associated with EV.
The intercellular adhesion molecule-1 (ICAM-1) is one of the major pairs of adhesion molecules that exhibits significant expression in the apical membrane of endothelial cells upon TNF-α mediated inflammation [Citation17,Citation24]. ICAM-1 is also engaged with the firm adhesion and recruitment of circulating immune cells into the intima and pro-inflammatory signalling cascade, thereby contributing to the progression of several inflammation-associated diseases [Citation17,Citation24]. Our recent research in the area of inflammation demonstrated that overexpression of ICAM-1 in the EV bulk (small and large EV combined) derived from activated endothelial cells is associated with the inflammatory status of their host cells [Citation15]. In contrast, not much is known about the molecular mechanisms of inflammation-associated markers in different EV populations and whether certain EV subpopulations are involved in the transport of ICAM-1 molecules across cells. Our results showed that ICAM-1 is more abundant in large- and medium-sized EV as compared with small-sized EV. The difference in ICAM-1 expression of the different size-based populations can be due to the difference in the biogenesis nature of small (exosome) and large EV (microvesicles). Since EV-10 K, referred as microvesicles in literature, are pinched off from the plasma membrane of cells with a larger available surface area as compared to their exosome-liked relatives (EV-110 K), they more likely carry a large portion of the membrane-bound ICAM-1 upon inflammation. Of note, ICAM-1 possesses extracellular membranous domains, enabling us to apply an antibody-based affinity purification method to capture ICAM-1 (+) EV as a subpopulation from size-based EV fractions. In this study, different complementary approaches were used to prove the presence of the inflammatory maker (ICAM-1) in the EV secreted from inflamed vascular endothelial cells. First, we observed a significant decrease in the amount of ICAM-1 after depleting EV from size-based populations using magnetic beads decorated with tetraspanin proteins (a cocktail of CD9, CD63 and CD81), proving that ICAM-1 is a marker that is mainly carried as membrane-bound isoform in EV. In addition, the ICAM-1 was indeed co-segregated with ICAM-1-enriched fractions in comparison with the depleted fractions.
It is widely acknowledged that EV of different sizes shuttle information between host and recipient cells, thereby changing their physiological function both locally and remotely [Citation25]. Therefore, the protein and RNA profile of EV can reflect the physiological state of the cells of origin. Comparing the inflammatory protein profiles of EV of different (sub)populations may help to trace the inflammation-specific key populations which are involved in the progression of several inflammation-related diseases. Interestingly, the similarities in inflammation profiles of the two EV size-based populations (EV-10 K and EV-110 K) and their TNF-α–triggered parental cells confirmed that they are close relatives by sharing up to 73.5% of their inflammatory mediators. This could be due to the fact that ultracentrifugation does not fully separate, but rather enriches EV of different sizes; thus, the purity and hence functionality of these subpopulations are still under debate. Nevertheless, our data suggest that the inflammatory pattern of the parent cells (TNFα- treated HUVEC) is more reflected in their large- and medium-sized derivatives (EV-10 K). Usually, the overexpression of adhesion molecules, predominantly ICAM-1, together with the secretion of cytokines and chemokines leads to inflammation, and if chronically to the progression of several diseases [Citation26]. Fitzgerald et al. suggested that EV have crucial roles in the traffic of cytokines by encapsulating them [Citation27]. Another key question that arises is whether all of these proteins are loaded into EV or could be co-pelleted with EV fractions. According to Fitzgerald et al., biological systems differentially distribute the released cytokines between free and EV-associated forms (either encapsulated inside or on the surface of EV) depending on the stimulus. They believe that T cells and monocytes produce mostly EV-associated cytokines and predominantly inside the vesicles (e.g. IL-2, IL-4, IL-10, IL-12, IL-15, IL-16, IL-18, IL-21, IL-22, IL-33, Eotaxin, CXCL-10, ITAC, M-CSF, MIG, MIP-3α, TGF-β and TNF-α) and only a few cytokines (IL6, CCL-2 (MCP-1) and IL-8) either on the surface of EV or in its free form. But, as they reported, their conclusion is based on EV bulk isolates using a commercial kit. Therefore, further fractionating of EV is needed to confirm this fact [Citation27]. According to MISEV, commercial kits have a high recovery but a low specificity in isolating EV [Citation23]. Using our two-step isolation approach, we demonstrated that the adhesion marker ICAM-1 is predominantly present on large- and medium-sized EV that encapsulated the main chemotactic cytokines such as IL-8, CCL-2, CCL-4, CCL-5 and CXCL-10. The presence of these cytokines in the EV bulk can explain the chemotactic role and proliferative activity of size-based EV populations in recipient cells during inflammation. Our results on the EV subpopulations further showed that among the EV-associated inflammatory proteins CCL-4, CCL-5, CXCL-10 together with ICAM-1 were co-segregated with both ICAM-1 (+) and CDs (+) fractions. On the other hand, the two main chemotactic cytokines IL-8 and CCl-2 were exclusively detected in EV size-based populations and their CDs (-) and ICAM-1 (-) depleted subpopulations of EV but not in their CDs (+) and ICAM-1 (+) fractions. These results confirm that our two-step isolation method may separate inflammation-associated EV into more significantly different sub-fractions.
Finally, the presence of ICAM-1 as a specific inflammatory marker in the membrane of a size-based EV superfamily can be used to understand the physiological function of these EV subpopulations in inflammation. From functional assays, we can conclude that the role of size-based EV populations and their subsequent derivatives appear to be different. The small-sized ICAM-1 containing EV, EV-110 K were more involved in the recruitment of monocyte, while the large ICAM-1 (+) EV subgroup (EV-10 K) are more potent to induce inflammation by increasing the ICAM-1 level in the recipient vascular endothelial cells. When the ICAM-1 carrying EV were depleted from either EV-10 K and EV-110 K, both key processes in inflammation were lost. In addition, by integrating PPI analysis and functional activities, we confirmed that proteins in ICAM-1 (+) EV were mainly engaged in immune responses, chemotaxis and induction of inflammation (ICAM-1 expression induction). These observations suggest that EV, and more specifically the ICAM-1 (+) EV subpopulation, are responsible for inflammation-associated processes such as ICAM-1 expression and monocyte migration. One of the major challenges in studying EV related functional effects is how to normalize for differences in samples due to technical and unrelated causes. In this work, inflammatory EV were isolated from the same number of parental cells (1.8–2 × 10 6 cells/mL) and an equivalent volume of collected EV from condition medium in a serial dilution was applied in functional studies as recommended by MISEV [Citation23].
However, it should be noted that the molecular mechanisms of inflammation-associated proteins and RNA markers loading into different EV (sub)populations are largely unknown and need to be explored. Therefore, further experiments are planned to explore the functional RNA content of EV (sub)populations and their involvement in inflammation. In summary, our study provides a two-step approach to fractionate inflammation-associated EV subpopulations with an increased purity Which can be used to obtain new insights about the EV key players in different inflammation processes. When vascular endothelial cells are triggered to become inflamed cells, they release at least two EV populations with a partial overlap in size and inflammatory protein patterns. Although the large EV carry more adhesion molecules and have an inflammation pattern close to the parental cells, the small-sized EV population plays an active in the recruitment of immune cells.
Supplemental Material
Download MS Word (948.6 KB)Acknowledgments
The authors acknowledge the excellent technical support of Veronique Vastmans and Iris Reniers. We thank Senne Seneca for his help with TEM imaging and Eva Cordery for critically reading the manuscript. We thank Dr. Anna Ivanova for statistical advice on the data.
Disclosure statement
The authors declare that the research was conducted in the absence of any commercial or financial relationships that could be construed as a potential conflict of interest.
Supplementary material
Supplemental data for this article can be accessed here.
Additional information
Funding
References
- Medzhitov R. Inflammation 2010: new adventures of an old flame. Cell. 2010;140:771–17.
- Chen L, Deng H, Cui H, et al. Inflammatory responses and inflammation-associated diseases in organs. Oncotarget. 2017;9:7204–7218.
- Libby P. Inflammation and cardiovascular disease mechanisms. Am J Clin Nutr. 2006;83:456S–460S.
- Wolf P. The nature and significance of platelet products in human plasma. Br J Haematol. 1967;13:269–288.
- Raposo G, Stoorvogel W. Extracellular vesicles: exosomes, microvesicles, and friends. J Cell Biol. 2013;200:373–383.
- Valadi H, Ekström K, Bossios A, et al. Exosome-mediated transfer of mRNAs and microRNAs is a novel mechanism of genetic exchange between cells. Nat Cell Biol. 2007;9:654.
- György B, Szabó TG, Pásztói M, et al. Membrane vesicles, current state-of-the-art: emerging role of extracellular vesicles. Cell Mol Life Sci. 2011;68:2667–2688.
- Armstrong D, Wildman DE. Extracellular vesicles and the promise of continuous liquid biopsies. J Pathol Transl Med. 2018;52:1–8.
- Lässer C, Jang SC, Lötvall J. Subpopulations of extracellular vesicles and their therapeutic potential. Mol Aspects Med. 2018;60:1–14.
- Cocucci E, Racchetti G, Meldolesi J. Shedding microvesicles: artefacts no more. Trends Cell Biol. 2009;19:43–51.
- Trams EG, Lauter CJ, Norman Salem U Jr. Heine, Exfoliation of membrane ecto-enzymes in the form of micro-vesicles. Biochim Biophys Acta - Biomembr. 1981;645:63–70.
- Kowal J, Arras G, Colombo M, et al. Proteomic comparison defines novel markers to characterize heterogeneous populations of extracellular vesicle subtypes. Proc Nat Acad Sci. 2016;113:E968–E977.
- Lee YXF, Johansson H, Wood MJA, et al. Considerations and implications in the purification of extracellular vesicles – a cautionary tale. Front Neurosci. 2019;13. DOI:10.3389/fnins.2019.01067
- Takov K, Yellon DM, Davidson SM. Comparison of small extracellular vesicles isolated from plasma by ultracentrifugation or size-exclusion chromatography: yield, purity and functional potential. J Extracell Vesicles. 2019;8:1560809.
- Hosseinkhani B, Kuypers S, van den Akker NMS, et al. Extracellular vesicles work as a functional inflammatory mediator between vascular endothelial cells and immune cells. Front Immunol. 2018;9. DOI:10.3389/fimmu.2018.01789
- Hosseinkhani B, van den Akker N, D’Haen J, et al. Direct detection of nano-scale extracellular vesicles derived from inflammation-triggered endothelial cells using surface plasmon resonance. Nanomedicine. 2017;13:1663–1671.
- Boyd AW, Wawryk SO, Burns GF, et al. Intercellular adhesion molecule 1 (ICAM-1) has a central role in cell-cell contact-mediated immune mechanisms. Proc Nat Acad Sci. 1988;85:3095–3099.
- Seth R, Raymond FD, Makgoba MW. Circulating ICAM-1 isoforms: diagnostic prospects for inflammatory and immune disorders. Lancet. 1991;338:83–84.
- de Jong OG, Verhaar MC, Chen Y, et al. Cellular stress conditions are reflected in the protein and RNA content of endothelial cell-derived exosomes. J Extracell Vesicles. 2012;1:18396.
- Van Deun J, Mestdagh P, Agostinis P, et al. EV-TRACK: transparent reporting and centralizing knowledge in extracellular vesicle research. Nat Methods. 2017;14:228.
- Luna C, Carmona A, Alique M, et al. TNFα-damaged-HUVECs microparticles modify endothelial progenitor cell functional activity. Front Physiol. 2015;6:395.
- Livshits MA, Khomyakova E, Evtushenko EG, et al. Isolation of exosomes by differential centrifugation: theoretical analysis of a commonly used protocol. Sci Rep. 2015;5:17319.
- Théry C, et al. Minimal information for studies of extracellular vesicles 2018 (MISEV2018): a position statement of the international society for extracellular vesicles and update of the MISEV2014 guidelines. J Extracell Vesicles. 2018;7:1535750.
- Rahman A, Fazal F. Hug tightly and say goodbye: role of endothelial ICAM-1 in leukocyte transmigration. Antioxid Redox Signal. 2009;11:823–839.
- Maas SLN, Breakefield XO, Weaver AM. Extracellular vesicles: unique intercellular delivery vehicles. Trends Cell Biol. 2017;27:172–188.
- Libby P. Inflammatory mechanisms: the molecular basis of inflammation and disease. Nutr Rev. 2007;65:S140–S146.
- Fitzgerald W, Freeman ML, Lederman MM, et al. A system of cytokines encapsulated in extracellular vesicles. Sci Rep. 2018;8:8973.