
ABSTRACT
Extracellular vesicles (EVs) are important means of intercellular communication and a potent tool for regenerative therapy. In ischaemic stroke, transient blockage of a brain artery leads to a lack of glucose and oxygen in the affected brain tissue, provoking neuronal death by necrosis in the core of the ischaemic region. The fate of neurons in the surrounding penumbra region depends on the stimuli, including EVs, received during the following hours. A detailed characterization of such stimuli is crucial not only for understanding stroke pathophysiology but also for new therapeutic interventions. In the present study, we characterize the EVs in mouse brain under physiological conditions and 24 h after induction of transient ischaemia in mice. We show that, in steady-state conditions, microglia are the main source of small EVs (sEVs), whereas after ischaemia the main sEV population originates from astrocytes. Brain sEVs presented high amounts of the prion protein (PrP), which were further increased after stroke. Moreover, EVs were enriched in a proteolytically truncated PrP fragment (PrP-C1). Because of similarities between PrP-C1 and certain viral surface proteins, we studied the cellular uptake of brain-derived sEVs from mice lacking (PrP-KO) or expressing PrP (WT). We show that PrP-KO-sEVs are taken up significantly faster and more efficiently than WT-EVs by primary neurons. Furthermore, microglia and astrocytes engulf PrP-KO-sEVs more readily than WT-sEVs. Our results provide novel information on the relative contribution of brain cell types to the sEV pool in murine brain and indicate that increased release of sEVs by astrocytes together with elevated levels of PrP in sEVs may play a role in intercellular communication at early stages after stroke. In addition, amounts of PrP (and probably PrP-C1) in brain sEVs seem to contribute to regulating their cellular uptake.
Introduction
Extracellular vesicles (EVs) are lipid bilayer structures released from probably almost all types of cells, that carry biologically active molecules, such as proteins, lipids, and extracellular RNAs (e.g. mRNA, miRNA, tRNA and YRNA), and are capable to elicit responses in the receptor cells [Citation1,Citation2]. Although once considered as “platelet dust” or “trash cans”, EVs are currently regarded as potent means of intercellular communication and currently represent an intense field of research [Citation3–Citation6]. Exosomes (with a size of 40–150 nm; originating from multivesicular bodies), microvesicles (150–1,000 nm; shed from the plasma membrane) and apoptotic vesicles (ApoEVs; 1,000–5,000 nm; released from cells undergoing apoptosis) are subtypes of EVs. An increasing amount of evidence shows that EVs play important roles in physiological and in pathological conditions [Citation7–Citation9]. Moreover, they are considered as potential disease biomarkers and, given their ability to cross the blood-brain barrier (BBB), are also investigated as tools for tissue- or cell-specific delivery of a therapeutic cargo [Citation10–Citation14].
Stroke is the second most common cause of death and the main cause of disability worldwide, being responsible for ~6 million deaths in 2016 (http://www.who.int/en/news-room/fact-sheets/detail/the-top-10-causes-of-death). Ischaemic stroke accounts for 87% of cases and is caused by an occluded brain artery, which leads to a temporary lack of glucose and oxygen supply in the affected brain region. Neurons – the most susceptible brain cell population – that are at the core of the stroke will die by necrosis, whereas neurons located in the periphery (penumbra) will enter into electrical silence and, depending on many factors, will either die or survive within the following hours and days [Citation15,Citation16]. The pathophysiology of stroke is very complex and involves several mechanisms such as excitotoxicity and neuroinflammation [Citation17–Citation19]. At present, the only therapeutic approach is recanalization and treatment with recombinant tissue plasminogen activator (rtPA). The latter has a very limited time window of 4.5–6 h after stroke and, thus, only 20% of the stroke patients can benefit from it [Citation20]. Hence, there is an urgent need for novel therapeutic options to be used after this time period. At present, EVs are regarded as tools for regenerative therapy after stroke [Citation21,Citation22].
The cellular prion protein (PrP) is enriched in EVs isolated from cerebral spinal fluid (CSF) and neuronal cells [Citation23–Citation25]. PrP is a cell surface N-glycosylated, GPI-anchored protein mainly located in detergent-resistant domains (also known as lipid rafts) [Citation26], which are important for the biogenesis of EVs [Citation27,Citation28]. Although PrP is highly conserved through evolution and many functions have been suggested, the exact physiological role of PrP is still not well-defined, mainly because knock-out mice for PrP do not present major deficiencies [Citation29,Citation30]. However, under ischaemic conditions, it has been shown that PrP has a protective role. Thus, in mouse models of stroke, PrP-deficient (PrP-KO) mice present an increased stroke volume compared to wild-type (WT) mice [Citation30,Citation31], which can be rescued by PrP overexpression [Citation32,Citation33]. Moreover, mice overexpressing PrP showed improved long-term neuronal recovery after stroke, which was associated with increased neuro- and angiogenesis [Citation34]. Interestingly, in mouse models of ischaemia, but also in brains from patients suffering from stroke, an increase of PrP has been observed at the penumbra area, probably as an attempt to decrease the oxidative stress [Citation35–Citation37]. Last but not least, exosomal PrP secreted by astrocytes under ischaemic conditions had a protective effect on ischaemic neuronal cerebellar cells, but this protection was eliminated when exosomes were exempt from PrP [Citation38]. PrP undergoes several physiological cleavages that are highly conserved in mammals, including the α- and β-cleavage, and shedding near the GPI anchor, which may account for the myriad of functions attributed to PrP [Citation39–Citation41]. The fact that α-cleavage, leading to the formation of a released neuroprotective N1 fragment and a membrane-attached C1 fragment, seems to be performed and ensured by several (yet-to-be-identified) proteases, provides an idea of its biological importance [Citation39,Citation42].
Because of the potential of EVs in stroke therapy [Citation21,Citation43], further understanding and characterization of brain-derived EVs in physiological and under stroke conditions becomes necessary. With this aim, and taking advantage of the recently developed protocols to isolate EVs from brain tissue [Citation44], we show here that (i) microglia are the main cell population to release small EVs (i.e. EVs ≤ 200 nm; sEVs) in steady-state conditions, (ii) brain-derived sEVs are enriched in PrP and, seemingly, in its truncated C1 fragment, and (iii) this may influence the cellular uptake of EVs. Moreover, (iv) lack of PrP on sEVs is a possible factor that increases their uptake by neurons, microglia, and astrocytes. Finally, (v) in a mouse model of stroke, astrocytic contribution to the sEV pool as well as levels of PrP on brain sEVs are significantly increased after 24 h of reperfusion. We hypothesize that regulating the amounts of PrP, and particularly PrP-C1, is a mechanism to modulate EVs uptake and cargo destination by brain cells that may be employed therapeutically in the future. Moreover, a deeper understanding of the increased astrocytic release of EVs in reaction to stroke could lead to a targeted therapy.
Material and methods
Ethics statement
All animal experiments have been conducted after the approval of the local animal care committees (Behörde für Lebensmittelsicherheit und Veterinärwesen Hamburg, project number: N45/2018) and in accordance with the guidelines of the animal facility of the University Medical Center Hamburg-Eppendorf (UKE).
Transient middle cerebral artery occlusion (tMCAO)
The tMCAO was performed as previously described in detail [Citation19]. Three-month-old male mice were used for the procedure. tMCAO was achieved by using a 6–0 nylon monofilament to stop the blood supply for 40 min. In the control group (“sham”), animals were also anesthetized, and the arteries were visualized but not disturbed.
Isolation and purification of brain EVs
EVs were isolated from brain as previously described [Citation44] with some modifications. Briefly, frozen brains (either full brain without cerebellum (between 0.31 and 0.33 g) or half of an hemisphere, ipsilateral to tMCAO (between 0.16 and 0.18 g)), stored for not more than one month) from C57BL/6 WT or Prnp0/0 (PrP-KO) mice [Citation45] (aged between 12–18 weeks) were gently chopped in few drops of Hibernate-E (Gibco) and transferred to a 15 mL tube containing 75 U/mL of collagenase type III (Worthington) in Hibernate-E at a ratio of 800 μL buffer per 100 mg of brain, and incubated in a water bath at 37°C for 20 min. Alternatively, some samples were incubated with 75 U/mL of collagenase type IV (Worthington). During this time, the tube was mixed by inversion every 5 min and pipetted up and down using a 10 mL pipette. Immediately after, the tube was returned on ice and proteinase inhibitors (Complete Protease Inhibitor Tablets, Roche) were added. The sample was then centrifuged at 300xg for 5 min at 4°C and the supernatant collected and further centrifuged at 2,000xg for 10 min at 4°C.
The 2000xg supernatant was again collected and centrifuged at 10,000xg for 30 min at 4°C. To isolate small extracellular vesicles (sEVs), the supernatant was passed through a 0.22 µm sodium acetate filter (GE Healthcare). The resulting flow-through (filtered) or supernatants that were not passed through the filter (non-filtered) was layered on top of a sucrose gradient (0.6 M, 1.3 M, 2.5 M). The gradient was centrifuged at 180,000xg (31,800 rpm in SW40Ti rotor) for 3 h at 4°C and six fractions of 2 mL each were collected, diluted in PBS, and further centrifuged at 100,000xg (24,000 rpm in SW40Ti rotor) at 4°C for 70 min. The final pellet was then resuspended in PBS (for NTA measurements and labelling) or RIPA buffer (for western blots), containing protease and phosphatase inhibitors (PhosSTOP Tablets, Roche). For some experiments, the 300xg pellet (P1) was also collected and further homogenized with RIPA buffer (50 mM Tris-HCl pH = 7.4, 150 mM NaCl, 1% NP40, 0.5% Na-Deoxycholate and 0.1% SDS) containing protease inhibitors, and either non-centrifuged or centrifuged at 10,000xg.
To calculate the density of the sucrose gradient, the six fractions obtained after ultracentrifugation were analysed with an Abbemat 550 refractometer (Anton Paar).
For EVs isolation from media supernatants of mouse neuroblastoma (N2a) cells and a murine hippocampal cell line (mHippoE-14), 15 cm dishes with 80% confluent cells were incubated 24 h with serum-free Opti-MEM (Gibco). After collecting the conditioned media and addition of protease inhibitors, serial centrifugations at 300xg, 2,000xg and 10,000xg were performed with the corresponding supernatants as previously described [Citation46]. After a final centrifugation at 100,000xg (24,000 rpm in SW40Ti rotor) for 70 min, pellets were collected in RIPA buffer and further processed for PNGase digestion and SDS-PAGE and western blot (see below).
Nanoparticle tracking analysis (NTA)
Resuspended pellets resulting from the 100,000xg centrifugation step were used for NTA. Briefly, 1 µL of the final pellet suspension was diluted at 1:5,000 for non-filtered EVs and 1:1,000 for filtered EVs in PBS and 500 µL were loaded into the sample chamber of an LM10 unit (Nanosight, Amesbury, UK). Ten videos of ten seconds were recorded for each sample. Data analysis was performed with NTA 3.0 software (Nanosight). Software settings for analysis were as follows: detection threshold = 6, screen gain = 2.
Fluorescence labelling of EVs
EVs from pooled fractions 3 and 4, in a concentration of 1012/ml, were incubated with 5 nM of mCLING (Synaptic Systems) on ice and in the dark for 5 min. After incubation, the reaction was stopped by adding 1% BSA in PBS. The unincorporated dye was then removed from labelled EVs by centrifugation at 100,000xg at 4°C for 70 min. The final pellet was resuspended in PBS and immediately used for the experiments. As a control, 5 nM of mCLING incubated in PBS without EVs followed the same procedure as described above.
Primary neuronal culture
Primary hippocampal neurons were prepared at P0-P2 as previously described [Citation47]. Briefly, animals were decapitated, the brain was rapidly excised and cleaned from meninges and choroid plexus. Hippocampi were isolated and digested for 30 min at 37°C in 10 mM glucose (500 µL/brain) containing 25 U of papain (Sigma) and 20 µg/mL DNAse (Sigma). Cells were washed several times with plating medium (MEM (Gibco), 10 mM glucose and 10% horse serum) and, after the last wash, cells were mechanically dissociated. 100,000 cells were plated in 12-well plates containing plating medium and poly-L-lysine-coated 13 mm diameter coverslips. After 5 h, the media was changed to Neurobasal-A medium (Gibco) supplemented with 1% B27 (Thermo Fisher), 0.5% Glutamax (Gibco) and 0.1% Gentamicin (Gibco). After 24 h, arabinoside-C (ARA-C, Tocris) was added at a concentration of 15 µM to prevent mitotic proliferation of non-neuronal cells. Neuronal cultures were kept at 37°C in 5% CO2 for 14 days and half of the medium was replaced every 3 days.
Co-culturing of neurons with an astrocytic feeder layer
For the co-culture, an astrocyte feeder layer was prepared 21 days in advance from P0/P1 WT mouse pups. Briefly, after isolating the brain and cleaning meninges and choroid plexus, the cortex was removed and put in GGM (Glial Growth Medium: DMEM (Gibco) supplemented with 1.35% glucose, 1% pen/strep and 10% FCS). After addition of pre-warmed 0.25% trypsin (Sigma), the tissue was digested for 15 min at 37°C in a water bath while shaking (300 rpm). After that, 50 µg/mL of DNAse I (Sigma) was added for 1 min and the enzymatic reaction was stopped by adding 4 volumes of GMM. Cells were then washed twice with GGM by centrifuging 5 min at 180xg, the cell suspension was passed through a 70 µm cell strainer and the final cell suspension was plated in T75 flasks with GMM.
For neuronal preparation, P0 mice pups were used as previously described [Citation48]. Briefly, after extracting the brain and cleaning from meninges and choroid plexus, the isolated hippocampi were digested at 37°C for 15 min in dissection media (1× HBSS (Gibco), 1% pen/strep, 10 mM HEPES (Gibco) and 0.6% glucose) containing pre-warmed 0.25% trypsin (Gibco). After the enzymatic digestion, DNAse I (20 µg/mL) was added and incubated at RT for 1 min. GMM was added to quench the enzymatic reaction. Cells were then centrifuged for 5 min at 180xg. The resulting pellet was gently triturated in Neuronal Maintenance Medium (NMM, Neurobasal medium (Gibco) containing 1% glutamax (Gibco), 2% B27 (Gibco) and 1% pen/strep) using a 5 mL pipette followed by a 1 mL pipette. Cells were then centrifuged again for 5 min at 180xg. The pellet was resuspended in NMM and passed through a 70 µm cell strainer. About 40,000 cells were plated in 24-well plates containing pre-coated poly-L-lysin coverslips and NMM. After 2 h, the coverslips were inverted on the top of the pre-cultured feeder layer with a wax-dot spacer in between. After 24 h, the mitotic inhibitor FUDR (2′-Deoxy-5-fluorouridine;Sigma) was added in a concentration of 10 µM. Neuronal cultures were kept at 37°C in 5% CO2 for 14 days and half of the medium was replaced every 3 days.
Mixed glia culture
Mixed glia cultures were prepared from P0-P2 mice pups. Briefly, animals were decapitated, the brain excised and cleaned from meninges. The cortex was isolated and washed twice with HBSS (Gibco) containing 10 mM HEPES by centrifuging at 310xg for 5 min at 4°C. The tissue was then incubated in digestion solution (HBSS-HEPES 10 mM containing 25 U of papain (Sigma) and 10 µg/mL DNAse) at 37°C for 30 min. Plating media (BME (Gibco) with 10% FCS and 0.1% gentamycin (Gibco)) was added to stop the digestion reaction. Cells were then further centrifuged for 5 min at 310xg, the pellet resuspended in the plating media using a Pasteur pipette and passed through a 70 µm cell strainer. Cells were then plated in T25 flasks or in 12-well plates.
Immunocytochemistry, confocal and STED microscopy
Neurons were incubated for 1, 3, or 6 h with 5 µL(containing about 2.6 × 10⁸ particles as measured with NTA) of sEVs isolated either from WT or PrP-KO brains, previously labelled with mCLING as described above. For the co-culture system, coverslips containing neurons were transferred to another well where the incubation with EVs was taking place without potential influence by the astrocytic feeder layer. After incubation, neurons were fixed with 4% PFA and 0.2% glutaraldehyde in PBS for 10 min, permeabilized for 10 min with 0.5% saponin in PBS, blocked for 30 min with 1% BSA in PBS-Tween (0.1%) and then incubated for 1 h with the primary antibodies (the lysosomal marker LAMP-1 (Invitrogen, 4–1071-82, 1:500), the microglia marker IBA1 (Wako, 019–19,741, 1:500), or the neuronal marker MAP2 (Sigma, M9942, 1:500) diluted in PBS-0.1% BSA. The coverslips were then washed three times with PBS and incubated either with the secondary antibody Alexa Fluor donkey anti-rat 488 (Life Technologies, A21208), Alexa Fluor donkey anti-rabbit 555 (Life Technologies, A31572) or Alexa Fluor donkey anti-rat 555 (Abcam, ab150154, 1:500). Actin labelling was performed by adding at this step Phalloidin-iFluor 488 (Abcam, ab176753, 1:500) diluted in BSA 0.1% in PBS. The coverslips were washed three times with PBS and mounted with DAPI Fluoromount-G (SouthernBiotech, 0100–20). Between 15 and 20 pictures of randomly chosen single neurons per experiment were taken with the 63× immersion oil objective and at a magnification of 3× with a Leica TCS SP8 confocal microscope. The signal of the 633 nm wavelength corresponding to EVs was quantified and referred to the neuronal cell body area using ImageJ Fiji. Experiments were repeated three times for each time point.
For STED microscopy 15 µL of sEVs labeled with mCLING as previously described, were placed on a coverslip and then mounted with solid mounting medium (Abberior).
STED and corresponding confocal microscopy were carried out in sequential line scanning mode using an Abberior STED expert line microscope. This setup was based on a Nikon Ti-E microscope body and employed for excitation and detection of the fluorescence signal at 60× (NA 1.4) P-Apo oil immersion objective. One pulsed laser was used for excitation at 640 nm and near-infrared pulsed laser (775 nm) for depletion. The detected fluorescence signal was directed through a variable-sized pinhole (set to match 1 Airy at 640 nm) and detected by novel state of the art avalanche photo diodes APDs with appropriate filter settings Cy5 (615–755 nm). Images were recorded with a dwell time of 3 µs and the pixel size was set to be 20 nm. The acquisitions were carried out in time gating mode, i.e. with a time gating width of 8 ns and a delay of 781 ps. After acquisition images were displayed and analysed by the freeware ImageJ Fiji.
Flow cytometry
Mixed culture glia cells were incubated with 5µL (containing about 2.6 × 10⁸ particles as measured with NTA) of WT or PrP-KO sEVs labelled with mCLING for 3 h. Cells were then trypsinized and transferred to FACS tubes containing FACS buffer (PBS with 1 mM EDTA and 0.2% BSA). Cells were centrifuged for 5 min at 4°C at 310xg, washed in FACS buffer and centrifuged again. Cells were stained for 30 min on ice with anti-CD11b–FITC (1:100; Clone M 1/70, Biolegend) and anti-GLAST-PE (1:100; MiltenyiBiotec) in the presence of Fc Block (1:100; Bio X Cell) in FACS buffer, washed two times with FACS buffer and finally resuspended in 200 µL of FACS buffer. Measurements were done with a BD FACSCanto™ II and analysed with FlowJo.
Western blot
The total protein content in total homogenates (TH), 300xg pellets and cell lysates (CL) was assessed with the Pierce BCA Protein assay kit (Thermo Scientific) following the instructions of the supplier. For brain-derived EVs, brain-derived sEVs and N2a and mHippo E-14 EVs the total protein content was assessed with Micro BCA Protein assay kit (Thermo Scientific) following the instructions of the supplier. Samples were then denatured at 70°C for 10 min with NuPage LDS Sample Buffer (Invitrogen) and NuPage sample reducing agent (Invitrogen) and equal amounts of protein were then loaded on precast NuPage 10% Bis-Tris protein gels (Invitrogen). After electrophoretic separation, proteins were transferred onto nitrocellulose membranes (LI-COR) by wet-blotting. The membranes were then stained with Revert Total Protein Stain (LI-COR) following the manufacturer´s protocol to detect total amounts of protein. Membranes were subsequently blocked for 1 h with Rotiblock (Roth) and incubated with primary antibody overnight at 4°C on a shaking platform. The antibodies used were: rabbit antibody against Alix (1:500; #ABC40, Millipore; for some experiments on the Suppl. Fig. another antibody (#2171 CST) was used at 1:400), mouse monoclonal against CNP (1:1000; #C5922, Sigma), rabbit monoclonal against CD81 (1:1000; #10037, Cell Signalling), rabbit antibody against EAAT1 (1:1000; #NB100-1869SS, Novusbio), rabbit antibody against EAAT2 (1:500; #NBP1-20136SS, Novusbio), mouse antibody against flotillin-1 (1:1000; #610820, BD Biosciences), mouse antibody against GM130 (1:1000; #610822, BD Biosciences), rabbit antibody against PLP (1:1000; #NB100-74503, Novusbio), rabbit antibody against P2Y12 (1:500; #LS-C209714, LSBio), mouse monoclonal antibody against PrP (POM1; 1:2000 [Citation49]), rabbit antibody against SNAP-25 (1:1000; #3926, Cell Signalling), rabbit antibody against synapsin1 (1:1000; #106103, Synaptic Systems), mouse monoclonal antibody against PSD95 (1:1000; # MABN68, Millipore), and mouse monoclonal antibody against TMEM119 (1:1000; #66948-1-Ig, Proteintech). After washing with TBST, membranes were incubated for 1 h with the respective HRP-conjugated secondary antibodies (1:1000, Cell Signalling) and subsequently washed 6× with TBST. After incubation with Pierce ECL Pico or Super Signal West Femto substrate (Thermo Fisher Scientific), chemiluminescence was detected with a ChemiDoc imaging station (BioRad) and quantified densitometrically using Image Studio software (LI-COR).
PNGase F assay
For removal of the N-linked glycans attached to PrP and its C1 fragment, sEV samples and total homogenates (TH) were digested with PNGase F (New England Biolabs) according to the manufacturer´s protocol.
Electron microscopy
Pellets from the 100.000xg centrifugation step were fixed with 4% PFA containing 2.5% glutaraldehyde in PBS and adsorbed in cellulose capillary tubes. Subsequently, the pellets were washed with PBS, post-fixed for 30 min with 1% OsO4 in PBS, washed with ddH2O, and stained with 1% uranyl acetate in water. The samples were gradually dehydrated with ethanol and embedded in Epon resins (Carl Roth) for sectioning. Ultrathin 50 nm sections were prepared using an Ultracut Microtome (Leica Microsystems). The sections were poststained with 2% uranyl acetate. Electron micrographs were obtained with a 2 K wide-angle CCD camera (Veleta, Olympus Soft Imaging Solutions GmbH) attached to a FEI Tecnai G 20 Twin transmission electron microscope (FEI) at 80kv.
Differential quantitative mass spectrometric proteomics
For proteomics, the final pellet containing either non-filtered or filtered (sEVs) EVs was resuspended in 10 mM of HEPES buffer pH 7.8. Twenty µg of protein per sample were diluted in 100 mM triethaylammonium bicarbonate (TEAB, Thermo Fisher) and 1% (w/v) sodium deoxycholate (SDC, Sigma Aldrich) buffer to a total volume of 100 µL. Subsequently, samples were incubated for 30 min at 60°C in the presence of 10 mM Dithiotreitol (DTT, Sigma Aldrich) to reduce disulphate bonds and 20 mM iodoacetamide (IAA, Sigma Aldrich) was added to alkylate cysteine residues. Proteins were subjected to tryptic digestion (1:50 protein to enzyme ratio, sequencing grade, Promega) over night at 37°C. SDC was precipitated by the addition of 1% formic acid (FA, Fluka), removed by centrifugation, and the supernatant was then dried in a vacuum centrifuge.
Per sample, 1 µg of peptides were separated on a 50 cm C18 reversed phase column (Acclaim PepMap100 C18, 3 μm, 100 Å, 75 μm × 50 cm) within a 60 min gradient from 2% to 30% acetonitrile (equilibration buffer: 0.1% formic acid; elution buffer: 99.9% acetonitrile and 0.1% formic acid) at a flow rate of 300 nL/min using a nano-UPLC system (DionexUltiMate 3000, Thermo Fisher Scientific), coupled via electrospray ionization (ESI) to a tribid mass spectrometer equipped with a quadrupole, an orbitrap, and an ion trap (Fusion, Thermo Fisher Scientific), using data dependent acquisition (DDA) mode in quadrupole-orbitrap-iontrap mode. Here, after a survey scan (orbitrap 400–1300 m/z, 2 × 10⁵ ions, 120 ms max fill time, 120,000 resolution), the most intense ions (charge stages 2+-5+, dynamic exclusion of 30 s) were fragmented and resulting fragment ions analysed by MS/MS within a cycle time of 3s (iontrap 28 normalised collision energy, HCD, 1 × 10⁴ ions, 60 ms max. fill time, 1.6 m/z isolation window).
The obtained peptide spectra were searched with the search engine Andromeda (integrated in MaxQuant software version 1.6.3, Max Planck Institute of Biochemistry, Munich, Germany) using the mouse Uniprot protein database (EMBL; Hinxton Cambridge, UK, release October 2019, 17,013 entries), with carbamidomethylation on cysteine residues as fixed modification and the oxidation of methionine as well as the protein N-terminal acetylation as variable modifications. The error tolerance for the first precursor search was 20 ppm, for the following main search 4.5 ppm. Fragment spectra were matched with a 20 ppm error tolerance. Label-free quantification and match between runs was enabled. False discovery rate for proteins and peptides was set to 1%.
Protein-protein interactions (PPI) network construction
Protein sets that were statistically significantly up/downregulated between filtered (sEVs) and non-filtered brain-derived EVs were analysed with the online database STRING (v11.0, https://string-db.org/) using a high-confidence score (cut-off ≥0.9) and the evidence mode in the settings [Citation50]. We further analysed the data using the FunRich 3.1.1 analysis tool for graphical representation of functional enrichment analyses [Citation51].
Statistical analysis
For statistical analysis of mass spectrometry results, the MaxQuant Protein Group output files were imported into the Perseus software (Max Planck Institute of Biochemistry, Munich, Germany). Proteins which had at least three valid values in at least one of the groups were kept for further analysis. Therefore, missing values were imputed by a downwards shifted normal distribution. Each sample was then normalized by the median protein area per sample and Student’s t-test, principal component analysis and hierarchical clustering was performed. Proteins were considered to be significantly different in abundance if the Student’s t-test based p value was ≤ 0.05 and at least a 1.5-fold change in either direction was observed.
The GraphPad Prism 8 statistic software program was used for statistical analysis of western blot, NTA and immunohistochemistry results. To assess differences between the THs and the corresponding sEVs,as well as between sEVs from sham and strokes in western blot, after passing a normality test, either a paired or unpaired t-test was used, respectively. NTA measurements were assessed by unpaired t-test. Statistical significance was considered when p values were as follows: *p < 0.05, **p < 0.005 and ***p < 0.001. Values are given as mean ± SEM. The exact p value is given in the text.
Results
Characterization of brain-derived EVs
Recently, the isolation of EVs from brain has become an important tool to study crucial events in the propagation of misfolded proteins in neurodegenerative diseases [Citation52]. We took advantage of a recently published protocol [Citation44] to study the expression of PrP in brain-derived EVs, and to assess the cell populations that mainly release EVs in both, steady-state conditions and after experimental stroke. Since the guidelines of the International Society for Extracellular Vesicles recommend to rather differentiate between small EVs (sEVs; ≤200 nm) and medium/large EVs (≥ 200 nm) instead of exosomes and microvesicles/ectosomes [Citation53], we introduced in the above-mentioned protocol an extra filtration step with a 0.22 µm filter before the samples were loaded in the sucrose gradient to differentiate between these two EVs pools (see Material and Methods). As shown in , six fractions from either non-filtered or filtered samples were collected and analysed by western blot. In the non-filtered samples, a higher amount of total protein (as shown with the total staining, TS) was detected in all fractions compared to the respective filtered ones, but in both cases fractions 3 to 5 (corresponding to a density of 1.11 to 1.25 g/mL as measured with the refractometer) were enriched in known markers of EVs such as the cytosolic protein Alix (96 kDa), the membrane-bound flotillin-1 (49 kDa), and the tetraspanin CD81 (26 kDa) [Citation53,Citation54]. GM130 (130 kDa), a resident protein of the cis-Golgi, was used as `proof of no contamination` marker. The total brain homogenate (TH) is shown for comparison. Fractions 3 (density 1.11 g/mL) and 4 (density 1.16 g/mL) were pooled for all further experiments. When assessed with transmission electron microscopy (TEM), non-filtered samples showed a combination of small and large vesicles, whereas in filtered samples the population appeared more homogeneous (). To confirm that the EVs could be marked and visualized by microscopy for further experiments, we labelled them using the mCLING dye, which has the capacity to emit fluorescence only when intercalated into the lipid bilayer [Citation55]. When isolated EVs were stained, fixed and mounted on coverslips, we compared the signal obtained by confocal microscopy with the one obtained by Stimulated Emission Depletion (STED) microscopy (). Due to the higher resolution, the blurred signal obtained with confocal microscopy (in green) was transformed to single dots corresponding to individual EVs in STED (in red), although some aggregates (probably corresponding to clustered EVs) were also present.
Figure 1. Characterization of brain EVs. (A) Representative western blots of the six fractions obtained after sucrose gradient centrifugation, from samples that were either passed through a 0.22 µm filter (filtered, sEVs) or not (non-filtered EVs). The total protein staining (TS, used as a loading control) shows a decrease in the total protein amount for the filtered samples. The cytosolic protein alix (96 kDa) and the membrane-bound proteins flotillin-1 (49 kDa) and CD81 (26 kDa), all considered as markers of EVs, were found in both cases mainly in fractions 3 and 4. The Golgi resident protein GM130 was used as a marker of non-EVs (negative control). (B) Representative transmission electron microscopy (TEM) images of pooled fractions 3 and 4 from non-filtered and filtered EVs. As seen for the TS in the western blot, the filtered fraction shows a decrease in EVs and a more uniform population. Scale bar represents 0.2 µm. (C) Confocal (green signal) and STED (red signal) images from pooled sEVs labeled with mCLING and the merge of both showing that, with high-resolution STED imaging, the blurry dots in the confocal correspond to single (or clusters of) EV particles. (D) Representative frames and concentration/size graphs from Nanoparticle Tracking Analysis (NTA) of pooled non-filtered and filtered EVs. Concentration (in particles/mL) and mean size (in nm) analysis of non-filtered pooled EVs (n = 3 preparations) and filtered pooled EVs (n = 4) show a significant reduction in concentration and mean size of EVs after filtration. Values are reported in the main text.
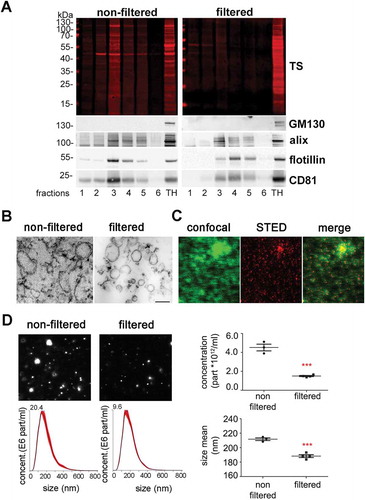
Finally, Nanoparticle Tracking Analysis (NTA, ) revealed a decrease in the number of events counted in the filtered (1.5x10¹² ±5.8x10¹⁰) compared to the non-filtered samples (4.5x10¹² ±3.5x10¹¹; p = 0.0002), together with a confirmatory decrease in mean EV size (211.7 ±1.9 nm in non-filtered vs 188.3 ±2 nm in filtered samples; p = 0.0004). Note that the filtered samples still contained some vesicles of more than 200 nm, suggesting that some larger EVs may squeeze through the 0.2 µm filter or representing clustered sEVs.
To assess whether the filtration step was helping to differentiate EV populations by their protein composition, we performed quantitative mass spectrometric proteome analysis of brain EVs isolated from WT mice with (n = 4) or without (n = 4) the 0.2 µm filtration step. A total of 1531 proteins were identified across all samples. shows the heat map corresponding to the proteins found to be relatively increased in non-filtered EVs (106 proteins; p ≤ 0.05) compared to filtered EVs and vice versa (121 proteins were significantly increased in filtered EVs compared to non-filtered, p ≤ 0.05). A list of all identified proteins is shown in Suppl. Table 1. The volcano plot in depicts the distribution of the proteins`fold-increase related to their p value. The names of proteins with a fold change either higher than a log2 value of 1, lower than a log2 value of −1, or with a minor log2 fold change but a log10 (p value) above 3 (highly significant) are provided in the volcano plot. Principal Component Analysis (PCA) shows separate clustering of both populations, filtered and non-filtered EVs (Suppl. Fig. 1). We next analysed proteins not found in filtered EVs in contrast to non-filtered EVs (and vice versa) considering proteins quantified in at least 3 out of 4 replicates per group and found that only 6 proteins were exclusively present in filtered EVs, whereas 34 proteins were exclusively present in non-filtered EVs (Suppl. Table 2).
Figure 2. Differential quantitative proteome analysis of non-filtered versus filtered brain-derived EVs. (A) Heat map of the proteins identified by proteomics that were significantly different from non-filtered compared to filtered brain EVs. (B) Volcano plot showing the log2 fold-change on the x-axis and the statistical significance on the y-axis for proteins that were significantly differently abundant in filtered versus non-filtered brain EVs. The names of proteins that had a fold-change ≥ 2 are shown in the plot. (C) Pie charts showing the gene ontology analysis (GO) of Molecular Function for the proteins that were found to be significantly increased more than 1.5-fold (log2 more than 0.58) using the FunRich analysis tool. The five most representative pathways showing the percentage of proteins belonging to these pathways are shown. (D) Protein–protein interaction analysis (STRING database) of the proteins that were significantly upregulated in non-filtered and in filtered EVs (log2 more than 0.58). In order to create the network, a confidence score threshold of 0.9 (very high) and no text-mining options were selected. KEGG pathways obtained by this analysis are shown for each group.
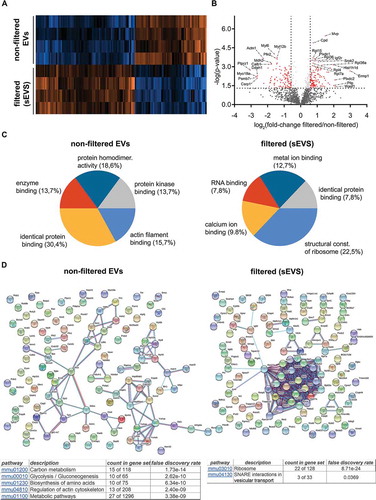
The list of proteins being present in significantly different amounts in the compared samples were further analysed with FunRich 3.1.1. Gene Ontology of Molecular Function of the enriched proteins. In filtered EVs analysis showed an increase of proteins related to translation (gene ontology term (GO) “structural constituent of ribosome” GO:0003735), whereas in non-filtered EVs we found a relative increase in proteins that interact selectively with identical proteins (GO:0042802, “identical protein binding”) . In order to visualize how these proteins are related, we also performed STRING analysis (). By using evidence settings and the highest stringency (0.09), we confirmed that many proteins related to ribosomal function were clustered together in filtered EVs. KEGG (Kyoto Encyclopaedia of Genes and Genomes) pathways analysis also show an enrichment of proteins related to ribosomal and SNAREs vesicular transport pathways for filtered EVs (see tables in ).
Assessment of the relative contribution of major brain cell types to the sEV pool indicates microglia as a dominant source of sEVs under physiological conditions
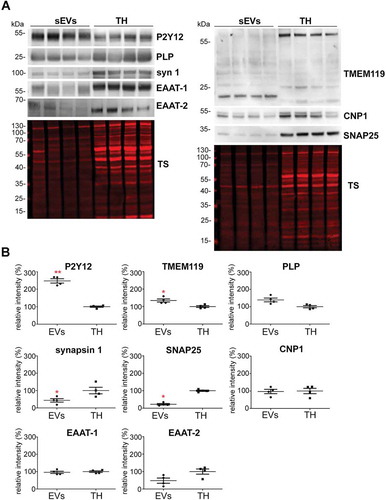
To study the relative contribution of different brain cell populations to the whole pool of brain sEVs in physiological conditions, we assessed enrichment of known cell type-specific markers in sEVs relative to their signal in total brain homogenate (TH) by western blot analysis (). Each sample’s signal was first referred to the respective signal of the total staining (TS) as a loading control and then, the mean value obtained in sEVs samples (n = 4) was compared to the mean value obtained in the corresponding TH (n = 4). Since it could be that a given marker protein is more strongly sorted into sEVs than others (and thus not directly indicating the relative contribution of this cell population to the total pool of sEVs), we decided to assess two (exclusively membrane-bound) marker proteins per cell type in order to reduce the risk of misinterpretation. The G-protein coupled P2Y receptor (P2Y12) and the Transmembrane protein 119 (TMEM119) were chosen as microglial markers [Citation56,Citation57]; PLP (proteolipid protein, a major component of the myelin sheath) and 2′-3′-Cyclicnucleotide 3′-phosphodiesterase (CNP) were used as oligodendrocyte markers [Citation58,Citation59]; synapsin1 and the Synaptosomal Nerve-Associated Protein 25 (SNAP25), present at the membrane of synaptic vesicles and at the pre/post-synaptic membrane respectively, were assessed as neuronal markers [Citation60–Citation65], and the Excitatory Amino Acid Transporters 1 and 2 (EAAT-1 and EAAT-2) were used as astrocytic markers [Citation66]. Quantifications are shown in . We observed that, in steady-state conditions, markers for microglia were mainly contributing to the pool of brain sEVs, as P2Y12 (2.5-fold increased; TH set to 100%±3.9%; sEVs: 247.5 ±12.4%; p = 0.0073) and TMEM119 (1.7-fold increased; TH set to 100% ±5.5%; sEVs: 168.7 ±8.6%; p = 0.0119) were most drastically enriched in the sEVs fractions compared to the TH. Interestingly, TMEM119 presented a band at around 55 kDa in the TH, whereas in the sEV-enriched fractions, a main band was observed around 20 kDa. Because four isoforms have been described for TMEM119, this lower band could correspond either to a truncated version of TMEM119 or to one of the four isoforms, probably also lacking the O-glycan modification [Citation67]. The oligodendrocyte marker PLP showed a slight yet non-significant relative increase (TH was set to 100% ±4.7%; sEVs: 138.9% ±11%;p = 0.1), whereas the other oligodendrocyte marker CNP1 revealed no differences (TH set to 100% ±15.3%; sEVs: 97.2% ±12.4%). In contrast, the neuronal marker synapsin 1 (syn-1; TH set to 100% ±12.9%; sEVs: 78.1% ±4.9%;p = 0.050) and SNAP25 (TH set to 100% ±3.7%; sEVs: 22.4% ±4.3%;p = 0.0018) were significantly decreased in the sEVs in comparison to the TH, thus implying that neuronal sEVs rather represent a minor fraction in the brain sEV pool under normal conditions. The presence of SNAP25 and synapsin 1 could indicate synaptosomal contamination due to the EVs isolation procedure. However, another protein highly enriched in synaptosomes, the post-synaptic density protein 95 (PSD95), was not detectable in EVs by western blot, thus excluding a major synaptosomal contamination (Suppl. Fig 2). Lastly, the astrocytic markers EAAT-1 and EAAT-2 showed no significant differences in sEVs compared to the TH (for EAAT-1: TH set to 100% ±4.6%; sEVs: 95.9% ±6.7%/for EAAT-2: TH set to 100% ±14.8%;sEVs: 48% ±14.8%), indicating presence but no relative enrichment of astrocytic sEVs in the total pool (). Thus, neurons and astrocytes only show a moderate contribution to the total sEVs pool in brain, whereas oligodendrocytic and, significantly, microglial sEVs are relatively enriched.
Figure 3. Microglia cells are the main contributor to the physiological brain sEV pool. (A) Representative western blots of pooled fractions 3 and 4 of filtered EVs (sEVs; n = 4) compared to their respective total brain homogenates (TH). P2Y12 and TMEM119 were chosen as markers of microglia, PLP and CNP as markers of oligodendrocytes, synapsin1 and SNAP-25 as neuronal markers, and EAAT1 (GLAST) and EAAT2 (GLT-1) as markers of astrocytes. Of note, TMEM119 presented a lower band (at around 20 kDa) in the sEVs-enriched fractions instead of the reported 60 kDa band (approx.) observed in the TH. This could correspond to an isoform or a truncated version of TMEM119. (B) Scatter plots showing relative intensity quantifications of each cell type marker. Each lane was first referred to its total protein staining (TS) signal and the means of each group (sEVs vs. TH) were then compared in order to check for relative enrichment (with TH set to 100%). P2Y12 and TMEM119 are approximately 2.5 and 1.5 times enriched in sEVs compared to the TH, indicating a dominant contribution from microglia to the whole pool of brain sEVs. Synapsin1 and SNAP-25 are significantly decreased compared to the TH, suggesting a low contribution of neuronal sEVs to the total pool. PLP, CNP, EAAT1 and EAAT2 did not show any significant differences compared to the TH. Exact mean, SEM and p-values are given in the main text.
Brain-derived EVs are enriched in the cellular prion protein
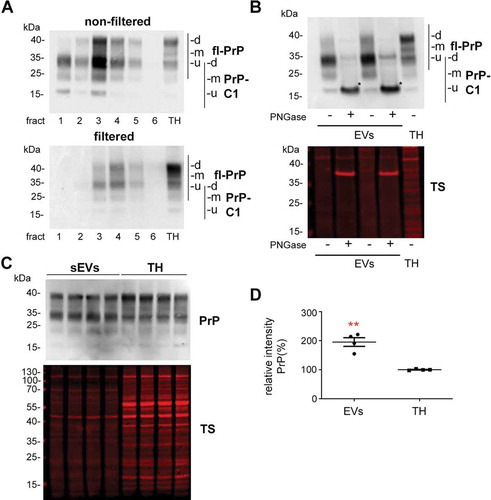
Since we were also interested in PrP as both, a known resident of EVs and a protein that was shown to act neuroprotective in ischaemic insults, we performed western blot analyses of filtered and non-filtered EV-enriched fractions. As expected, and shown in , PrP is present in both, non-filtered and filtered EVs. Interestingly, in both cases, the pattern of PrP in EVs is different compared to the TH when visualized with the POM1 antibody raised against the C-terminal part of PrP [Citation49]. It should be noted that the combination of gels and protein ladder used here resulted in bands running at higher molecular weight than expected. Hence, for the TH we could observe the typical banding pattern of PrP with a prominent diglycosylated band at around 40 kDa (commonly running at ~35 kDa) followed by two lower and less conspicuous bands corresponding to mono- and unglycosylated full-length (fl) PrP. In the EV fractions, apart from a diglycosylated fl-PrP band, a major band at 34 kDa was present, which could either represent unglycosylated fl-PrP or its diglycosylated C1 fragment (usually running at ~25 kDa) [Citation41]. In order to discriminate between these two forms, we treated the sEVs and the TH fractions with PNGase to enzymatically remove the N-linked glycans (). This revealed that the dominant band in the EVs fractions indeed represents the C1 fragment of PrP (here running at ~18 kDa-corresponding to ~15 kDa in other systems upon deglycosylation). When amounts of total PrP in sEVs were compared to the respective levels in TH (), we found that PrP is significantly enriched in brain-derived sEVs (PrP in TH set to 100% ±21.8%; sEVs: 195.5% ±14.9%; p = 0.0073).
Figure 4. Brain EVs are enriched in PrP and its C1 fragment. (A) Representative western blots of the six fractions obtained after sucrose gradient centrifugation of non-filtered (EVs) and filtered EVs (sEVs) probed with POM1 antibody. A total homogenate (TH) was loaded for comparison. Note that PrP in the TH presents with a prominent diglycosylated full-length band (fl-PrP) at 43 kDa followed by two lowerbands, corresponding to mono- and unglycosylated PrP, respectively. In EVs, a major band at 34 kDa is presented which could either correspond to unglycosylated fl-PrP or to its diglycosylated truncated C1 fragment (PrP-C1). (B) Representative Western blots of EV fractions 3 and 4 treated (+) or not (-) with PNGase F and probed with POM1 and total protein staining (TS). The PNGase digestion reveals that the major band at 34 kDa present in the EVs corresponds to the C1 fragment (marked with an asterisk). (C) Representative Western blots of pooled sEVs (n = 4) compared to their respective total brain homogenates (TH) probed with POM1 and total protein staining (TS). (D) Scatter plot showing the quantification of the comparison between total PrP in the TH versus sEVs. PrP shows a significant twofold increase in sEVs relative to the TH. Each lane was first referred to its total protein staining and then the means for total PrP in sEVs and TH were compared. The mean, SEM and p-values are stated in the main text.
Since the identity of the protease(s) responsible for the α-cleavage of PrP is still unknown [Citation40,Citation68], it could be that the enrichment in PrP-C1 is an artefact caused by the collagenase III treatment used for EVs isolation. Therefore, we also examined isolated sEVs with collagenase IV (which has a lower tryptic activity), and we assessed the 300xg pellet, which also underwent the enzymatic treatment but is theoretically devoid of EVs. As shown in Suppl. Fig. 3A, we observed that, in fact, the PrP-C1 fragment was present in the 300xg pellets, indicating a partial cleavage due to the enzymatic treatment. As TMEM119 was another protein showing a cleavage (or a spliced form) in EVs, we also checked the influence of collagenease III treatment in this instance, but we could not see this fragment in the 300xg pellet (Suppl. Fig. 3B) concluding that the fragment (or spliced form) of TMEM119 is sEVs specific. Since we consistently observed that the amounts of PrP-C1 in the 300xg pellets were still lower than in the EV fraction, we decided to study EVs isolated from cell culture supernatants, which do not require enzymatic treatment. As shown in Suppl. Fig. 4, we observed that in two different mouse cell lines (N2a (neuroblastoma) and mHippoE-14 (embryonic hippocampal)), PrP-C1 is indeed enriched in EVs relative to the corresponding cell lysates, as shown after the PNGase treatment (for N2A cells: 35.8%±1.6% (EVs) vs 16.1%±0.9% (TH), p = 0.0004, n = 3; for mHippoE-14: 45% (EVs) vs 31% (TH) n = 1 pooling 4 dishes). Thus, although we here refrain from quantifying PrP-C1 levels in brain-derived EVs (due to a seemingly partial artificial contribution of the collagenase treatment), our experimental data from murine brain and neuroblastoma/embryonic hippocampal cell lines clearly point to a physiological enrichment of PrP-C1 in EVs.
Increased release of sEVs by astrocytes and elevated levels of PrP in brain-derived sEVs after experimental stroke (tMCAO)
To study changes in the relative contribution of different cell populations to the sEV pool in brain at 24 h after tMCAO, we performed western blot analyses with the brain cell markers described above, comparing sEVs isolated either from sham (n = 8) or from tMCAO-operated mice (n = 8) (). We observed that only the levels of the astrocytic marker EAAT1 were significantly increased in sEVs after tMCAO (shams were set to 100% ±5.6% vs tMCAO, 134.2% ±11.1%; p = 0.0158), indicating that at 24 h after stroke reperfusion injury there is an increased release of sEVs by astrocytes. Although there was a slight tendency of increase for oligodendrocytic PLP (shams set to 100% ±4.2% vs tMCAO, 158.4% ±34.1) and microglial P2Y12 (shams set to 100% ±4.3% vs tMCAO, 110.8% ±16.8%), these changes were not significant. The neuronal marker synapsin1 was not changed between shams and tMCAO samples (shams set to 100% ±8.7% vs tMCAO, 102% ±10%).
Figure 5. Contribution of astrocytes to the brain sEV pool is upregulated and PrP levels on brain sEVs are increased 24 h after tMCAO. (A) Representative western blots of sEVs from sham mice (n = 8) and mice that underwent the tMCAO procedure (n = 8). Blots show the total protein staining (TS) and cell type-specific surface markers: PLP for oligodendrocytes, P2Y12 for microglia, synapsin1 for neurons, and EAAT1 for astrocytes. On the right, scatter plots of relative intensity quantifications show a significant increase of the astrocytic marker EAAT1 in tMCAO sEVs compared to sham sEVs. PLP, P2Y12 and synapsin1 were not significantly changed. For quantification each lane was first referred to the TS and then the mean values of the two experimental groups were compared. (B) Representative western blots of sEVs from sham (n = 8) and tMCAO mice (n = 8) probed with POM1 antibody and total protein staining (TS). On the right side, scatter plot of relative intensity quantifications showing an increase in total PrP in tMCAO sEVs compared to sham sEVs. The mean, SEM and p-values are reported in the main text.
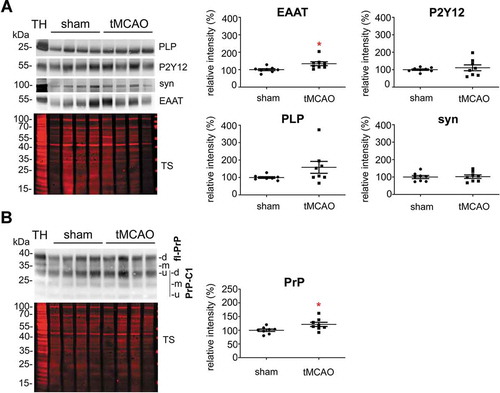
Notably, a significant increase was also seen for total PrP (), which was enriched in sEVs from tMCAO samples compared to sham brains (shams set to 100% ±4.4% versus strokes: 121.47% ±7.6%; p = 0.0284).
As shown in Suppl. Fig. 5, neither levels of PrP nor the proteins used as cellular markers were altered in the TH from stroked (tMCAO) compared to sham-treated mice, demonstrating that the observed changes were exclusive for the brain-derived sEVs. Of note, no differences were observed in the overall amounts of sEVs isolated (as assessed by NTA) between shams and tMCAO-operated mice or in the distribution of EVs marker proteins in tMCAO-operated mice, as shown in Suppl. Figures 6C and 6D.
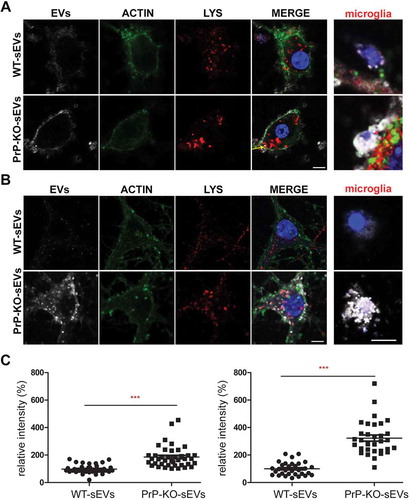
Figure 6. PrP influences brain sEVs uptake by primary neurons. (A) Representative confocal microscopy images of primary neurons from WT mice in high-density culture (HDC) incubated for 1 h with sEVs isolated from either WT (WT-sEVs) or Prnp0/0 mouse brains (PrP-KO-sEVs) and labelled with mCLING dye. Small EVs signals are shown in white. Neurons were stained with phalloidin (green; to visualize F-actin), the lysosomal marker LAMP-1 (red), and with DAPI (blue; to visualize the nucleus). Note that after 1 h of incubation, WT-sEVs present with a weak and rather diffuse staining at the neuronal plasma membrane, whereas PrP-KO-sEVs show a dotty staining at the neuronal plasma membrane with some PrP-KO-sEVs being present inside the neuronal cell body (yellow arrow). In this HDC condition, other cell types (apparently microglia based on their morphology in culture) were observed to take up a few WT-sEVs, yet conspicuously much higher amounts of PrP-KO-sEVs. (B) Representative confocal images of low-density culture (LDC) primary neurons from WT mice incubated for 1 h with sEVs isolated from WT (WT-sEVs) or PrP-KO mouse brains (PrP-KO-sEVs) labelled with mCLING as in (A). Here again, PrP-KO-sEVs (showing a distinct dotty pattern inside neurons) are taken up more readily than WT-sEVs. Cells presumed to be microglia cells (see also ) showed a similarly strong engulfment pattern for sEVs from PrP-KO brain as in (A). Scale bar is 5 µm. (C) Scatter plot showing intensity of sEVs quantification in high-density (HDC, on the left) and low-density primary neuronal cultures (LDC, on the right). PrP-KO-sEVs are significantly more taken up by neurons after 1 h than WT-sEVs. The mean, SEM and p-values are given in the main text.
PrP influences uptake of brain-derived sEVs by primary neurons and glia cells
Isolated brain-derived EVs are enriched in PrP and PrP-C1. The C1 fragment, resulting from the α-cleavage in the middle of the PrP sequence, exposes a hydrophobic domain at its N-terminus [Citation41]. Both, the structural aspect with an exposed stretch of hydrophobic amino acids and its dependence on proteolytic “activation” are strikingly reminiscent of some viral surface glycoproteins critical for host cell attachment and membrane fusion (for instance those of some paramyxoviruses). In these viruses, the viral envelope fuses with the host cell membrane with the help of two glycoproteins, one that initially attaches the virus and another one that, after an endoproteolytic cleavage, exposes the highly hydrophobic fusion peptide, which integrates into the host cell membrane and mediates the fusion process [Citation69,Citation70]. Because of the similarities between PrP-C1 and the fusogenic viral surface proteins, and given the relative enrichment of PrP-C1 in EVs, we hypothesized that the C1 fragment might act as a tethering factor and play a role in the uptake of EVs by cells [Citation41]. To assess this potential role of PrP in EVs, we incubated primary neuronal cultures from WT mice with labelled sEVs isolated from either WT or PrP-KO mouse brain (Suppl. Fig. 6A) and fixed them after 1, 3, or 6 h of incubation. Of note, PrP-KO sEVs were isolated from the same density fraction as WT-PrP sEVs they did not present differences in the expression of EVs marker proteins (Suppl. Fig. 5B). Moreover, no differences were detected in the amount of isolated brain-derived sEVs between PrP-WT and PrP-KO mouse brain samples after measuring the number of particles with NTA (Suppl. Fig. 6 C).
As shown in Suppl. Fig. 7, the sEVs labelling with mCling was specific as incubation with a dye that has went through the same preparation procedure but without presence of sEVs, showed no staining when incubated with primary neurons.
As shown in , after 1 h of incubation, labelled sEVs from WT (shown in white) presented as a rather diffuse staining surrounding the neuronal cell body (marked by phalloidin-based staining of the actin cytoskeleton in green), whereas the PrP-KO-sEVs showed a dotty staining at the plasma membrane and, to some extent, inside cells, indicating that some of the particles had already been internalized at this early time point. Surprisingly, we also observed that our primary neuronal cultures (which presented staining for MAP2 as shown in Suppl. Fig. 8) contained some microglia, despite having been treated with Arabinoside C to eradicate proliferating cells. In several instances, these microglia were found to contain high amounts of PrP-KO-derived sEVs, a feature that we could not observe for WT-derived sEVs (, ). We then established another protocol for primary neuronal cultures from WT mice (low-density culture, LDC), where neurons grow in co-culture with (yet spatially separated from) astrocytes [Citation48]. On the one hand, this approach allows for lower seeding density and, therefore, improved microscopic analysis, while on the other hand, contamination by other brain cell types is sensibly lower. As shown in , we could again confirm a strong difference in the neuronal uptake behaviour, with PrP-KO-derived sEVs being efficiently taken up in contrast to sEVs from WT brain (which at 1 h of incubation were hardly detectable in the culture). Moreover, although microglia were much less and therefore more difficult to find in this type of culture, the few microglia cells that could be identified were also highly decorated with PrP-KO-sEVs, whereas microglia showed less positive sEV-associated labelling when treated with WT-derived sEVs.
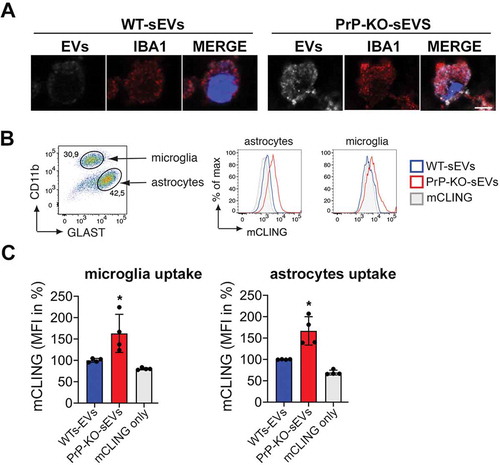
Figure 7. PrP also affects the uptake of brain-derived sEVs by microglia and astrocytes. (A)Confocal microscopy images confirming that the non-neuronal cells observed in our HDC and LDC neuronal cultures from WT mice () are indeed microglia, as they stain positive for IBA1. As in , sEVs are labelled with mCLING and shown in white. DAPI (in blue) is used as a nuclear staining. (B) Representative FACS plot of astrocytes (GLAST+) and microglia (CD11b+) from mixed cultured primary glia cells (n = 4). Mixed glia cells from WT mice were incubated for 3 h with equal amounts of either WT-sEVs or PrP-KO-sEVs labelled with mCLING and analysed for sEVs uptake using flow cytometry. On the right side, histograms showing the intensity of the sEVs fluorescence measured from astrocytes or microglia. Note that in both cases the intensity (mCLING mean fluorescence intensity (MFI) shown in %, WT is set to 100%) is higher for PrP-KO-sEVs. (C) Bar scatter plots of normalized fluorescence intensity show that both, microglia and astrocytes, take up PrP-KO-sEVs more efficiently than WT-sEVs. The exact means, SEM and p-values are reported in the main text.
The quantification in shows that the neuronal uptake in the primary culture with higher amounts of microglia (HDC; ) was almost twofold increased for the PrP-KO-derived sEVs than for WT-derived sEVs (WT-sEVs: set to 100%±5.3%; PrP-KO-sEVs: 185.8%±12.5%; p ≤ 0.0001), while in the LDC with low microglia content (), neuronal uptake of sEVs from PrP-KO brain was about three times higher compared to WT-sEVs (WT-sEVs: set to 100%±8.6%; PrP-KO-sEVs: 323.3%±22.1%; p ≤ 0.0001). We hypothesize that this difference between the culture conditions could either be a consequence of the lower number of neurons or the reduction in microglia in the LDC, both resulting in a higher sEV-to-neuron ratio.
In order to confirm that microglia efficiently take up PrP-KO-sEVs, we established mixed glial cell cultures (containing microglia and astrocytes) and incubated them with either WT-sEVs or PrP-KO-sEVs for 3 h (). This type of culture allowed us to measure the sEVs uptake not only by microglia but also by astrocytes (which were absent in our previous primary neuronal cultures). After incubation with sEVs we labelled the two populations with cell type-specific markers (GLAST-1 for astrocytes and CD11b for microglia) and performed flow cytometric analysis (). As quantified in , we could confirm that microglia take up significantly more PrP-KO-sEVs than WT-sEVs (WT-sEVsset to 100% ±2.5% vs PrP-KO-sEVs: 163.2% ±22.3%; p = 0.035). In addition, similar to what we observed for neurons and microglia, PrP-KO-sEVS were also taken up more efficiently by astrocytes (WT-sEVs set to 100% ±2.6% vs PrP-KO-sEVs: 166.9% ±16.6%; p = 0.0068).
Regarding the neuronal uptake after 3 h (), treatment with WT-sEVs in the HDC again revealed a diffuse staining of the sEV-labelling at the plasma membrane, although seemingly more intense than after 1 h (). In addition, some sEVs could now be detected as vesicle-like structures at the plasma membrane or even internalized and colocalizing with the lysosomal marker LAMP-1, fitting to lysosomes being described as one of the major targets of internalized EVs [Citation71,Citation72]. In the case of PrP-KO-sEVs, although some signal was still detected at the plasma membrane, the vast majority at this time point was observed inside the neurons and colocalizing with LAMP-1. Quantification of sEVs signal intensity inside neurons () showed that at 3 h still about the double amount of PrP-KO-sEVs was taken up compared to WT-sEVs (WT-sEVs set to 100% ±7.45% vs PrP-KO-sEVs: 219% ±16.3%; p ≤ 0.0001).
Figure 8. Brain-derived sEVs are found in lysosomes after 3 and 6 h of incubation. (A) Representative confocal microscopy images of primary neurons from WT mice (labelled with phalloidin, in green) in high-density culture (HDC) incubated for 3 h with WT-sEVs or PrP-KO-sEVs labeled with mCLING (white signal). The lysosomal marker LAMP-1 is shown in red and nuclei are stained with DAPI (in blue). Note that both, WT- and PrP-KO-sEVs, co-localize with LAMP-1, although we consistently observed a much higher level of colocalization for PrP-KO-sEVs. Instead, a rather diffuse mCLING staining at the membrane is found for cells treated with WT-sEVs. White arrows highlight sEVs located at the plasma membrane (PM), whereas yellow arrows indicate colocalization of sEVs with LAMP-1. Note that for WT-sEVs there are many sEVs found at the plasma membrane, whereas PrP-KO-sEVs much stronger colocalize with LAMP-1. (B) Representative confocal microscopy images showing primary neurons as in (A) but incubated with sEVs for 6 h. sEV identity and stainings as in (A). Note that after 6 h sEV-associated signals are mainly found in colocalization with lysosomes. Scale bar is 5 µm. (C) Scatter plots showing intensity quantifications of WT-sEVs and PrP-KO-sEVs in primary neurons at 3 h (on the left) and 6 h (on the right) of incubation in the HDC. As for 1 h (Figure 5), PrP-KO-sEVs are significantly more taken up by neurons than WT-sEVs. Mean, SEM and p-values are reported in the main text.
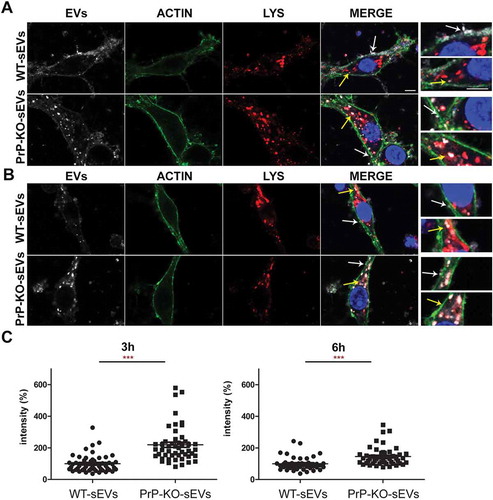
At the latest time point assessed in this study (6 h of incubation), the majority of both, WT- and PrP-KO-sEVs, were found inside neurons and colocalizing with LAMP-1 (). Again, quantification of the sEVs-associated fluorescence signal present inside the neurons still revealed a higher amount of uptaken sEVs from PrP-KO compared to those derived from WT brain (WT-sEVs set to 100% ±6.6% vs PrP-KO-sEVs: 145.37% ±8.56%; p ≤ 0.0001). For the LDC condition (Suppl. Fig. 9), results obtained at 3 h and 6 h were similar to the ones mentioned above for the HDC (for 3 h incubation: WT-sEVs set to 100% ±3.46% vs PrP-KO-sEVs: 214% ±17.58%; p ≤ 0.0001/for 6 h incubation: WT-sEVs set to 100% ±5.6% vs PrP-KO-sEVs: 187% ±14%; p ≤ 0.0001).
Discussion
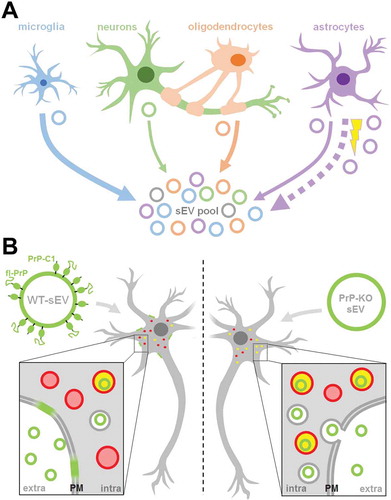
In the present study, we have characterized sEVs in the murine brain in steady-state conditions and after 24 h of stroke-reperfusion. We show that, under physiological conditions, microglia are the main sEVs source in brain. This situation changed at 24 h after induced stroke-reperfusion, where a significant increase of astrocytic sEVs was observed. Furthermore, we show that EVs isolated from murine brain and brain-derived cell lines are enriched in PrP and its C1 fragment, with consequences in the regulation of vesicle uptake by recipient cells. Accordingly, when sEVs lack PrP, their uptake by neurons is increased and, conspicuously, they are also more readily taken up by microglia and astrocytes. Moreover, PrP-KO-sEVs were found to colocalize with lysosomes much faster than WT-sEVs. We also demonstrate that, 24 h after stroke, the amount of PrP in brain sEVs is even further increased, which may have functional consequences in intercellular communication after stroke (a graphical summary of the principal findings is depicted in ).
Figure 9. Summarizing scheme. (A) Schematic representation of the relative contribution of different brain cell types to the sEV pool in murine brain. Under physiological conditions, microglia appear to be the main contributor to the sEV pool, followed by oligodendrocytes and astrocytes, while neurons contribute relatively little (contribution indicated by thickness of solid arrows). Upon experimental stroke (indicated by the yellow thunderbolt), astrocytic release of sEVs is upregulated and astrocytes appear to be the main contributor 24 h after reperfusion (indicated by the bold dotted arrow). sEVs are depicted as circles and the color refers to their cellular origin. Note that a fraction of sEVs (grey) may also be released by other cell types not assessed here, such as pericytes or endothelial cells. (B) Differential uptake of WT-sEVs and PrP-KO-sEVs may be influenced by PrP. WT-sEVs (on the left) are packed with fl-PrP and its truncated C1 fragment ending with a stretch of hydrophobic amino acids. These sEVs are relatively slowly taken up by neurons and rather seem to fuse with the plasma membrane (PM). In contrast, sEVs lacking PrP (PrP-KO-sEV; on the right) are rapidly endocytosed and transported to lysosomes (red circles). Colocalization (i.e. lysosomes containing sEVs) is indicated in yellow. Similar observations have been made with microglia or astrocytes as recipient cells. Note that other surface proteins and cargo of sEVs, as well as the lipid bilayer of vesicles, lysosomes, and sEVs, are not depicted here to simplify matters.
EVs have become an intense field of research, not only because they represent a novel form of cell-to-cell communication able to bridge wide distances, but also by their potential applicability as therapeutic tools. In the case of brain disorders, they are very attractive because of their property to cross the BBB when genetically modified to target the brain [Citation73]. A protective role of EVs derived from mesenchymal cells in a variety of brain insults and disorders [Citation74], including stroke [Citation34,Citation75–Citation77], has also been shown. Until recently, most of the EVs assessed in various studies were isolated from cell culture supernatants or body fluids. Isolation of EVs from complex tissue such as the brain parenchyma has been increasingly reported in the last few years only [Citation44,Citation78,Citation79].
Despite enormous progress in recent years, isolation, characterization and categorization of EVs remains a challenge. One of the aims of our study was to characterize the differential contribution of the brain cell populations to the EVs pool in normal conditions and to assess potential changes 24 h after ischemia-reperfusion in the tMCAO mouse model of stroke. We modified a published protocol of EV isolation from brain [Citation44] by including a filtration step (frequently used in other brain-derived EVs isolation protocols [Citation78,Citation80–Citation85]) to differentiate between small EVs (≤200 nm) and EVs larger than 200 nm, because NTA measurements showed that the non-filtered population was, in average, bigger than 200 nm. We performed this step to yield, at least by size, a homogeneous population for our downstream analyses (sEVs) [Citation86]. Our proteome analysis revealed that in both, filtered and unfiltered EVs, proteins defined as markers of exosomes and EVs (CD9, Rab11, VSP4T, V-ATPases, CD81, tau, flotillins, Alix, Thy-1, 14.3.3), and proteins that have been described to be present in microvesicles only (Annexin 1) [Citation87,Citation88], were present as expected. In addition, as supported by the volcano plot and the PCA analysis, we observed two differentiated populations, with the filtered sEVs being particularly enriched in proteins related to ribosomes, whereas the non-filtered EVs (though also including the sEV pool) were enriched in proteins associated with metabolic pathways. Thus, our brain-derived sEVs likely represent a mixture of bona fide exosomes and small microvesicles [Citation53], but the additional filtration step further concentrates a population (enriched in SNARE, ribosomal proteins and ribosomal-binding proteins) that differs from the non-filtered population. Since categorization and definitions of EVs are increasing in complexity [Citation53,Citation88], our present findings with brain-derived EVs deserve further studies to pinpoint the exact nature of these EVs.
Because the cargo of EVs is cell type-dependent and includes proteins that reflect their cellular origin, we sought to investigate the relative contribution of different cell types to the total brain sEVs pool by assessing the relative enrichment (compared to TH) of certain brain cell markers by western blot. We show that, in steady-state conditions, P2Y12 and TMEM-119, two known markers of microglia, are significantly enriched in the pool of mouse brain sEVs.On the contrary, the neuronal markers synapsin1 and SNAP-25 showed a relative decrease, indicating a rather minor contribution to the total sEVs brain pool. The fact that SNAP-25 is enriched at the pre- and post-synaptic terminal and synapsin1 is a protein marker of synaptic vesicles, could potentially indicate synaptosomal contamination as an artefact produced during tissue preparation. However, since these two proteins are also found in EVs isolated from cerebrospinal fluid (CSF), this rather suggest them as being de facto components of neuronal EVs [Citation62,Citation63,Citation65]. Oligodendrocytes (assessed with PLP and CNP1) and astrocytes (detected with EAAT-1 and EAAT-2 as exclusive markers) showed no enrichment in sEVs when compared to the TH and, therefore, we concluded they are not the major populations that contribute to the brain sEVs pool in steady-state conditions. We cannot rule out the possibility that certain (marker) proteins are more heavily packed into EVs than others, but we are confident that the use of two markers for each cell type and the fact that they were behaving similarly, reduces the risk of misinterpretation and ensures more reliable results regarding the relative contribution of different cells. Relative quantification of EVs in brain is not an easy issue. In a recent paper, Silverman et al. [Citation89] have also characterized the relative proportion of EVs derived from different brain cell populations. By means of flow cytometry and in contrast to our findings, they observed an increased proportion of astrocytic and neuronal markers in both, brain- and spinal cord-derived samples. The discrepancy with our results could well be a consequence of (i) the investigation of different subpopulations of EVs (note that we included a 0.2 µm filtration step) and (ii) the detection limit of flow cytometry possibly excluding some small vesicles that were considered as debris (yet were included in the western blot analyses of our study). It has been calculated that sEVs are at least one order of magnitude more frequent than medium/large EVs [Citation90,Citation91] and this pool may have been lost by flow cytometry measurements.
What we observed, under the same settings used for the study of sEVs in the steady-state condition is that, 24 h after stroke-reperfusion, the brain sEV pool was altered as sEVs containing the astrocytic marker EAAT-1 were significantly increased. Astrocytes have multiple important functions in the brain, ranging from regulation of synaptic transmission, modulation of neuronal excitability, BBB formation, and regulation of blood flow. Since they are relatively resistant to glucose and oxygen deprivation, they cope better than neurons with ischemic insults and, at present, they are raising attention as potential targets in stroke therapy [Citation92]. At earlier times points after ischaemia, astrocytes proliferate, become hypertrophic (reactive astrogliosis) and, after a few days, start to form the glial scar with both, potential benefits but also detrimental effects [Citation93,Citation94]. Likewise, microglia are significantly increased at 24 h in a mouse model of stroke [Citation19]. Since there is close communication between astrocytes and microglia after brain injury, and given that activated astrocytes can in turn contribute to the activation of distant microglia after ischaemia [Citation95], it may be that an elevated release of EVs from astrocytes at 24 h is a factor facilitating the recruitment of reactive microglia. Moreover, astrocytes present neuroprotective features after stroke [Citation96] and, fittingly, neurons exposed to reactive oxygen species (ROS) showed increased survival when treated with astrocytic EVs [Citation97]. Whether the relative increase in astrocytic sEVs is related to microglia proliferation, the formation of the glial scar, or protection against ROS, clearly deserves further studies. Interestingly, Guitart et al. [Citation38] showed that exosomes released by astrocytes under hypoxic conditions (using the in vitro model of oxygen-glucose deprivation, OGD) conferred protection to neurons. Of note, this activity was dependent on the presence of PrP, which they also found increased in exosomes derived from stressed astrocytes. Contrarily, exosomes from stressed astrocytes devoid of PrP were not protective [Citation38]. In our experiments, apart from the increase in astrocytic sEV release, we also observed an increase in sEV-associated PrP levels after stroke. It should be noted that, due to technical limitations, we could not assess whether these changes in sEV-associated PrP are caused by the alterations in the relative contribution of cell types to the sEV pool. However, in view of the reported neuroprotective effects of PrP after ischaemia [Citation31,Citation34,Citation37] this increase in both, astrocytic sEVs and sEV-associated PrP amounts, could represent a protective feedback mechanism to counteract the oxidative stress present in the first hours after stroke. Although an increase in PrP levels has been observed in animal models of stroke and in humans after ischaemic insult [Citation35,Citation36,Citation98,Citation99], the present study is the first to report elevated levels of this protein in brain-derived sEVs. However, further studies are clearly required to elucidate its consequences.
We also observed that the proteolytically generated PrP-C1 fragment is enriched in sEVs. Although part of the presence of PrP-C1 is provoked by the collagenase treatment, the study of two neuronal cell lines further confirmed that PrP-C1 is enriched in EVs. Interestingly, Vella et al. [Citation100] already described that EV-associated PrP was largely not recognized with antibodies against the N-terminal part of the protein, indicating truncation. In agreement with that, we show here that the main PrP forms packed onto sEVs in the brain are PrP-C1 together with fl-PrP (with both primarily being in their diglycosylated state). We had already suggested a parallelism between the hydrophobic domain, which is N-terminally exposed in C1 after the α-cleavage of PrP, and the fusion peptides of certain viral surface proteins [Citation41]. Because the latter allows viruses to dock to and fuse with the host cells, we hypothesized that PrP-C1 on EVs could perform a similar function, such as tethering EVs to recipient cells and/or facilitating their uptake. The fact that EVs also share many similarities with viruses [Citation101,Citation102] would reinforce our hypothesis. Surprisingly, we found that, as early as 1 h after incubation, labelled brain-derived sEVs lacking PrP are readily taken up and present inside neurons (and glia cells), whereas sEVs from WT mice are poorly taken up, but rather present as diffuse staining surrounding the neuronal body. At later time points, although WT-sEVs are also engulfed and start to colocalize with lysosomes, there are still significant differences compared with PrP-KO sEVs, with the latter being more massively taken up and colocalizing with lysosomes [Citation103]. This seems counterintuitive with our initial hypothesis since our findings rather indicate that a lack of PrP leads to more efficient uptake. However, it has been shown that EVs can either fuse with the plasma membrane, thereby releasing their content into the cytoplasm, or they can be taken up by clathrin/caveolin-dependent mechanisms or by phagocytosis and macropinocytosis [Citation104]. Since we always treated cells with the same amount of sEVs yet consistently detected more endocytosed PrP-KO sEVs, this could indicate that presence of PrP and/or PrP-C1 (in WT-sEVs) indeed influences fusion events. This may also be supported by the diffuse sEV-associated staining at the plasma membrane observed for cells incubated with WT-sEVs. In contrast, in the absence of PrP it seems that vesicles are taken up more quickly by other mechanisms and delivered to certain organelles (in this case lysosomes). Thus, modulation of PrP composition could regulate EV fusion versus uptake and, consequently, influence whether EV cargo is released to the cytoplasm or intracellular compartments, respectively. Nevertheless, we cannot completely rule out the possibility that other gene products (e.g. flanking genes) possibly affected by the knock-out strategy [Citation29]or PrP binding partners altered in Prnp0/0 mice could potentially influence this aspect. Moreover, as detergent-resistant domains in the membrane can be modified (at least in vitro) by the presence of GPI-anchored proteins [Citation105], we can likewise not exclude that an altered lipid composition of EVs is partially responsible for the differential uptake. Further studies including lipidomic profiling would clarify this point.
It has been reported that fusion of EVs with purified membrane sheets in a cell-free system requires the presence of proteins at the surface of both entities and an acidic pH [Citation106]. Our data suggest that PrP and PrP-C1 may be relevant EVs residents in this initial EV-to-target cell interaction. However, given that, at a later time-point, we observed both, WT- and PrP-KO-sEVs, to colocalize with LAMP-1, final subcellular targeting of at least a fraction of sEVs rather seems to be PrP-independent. In general, intracellular cargo delivery of EVs is still poorly understood and further studies, as for the potential role of PrP in these processes, are clearly needed to clarify this important point in EV biology and intercellular communication.
It has been shown that EVs derived from cortical neurons are taken up preferentially by hippocampal neurons, whereas EVs from other origins are generally taken up by microglia [Citation107]. In our study, we have a mixture of brain EVs and further analyses are needed to assess which type of EVs are internalized by neurons. However, we observed that the uptake of sEVs lacking PrP by microglia and astrocytes was likewise highly increased. This result could point out to a role of PrP in EV recognition by the immune system. It is striking that PrP is highly abundant in organs that possess immune privilege, such as brain, placenta and testicles [Citation108]. Fittingly, in several inflammatory processes, such as ischaemia, brain trauma, and experimental autoimmune encephalomyelitis (EAE; as a model for multiple sclerosis), the inflammatory damage is exacerbated when PrP is absent, supporting a role of this protein in immunological quiescence [Citation108].
In conclusion, the present study describes that microglia are the main contributors to the sEV pool in murine brain under physiological conditions and that brain sEVs are enriched in PrP and PrP-C1, which may modulate EV uptake in recipient cells. After experimental stroke, astrocytes increasingly contribute to the sEV pool and levels of sEV-associated PrP are further enhanced. These findings add novel insight to previous studies indicating a major role of both, PrP and EVs, in the brain under physiological and ischaemic conditions.
Disclosure of interest
The authors report no conflict of interest.
Supplemental Material
Download Zip (1.9 MB)Acknowledgements
The authors would like to thank Oliver Schnapauff and Anika Ruhl for performing the animal model of tMCAO.
Supplementary materials
Supplementary data for this article can be accessed here.
Additional information
Funding
References
- Valadi H, Ekström K, Bossios A, et al. Exosome-mediated transfer of mRNAs and microRNAs is a novel mechanism of genetic exchange between cells. Nat Cell Biol. 2007;9(6):654.
- Eldh M, Ekström K, Valadi H, et al. Exosomes communicate protective messages during oxidative stress; possible role of exosomal shuttle RNA. PloS One. 2010;5(12):e15353–21.
- Cocucci E, Racchetti G, Meldolesi J. Shedding microvesicles: artefacts no more. Trends Cell Biol. 2009;19(2):43–51.
- Simons M, Raposo G. Exosomes – vesicular carriers for intercellular communication. Curr Opin Cell Biol. 2009;21(4):575–581.
- Lo Cicero A, Stahl PD, Raposo G. Extracellular vesicles shuffling intercellular messages: for good or for bad. Curr Opin Cell Biol. 2015;35:69–77.
- Tkach M, Kowal J, Théry C. Why the need and how to approach the functional diversity of extracellular vesicles. Philos Trans R Soc B. 2018;373(1737):20160479.
- Yáñez-Mó M, Siljander PR-M, Andreu Z, et al. Biological properties of extracellular vesicles and their physiological functions. J Extracell Vesicles. 2015;4(1):27066.
- Krämer-Albers EM, Hill AF. Extracellular vesicles: interneural shuttles of complex messages. Curr Opin Neurobiol. 2016;39:101–107.
- Candelario KM, Steindler DA. The role of extracellular vesicles in the progression of neurodegenerative disease and cancer. Trends Mol Med. 2014;20(7):368–374.
- Cooper JM, Wiklander PBO, Nordin JZ, et al. Systemic exosomal siRNA delivery reduced alpha-synuclein aggregates in brains of transgenic mice. Mov Disord. 2014;29(12):1476–1485.
- Armstrong JPK, Holme MN, Stevens MM. Re-engineering extracellular vesicles as smart nanoscale therapeutics. ACS Nano. 2017;11(1):69–83.
- Wiklander OPB, Nordin JZ, O’Loughlin A, et al. Extracellular vesicle in vivo biodistribution is determined by cell source, route of administration and targeting. J Extracell Vesicles. 2015;4(1):26316.
- Mentkowski KI, Snitzer JD, Rusnak S, et al. Therapeutic potential of engineered extracellular vesicles. Aaps J. 2018;20(3):50.
- Kanninen KM, Bister N, Koistinaho J, et al. Exosomes as new diagnostic tools in CNS diseases. Biochim Biophys Acta (BBA) - Mol Basis Dis. 2016;1862(3):403–410.
- Puig B, Brenna S, Magnus T. Molecular communication of a dying neuron in stroke. Int J Mol Sci. 2018;19(9):2834.
- Marchal G, Beaudouin V, Rioux P, et al. Prolonged persistence of substantial volumes of potentially viable brain tissue after stroke: a correlative PET-CT study with voxel-based data analysis. Stroke. 1996;27(4):599–606.
- Dirnagl U, Iadecola C, Moskowitz MA. Pathobiology of ischaemic stroke: an integrated view. Trends Neurosci. 1999;22(9):391–397.
- George PM, Steinberg GK. Novel stroke therapeutics: unraveling stroke pathophysiology and its impact on clinical treatments. Neuron. 2015;87(2):297–309.
- Gelderblom M, Leypoldt F, Steinbach K, et al. Temporal and spatial dynamics of cerebral immune cell accumulation in stroke. Stroke. 2009;40(5):1849–1857.
- Cheng NT, Kim AS. Intravenous thrombolysis for acute ischemic stroke within 3 hours versus between 3 and 4.5 hours of symptom onset. Neurohospitalist. 2015;5(3):101–109.
- Zhang ZG, Buller B, Chopp M. Exosomes — beyond stem cells for restorative therapy in stroke and neurological injury. Nat Rev Neurol. 2019;15(4):193–203.
- Doeppner TR, Bähr M, Hermann DM, et al. Concise review: extracellular vesicles overcoming limitations of cell therapies in ischemic stroke. Stem Cells Transl Med. 2017;6(11):2044–2052.
- Vella LJ, Greenwood DLV, Cappai R, et al. Enrichment of prion protein in exosomes derived from ovine cerebral spinal fluid. Vet Immunol Immunopathol. 2008;124(3–4):385–393.
- Falker C, Hartmann A, Guett I, et al. Exosomal cellular prion protein drives fibrillization of amyloid beta and counteracts amyloid beta-mediated neurotoxicity. J Neurochem. 2016;137(1):88–100.
- Fauré J, Lachenal G, Court M, et al. Exosomes are released by cultured cortical neurones. Mol Cell Neurosci. 2006;31(4):642–648.
- Puig B, Altmeppen HC, Glatzel M. The GPI-anchoring of PrP: implications in sorting and pathogenesis. Prion. 2014;8(1):11–18.
- Record M, Silvente-Poirot S, Poirot M, et al. Extracellular vesicles: lipids as key components of their biogenesis and functions. J Lipid Res. 2018;59(8):1316–1324.
- de Gassart A, Géminard C, Février B, et al. Lipid raft-associated protein sorting in exosomes. Blood. 2003;102(13):4336–4344.
- Wulf MA, Senatore A, Aguzzi A. The biological function of the cellular prion protein: an update. BMC Biol. 2017;15(3):34.
- Steele AD, Lindquist S, Aguzzi A. The prion protein knockout mouse: a phenotype under challenge. Prion. 2007;1(2):83–93.
- Spudich A, Frigg R, Kilic E, et al. Aggravation of ischemic brain injury by prion protein deficiency: role of ERK-1/-2 and STAT-1. Neurobiol Dis. 2005;20(2):442–449.
- Doeppner TR, Kaltwasser B, Schlechter J, et al. Cellular prion protein promotes post-ischemic neuronal survival, angioneurogenesis and enhances neural progenitor cell homing via proteasome inhibition. Cell Death Dis. 2015;6(12):e2024–e2024.
- Shyu WC, Lin SZ, Chiang MF, et al. Overexpression of PrPC by adenovirus-mediated gene targeting reduces ischemic injury in a stroke rat model. J Neurosci. 2005;25(39):8967–8977.
- Doeppner TR, Herz J, Görgens A, et al. Extracellular vesicles improve post-stroke neuroregeneration and prevent postischemic immunosuppression. Stem Cells Transl Med. 2015;4(10):1131–1143.
- Weise J, Crome O, Sandau R, et al. Upregulation of cellular prion protein (PrPc) after focal cerebral ischemia and influence of lesion severity. Neurosci Lett. 2004;372(1–2):146–150.
- Mitsios N, Saka M, Krupinski J, et al. Cellular prion protein is increased in the plasma and peri-infarcted brain tissue after acute stroke. J Neurosci Res. 2007;85(3):602–611.
- Weise J, Doeppner TR, Müller T, et al. Overexpression of cellular prion protein alters postischemic Erk1/2 phosphorylation but not Akt phosphorylation and protects against focal cerebral ischemia. Restor Neurol Neurosci. 2008;26(1):57–64.
- Guitart K, Loers G, Buck F, et al. Improvement of neuronal cell survival by astrocyte-derived exosomes under hypoxic and ischemic conditions depends on prion protein. Glia. 2016;64(6):896–910.
- Linsenmeier L, Altmeppen HC, Wetzel S, et al. Diverse functions of the prion protein – does proteolytic processing hold the key? Biochim Biophys Acta, Mol Cell Res. 2017;1864(11):2128–2137.
- Altmeppen HC, Prox J, Puig B, et al. Roles of endoproteolytic alpha-cleavage and shedding of the prion protein in neurodegeneration. Febs J. 2013;280(18):4338–4347.
- Altmeppen HC, Puig B, Dohler F, et al. Proteolytic processing of the prion protein in health and disease. Am J Neurodegener Dis. 2012;1(1):15–31.
- McDonald AJ, Millhauser GL. PrP overdrive: does inhibition of α-cleavage contribute to PrP(C) toxicity and prion disease? Prion. 2014;8(2):183–191.
- Doeppner TR, Bahr M, Giebel B, et al. Immunological and non-immunological effects of stem cell-derived extracellular vesicles on the ischaemic brain. Ther Adv Neurol Disord. 2018;11:1756286418789326.
- Vella LJ, Scicluna BJ, Cheng L, et al. A rigorous method to enrich for exosomes from brain tissue. J Extracell Vesicles. 2017;6(1):1348885.
- Büeler H, Fischer M, Lang Y, et al. Normal development and behaviour of mice lacking the neuronal cell-surface PrP protein. Nature. 1992;356(6370):577.
- Théry C, Amigorena S, Raposo G, et al. Isolation and characterization of exosomes from cell culture supernatants and biological fluids. Curr Protoc Cell Biol. 2006;30(1):3. 22.21–23.22.29.
- Puig B, Altmeppen HC, Ulbrich S, et al. Secretory pathway retention of mutant prion protein induces p38-MAPK activation and lethal disease in mice. Sci Rep. 2016;6(1):24970.
- Kaech S, Banker G. Culturing hippocampal neurons. Nat Protoc. 2006;1(5):2406–2415.
- Polymenidou M, Moos R, Scott M, et al. The POM monoclonals: a comprehensive set of antibodies to non-overlapping prion protein epitopes. PLoS One. 2008;3(12):e3872.
- Szklarczyk D, Gable AL, Lyon D, et al. STRING v11: protein–protein association networks with increased coverage, supporting functional discovery in genome-wide experimental datasets. Nucleic Acids Res. 2018;47(D1):D607–D613.
- Pathan M, Keerthikumar S, Ang C-S, et al. FunRich: an open access standalone functional enrichment and interaction network analysis tool. PROTEOMICS. 2015;15(15):2597–2601.
- Levy E. Exosomes in the diseased brain: first insights from in vivo studies. Front Neurosci. 2017;11. DOI:10.3389/fnins.2017.00142.
- Théry C, Witwer KW, Aikawa E, et al. Minimal information for studies of extracellular vesicles 2018 (MISEV2018): a position statement of the international society for extracellular vesicles and update of the MISEV2014 guidelines. J Extracell Vesicles. 2018;7(1):1535750.
- Lötvall J, Hill AF, Hochberg F, et al. Minimal experimental requirements for definition of extracellular vesicles and their functions: a position statement from the international society for extracellular vesicles. J Extracell Vesicles. 2014;3(1):26913.
- Revelo NH, Kamin D, Truckenbrodt S, et al. A new probe for super-resolution imaging of membranes elucidates trafficking pathways. J Cell Biol. 2014;205(4):591–606.
- Sasaki Y, Hoshi M, Akazawa C, et al. Selective expression of Gi/o-coupled ATP receptor P2Y12 in microglia in rat brain. Glia. 2003;44(3):242–250.
- Bennett ML, Bennett FC, Liddelow SA, et al. New tools for studying microglia in the mouse and human CNS. Proc Natl Acad Sci U S A. 2016;113(12):E1738–E1746.
- Bradl M, Lassmann H. Oligodendrocytes: biology and pathology. Acta Neuropathol. 2010;119(1):37–53.
- Lappe-Siefke C, Goebbels S, Gravel M, et al. Disruption of Cnp1 uncouples oligodendroglial functions in axonal support and myelination. Nat Genet. 2003;33(3):366–374.
- Thiel G. Synapsin I, Synapsin II, and Synaptophysin: marker proteins of synaptic vesicles. Brain Pathol. 1993;3(1):87–95.
- Antonucci F, Corradini I, Fossati G, et al. SNAP-25, a known presynaptic protein with emerging postsynaptic functions. Front Synaptic Neurosci. 2016;8. DOI:10.3389/fnsyn.2016.00007.
- Agliardi C, Guerini FR, Zanzottera M, et al. SNAP-25 in serum is carried by exosomes of neuronal origin and is a potential biomarker of alzheimer’s disease. Mol Neurobiol. 2019;56(8):5792–5798.
- Guha D, Lorenz DR, Misra V, et al. Proteomic analysis of cerebrospinal fluid extracellular vesicles reveals synaptic injury, inflammation, and stress response markers in HIV patients with cognitive impairment. J Neuroinflammation. 2019;16(1):254.
- Gallart-Palau X, Serra A, Sze SK. Enrichment of extracellular vesicles from tissues of the central nervous system by PROSPR. Mol Neurodegener. 2016;11(1):41.
- Goetzl EJ, Kapogiannis D, Schwartz JB, et al. Decreased synaptic proteins in neuronal exosomes of frontotemporal dementia and Alzheimer’s disease. Faseb J. 2016;30(12):4141–4148.
- Kanai Y, Smith CP, Hediger MA. A new family of neurotransmitter transporters: the high-affinity glutamate transporters. Faseb J. 1993;7(15):1450–1459.
- Kanamoto T, Mizuhashi K, Terada K, et al. Isolation and characterization of a novel plasma membrane protein, osteoblast induction factor (obif), associated with osteoblast differentiation. BMC Dev Biol. 2009;9(1):70.
- Liang J, Kong Q. α-Cleavage of cellular prion protein. Prion. 2012;6(5):453–460.
- Pager CT, Craft WW, Patch J, et al. A mature and fusogenic form of the Nipah virus fusion protein requires proteolytic processing by cathepsin L. Virology. 2006;346(2):251–257.
- Diederich S, Sauerhering L, Weis M, et al. Activation of the Nipah virus fusion protein in MDCK cells is mediated by cathepsin B within the endosome-recycling compartment. J Virol. 2012;86(7):3736–3745.
- Polanco JC, Li C, Durisic N, et al. Exosomes taken up by neurons hijack the endosomal pathway to spread to interconnected neurons. Acta Neuropathol Commun. 2018;6(1):10.
- Heusermann W, Hean J, Trojer D, et al. Exosomes surf on filopodia to enter cells at endocytic hot spots, traffic within endosomes, and are targeted to the ER. J Cell Biol. 2016;213(2):173–184.
- Alvarez-Erviti L, Seow Y, Yin H, et al. Delivery of siRNA to the mouse brain by systemic injection of targeted exosomes. Nat Biotechnol. 2011;29(4):341.
- Galieva LR, James V, Mukhamedshina YO, et al. Therapeutic potential of extracellular vesicles for the treatment of nerve disorders. Front Neurosci. 2019;13:163.
- Bang OY, Kim EH. Mesenchymal stem cell-derived extracellular vesicle therapy for stroke: challenges and progress. Front Neurol. 2019;10:211.
- Lee JY, Kim E, Choi S-M, et al. Microvesicles from brain-extract-treated mesenchymal stem cells improve neurological functions in a rat model of ischemic stroke. Sci Rep. 2016;6(1):33038.
- Webb RL, Kaiser EE, Jurgielewicz BJ, et al. Human neural stem cell extracellular vesicles improve recovery in a porcine model of ischemic stroke. Stroke. 2018;49(5):1248–1256.
- Perez-Gonzalez R, Gauthier SA, Kumar A, et al. The exosome secretory pathway transports amyloid precursor protein carboxyl-terminal fragments from the cell into the brain extracellular space. J Biol Chem. 2012;287(51):43108–43115.
- Levy E. Exosomes in the Diseased Brain: first Insights from In vivo Studies. Front Neurosci. 2017;11:142.
- Baker S, Polanco JC, Götz J. Extracellular Vesicles Containing P301L mutant tau accelerate pathological tau phosphorylation and oligomer formation but do not seed mature neurofibrillary tangles in ALZ17 mice. J Alzheimers Dis. 2016;54(3):1207–1217.
- Dinkins MB, Dasgupta S, Wang G, et al. The 5XFAD mouse model of alzheimer’s disease exhibits an age-dependent increase in anti-ceramide igg and exogenous administration of ceramide further increases anti-ceramide titers and amyloid plaque burden. J Alzheimers Dis. 2015;46(1):55–61.
- Iguchi Y, Eid L, Parent M, et al. Exosome secretion is a key pathway for clearance of pathological TDP-43. Brain. 2016;139(12):3187–3201.
- Polanco JC, Scicluna BJ, Hill AF, et al. Extracellular vesicles isolated from the brains of rTg4510 mice seed tau protein aggregation in a threshold-dependent manner. J Biol Chem. 2016;291(24):12445–12466.
- Spencer B, Kim C, Gonzalez T, et al. α-Synuclein interferes with the ESCRT-III complex contributing to the pathogenesis of Lewy body disease. Hum Mol Genet. 2016;25(6):1100–1115.
- Wang B, Han S. Exosome-associated tau exacerbates brain functional impairments induced by traumatic brain injury in mice. Mol Cell Neurosci. 2018;88:158–166.
- Mateescu B, Kowal EJK, van Balkom BWM, et al. Obstacles and opportunities in the functional analysis of extracellular vesicle RNA – an ISEV position paper. J Extracell Vesicles. 2017;6(1):1286095.
- Kowal J, Arras G, Colombo M, et al. Proteomic comparison defines novel markers to characterize heterogeneous populations of extracellular vesicle subtypes. Proc Nat Acad Sci. 2016;113(8):E968–E977.
- Jeppesen DK, Fenix AM, Franklin JL, et al. Reassessment of exosome composition. Cell. 2019;177(2):428–445.e418.
- Silverman JM, Christy D, Shyu CC, et al. CNS-derived extracellular vesicles from superoxide dismutase 1 (SOD1) G93A ALS mice originate from astrocytes and neurons and carry misfolded SOD1. J Biol Chem. 2019;294(10):3744–3759.
- van der Pol E, Coumans FAW, Grootemaat AE, et al. Particle size distribution of exosomes and microvesicles determined by transmission electron microscopy, flow cytometry, nanoparticle tracking analysis, and resistive pulse sensing. J Thromb Haemost. 2014;12(7):1182–1192.
- van der Pol E, Sturk A, van Leeuwen T, et al. Standardization of extracellular vesicle measurements by flow cytometry through vesicle diameter approximation. J Thromb Haemost. 2018;16(6):1236–1245.
- Liu Z, Chopp M. Astrocytes, therapeutic targets for neuroprotection and neurorestoration in ischemic stroke. Prog Neurobiol. 2016;144:103–120.
- Adams KL, Gallo V. The diversity and disparity of the glial scar. Nat Neurosci. 2018;21(1):9–15.
- Susarla BTS, Villapol S, Yi J-H, et al. Temporal patterns of cortical proliferation of glial cell populations after traumatic brain injury in mice. ASN Neuro. 2014;6(3):159–170.
- Liu W, Tang Y, Feng J. Cross talk between activation of microglia and astrocytes in pathological conditions in the central nervous system. Life Sci. 2011;89(5–6):141–146.
- Becerra-Calixto A, Cardona-Gómez GP. The role of astrocytes in neuroprotection after brain stroke: potential in cell therapy. Front Mol Neurosci. 2017;10:88.
- Pascua-Maestro R, González E, Lillo C, et al. Extracellular vesicles secreted by astroglial cells transport apolipoprotein d to neurons and mediate neuronal survival upon oxidative stress. Front Cell Neurosci. 2019;12. DOI:10.3389/fncel.2018.00526.
- McLennan NF, Brennan PM, McNeill A, et al. Prion protein accumulation and neuroprotection in hypoxic brain damage. Am J Pathol. 2004;165(1):227–235.
- Beraldo FH, Soares IN, Goncalves DF, et al. Stress-inducible phosphoprotein 1 has unique cochaperone activity during development and regulates cellular response to ischemia via the prion protein. Faseb J. 2013;27(9):3594–3607.
- Vella L, Sharples RA, Lawson VA, et al. Packaging of prions into exosomes is associated with a novel pathway of PrP processing. J Pathol. 2007;211(5):582–590.
- van Dongen HM, Masoumi N, Witwer KW, et al. Extracellular vesicles exploit viral entry routes for cargo delivery. Microbiol Mol Biol Rev. 2016;80(2):369–386.
- Nolte-’t Hoen E, Cremer T, Gallo RC, et al. Extracellular vesicles and viruses: are they close relatives? Proc Natl Acad Sci U S A. 2016;113(33):9155–9161.
- Tian T, Wang Y, Wang H, et al. Visualizing of the cellular uptake and intracellular trafficking of exosomes by live-cell microscopy. J Cell Biochem. 2010;111(2):488–496.
- Mulcahy LA, Pink RC, Carter DRF. Routes and mechanisms of extracellular vesicle uptake. J Extracell Vesicles. 2014;3(1):24641.
- Morandat S, Bortolato M, Roux B. Role of GPI-anchored enzyme in liposome detergent-resistance. J Membr Biol. 2003;191(3):215–221.
- Bonsergent E, Lavieu G. Content release of extracellular vesicles in a cell-free extract. FEBS Lett. 2019;593(15):1983–1992.
- Chivet M, Javalet C, Laulagnier K, et al. Exosomes secreted by cortical neurons upon glutamatergic synapse activation specifically interact with neurons. J Extracell Vesicles. 2014;3(1):24722.
- Bakkebo MK, Mouillet-Richard S, Espenes A, et al. The cellular prion protein: a player in immunological quiescence. Front Immunol. 2015;6:450.