
ABSTRACT
Background and objective: A Depressive Health State Index (DHSI) based on 29 parameters routinely collected in an automated healthcare database (AHDB) was developed to evaluate the health state of depressive patients, and its evolution. The study objective was to describe and validate this DHSI.
Methods: A historical cohort of patients with at least one episode of depression was identified in the Clinical Practice Research Datalink (CPRD). The DHSI was calculated for each episode of depression. Validation was performed by comparing the DHSI between subgroups and using validated definitions of remission (proxy and PHQ-9). Robustness was studied by assessing the impact of modifying parameters of the DHSI.
Results: 309,279 episodes of depression were identified in the CPRD between 1 January 2006 and 31 December 2012. Remission was observed in 8% of the patients showing the lower DHSI scores and in 88% of the patients showing the higher DHSI scores. The DHSI was robust to a modification of the most frequent variables and to the removal of rare parameters.
Conclusion: The DHSI is specific to depression severity (with remission rates in accordance with the expected variations of the DHSI) and robust. It represents a promising tool for the analysis of AHDBs.
Introduction
Evaluating the effectiveness of drugs or other interventions in routine clinical practice is a central focus of health-related studies. In this regard, the analysis of the data routinely recorded in automated healthcare databases (AHDB) is of great interest, as it provides automatically collected observational data for very large population samples with limited participation biases [Citation1]. However, AHDB often lack detailed clinical data, requiring the use of proxies, which do not always provide sufficient granularity [Citation2,Citation3].
Clinical status proxies available in AHDB studies vary in their granularity depending on the condition of interest. For instance, in diabetes, the clinical state of the patient can be adequately evaluated using HbA1c, which is usually well-reported in electronic medical records databases. Identifying appropriate proxies can be more challenging for a disease such as major depressive disorder (MDD), where a patient’s status can be evaluated based on clinical interviews or questionnaires that are not routinely recorded in AHDB. Remission status, for example, typically relies on proxies such as prescription patterns and therefore does not take into account clinical information [Citation2,Citation3]. In addition, remission is a binary outcome that separates patients into remitters and non-remitters – a dichotomy that does not reflect the complexity of MDD [Citation4].
In order to better evaluate patients’ depressive health state in an AHDB, we defined and constructed a Depressive Health State Index (DHSI) in one of the most commonly used AHDB in the UK, the Clinical Practice Research Datalink (CPRD). The aim of the index is to describe the depressive health state of a patient prescribed an antidepressant therapy. The overall principle of the DHSI is to combine variables contained in an AHDB and considered to be related to the depressive health state of the patients into a unique continuous index. It is designed to reflect the health state of depressive patients using a scale from 0 (‘worst possible’ health state) to 100 (‘best possible’ health state). The method used to construct the DHSI has been reported previously [Citation5].
The objective of the present paper is to describe the DHSI in the CPRD, its robustness and an initial construct validation via its relation to variables expected to correlate with the severity of depression.
Methods
The detailed methods used to create the DHSI have been published previously by the same study group [Citation5].
Study design
As detailed in the methodological manuscript [Citation5], the study is based on a historical cohort design using data from the CPRD. The CPRD is a database of anonymized primary care records of patients registered at general practices in the UK. It covers approximately 8% of the UK population and includes information on the prescription of medicines, referral to hospitals or specialists, and diagnoses entered by the general practitioner (GP) using the Read or Oxford Medical Information System codes. This widely used database has been validated for pharmacoepidemiological studies [Citation6–Citation8].
Study population
The dataset used for the study is the same as described previously [Citation5].
The study included patients with at least one depressive episode during the study period (1 January 2006–31 December 2012).
Patients were selected based on the following inclusion criteria:
incident prescription of antidepressant (AD) monotherapy during the study period (index date),
no AD prescription within the 6 months prior to index date,
incident diagnosis of depression during the 61 days preceding or following the index date,
patients aged 18 or older at index date,
at least 6 months of available data before index date,
at least 9 months of available data following index date (except for patients with a recorded death during this period of time).
Exclusion criteria were any lifetime diagnosis of bipolar disorder or schizophrenia.
Each segment of a patient’s data matching the selection criteria was defined as a ‘depressive episode’, thus several depressive episodes could be observed for each patient included in the study. The end of a depressive episode was the end of an AD prescription without any other AD prescription during the following 182 days, or the end of the patient’s follow-up in the database (censoring). The DHSI was calculated for each episode of depression over a 6-month window starting 3 months after the index date, a time span usually considered to assess remission for a patient with depression in routine clinical practice [Citation9]. Baseline characteristics for each episode were collected between the 5 months before and 1 month following the index date (defined as reference period). The events used to derive the parameters included in the DHSI were considered in a time window starting 3 months after index date and up to 9 months after index date (defined as follow-up period) (). Some parameters were defined relative to baseline characteristics (e.g., dose augmentation). Baseline characteristics were assessed during the reference period.
Figure 1. Study design. The index date was the date of the first prescription of antidepressant for a patient meeting the inclusion and exclusion criteria in the database [5].
![Figure 1. Study design. The index date was the date of the first prescription of antidepressant for a patient meeting the inclusion and exclusion criteria in the database [5].](/cms/asset/79d2443a-6a94-4d68-bc78-fc3c7399c0ed/zjma_a_1562860_f0001_oc.jpg)
The study protocol was reviewed and accepted by the CPRD review committee (ISAC protocol number: 13_182).
Creation of the health state index
The DHSI is a composite score ranging from 0 (worst possible health state) to 100 (best possible health state) comprising 29 different parameters (i.e., existing variables or derived from existing variables) ( and ). These parameters were defined and selected by a group of 4 clinical and methodological experts among the whole set of variables available in the CPRD. Each parameter was weighted according to its presupposed effect on the health state of the patient. Qualitative weighting of the parameters consisted in attributing a negative value for parameters thought to have a negative impact on the health state and a positive value for parameters thought to have a positive impact. Quantitative weighting consisted of assigning a numerical value to each parameter, which represents the expected relative size of its impact on the health state of the patient with depression compared to other parameters (i.e., parameters thought to have more impact were attributed higher numerical values than parameters thought to have a lower impact). All identified depressive episodes were then ranked from the worst to the best health state, based on the presence or absence of the predefined parameters. This ranking step was followed by a standardization step to derive a DHSI ranging from 0 (depressive episode with the lowest rank and thus worst health state) to 100 (depressive episode with the highest rank and thus best health state). Finally, a regression model was developed based on the ranking-derived score to assess the DHSI directly from the available data, without requiring a new ranking.
Table 1. Parameters with a positive weight in the DHSI.
Table 2. Parameters with a negative weight in the DHSI.
Statistical analyses
Descriptive analyses
The DHSI was summarized using the mean, standard deviation (SD), minimum, maximum, median and quartiles.
The DHSI was described overall and across geographic regions of the UK, age groups and gender. Differences in DHSI scores across these variables were identified using statistical tests described below.
Initial validation of the DHSI
Initial validation of the index was performed using two different sets of analyses: i) by describing patients’ remission status based on proxies according to deciles of the DHSI and ii) by comparing the mean DHSI scores of population subgroups known to represent different severities of depression.
(i) The proportion of patients in remission per deciles of the DHSI was examined using two different definitions for remission: a previously validated proxy based on treatment patterns [Citation3] and a proxy based on the Patient Health Questionnaire 9 (PHQ-9) score when available for a depressive episode [Citation10].
Remission based on treatment patterns was defined as an AD treatment discontinuation >45 days during a depressive episode. Other clinical outcomes were defined as follows: relapse was defined as an interruption of >45 days of the antidepressant prescriptions and a new prescription of any psychotropic drug <180 days after the last antidepressant prescription. Remission without relapse was an interruption of >45 days of antidepressant prescription with no further psychotropic prescriptions during follow-up prescription. This definition demonstrated an acceptable level of concordance between remission obtained from the computerized databases and clinical criteria [Citation3].
Remission according to the PHQ-9 values available in the CPRD, as recorded by GPs, was defined according to PHQ-9 validated cut-off, which classified remission as a PHQ-9 value ≤4 using the last available value during the follow-up period of a specific depressive episode. This analysis is purely descriptive and no statistical test was used.
(ii) The second set of validation analyses consisted in the comparison of DHSI scores among subgroups expected to differ in terms of depression severity: antipsychotic augmentation (yes/no) during the depressive episode, psychiatric hospitalisations (yes/no) during the depressive episode and any hospitalisation (psychiatric and other) (yes/no) during the depressive episode. Statistical testing is described below.
Robustness of the DHSI
Analyses of robustness consisted in shifting the weight of frequent parameters (i.e., occurring in >50% of the episodes), by 1 unit lower or higher. This corresponds to exchanging the relative impact level of the parameter with the parameter immediately below (i.e., having the closest lower impact) or above (i.e., having the closest higher impact). Other robustness analyses consisted in the removal of rare parameters (i.e., occurring in <5% of the episodes). In both cases, the DHSI was recalculated after each modification and the Spearman correlation between the original index and the index resulting from the modification was measured.
Statistical tests
Statistical comparisons were performed using non-parametric tests: the Wilcoxon-Mann-Whitney test for binary variables and the Kruskal-Wallis test for variables with three or more levels. Due to the large number of depressive episodes included in the study, statistical significance could be reached for small, and potentially non-clinically meaningful differences. To take ‘clinical’ significance into account, a standardized effect size was also calculated and considered for interpretation of the results. The standardized effect size for DHSI differences between groups was computed as follows: (mean group x – mean group y)/SD of mean group y. As we report here the first statistical results for the DHSI, the thresholds of clinical relevance are unknown for this index. Therefore, the interpretation of the standardized effect size was based on Cohen’s conventions: ≤0.2: no effect; between >0.2 and ≤0.5: small effect size; between >0.5 and ≤0.8: moderate effect size; >0.8: large effect size [Citation11].
All statistical analyses were performed using the R software.
Results
Description of the DHSI
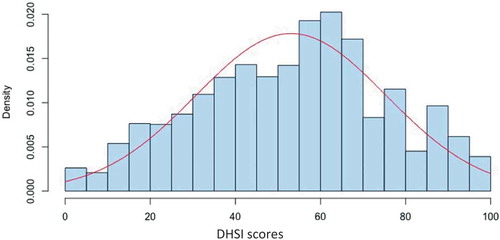
A total of 309,279 episodes of depression (273,346 patients) were identified in the CPRD from 1 January 2006 to 31 December 2012. The mean ± SD DHSI score was 53.1 ± 22.4. Minimum was 0, first quartile was 36.3, median was 55.6, third quartile was 69.5 and maximum was 100. The DHSI scores were normally distributed ().
Figure 2. Density histogram of the Depression Health State Index (DHSI).
The DHSI scores decreased slightly across age groups with mean ±SD scores ranging from 56.35 ± 22.10 for the 18–29 age group to 48.44 ± 23.05 for the ≥80 years age group (). While statistically different, these differences were considered small with effect sizes between 0.2 and 0.4. The DHSI also significantly varied across regions although the effect sizes were negligible (<0.2). Finally, the DHSI scores did not vary by gender.
Table 3. Description of the DHSI according to patient characteristics.
Validation of the DHSI
Remission rates based on the treatment pattern proxy increased with each DHSI decile (). Remission rate was 8% in the 1st decile of the DHSI (i.e., episodes with the lowest scores) and 88% in the 10th decile (i.e., episodes with the highest scores). Similarly, relapse ranged from 32% to 0%, and non-remission from 60% to 12% between the first and the 10th decile.
Figure 3. Percentages of remission, relapse and non-remission of the episodes of depression according to the DHSI deciles.
A total of 15,392 episodes (5% of all included episodes) had an analysable PHQ-9 score available during follow-up. Based on PHQ-9 data, remission rates ranged from 8.8% (1st decile) to 19.1% (10th decile) in this analysis. Remission rates using PHQ-9 values for the first two deciles of the DHSI were similar to rates using the treatment patterns proxy (). From the 3rd to the 10th deciles, the range of DHSI scores was lower among patients with PHQ-9 data than in the overall population.
Table 4. Remission according to PHQ-9 by Depression Health State Index (DHSI) score deciles, within the episodes with available PHQ-9 data (N = 15,392).
Comparisons of DHSI scores among predefined subgroups () showed significant differences for all comparisons, but with different effect sizes. Very large effect sizes were observed for antipsychotic augmentation vs. none (p < 0.001, effect size >3) and psychiatric hospitalisation vs. none (p < 0.001, effect size = 1.7); small effect sizes were observed for any hospitalisations vs. none (p < 0.001, effect size: 0.4) and remission defined by PHQ-9 vs. non-remission for the 15,392 with available data (p < 0.001, effect size: 0.3).
Table 5. Comparisons of the Depression Health State Index (DHSI) across pre-defined subgroups – initial validation analyses.
Robustness
As presented in , shifting the weight of frequent parameters had very little impact on the DHSI. The modified and the initial DHSI scores were always very highly correlated (>0.947). The removal of rare parameters also had very little impact on the DHSI () since the lowest correlation coefficient between the modified and initial DHSI was 0.9881 for this analysis.
Table 6. Analysis of the robustness of the DHSI: Shift of the weight of frequent parameters to the closest higher or lower value.
Table 7. Analysis of the robustness of the DHSI: Removal of rare parameters.
Discussion
This paper reports the description, initial validation and robustness analyses of an index designed to provide a more precise evaluation of the health state of patients with depression within an AHDB. This DHSI was constructed using over 300,000 depressive episodes and is based on 29 distinct parameters, originally present in the CPRD or derived from variables available in the database. The results presented in this paper tend to indicate that the DHSI is a valid measure of the health state of patients with depression, and a robust tool.
The DHSI has been designed to measure the health state of patients with depression, during a clinically relevant period (i.e., between 3 and 9 months after the start of the treatment), on a continuous scale ranging from the worst possible (0) to the best possible state (100). DHSI scores in our sample appeared normally distributed from 0 to 100. Analysis of the proportion of patients in remission without relapse, in remission with relapse or without remission, based on a validated remission proxy [Citation3], was in accordance with the construct of the DHSI. Furthermore, our initial validation analyses tend to indicate that the DHSI performs as expected when analysed across specific subgroups of patients.
No meaningful differences were found in DHSI scores across regions of practice (effect size <0.2) or gender of the patients (null effect size). The relationship between age and DHSI scores showed a negative correlation (i.e., health state decreased with increasing age), although the effect size was small (<0.4). Depression severity is usually thought to be greater for older age groups [Citation12], though this increase may be related to the high prevalence of comorbidities among older populations [Citation13]. The modest difference of DHSI scores across age groups could be interpreted as a higher sensitivity of the DHSI for outcomes specific to depression rather than somatic comorbidities.
The initial validation of the DHSI based on groups of patients known to differ with regards to depression severity provided supporting results: a very large effect size (>3) was observed when comparing episodes with concomitant prescription of antipsychotics with the AD treatment compared with none. This was expected, as this is a parameter included in the DHSI. However, antipsychotic augmentation is a rare parameter (present in less than 5% of the episodes) and its removal from the DHSI had no impact in the robustness analyses. Thus, the large effect size indicates that the DHSI likely captures differences in addition to antipsychotic augmentation. Comparison of episodes with ‘psychiatric hospitalisations’ vs. none and of episodes with ‘any hospitalisation’ vs. none provided the expected results, (i.e., episodes with hospitalisations had lower DHSI scores), although with differing effect sizes (1.7 and 0.4 respectively). This difference is likely due to the specificity of psychiatric hospitalisation versus other cause. These differences observed for hospitalisations further support sensitivity of the DHSI concerning depression-related outcomes.
Initial validation analyses of the DHSI showed some discrepancies with available values for the PHQ-9. The difference in DHSI scores observed for episodes in remission according to the PHQ-9 (scores equal or below 4) was in the expected direction but the effect size was smaller than anticipated (0.3). Similarly, the difference in remission rates between the first and last decile of the DHSI was smaller than expected (8.8% vs 19.1%). The PHQ-9 is a validated clinical tool for the evaluation of depression [Citation10] and a much stronger association between PHQ-9 outcomes and values of the DHSI score was anticipated. There are several notable considerations, however, when interpreting these data. The lack of significant correlation between the PHQ-9 and the DHSI may be first attributed to a temporal issue. Whereas the PHQ-9 was assessed at a single time point that was different for each episode, the DHSI was calculated over a 6-month window starting 3 months after the index date, taking into account the evolution of the depressive episode during this period of time via dynamic parameters [Citation5]. Based on these results, further analyses should be conducted to explore the relationship between the PHQ-9 and the DHSI by looking at PHQ-9 values restricted to various time points during the 6 month period (e.g., first 2 months, last 2 months). In addition, PHQ-9 values during follow-up were available for only 5% of depressive episodes. This reduced sample might have led to a selection bias due to the fact that available PHQ-9 data would have been recorded within a particular population of patients and/or physicians. This hypothesis is supported by the fact that nearly all DHSI deciles for the 5% of episodes with available PHQ-9 data had lower ranges () than those measured among all episodes (). Finally, the DHSI was constructed to describe a health state specific to depressive episodes, but accounting for several clinical parameters, whereas the PHQ-9 is a measure of depression severity only. While we hypothesised that the severity of depression, as measured by the PHQ-9, would correlate with the measure of severity provided by the DHSI it is important to note that these tools do not measure the same concept and have different constructs. Furthermore, the moderate correlation between remission based on the PHQ-9 and the DHSI can be interpreted as being in accordance with the objective of the DHSI, which was that the DHSI aims to provide more granularity than the usual binary tools or proxies used to assess remission. Depressive episodes in ‘borderline remission’ (e.g., with a PHQ-9 score of 3 or 5) should not have very different DHSI scores. Altogether, these data may indicate that the DHSI has a higher granularity and sensitivity to depression severity than binary tools.
In addition to the validity of the DHSI, we studied the robustness of this tool. Neither shifting the weight of the most frequently available parameters nor removing rare parameters significantly altered the DHSI scores. In all analyses, correlation coefficients with the initial DHSI were higher than 0.9, which demonstrates the robustness of this index to the modification of a parameter. This important result indicates that the DHSI is likely robust to data imprecision, misclassification or even to a lack of data. While the high correlation coefficients suggest that the modification of the DHSI tested against validation criteria would yield similar results, such analyses should be conducted to further demonstrate the robustness of the index.
As for any analysis using real-world data, several limitations are worth noting. First, there is no gold standard in the database against which the DHSI could be compared. The PHQ-9 could not be considered a gold standard considering the small number of episodes with available PHQ-9 data and in view of the above-mentioned considerations. This prevented us from generating usual sensitivity or specificity analyses. Additional analyses of this nature would strengthen the validity of this tool. In addition, the parameters included in the DHSI are from a single UK database. If the DHSI is to be derived on another database, it will require a specific phase for definition of parameters and thus a dedicated minimal validation. However, the methodology itself is directly transferable to any AHDB, and many of the 29 parameters are common to other AHDB (e.g., comorbidities, prescription, hospitalisation, dose changes,). The application of the DHSI to another database is more comparable by analogy to a cultural adaption of a questionnaire than to the development of a new questionnaire. Also, it is to be noted that the statistical analyses performed assume independence among depressive episodes, which is most likely not the case. However, in our sample, there were approximately 1.13 episodes per patient thus this likely had a limited impact on the statistical significance of the analyses. It should be noted that episodes initiated with a combination therapy were not included in our sample. However, the frequency of such episodes is expected to be limited in primary care as this is not a recommended strategy in the UK [Citation14]. Another limitation applies to the variables chosen for the subgroup comparisons. Although they were selected during discussions within the expert group, other variables could have been tested. This limitation also applies to the parameter weights that were attributed and defined within a small expert group. These weights would require an external validation, by other experts and physicians.
Conclusion
The descriptive and initial validation analyses indicate that the DHSI is a robust tool to assess the specific health state of depressive patients. It provides a more granular outcome of depression than currently available binary outcomes or proxies. The DHSI should eventually prove to be a useful tool for the evaluation in AHDB of the real-world clinical state and evolution of patients suffering from depression, and consequently of the real-world performance of treatments and health interventions.
Acknowledgements
Editorial support was provided by Guillaume Hebert of SC Partners, funded by Lundbeck SAS.
Disclosure statement
Maëlys Touya is a full-time employee of Lundbeck. Clément François was a full-time employee of Lundbeck at the time of the study. Delphine Saragoussi and Patrice Verpillat were full-time employees of Lundbeck SAS at the time of the study. François-Xavier Lamy was a full-time employee of ICTA PM at the time of the study, a contract research organization under contract with Lundbeck. Adrian Tanasescu is a consultant for Rithme Consulting, a service provider consulting services working with pharmaceutical companies including Lundbeck. Bruno Falissard has been consultant for Lundbeck, E. Lilly, BMS, Servier, SANOFI, GSK, HRA, Roche, Boeringer Ingelheim, Bayer, Almirall, Allergan, Stallergene, Genzyme, Pierre Fabre, Astrazeneca, Novartis, Janssen, Astellas, Biotronik, Daiichi-Sankyo, Gilead, MSD, Lundbeck, Stallergene, Actelion, UCB, Otsuka, Grunenthal and ViiV. Christophe Lançon has been consultant for Lundbeck, Roche and Janssen. Pierre-Michel Llorca has been consultant for Allergan, Janssen, Lundbeck, Otsuka and Servier. Alan G. Wade received consultancy fees from Lundbeck.
Additional information
Funding
References
- Strom BL, Carson JL. Use of automated databases for pharmacoepidemiology research. Epidemiol Rev. 1990;12:87–10.
- Byford S, Barrett B, Despiegel N, et al. Impact of treatment success on health service use and cost in depression: longitudinal database analysis. Pharmacoeconomics. 2011;29(2):157–170.
- Sicras-Mainar A, Blanca-Tamayo M, Gutierrez-Nicuesa L, et al. Clinical validity of a population database definition of remission in patients with major depression. BMC Public Health. 2010;10:64.
- Kelsey JE. Achieving remission in major depressive disorder: the first step to long-term recovery. J Am Osteopath Assoc. 2004;104(3 Suppl. 3):S6–10.
- Francois C, Tanasescu A, Lamy FX, et al. Creating an index to measure health state of depressed patients in automated healthcare databases: the methodology. J Mark Access Health Policy. 2017;5(1):1372025.
- Garcia Rodriguez LA, Perez Gutthann S. Use of the UK general practice research database for pharmacoepidemiology. Br J Clin Pharmacol. 1998;45(5):419–425.
- Herrett E, Thomas SL, Schoonen WM, et al. Validation and validity of diagnoses in the general practice research database: a systematic review. Br J Clin Pharmacol. 2010;69(1):4–14.
- Jick H, Jick SS, Derby LE. Validation of information recorded on general practitioner based computerised data resource in the UK. BMJ. 1991;302(6779):766–768.
- Frank E, Prien RF, Jarrett RB, et al. Conceptualization and rationale for consensus definitions of terms in major depressive disorder. Remission, recovery, relapse, and recurrence. Arch Gen Psychiatry. 1991;48(9):851–855.
- Kroenke K, Spitzer RL, Williams JB. The PHQ-9: validity of a brief depression severity measure. J Gen Intern Med. 2001;16(9):606–613.
- Cohen J. Statistical power analysis for the behavioral sciences. NewYork, USA: Academic Press; 1977.
- Kohn R, Epstein-Lubow G. Course and outcomes of depression in the elderly. Curr Psychiatry Rep. 2006;8(1):34–40.
- Blazer DG. Depression in late life: review and commentary. J Gerontol A Biol Sci Med Sci. 2003;58(3):249–265.
- NICE (National Institute for Health and Clinical Excellence). Depression in adults: recognition and management 2018. Available from: https://www.nice.org.uk/guidance/cg90/chapter/1-Guidance.