
ABSTRACT
Background: Outcomes-based reimbursement (OBR) can reduce decision uncertainty and accelerate patient access to cell and gene therapies, however, OBR is rarely applied in practice in England. Oncology is the therapy area with the most cell and gene therapies in late-stage development, and the Systemic Anti-Cancer Therapy (SACT) dataset and The European Society for Blood and Marrow Transplantation (EBMT) registry are two data collection infrastructures that could potentially act as conduits for implementing OBR in cancer in England.
Objective: To perform a gap analysis to identify the key requirements for upgrading the SACT and EBMT databases for the purposes of enabling OBR, and a top-level estimation of how much this upgrade may cost, using either a manual (staff-heavy) workaround or part automation (technology-heavy) approach.
Methodology: The analysis of current data capture and gaps is informed by secondary research, while the assumptions and data used to derive the top-level cost estimates were informed by consensus-based primary research with experts in healthcare information technology (IT) systems integration and platform development, as well as experts of SACT and EBMT.
Findings: In its current form, the SACT dataset in isolation is largely unfit for enabling OBR in oncology, whether through clinical, economic or humanistic outcomes. The EBMT registry has a greater potential; however, this relates to key clinical outcomes only, not economic or humanistic outcomes. Part automation requires a higher upfront investment than the manual workaround (~£1.8 million vs. ~£400k); however, lower annual costs (~£200 vs. ~£260k-£850k) mean that part automation becomes a more cost-effective approach over time.
Conclusions: An appropriately automated and scalable data collection infrastructure should be implemented, with the ability to integrate clinical, economic and humanistic outcomes with healthcare cost data and payment systems, to enable OBR not only in cancer but also in other therapy areas.
Introduction and background
The pipeline of cell and gene therapies is growing [Citation1], and the number of Advanced Therapy Medicinal Products (ATMPs) in pivotal trial stages provides a source of hope for patients, many of whom have rare diseases and/or few therapeutic alternatives. Year 2018 was a particularly exciting year for ATMPs in England, as two chimeric antigen receptor (CAR) T-cell gene therapies (Kymriah® and Yescarta®) were authorised by the European Medicines Agency (EMA) for the treatment of certain rare and severe cancers [Citation2,Citation3]. Following Health Technology Assessment [HTA] by The National Institute for health and Care Excellence [NICE], these therapies secured conditional reimbursement in England through the Cancer Drugs Fund and made available within the National Health Service (NHS) within weeks of obtaining marketing authorisation [Citation4–Citation6].
While the timely reimbursement of Kymriah® and Yescarta® is a success story for the field of medical science, the road to NHS adoption, even for breakthrough cell and gene therapies, is challenging. NHS stakeholders such as NHS England and NICE face a particularly challenging balancing act in ensuring patient access to therapeutic innovation, on one hand, affordability for the NHS on the other, while rewarding manufacturers for improving patient health, thus incentivising further investment into research and development (R&D).
There are two important reasons why this balancing act is particularly challenging in the case of ATMPs. Firstly, the cost of developing, manufacturing, and delivering these products is much higher than for more conventional medicines (e.g., small molecules and biologics), which necessitates a higher price point in order to be commercially viable. Secondly, many cell and gene therapies have the potential to deliver life-long health improvements through a one-off treatment, rather than a long-term drug regimen of repeated administrations. From a clinical development point of view, this means that manufacturers have to rely on a clinical trial of limited duration to prove (potentially) lifelong health benefits. From the healthcare decision-makers’ point of view, this means being faced with considerable decision uncertainty, as the trial data available at launch cannot establish robustly the long-term effectiveness of the new treatment [Citation7]. This decision uncertainty makes it harder for NHS England and NICE to assess whether it is a good use of taxpayer money to pay for a high-cost therapy that could have a substantial, albeit unproven, long-term benefit.
In the previous work, we have argued that outcomes-based reimbursement (OBR), whereby payments to manufacturers are made conditional on achieving and/or sustaining a certain patient benefit, can reduce decision uncertainty and be a conduit for improving and accelerating patient access to cell and gene therapies [Citation8]. Such schemes would be particularly useful in situations where a new therapy has a substantial potential health benefit long term, however, where the available trial data fall short of demonstrating this with the degree of certainty required by NHS decision-makers. In such cases, OBR can reduce the decision uncertainty stemming from the unknown real-world performance of the product, as well as financial exposure of the NHS (e.g., risk of over-payment in case the therapy performance in the real world is inferior to what was observed in the trial), and thereby lowering the hurdles to adoption.
While the idea of OBR is a fairly straightforward and has been covered extensively in the literature [Citation7,Citation9–Citation15], such reimbursement schemes have historically seen low levels of adoption in practice in Europe [Citation16]. While it is not possible to point to one definitive reason for the low levels of adoption of such schemes, an often-cited reason is the administrative burden [Citation14]. A central component of this administrative burden relates to the collection of outcomes data, which necessitates both having an appropriate data collection infrastructure (e.g., a database) and practice that provide the appropriate operational framework. In the previous work, we showed that oncology is by far the therapy area with the greatest number of ATMPs at the pivotal trial stage [Citation17] (in line with other findings [Citation18–Citation20]), and that there are advanced data collection infrastructures in place in oncology, which seem promising from the point of view of facilitating OBR [Citation17]. There are two data collection infrastructures that are particularly relevant to patients treated for cancer in England: The Systemic Anti-Cancer Therapy (SACT) dataset, and the European Society for Blood and Marrow Transplantation (EBMT) registry,Footnote1 as detailed below.
The Systemic Anti-Cancer Therapy (SACT) dataset
The SACT dataset collects data relevant to all systemic anti-cancer therapies provided in England and aims to identify treatment patterns and outcomes for cancer patients on a national scale [Citation21]. It is mandatory for hospital trusts to submit data to SACT, and 141 hospital trusts upload data on a regular (monthly) basis [Citation21,Citation22]. Failure to comply with data submission can have financial consequences for the trusts, as payment for drugs funded through the Cancer Drugs Fund (CDF) is contingent on compliance with SACT [Citation23,Citation24].
The SACT dataset is part of the National Cancer Registration and Analysis Service (NCRAS) within Public Health England (PHE), which aims to collect data on all cases of cancer that occur in people living in England to support public health, healthcare and research [Citation25]. The SACT team is responsible for providing quality intelligence to NHS England on the use of systemic anti-cancer therapies to inform financial and service planning, policy development and prioritisation for the specialised cancer services [Citation23].
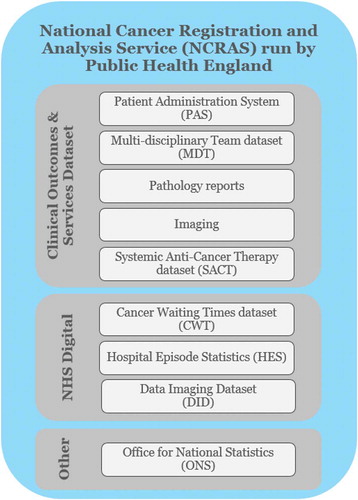
The SACT dataset is integrated with the other clinical NHS data collection infrastructures through the NCRAS, as illustrated in .
Figure 1. Data sources feeding into the National Cancer Registration and Analysis Service (NCRAS).
The SACT dataset comprises several data categories, including patient demographics and consultant details, clinical status, programme and regimen details, cycle information, drug details and outcomes [Citation24]. Whereas it is mandatory for trusts to submit data to SACT, not all the data fields within the SACT data collection form are mandatory to fill out. The SACT form includes fields that are ‘mandatory’, ‘required’, ‘optional’ and ‘pilot’. ‘Mandatory’ fields have to be completed in order for the submission to be accepted; ‘required’ fields must be included ‘where available or applicable’; ‘optional’ fields are discretional; ‘pilot’ fields apply only to trusts that are part of a specific pilot exercise [Citation26]. The SACT data collection form was revised in 2018, and the new form is set to be implemented in December 2019.
The European society for Blood and Marrow Transplantation (EBMT) registry
The EBMT maintains a registry encompassing all haematopoietic stem cell transplant (HSCT) procedures for all indications. It also stores data on immunosuppressive treatments for bone marrow failure syndromes (e.g., aplastic anaemias), and importantly also cell therapy treatments other than HSCT [Citation27]. The aim of the registry is to collect good quality clinical data, which are mainly used for research purposes, but which can also be used for other purposes, such as inspection, auditing and accreditation of transplant centres [Citation27]. Membership in the EBMT and reporting of data are voluntary [Citation28], however, prompt reporting of transplant data is a core requirement for successful accreditation by the Joint Accreditation Committee of the International Society of Cellular Therapy (ISCT) and the EBMT (JACIE). JACIE accreditation is a (voluntary) certification that a transplant centre is performing to a required level of excellence using effective quality management systems [Citation29]. There are 53 transplant centres in the UK [Citation30], all of them are members of the EBMT [Citation31], and English centres are required by NHS England to be JACIE accredited in order to perform HSCTs [Citation32]. Trusts upload data to the EBMT registry on an annual basis, and in cases where individual patients have been seen more than once during that year, more than one data entry is submitted (e.g., for patients who are in the first year of treatment, hospitals would report data for both day zero and 100).
The EBMT has a host of European national counterparts, and The British Society of Blood and Marrow Transplantation (BSBMT) functions among other things as an interface between the EBMT and UK transplant centres on data issues [Citation33]. A small minority of transplant centres send their data to BSBMT for entering into the EBMT registry, however, the majority enter data directly into the EBMT registry [Citation34]. The BSBMT can then access that data, e.g., to undertake UK-specific analyses.
The EBMT registry comprises data collection forms relating to HSCT, and importantly also specific forms for cell therapies other than HSCT, e.g., CAR T-cell therapies. For HSCT patients, there are two types of forms, the Minimal Essential Data (MED)-A form, which is mandatory for all members to submit to retain full EBMT membership, and the MED-B form, which is optional and contains the additional disease and HSCT-specific data [Citation27]. The development of the cell therapy-specific form stems from the EBMT’s long-standing interest in the use of cell therapies. This interest has, among others, seen EBMT involved in efforts undertaken by the EMA to explore how the registry might perform a future role in the execution of post-marketing data collection requirements commonly levied by the EMA for ATMPs [Citation35–Citation37]. The EBMT established the Cell Therapy Registry with the aim to collect data on the administration and long-term follow-up of somatic cell therapy medicinal products and gene therapy medicinal products, including (but not limited to) CAR T-cell therapies, as well as data on the clinical characteristics and outcomes [Citation38].
The cell therapy form includes sections for diagnosis, cell material type, cell manipulation, infusion episode(s), and outcomes like death, toxicities, best response after completed treatment (e.g., remission), complications, first relapse/progression, persistence of infused cells, and several disease area-specific sections [Citation39]. Data are to be collected on day 0, day 100, 6 months, 12 months, and annually thereafter [Citation40,Citation41].
The EBMT has actively pursued a broad application for the cell therapy form in Europe. In June 2018, the EMA’s Committee for Medicinal Products for Human Use (CHMP) published a draft qualification stating that it considers the cellular therapy module of the EBMT registry as an appropriate data source for post-authorisation studies to support regulatory decision-making for CAR-T cell therapy used in haematological malignancies [Citation42] (a final qualification is expected by the end of 2019). Shortly after, the EBMT engaged with several manufacturers of gene therapies (including Novartis, bluebird bio, MolMed, Celgene, and Kite) to further develop the existing cell therapy form so it can be used across different ATMPs [Citation43]. The EBMT has a stated ambition for the future that the registry can be utilised also for HTA purposes, and anticipates to build further on discussions with European Network for Health Technology Assessment (EUnetHTA) [Citation43].
The unmet need in the existing data collection infrastructure for oncology
Despite there being two data collection infrastructures that could potentially facilitate OBR in cancer in England, the vast majority on innovative oncology therapies are admitted to reimbursement through simple confidential discounts on the list price, as a mechanism to address uncertainty in their cost-effectiveness argument. Against this backdrop, it is tempting to ask whether the particulars of the SACT and EBMT registries may (in part) help explain the lack of OBRs seen in practice. In February 2019, Cancer Research UK (CRUK) published a report (with an analysis undertaken by the Office for Health Economics), which highlighted shortcomings around SACT’s outcomes data, and recommended that ‘ … a mapping exercise should be undertaken to ascertain the appropriate data sources, and identify “gaps” in the capacity to collect [outcomes] data … ’ [Citation14]. We support this view and believe that a similar gap analysis could be extended also to EBMT, to understand in more detail what would be required to implement OBR schemes for ATMPs in the cancer area.
Objectives
The objective of this research is to perform a gap analysis to identify the key activity requirements for upgrading the SACT and EBMT databases for the purposes of enabling OBR, and a top-level estimation of how much this may cost.
There are many data sources beyond SACT and EBMT that can potentially play a part in contributing to the facilitation of OBR in the NHS (e.g., electronic health records, Hospital Episode Statistics, or Secondary Uses Services); however, these sources would need to be integrated as many are not currently linked up. As there are different potential approaches to obtaining the necessary data, we are testing two different upgrade scenarios:
Manual workaround with minimal upgrades:
Inclusion of additional data fields to SACT and EBMT (as necessary)
Human resources perform all activities where possible, including data collection, outcome performance analysis, assessment of payment and rebate tracking
Existing systems are upgraded and linked through a central platform to enable the most basic form of data integration (via Microsoft Excel modelling) relying heavily on human resources to operationalise
New system/platform with built-in automation
Inclusion of additional data fields to SACT and EBMT (as necessary)
Utilises third-party technology and artificial intelligence (AI) to deliver improvements to SACT and EBMT through capturing of clinical and humanistic outcomes
Involves developing a platform to integrate data from several systems with built-in automation of performance analysis and reporting
Methodology
Data capture and gap analysis
Our analysis of current data capture and gaps is informed largely by secondary research, e.g., the guidance documents and data collection forms used for SACT and EBMT and any data completeness reports available in the public domain.
We wanted to establish the degree to which SACT and EBMT can capture clinical, economic and humanistic outcomes for the purposes of OBR in oncology. A key focus was clinical outcomes, as detailed in .
Table 1. Clinical outcomes explored in the data capture and gap analysis*.
We also considered economic outcomes, e.g., hospital admissions, and healthcare resource utilisation, as well as (humanistic) patient-reported experience or outcomes measures (PREMs and PROMs) such as quality of life (QoL) and patient satisfaction.
Top-level cost estimate of upgrade
The top-level cost estimate details the costs associated with upgrading SACT and EBMT so that they are fit for OBR purposes. The key activities within each scenario (i.e., manual workaround/minimal upgrades, and new system/platform with part automation) have been grouped into two main investment categories for costing:
1. People
Training: Ensuring that relevant stakeholders (at local or centralised level) acquire the skills necessary to accurately capture and manage the appropriate data
Resources: Ensuring that there are sufficient staff resources to perform data collection/management and payment-related activities
2. Technology
System upgrade: Upgrading the existing information technology (IT) systems to provide additional functionality to facilitate the data collection activities required for OBR
New system: Implementing a new IT system to provide functionality not currently provided by the existing systems
Software as a Service (SaaS): Licensing of third-party technology provider host applications (e.g., uMotif, Amazon Comprehend) to enable part automation of data capture
The assumptions and data used to derive the top-level cost estimates were informed by consensus-based primary research discussions with experts in healthcare information technology (IT) systems integration and platform development, as well as experts of SACT and EBMT. The primary research effort was conducted to explore and validate assumptions around the key activities required to enable the two upgrade scenarios and the associated cost estimates. A detailed description of the activity requirements (e.g., activity categories and how these are split between people and technology-related activities) and cost estimates are provided in the online supplementary materials.
The focus of the costing exercise is exclusively on costs borne by the NHS, separating between upfront and annual costs for each of the activity requirements.
Upfront costs generally refer to one-off costs such as resource training and implementation of technologies, systems or new practices
Annual costs represent the recurring costs of activities year on year, e.g., salary costs of resources manually analysing therapy performance and costs of a managed services team who run and operationalise the technology
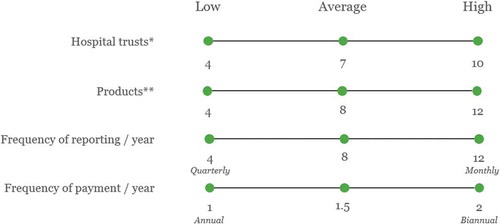
For people-related activities, cost estimates have been derived from assumptions around NHS salaries and full-time equivalents (FTEs) required to perform activities. Where possible, staff time estimates have been based on similar activities currently being performed by staff and cost as informed by the bands in the NHS Employers Agenda for Change Pay Scales for 2019–20 [Citation44]. For technology-related activities, quotes have been retrieved from relevant third-party providers. Our cost estimates represent averages of the results using high and low values for key assumptions used in the calculation, as exemplified in and detailed further in the online supplementary materials.
Figure 2. Select key assumptions used in the top-level cost estimates.
* The number of NHS trusts in which ATMPs in oncology adopted through an OBR scheme. ** The number of ATMPs in oncology adopted with an OBR in each of the trusts above.
Findings
Data capture and gap analysis
Data completeness (historical)
As the revised SACT and EBMT Cell Therapy forms have only recently been introduced, there is no completeness data available for them; however, in the case of SACT, there are historical data (from previous versions of the SACT form) available in annual reports (EBMT publishes no completeness data for any of their forms currently). In , we present completeness rates for select data fields collected through SACT in 2017–18, focusing on the data fields that are likely to be of greatest use for enabling OBR for cell and gene therapiesFootnote2 (with data labels highlighting the completeness rates for data fields that are of particular relevance).
Figure 3. SACT data completeness (2017–18) for select data fields relevant to OBR [Citation22].
Abbreviations: M = ‘Mandatory’ data field (i.e., has to be completed in order for the submission to be accepted); R = ‘Required’ (must be included ‘where available or applicable’); TNM = Primary tumor (T), Regional lymph nodes (N), Distant metastasis (M); OPCS code = Classification of Interventions and Procedures.
![Figure 3. SACT data completeness (2017–18) for select data fields relevant to OBR [Citation22].Abbreviations: M = ‘Mandatory’ data field (i.e., has to be completed in order for the submission to be accepted); R = ‘Required’ (must be included ‘where available or applicable’); TNM = Primary tumor (T), Regional lymph nodes (N), Distant metastasis (M); OPCS code = Classification of Interventions and Procedures.](/cms/asset/4e175dbb-38e0-4459-9a52-aa14e92fdc0a/zjma_a_1635842_f0003_oc.jpg)
Overall, there is a substantial spread in the results (ranging from 12% to 100%), but interestingly, the data fields that we have identified as being of greatest potential use for OBR (indicated with data labels in ) are all below 80% completeness, with a mean across them of 58%. Most notable is the completeness rate for the regimen outcomes summary, which is perhaps the most relevant for OBR, with a mean completeness of only 12% across trusts in England (median of 7%).
Another interesting feature of the SACT completeness data is the difference between the ‘Mandatory’ (i.e., have to be completed in order for the submission to be accepted), and ‘Required’ (must be included ‘where available or applicable’) data fields; ‘Mandatory’ entries have an average completeness rate of 96% (99.6% when adjusting for the one outlier), while ‘Required’ fields score 82% on average.
Clinical outcomes
details the data capture and gap analysis based on the SACT dataset user guide from December 2018 [Citation24] and the EBMT Cell Therapy Med-A Forms and user guide from March 2019 [Citation41,Citation45–Citation47]. We provide more detail around the particulars in the below.
Table 2. Gap analysis of outcomes that can be collected through the current data fields included in the SACT database and EBMT registry.
OS can no longer be tracked in SACT alone, after the field for ‘Date of death’ was removed in the 2018 update; however, these data may be obtained separately from the Office for National Statistics (ONS). It should be noted that under the ‘Regimen outcomes summary’ section, there is an option to choose ‘Death’ as the cause of not completing the regimen as planned, which would indicate whether the patient is deceased; however, this does not specify the date. EBMT’s Cell Therapy form, on the other hand, has data fields for both date of treatment and date of death.
With regards to capturing Response, the updated SACT form includes a field for morphology at the start of treatment (replacing the former ‘TNM staging at start of treatment’), which allows for part of the response outcome to be collected. While this field is a ‘Mandatory’ field, the historical completeness rate of 61% for morphology (the only outlier among the ‘Mandatory’ fields) indicates potential issues with completeness going forward. Since there is no field for entering the morphology at the end of the treatment, it is not possible to systematically track morphological changes, meaning response cannot be captured in SACT. In the EBMT forms, the response is tracked at every follow-up.
There is no field detailing remission or scan or test results post treatment in SACT; however, the ‘Outcomes summary – Curative’ (Y/N) field could potentially be used as a proxy. It is important, however, to note that this is not a ‘Mandatory’ field, and that the mean completeness rate of 12% (median of 7%) from 2017 to 2018 renders it practically meaningless. It is not possible to capture PFS in SACT either. Whereas the summary of the outcomes allows users to indicate whether the treatment regimen was stopped due to ‘Progressive/recurrent cancer’, this relates only to the time span of the treatment regimen, and importantly does not specify the date of remission. Also, as mentioned above, there is no field for capturing scan or test results post treatment, which is a further barrier to capturing PFS in SACT. In the case of EBMT, both remission and disease progression are tracked post treatment and include a field to detail the date of progression, meaning both remission and PFS can be captured.
SACT does not include fields that capture the test results needed to detail molecular remission (or minimal residual disease) either, and the ‘Outcomes summary – Curative’ (Y/N) field is unlikely to play a role as a proxy for this. While EBMT has a field in the form completed at the time of treatment detailing whether the patient is in molecular remission, this is not included in the follow-up forms, meaning it does not seem possible to track this outcome over time.
SACT does not capture specific information regarding toxicity or adverse events, it can only be used to determine whether toxicity was a reason for discontinuing treatment (Y/N). The EBMT follow-up forms include sections detailing toxicities (e.g., graft vs. host disease, cytokine storm, neurotoxicity, organ toxicity, bone marrow aplasia and other) and secondary malignancies, enabling the systematic capture also of these outcomes.
Economic outcomes
Neither SACT nor EBMT captures economic outcomes like hospital admissions (inpatient or outpatient), the cost of the drugs or procedures involved, or other detail on health resource utilisation. Such data can be retrieved from the Hospital Episode Statistics (HES) or Secondary Uses Services (SUS) using the NHS patient identification numbers; however, this requires integrating SACT or EBMT with additional data sources.
Humanistic outcomes
Neither SACT nor EBMT captures the quality of life outcomes, whether disease-specific or generic (e.g., the EQ-5D, which is a central component of the cost-utility framework used in HTAs by NICE among others). SACT includes entries for a patient-reported functional outcome, i.e., ‘Performance status at the start of treatment’ (regimen and cycles), which uses a WHO measure from 0 to 4, detailing patients’ ability to carry out normal daily activities like work and self-care. However, there is no field collecting information about performance status after treatment, which means it is not possible to track improvements post treatment. EBMT includes no humanistic outcomes, whether patient-reported or otherwise.
Top-level cost estimate of upgrade
We present top-level cost estimates for Scenarios A (manual workaround of existing systems) and B (part automation) separately, detailing estimated costs for upgrading SACT and EBMT. For Scenario A, we present separate analyses for the different types of OBR schemes, i.e., patient-level assessment at the national level, patient-level assessment at trust level, cohort-level assessment at the national level, and cohort-level assessment at the trust level. We present only one result for Scenario B, as the automation means that there is no difference in costs depending on the type of OBR scheme pursued. Detailed assumptions around the activities needed to facilitate Scenarios A and B in SACT and EBMT are described in the online supplementary materials.
Upgrade through manual workaround (scenario A)
details the estimated cost of upgrading SACT and EBMT using a largely manual workaround to enable the different OBR schemes of interest.
Figure 4. Top-level cost estimate for upgrading SACT and EBMT (using a manual workaround) to enable OBR in oncology in England.
(A) = Patient-level assessment at national level; (B) = Patient-level assessment at trust level; (C) = Cohort-level assessment at national level; (D) = Cohort-level assessment at trust level
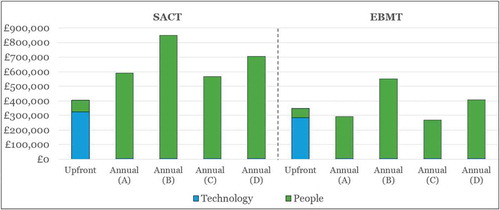
The main component of the upfront costs is the costs for the technological upgrade, which is driven mainly by implementing a new technology platform to integrate SACT or EBMT with other data sources, e.g., PROMs/PREMs and SUS. The higher upfront technology costs associated with the SACT upgrade (as compared to EBMT) stem from the need to make more substantial changes to SACT in order to collect the relevant outcomes, which is to be expected given the gap analysis detailed in . Around a quarter of the upfront costs pertain to people (staff) resources, and this is driven largely by the provision of training to physicians to improve data completeness. Again, this need is greater for SACT than for EBMT, where data completeness is thought to be better than in SACT (according to expert interviews), resulting in higher upfront people costs for SACT as compared to EBMT.
Annual costs are high as compared to upfront costs, especially in the case of SACT. The annual costs of the SACT upgrade are nearly £300k higher than for EBMT (~£200k vs. ~£500k), due to a much greater need for investment in data managers, which are currently not available in all trusts that submit data. The larger number of data managers required for the SACT upgrade (as compared to EBMT) is explained largely by the fact that there are far more trusts submitting data to SACT (141) than to EBMT (53), meaning that there are more centres where this personnel gap needs to be bridged in the case of SACT.
Technology plays a very limited role in terms of annual costs, as the main ongoing technology cost is for the licenses for the third-party provider app for capturing PROMs and PREMs. This cost is estimated at £25 per patient per year, which pales in comparison to the additional people (staff) resources needed.
Importantly, in Scenario A (the manual workaround), there is great variation in the estimated annual costs when considering different types of OBR schemes (i.e., national vs. trust-level, and patient vs. cohort-level). Since the assessment of product performance and payment is done manually rather than by technology, it follows that the more patient-centric and/or decentralised analyses are more resource intensive than centralised and/or cohort-level analyses. The annual costs for OBR schemes assessed at the individual trust level (B and D in ) are by far the highest, and intuitively, patient-level assessments are costlier than cohort-level assessments. National-level assessments (A and C) are considerably less costly than trust-level assessments (B and D), as there is less duplication of effort.
Furthermore, the estimated annual costs are sensitive to the number of OBR contracts (e.g. for products with multiple indications under OBR, there would be separate OBR contracts per indication) assumed in the analysis. In a situation where we reduce the number of contracts to zero, the annual costs are reduced to ~£200k and ~£500k for EBMT and SACT, respectively, which by and large represents the cost of the data managers across the different OBR schemes (A-D). The marginal increase in the total annual cost per additional product is in the region of £10k, £32k, £7k and £19k for OBR schemes A, B, C, and D, respectively. The annual cost per additional product is moderate, and interestingly in the same region as that charged per product (for a given indication) by the Italian Medicines Agency (AIFA) for products launching with national OBR schemes through their registry. AIFA charges €32k for the first three years, and €15k for each additional year [Citation48], which compares well to the marginal cost per product for the national-level OBR estimates above (£10k and £7k).
Upgrade through part automation (scenario B)
details the results of the estimated cost of upgrading SACT and EBMT through part automation.
Figure 5. Top-level cost estimate for upgrading SACT and EBMT (using part automation) to enable OBR in oncology in England.
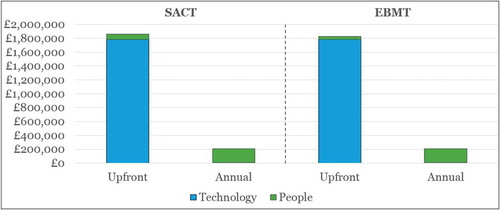
Our estimated costs of upgrade for SACT and EBMT under Scenario B are very similar, reflecting a similar need to implement and run a new platform that integrates data from SACT or EBMT, with PROMs/PREMs and other healthcare data sources. The upfront costs in terms of people, e.g., training of physicians to capture the data appropriately, are lower for EBMT than for SACT (assumed to be half) due to the lower number of centres reporting to EBMT. The annual costs are the same between the two, and represent the resources needed to run and operationalise the new platform, as well as minor additional staff resources at the Commercial Medicines Unit (CMU) at NHS England to track payments and rebates.
Our estimates show that the upfront investment needed to enable OBR through part automation is around five times higher than the upfront investment needed for the manual workaround (Scenario A). While the upfront investment is considerably higher, the subsequent annual costs associated with part automation are considerably lower. Importantly, the annual costs are not sensitive to the number of products (or contracts), as the system is largely automated, and does not require substantial additional staff resources as the number of products increases.
Cumulative costs over time
The substantial difference in annual costs between Scenarios A and B means that the cumulative costs also differ greatly over time, as illustrated in . We present the cumulative costs for the most and least costly approaches for Scenario A (where ‘high’ corresponds to patient-level schemes at individual trusts, and ‘low’ corresponds to cohort schemes at national level) in the green and blue bars, and the cumulative costs for Scenario B by the grey line, showing an average of the EBMT and SACT results, as the respective costs are quite similar for Scenario B (see ).
Figure 6. Cumulative costs* of upgrade Scenarios A (manual workaround) and B (part automation) for SACT and EBMT over time.
* Future costs discounted at an annual rate of 3.5%Low = Outcomes assessed at the cohort/national level; High = Outcomes assessed at the patient/trust level.
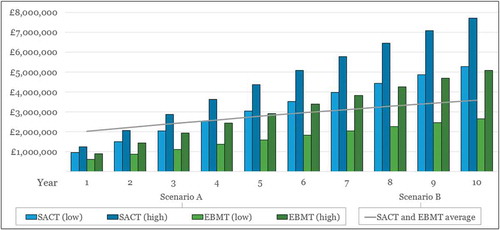
Our top-level estimates of cumulative costs show that although Scenario B is more costly than Scenario A initially, this dynamic changes over time. After five years, the part automation solution (Scenario B) becomes less costly than the manual upgrade (Scenario A, for both ‘high’ and ‘low’ estimates) for SACT. The situation is more nuanced in the case of longer-term cumulative costs for upgrading EBMT. After five years, Scenario B (part automation) becomes less expensive than the manual workaround if we consider the more resource-intensive and costly schemes like assessing patient-specific outcomes at trust level (‘high’). However, if we consider national-level cohort schemes using a manual workaround for EBMT (Scenario A, ‘low’ in ), this remains a less costly option than part automation (Scenario B) well beyond the 10 years shown in the graph (and up to 47 years).
Discussion
Overcoming the issue of decision uncertainty in HTAs is an increasingly discussed topic, and the idea of using real-world data to align prices to actual health benefits seems to be gaining traction. This can be illustrated by the efforts made by EUnetHTA on the European level in terms of highlighting the role of post-launch evidence generation (PLEG) for HTAs [Citation49,Citation50]. The importance of having a suitable data collection infrastructure at the core of such efforts is further recognised by EUnetHTA through the draft Registry Evaluation and Quality Standard Tool (REQueST) to evaluate the suitability of registries for HTA [Citation51].
On the face of it, SACT appears well-placed to facilitate OBR as it has a very high number of English trusts contributing to it, and is run by a trusted national body (Public Health England). However, our findings show that SACT, in isolation, is largely unfit as a framework for enabling OBR, and that significant upgrades and integration with other data sources are required. Furthermore, SACT is only used in England and is,therefore, not scalable to the other devolved nations of the UK (or beyond), where other data collection infrastructures apply. Importantly, SACT does not allow for a systematic tracking of clinical outcomes such as OS, PFS, response or remission, which means that additional data need to be collected either through new data fields in SACT or from other sources (e.g., electronic health records) to enable OBR. Whereas some of these additional data could potentially be collected through NCRAS, it increases complexity, especially when compared to EBMT, where all of these clinical outcomes are collected in one place. SACT in its current form could potentially facilitate OBR in certain cancers where the prognosis is particularly poor, e.g., where a meaningful outcome measure is a 30-day mortality; however, it does not seem equipped to support OBR schemes in cancers where patient survival is better (this is echoed also in CRUK’s 2019 report [Citation14]).
The cell therapy form currently used in the EBMT shows a greater potential to serve as a conduit for OBR; however, this would facilitate OBR schemes based on key clinical outcomes only. The suitability of the EBMT cell therapy form for tracking patient outcomes is illustrated by the EMA’s endorsement of this as a potential vehicle for implementing the regulatory requirements for ATMPs to collect data post launch. The initiatives to involve industry and importantly also physicians (the development of the EBMT forms is driven by physicians) should act to increase buy-in also from these stakeholders. Importantly, it is also scalable across the devolved nations of the UK and across Europe, meaning that it has the potential to become a larger-scale source of real-world data, which would be particularly valuable in rare and ultra-rare indications, which many cell and gene therapies in development are targeting.
Neither SACT nor EBMT allow the capture of economic outcomes or PROMs/PREMs. In terms of economic outcomes, this can potentially be sourced from Hospital Episode Statistics (HES), (Electronic) Health Records (EHR), SUS, and other sources using patients’ NHS ID numbers; however, this requires investment in systems integration, as well as overcoming governance issues (e.g., EHR data are under the governance of individual trusts). PROMs and PREMs such as the ability to return to normal daily activities are increasingly regarded as important, perhaps especially for younger patients [Citation14]; however, there are currently no national databases to collect these data. Nor is there currently an agreed standard or consensus on what PROMs and PREMs are most relevant in cancer, meaning that efforts would need to be made to identify these as well as facilitating an infrastructure to capture the data.
In terms of the costs required to upgrade SACT and EBMT to enable OBR, SACT is more costly to upgrade than EBMT, partly due to the greater shortcomings associated with SACT, but also due to the fact that there are more trusts reporting into it than EBMT. We considered two different types of upgrades for SACT and EBMT, a manual workaround, which requires a great deal of staff resources, and the part automation, where many of the required tasks are automated through technology. Whereas a manual workaround has substantially lower upfront costs than part automation, the high ongoing annual costs associated with the manual workaround mean that the higher upfront costs of part automation would be offset over time. Cumulative costs over time indicate that it would take not much more than four years for the part automation of SACT to become cheaper than the OBR scenarios under manual upgrade, and this is driven by offsetting the high annual costs of operating the manual workaround. For EBMT, the relatively smaller difference between the costs of the manual workaround scenarios and part automation means that it takes longer for the cumulative costs of the latter to become lower than the former. A key reason for this is that the annual costs of the manual workaround are lower in the case of EBMT (than for SACT), and therefore take longer to be offset (by our estimates, five years in the case of national-level cohort OBR schemes, and up to 47 years for patient-level OBR schemes at individual trusts). This is largely driven by the fact that there are fewer EBMT than SACT centres (53 vs. 141), meaning that there are less additional resources needed to operate the OBR schemes at trust level; lower annual costs mean that it takes longer to offset the upfront investment. This means that if the assumptions applied in our analysis were to remain constant, and national-level cohort OBR schemes are the only schemes applied using the EBMT registry, a manual workaround might be cheaper than the part automation over time. However, if the number of products/contracts increases (which is reasonable to assume over time), or patient-level schemes were to be implemented, the part automation solution would become more cost-effective sooner, as we have shown how the annual costs in the manual workaround scenario are sensitive to the number of contracts/products.
Importantly, it should be highlighted, that part automation is a far more scalable option than the manual workaround (which is sensitive to the number of trusts and products under OBR), and less reliant on staff resources (which are very scarce in the NHS), meaning it has a better chance of being fit for purpose also with any changing requirements in the future. Taking a longer view on costs seems to pay dividends in terms of flexibility, which will be key to future-proofing the system.
EBMT seems better equipped to serve as a registry to enable OBR for cell and gene therapies than SACT. Despite this, SACT has an undeniable quality in that it has a far greater reach in terms of the number of trusts using it, and that it is not limited to ATMPs, but can also be used for small molecules and biologics. Considering that a system based on part automation seems like the most cost-effective option, it is tempting to ponder the possibility of a system that is independent of therapy areas and type of treatment. This could potentially increase the cost-effectiveness of the part automation solution and would be a welcome conduit to enabling OBR in therapy areas other than cancer. In the previous work, we have shown that the data collection infrastructures available in the therapy areas most likely to see launches of ATMPs in coming years generally seem patchy and ill-suited to enable OBR. A national registry solution, independent of therapy areas, like the registry operated by AIFA in Italy is an appealing prospect, and something that is worth of further inquiry. An interesting development in this respect is that of auditing and consulting firm EY, who have devised a health outcomes exchange platform, designed to facilitate OBR and advanced contracting in healthcare across countries and therapy areas [Citation52]. This platform appears to provide many of the qualities needed to facilitate OBR; however, at the time of writing, there are no real-life examples from the public domain to draw any learnings from.
The road to widespread adoption of OBR is undoubtedly long and uphill. There are further issues (beyond the appropriateness of the data collection infrastructure) that are integral to widespread adoption, e.g., patient data governance, data sharing between hospitals, challenges around budget cycles and revenue recognition that impede OBR schemes beyond the one-year mark. Although these issues will also have to be tackled if longer-term OBR schemes are to become a reality, we believe that implementing an appropriately automated data collection infrastructure is the right place to start. This registry should integrate clinical outcomes with health economic and humanistic outcomes, and be scalable so that the marginal cost of increasing the number of products or therapy areas is kept low. Importantly, this system should also provide transparency to both manufacturers and NHS stakeholders so that all parties can learn from the outcomes collected in the real world, and maintain confidence in that the financial implications represent the terms that were pre-agreed. It is particularly important to ensure that this data is a resource that clinical staff can benefit from, as such learnings encourage further improvements in patient care, as well as keeping data quality and completeness high. All stakeholders in the healthcare ecosystem are better off if patient outcomes are improved, and this requires a concerted effort by all stakeholders to become a reality. We believe that the time is right for this effort to be made and for the advanced therapies to be complemented by targeted and meaningful real-world data collection to enhance and incentivise quality patient care.
Acknowledgments
Many thanks to Aaron Bean, Alice Blezat, and Katharine Macfarlane for valuable advice and input.
Disclosure statement
No potential conflict of interest was reported by the authors.
Notes
1 Which feeds into the British Society of Blood and Marrow Transplantation (BSBMT) registry.
2 Data fields omitted in include general practitioner and consultant-specific data, patient postcode and height/weight, cycle and regimen number, date of decision to treat, treatment intent, organisation code for drug provider and dosage data.
References
- Cell and Gene Therapy Catapult. The cell and gene therapy catapult UK clinical trials database. 2019 [cited 2019 Apr 10]. Available from: https://ct.catapult.org.uk/resources/cell-and-gene-therapy-catapult-uk-clinical-trials-database
- European Medicines Agency (EMA). Kymriah (tisagenlecleucel) EMA/595919/2018. 2018 [cited 2019 Feb 22]. Available from: https://www.ema.europa.eu/documents/overview/kymriah-epar-medicine-overview_en.pdf
- European medicines Agency (EMA). Yescarta (axicabtagene ciloleucel) EMA/495475/2018. 2018 [cited 2019 Feb 22]. Available from: https://www.ema.europa.eu/documents/overview/yescarta-epar-medicine-overview_en.pdf
- England NHS. NHS England announces groundbreaking new personalised therapy for children with cancer. 2018 [cited 2018 Sep 24]. Available from: https://www.england.nhs.uk/2018/09/nhs-england-announces-groundbreaking-new-personalised-therapy-for-children-with-cancer/
- England NHS. NHS England strikes deal for ground breaking cancer treatment in a new European first. 2018 [cited 2019 Feb 22]. Available from: https://www.england.nhs.uk/2018/10/nhs-england-strikes-deal-for-ground-breaking-cancer-treatment-in-a-new-european-first/
- Staines R NHS to reimburse gilead’s CAR-T in adults. 2018 [cited 2019 Jun 4]. Available from: https://pharmaphorum.com/news/nhs-to-reimburse-gileads-car-t-in-adults/
- Marsden G, Towse A, Pearson SD, et al. Gene therapy: understanding the science, assessing the evidence, and paying for value. 2017 [cited 2019 Jun 4]. Available from: https://www.ohe.org/publications/gene-therapy-understanding-science-assessing-evidence-and-paying-value
- Jørgensen J, Kefalas P. Annuity payments can increase patient access to innovative cell and gene therapies under England’s net budget impact test. J Mark Access Health Policy. 2017;5(1):1355203.
- Garrison LP, Towse A, Briggs A, et al. Performance-based risk-sharing arrangements-good practices for design, implementation, and evaluation: report of the ISPOR good practices for performance-based risk-sharing arrangements task force. Value Health. 2013;16:703–14.
- Adamski, J, Godman, B, Ofierska-Sujkowska, G, et al. Risk sharing arrangements for pharmaceuticals: potential considerations and recommendations for European payers. BMC Health Serv Res. 2010;10:153.
- Carlson JJ, Gries KS, Yeung K, et al. Current status and trends in performance-based risk-sharing arrangements between healthcare payers and medical product manufacturers. Appl Health Econ Health Policy. 2014;12(3):231–238.
- Ferrario A, Kanavos P Managed entry agreements for pharmaceuticals: the European experience. 2013 [cited 2019 Jun 4]. Available from: http://eprints.lse.ac.uk/50513/1/__Libfile_repository_Content_Ferrario%2C%20A_Ferrario_Managed_%20entry_%20agreements_2013_Ferrario_Managed_%20entry_%20agreements_2013.pdf
- Morel T, Arickx F, Befrits G, et al. Reconciling uncertainty of costs and outcomes with the need for access to orphan medicinal products: a comparative study of managed entry agreements across seven European countries. Orphanet J Rare Dis. 2013;8(1):198.
- Cole A, Cubi-Molla P, Pollard J, et al. Making outcome-based payment a reality in the NHS. 2019 [cited 2019 Feb 21]. Available from: https://www.cancerresearchuk.org/sites/default/files/obp_final_report_pdf.pdf
- Carlson JJ, Chen S, Garrison LP. Performance-based risk-sharing arrangements: an updated international review. PharmacoEconomics. 2017;35(10):1063–1072.
- Bouvy JC, Sapede C, Garner S. Managed entry agreements for pharmaceuticals in the context of adaptive pathways in Europe. Front Pharmacol. 2018;9:280.
- Jørgensen J, Mungapen L, Kefalas P. Data collection infrastructure for patient outcomes in the UK – opportunities and challenges for cell and gene therapies launching. J Mark Access Health Policy. 2019;7(1):1573164.
- de Wilde S, Guchelaar H-J, Zandvliet ML, et al. Clinical development of gene- and cell-based therapies: overview of the European landscape. Mol Ther Methods Clin Dev. 2016;3:16073.
- Hanna, E, Rémuzat, C, Auquier, P, et al. Advanced therapy medicinal products: current and future perspectives. J Mark Access Health Policy. 2016;4. doi:10.3402/jmahp.v3404.31036.
- Hanna E, Rémuzat C, Auquier P, et al. Gene therapies development: slow progress and promising prospect. J Mark Access Health Policy. 2017;5(1):1265293.
- Systemic Anti-Cancer Therapy (SACT) Dataset. SACT dataset website 2018 [cited 2019 Feb 25]. Available from: www.chemodataset.nhs.uk/home
- Systemic Anti-Cancer Therapy (SACT) Dataset. Data completeness report: april 2017 – march 2018. 2018 [cited 2019 Feb 25]. Available from: http://www.chemodataset.nhs.uk/view?rid=268
- NHS England. Appraisal and funding of cancer drugs from july 2016 (including the new cancer drugs fund) A new deal for patients, taxpayers and industry. 2016 [cited 2019 Feb 25]. Available from: https://www.england.nhs.uk/wp-content/uploads/2013/04/cdf-sop.pdf
- Systemic Anti-Cancer Therapy (SACT) Dataset. Systemic anti-cancer therapy data set: user guide – version 3.0.1 final. 2018 [cited 2019 Mar 13]. Available from: http://www.chemodataset.nhs.uk/view?rid=270
- The National Cancer Intelligence Network (NCIN). About the national cancer registration and analysis service. 2018 [cited 2019 Feb 26]. Available from: http://www.ncin.org.uk/about_ncin/
- Systemic Anti-Cancer Therapy (SACT) Dataset. Systemic anti-cancer therapy data set: technical guidance − version 3.0. 2018 [cited 2019 Mar 13]. Available from: http://www.chemodataset.nhs.uk/view?rid=271
- European Society for Blood and Marrow Transplantation (EBMT). Registry function. 2018 [cited 2019 Mar 11]. Available from: https://www.ebmt.org/sites/default/files/2018-08/EBMTRegistryFunction.pdf
- European society for Blood and Marrow Transplantation (EBMT). Annual report 2017. 2018. Available from: https://www.ebmt.org/sites/default/files/2018-03/EBMT%20Annual%20Report%202017_0.pdf.
- European Society for Blood and Marrow Transplantation (EBMT). Accreditation definitions. 2018 [cited 2019 Mar 11]. Available from: https://www.ebmt.org/accreditation-definitions
- British Society of Blood and Marrow Transplantation (BSBMT). UK transplant centre list. 2019 [cited 2019 Mar 13]. Available from: http://bsbmt.org/uk-transplant-centre-list/
- European society for Blood and Marrow Transplantation (EBMT). EBMT membership list - country results - UK. 2019 [cited 2019 Mar 13]. Available from: https://www2.clinicalresearch.nl/members/s-ctry2.asp?pais=GB&paislng=UK
- England NHS. Clinical commissioning policy: Haematopoietic Stem Cell Transplantation (HSCT) (all ages): revised. 2018 [cited 2019 Mar 14]. Available from: https://www.england.nhs.uk/wp-content/uploads/2018/07/Haematopoietic-stem-cell-transplantation-All-Ages.pdf
- The British Society of Blood and Marrow Transplantation (BSBMT). About the registry. 2018 [cited 2019 Mar 11]. Available from: http://bsbmt.org/about-the-registry/
- European society for Blood and Marrow Transplantation (EBMT). Data submission. 2018 [cited 2019 Mar 11]. Available from: https://www.ebmt.org/registry/data-submission
- European society for Blood and Marrow Transplantation (EBMT). EMA releases their draft qualification opinion on the cellular therapy module of the EBMT registry for public consultation. 2018 [cited 2019 Mar 11]. Available from: https://www.ebmt.org/ebmt/news/ema-releases-their-draft-qualification-opinion-cellular-therapy-module-ebmt-registry
- European medicines Agency (EMA). Patient registries 2018 [cited 2019 Mar 11]. Available from: https://www.ema.europa.eu/en/human-regulatory/post-authorisation/patient-registries
- European Medicines Agency (EMA). Report on CAR T-cell therapy registries - workshop 9 february 2018 - patient registries initiative. 2018 [cited 2018 Oct 3]. Available from: https://www.ema.europa.eu/documents/report/report-car-t-cell-therapy-registries-workshop_en.pdf
- European Society for Blood and Marrow Transplantation (EBMT). Submitting data to the EBMT. 2018 [cited 2019 Mar 11]. Available from: https://www.ebmt.org/sites/default/files/2018-08/Submitting%20data%20to%20the%20EBMT.pdf
- European society for Blood and Marrow Transplantation (EBMT). Cell therapy - MED - A form. 2017 [cited 2019 Mar 13]. Available from: https://www.ebmt.org/sites/default/files/migration_legacy_files/document/25%20Cellular%20Therapy%20MED-A.pdf
- European Society for Blood and Marrow Transplantation (EBMT). Important change to MED-A forms for cell therapy. 2019 [cited 2019 Mar 13]. Available from: https://www.ebmt.org/ebmt/news/important-change-med-forms-cell-therapy
- European Society for Bone and Marrow Transplantation (EBMT). Cell therapy form manual - a guide to the completion of the EBMT cell therapy med-a form. 2019 [cited 2019 Mar 13]. Available from: https://www.ebmt.org/sites/default/files/2019-03/Cellular%20Therapy%20Manual.pdf
- European medicines Agency (EMA). Draft qualification opinion on Cellular therapy module of the European Society For Blood & Marrow Transplantation (EBMT) registry. 2018 [cited 2019 Mar 11]. Available from: https://www.ema.europa.eu/en/documents/regulatory-procedural-guideline/draft-qualification-opinion-cellular-therapy-module-european-society-blood-marrow-transplantation_en.pdf
- European society for Blood and Marrow Transplantation (EBMT). Cell therapy registry and pharma collaboration. 2018 [cited 2019 Mar 11]. Available from: https://www.ebmt.org/ebmt/news/cell-therapy-registry-and-pharma-collaboration
- Employers NHS. NHS terms and conditions (AfC) pay scales - annual. 2019 [cited 2019 Jun 7]. Available from: https://www.nhsemployers.org/pay-pensions-and-reward/agenda-for-change/pay-scales/annual
- European society for Blood and Marrow Transplantation (EBMT). Cell therapy - MED - A - REGISTRATION - DAY 0. 2019 cited 2019 Mar 14; Available from: https://www.ebmt.org/sites/default/files/2019-03/25_1_Cellular%20Therapy%20MED-A%20Day%200.pdf
- European Society for Blood and Marrow Transplantation (EBMT). Cell therapy - MED - A - SECOND REPORT – 100 DAYS AFTER CELL THERAPY. 2019 [cited 2019 Mar 14]. Available from: https://www.ebmt.org/sites/default/files/2019-03/25_2_Cellular%20Therapy%20MED-A%20Day%20100.pdf
- European Society for Blood and Marrow Transplantation (EBMT). Cell therapy - MED - A - THIRD AND FOURTH REPORTS - 6 MONTH and ANNUAL FOLLOW UP. 2019 [cited 2019 Mar 14]. Available from: https://www.ebmt.org/sites/default/files/2019-03/25_3_Cellular%20Therapy%20MED-A%206M%20and%20Annual%20Follow%20Up.pdf
- Agenzia Italiana del Farmaco (AIFA). Delibera del Consiglio di Amministrazione dell’AIFA n. 37 del 14 ottobre 2014 (11/09/2015). 2014 [cited 2019 Apr 5]. Available from: http://www.aifa.gov.it/sites/default/files/delibera_CDA_AIFA_14102014.pdf
- Meyer F, Brühl H, Ormstad SS Session 3: taking a lifecycle approach to EUnetHTA´s work: current and future collaborations between early dialogue and relative effectiveness assessments. 2018 [cited 2019 Apr 9] Available from: https://www.eunethta.eu/wp-content/uploads/2018/05/Session-3-Merged-25-May.pptx
- European Network for Health Technology Assessment (EUnetHTA). JA3 work package 5 – lifecycle approach to improve evidence generation. 2018 [cited 2019 Apr 9]. Available from: https://www.eunethta.eu/ja3-archive/work-package-5-life-cycle-approach-to-improve-evidence-generation/
- Gimenez E, Espallargues M, Rodrigues J, et al. PHP329 - THE REGISTRY EVALUATION AND QUALITY STANDARDS TOOL (REQUEST) FOR HEALTH TECHNOLOGY ASSESSMENT FROM AN OUTCOMES ASSESSMENT PERSPECTIVE. Value Health. 2018;21:S206.
- EY. The missing piece - how EY’s health outcomes platform can create “triple wins” through outcomes-based contracting. 2018 [cited 2019 Apr 11]. Available from: https://assets.ey.com/content/dam/ey-sites/ey-com/en_gl/topics/life-sciences/life-sciences-pdfs/ey-health-outcomes-platform-the-missing-piece.pdf