
ABSTRACT
Incentives for the development of Orphan Medicinal Products (OMP) development have been introduced in both the European Union and the US, yet there has been a relatively little investigation of the success of these policies. An in-depth analysis of the EU market has not been performed, neither in terms of access nor, especially, in terms of the industrial consequences.
In order to provide potential measures of success of the OMP program in Europe, we have assessed the levels of OMP designation/approval by EMA and the financial performance of the manufacturing companies during the 5-year period between 2011 and 2015.
Of the 1706 products that were granted an OMP designation by EMA during this period, only 138 products (8,1%) reached the market. These products were generally developed by small to medium enterprises (SMEs). In comparison to more mature companies with broader portfolios, these OMP-SMEs are more vulnerable to economic failure due to proportionally higher R&D investment costs, higher sales costs and more limited access to cash at preferential rates. The cost development and their lack of cash availability pout them at financial stake.
While this legislation has been effective in creating access to OMP designation, patients are very highly unlikely to benefit from these developments, often because of non-clinical issues: the marketplace is still immature, and companies are still financially vulnerable. Financial and non-financial incentives will be critical to allow OMP products to reach the market, so that a fully functioning and competitive market can be established.
Introduction
In 1999, the EU enacted specific Regulation[Citation1] to bolster the efforts of the Member States and biopharma/biotech companies to develop solutions in the OMP (orphan medicinal products) area. At that time, there was the perception that patients with rare diseases were underserved and not enough incentives existed for companies to invest in the development of new products for rare diseases and ultimately, bring them to market. Furthermore, previous OMP legislation in the US[Citation2], was starting to show a significant expansion in the development of new treatments for rare diseases, changing the ecosystem.
As we approach 20 years since the ratification of the OMP regulation, we considered it would be important to investigate how successful that legislation has been. Has the legislation been able to foster new clinical benefits for patients, as well as to establish a new marketplace that translates research efforts (public and private) into a sustainable biotech industry supporting OMPs?
The success of any legislation is difficult to evaluate, as there are many confounding elements, such as policy issues, political disputes, and micro- and macro-environmental biases. The development of OMPs should be understood from clinical, industrial, macro-economic, and other perspectives.
It is also important to investigate the opportunities for realising value from previous sunk investments in R&D which result in medical research, intellectual property and potentially a pharmaceutical product. The core objective of the OMP Regulation is for society to benefit from such large previous investments and to encourage other investors to persist in developing valuable intellectual property related to rare diseases.
The definition of success is somehow elusive, ranging from subjective outcomes to more solid, quantifiable outcomes on the gains obtained by the legislation. The objective of this research was to understand how successful the EU OMP Regulation has been in two dimensions: improving clinical benefits and fostering a new economic marketplace for the development of OMPs. The aim of such research could help developers and policymakers understand the required adjustments to be made on the legislation in order to make it more effective in fostering knowledge increase, deliver healthcare benefits to a vulnerable population and protect the sustainability of healthcare systems.
Materials & methods
Clinical gain can be explored in many different ways. Given rare diseases have a multi-faceted impact on health and often affect multiple organs, it is difficult to obtain a single, disease-specific measure of the relative clinical improvements. Using a cross-sectional disease measure (e.g., utilities such as Quality Adjusted Life Years or Life Years Gained) would not only pose ‘feasibility challenges’ (the requirement to undertake analytical research on each disease including those that have minimal numbers of affected patients), but also some ‘technical hurdles’ (validity of the scales, comparability of results), and ‘design challenges’ to make sure every trial or study evaluated was using either a similar or equal utility or a common health-related quality of life (HRQoL) scale.
The approach considered was thus to evaluate the clinical benefit measured by the output of the R&D process, using metrics such as OMP designations and OMP commercialisation, noting some drugs may lose OMP designation if new indications were added to their label. As per EMA’s criteria, we should accept that if a drug is granted approval it is because benefit exceeds risks (i.e., there is some potential clinical benefit); equally, if it is granted OMP designation it is because it tackles a small enough group for which the need is perceived to be higher, making small benefits more relevant.
Data were obtained from EMA (European Medicines Agency) for the period 2000–2016 (November), and within drugs having EMA’s marketing authorisation, the analyses investigated marketed vs non-marketed drugs. For the drugs approved in 2014–15 (two previous years with complete data), we classified drugs in four categories (biologics, gene therapies, cell therapies and others); this allowed us to look into the growth rate of categories considered to be new therapies, including gene and cell therapies.
To understand if the new OMP development marketplace was sustainable, the financial performance of the different companies operating in the OMP sub-sector was investigated. We compared company performance in terms of their financial structuring. Sources considered included publicly available financial statements and comparison of companies according to the size and maturity of the organisation.
To establish the different types of companies, the publication from Morel [Citation3] provided a good starting position, and then looking at the criteria, we considered alternative relevant companies that align with the different subtypes of companies. The essence of the analysis was to compare companies focusing on OMPs (i.e., ‘orphan focused’) vs more diversified companies. To ensure a good sample of OMP targeted companies the group was deliberately enriched. We finally looked into 17 different companies, divided into three different groups (): Broad Portfolio Companies (BP) (AstraZeneca, Bristol-Myers Squibb, Eli Lilly, GlaxoSmithKline, Novartis, Novo Nordisk, and Takeda), Portfolio Biotech Companies (PB; Amgen, Biogen, Celgene and Shire) and OMP Focused Companies (OMPf; Actelion, Alexion, Biomarin, Raptor, Sobi and Vertex). The companies were further separated into two groups, merging together the BP and PB companies in what could be called Portfolio Companies. Even if initially PB companies did originally base their activities on OMP, they are now diversified beyond an OMP focus and have reached a business size that allows merging the data with the other companies.
Table 1. Classification of the reviewed companies in groups.
Financial data for individual companies were obtained from two sources: their published financial results, and results published by Morningstar [Citation4]. The original time frame was limited to 3 years but was later expanded to encompass the years 2011–2015, to account for variations in the performance of the companies. CAGR was calculated for several parameters.
Results
Since the year 2000, 1706 drugs have been submitted to EMA according to the new EU OMP Regulation, and 1360 (79,7%) have had a positive opinion (). Almost 300 applications (299, which amounts to 17,52%) were withdrawn by the applicants, possibly corresponding to a learning curve, as the number of withdrawn applications has been reduced almost to zero in the last 5 years.
Figure 1. Outcomes of drugs submitted to EMA for OMP designation in the last 6 years (data for 2016 incomplete).
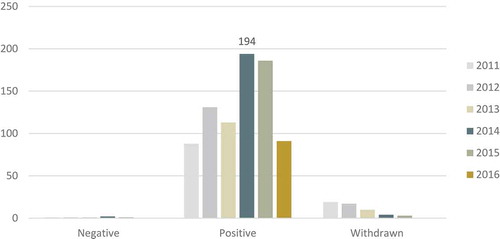
However, looking at the marketed drugs, only a small 8.1% (n = 138) of those with approved designations progressed to the market. The rate at which new products were marketed in the last decade does not show any significant change, ranging annually from 3 to 11 (average of 9,2 marketed products/year).
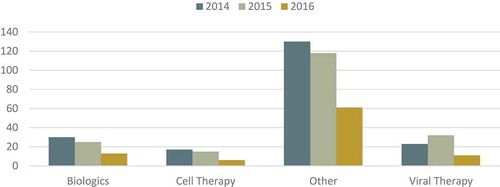
Additionally, an increase in the rate of approval of so-called ‘new therapies’ would be expected overtaking ERT (Enzyme Replacement Therapy) or the approval of ‘small-molecules’ which have been the most commonly approved product categories in previous years. The analysis from 2014–16 () shows that ERT and small molecules are still, by a large margin, more commonly approved than other viral, biologic or cell-therapy strategies, which show small and not increasing numbers.
Figure 2. Technologies supporting newly proposes rare disease treatments.
Looking at the performance of companies in the analysed period (2011–15) (), the Total Asset CAGR of OMPf companies was stronger than the growth for PB and BP pharma companies, with all CAGRs being positive. Equally, all companies have been increasing their total debt, with PB companies borrowing the most and BP borrowing the least (mean Debt CAGR OMPf +1,36; mean PB +1,44; mean BP 1,25). Considering total debt to equity, OMPf companies have less debt as a part of their cost of capital and are much more reliant on more costly equity.
Table 2. Comparative economic results according to two different segmentations.
The mean equity gain is positive in CAGR for BP (+14%) and PB companies (+17%), but is negative for the OMPf companies (−25%), showing again the disparity in the cost of capital for the different companies. OMPf companies grew more organically, as shown by their debt/asset ratios, relying more on the value of their assets to grow. Debt to equity shows again high reliance on equity which is costlier to borrow.
The sales volume is obviously different in absolute terms. Here again, we see differences in the cost of sales as they are significantly higher for OMPf when related to their revenues (ratio 0,95 OMPf; 0,26 PB; 0,29 BP) or related to their operating costs (ratio 1,98 OMPf; 97,76 PB; 4,51 BP). R&D represents a huge investment in all three groups of companies, spending around 17–18% of their revenue in R&D, but with some OMPf companies spending significantly more, exceeding 100% of their revenue in this period for some companies.
Finally, as we look into profitability CAGR of the EBITDA, there is a mild negative growth for BP companies (−5%), but, much more importantly, this is markedly higher for the OMPf companies (−113%).
In the two-group comparison, OMPf vs Portfolio Companies (i.e., BP and PB companies) the results were very similar, and again main differences were found on the source of funding and the relative reliance on asset growth and equity for capital.
Discussion
This study aimed to explore if the EU Regulation granting OMP benefits had been successful in promoting the development of therapies for orphan diseases, and overall it supports the view that this program has been largely effective. The number of approved treatments for OMPs therapies has been steadily increasing since the implementation of the OMP legislation and companies have benefited from these incentives. The legislation has fostered the creation of wellbeing, health and wealth, all contributing to an increase in social value by creating high-quality employment in cutting edge fields, developing a knowledge economy, as suggested by the Lisbon Treaty [Citation5].
From a clinical perspective, over the past 3 years, an average of three new products was granted OMP designation every week (more than 180 per year), which indicates that companies are actively utilizing the OMP pathway. In the period of 2011–15, the number of positive opinions on OMP has grown steadily from 4.5% to 19,2%[Citation6].
Even if these drugs target a relatively small number of patients, there is a large clinical benefit for individual patients, especially in diseases with no alternative treatment options. However, small and limited in time the benefit may be, there is a gain derived from the OMP Regulation that has been transferred to the clinic, and improving the lives of patients. The investments undertaken to develop and deliver these medicines to society are resulting in externalities in the economy, as the return on R&D may go beyond the biotech sector and translate into other areas of society (e.g., GoreTex® is now widely used in surgery).
From the financial perspective, the positive trend we see is also a continuation of the investments in innovative research made by public and private institutions. Every new discovery is the starting position for the next piece of research. But even if that is positive in itself, it is showing investigators that their research can be transitioned from the benchtop to the bedside. Every new drug that is approved is a very strong positive incentive for the research community to pursue their basic research and strive for new clinical treatment options. The EU has set an R&D investment goal of 3% of the GDP, hoping that this will foster a knowledge society. The level of public investment in R&D has been enormous in the previous years before and even during the financial crush [Citation7], and part of it is now flourishing as cutting-edge technology that can be applied to healthcare, even if the originating sector is not health itself. It has been made clear that ‘demographic and competitiveness challenges can be tackled, at least in part, by boosting innovation in healthcare’[Citation8].
The investments are made in the hope that they will deliver societal returns, for an input-to-output ratio of around 3 to 4 in healthcare [Citation9], again signalling that healthcare should be seen as an investment, not an expenditure Accepting that it may be difficult to track [Citation10,Citation11], we can now assert that the OMP legislation has supported initiatives which have started delivering those returns.
Morel and Simoens [Citation12] analysed the nature of the companies submitting therapies for OMP designation and found that more than half (50.6%) of the companies in developmental stages (pre-clinical to phase III) were SMEs, and 13% were intermediate size companies. The emergence of at least 321 new SMEs or intermediate companies solely in the OMP environment has to be seen as a success; these companies employ people, require office space, utilize facilities, etc., all of which are good for welfare, but also further entrench a knowledge-based economy.
These numbers indicate that it is a flourishing environment, but far from being a mature industry.
From our research we can learn that OMPf companies are investing significantly more (as a percentage of revenue) in their sales, reinforcing the idea that because it is a scattered market it is more expensive to serve. The absence of a well-established and stable commercialisation model seems to be a very high toll to those companies. We may claim that it is not until OMPf companies can have several parallel markets overlapping (i.e. they are able to commercialise several products with one field-force) that they do not run into significant economic of scale making the business profitable; figures from the PB companies would support this idea, as they show the most positive CAGR figures in EBITDA but also in RoE and the highest cost-of-sales to revenue ratio.
Important also to note that the RoE and TEquity CAGR of the OMPf companies are negative, compared to the BP and PB which have positive figures, meaning a progressive de-capitalisation as they invest in uncertain assets to attract capital, but also diluting their shareholder’s assets. It seems that almost by nature OMPf companies remain in the non-profitability status until they can achieve a certain level of maturity, where they become profitable and attractive to BP companies, which may wish to acquire them to benefit from their surplus to sustain their less profitable more mature markets. If we want to pair maturity with profitability (which would link to competition), it does sound reasonable to think that OMPf, PB and BP represent three different levels of maturity of the market, obtaining their resources from different lenders, but also as a way to internally finance operations: within a BP company, more immature assets are leveraged to finance the more mature (and less profitable) segments of the market. Still, OMPf is in the risk of not making it to PB and therefore making the internal sustainability chain more difficult. The recent acquisitions of Celgene® or Tesaro® seem to confirm this hypothesis: a BP company acquires fresh profitable assets to maintain their value but also to reduce its external capital dependency.
The number of designated OMP drugs does not fairly represent the size of the economic activity. We have shown that all companies have growing assets. Evidence shows that small companies, such as OMPf, heavily investing in R&D can grow faster [Citation13], but at the same time, growth requires injections of capital. Available evidence [Citation13] points that innovative companies that do not have more than 2 years of available cash are unlikely to be able to sustain or survive because of the risk of financial collapse as they access higher cost equity. As much as 42% of the biotech companies in Europe were in that situation in 2015 [Citation14], a slightly higher figure than in 2014. As shown in the analysis, PB companies rely on long-term debt, and BP companies finance some of their activities from their revenues.
As with any other innovative companies, OMPf companies have limited options to finance their operations. It is true they have increased their borrowing, but at a much lower debt-to-equity ratio, signalling either a reluctance from the capital markets or doubts on their potential profitability. As small companies in the development phase, they have a higher death rate and are less likely to be taken over than larger companies [Citation15]. In the absence of appropriate incentives, most of these SMEs will never achieve sustainability nor profitability. In that sense, signals are not encouraging; only 8,1% of the drugs with a positive opinion have been marketed since the approval of the legislation. Even more, when we look at the last 5 years (2011–15), the proportion of treatments that proceed to market is even more discouraging, and only 4,4% (18 drugs) of those positive opinions are marketed (range 0–12%). In an analysis of the first decade of approvals by EMA (2000–2012), Giannuzzi [Citation16] showed that a large number of drugs never started development (abandoned drugs) whereas for those there was a development 47% reached phase III, but still point to bankruptcy as the second cause for discontinuation of approval process, possibly linked to their small size and financial capacity.
A high company death rate is a collective failure. First, a significant number of SMEs emerge from Universities and Research Institutions, whose resources and knowledge will be lost. But most importantly, if companies do not survive, there will never be healthy competition in the orphan marketplace. The current number of OMP-dedicated companies is still insufficient to maintain a fully functioning market, as there are not enough players to generate real competition. At the current pace, it is hard to see how a market made from oligopolies and oligopsonies will be overcome if it is not by jumbo groups [Citation17].
Hughes [Citation18] analysed the number of pharma/biotech-listed companies in the US and in the EU for the 2000–2012 period, and concluded that of the 86 global companies, only 4 companies operated solely in the EU, compared with 61 operating solely in the US (and 21 in both). It is interesting to note the location dynamics [Citation18] that has arisen in the US, where small firms on the West Coast have focused more on growth via patenting than on size, generating a small-business environment ultimately being more successful in drug discovery. It may be the case that the same east-west divide is happening between the US and the EU, as in the former the environment is more fertile and the location more dynamic including a regulatory and financing environment that actively encourages entrepreneurship.
A recent forecast [Citation19] on the OMP market shows that within the top 20 companies selling OMPs, 8 of them would be considered to be either OMPf or PB (4 + 4 or 20% + 20%), with 22,0% of the projected 2020 market sales. Even if this is another signal of the progress of the market, these data point out to show the immaturity of the market, or at least the difficulty of becoming a relevant player with small size.
Immaturity may also be seen from the number of ‘new biotechnological therapies’ being approved, which is not taking-off according to the rate of approvals in the past years.
When analysing the EBITDA of the OMPf companies, there is a clear and worrying signal; in the analysed period, the CAGR is negative, and therefore the companies still require sustained support to harbour some positive results. These results are similar to others that were published in the past [Citation11], and challenge some evidence published by Hughes [Citation14], but those were data including only publicly listed companies whereas we have included a different sample to overcome the finding bias that listing carries over. It will take these companies some more years to reach profitability. They will still be investing proportionally more in R&D than their competitors, to build their assets so that they are able to go to the market and build growth on debt at a lower cost of capital, and they still face a more expensive commercial model (given the scattered nature of their patients).
There are limitations to the evidence we present, as there may be several sources of bias. First and foremost, there is a bias in the selection of companies for comparison. Even if an effort has been made to include a diverse group of companies, there are clear differences across their portfolios, phase of development, and management nature. The companies selected represent roughly 50% of the OMP market according to Evaluate Pharma figures [Citation20]. The second bias comes from the important variability of financial results for the OMP companies, which may have very different results from 1 year to the other. An attempt to control this has been made by analysing 5-year series, but still, this does allow for certain variability.
Conclusions
This study has reviewed the evidence on the EU OMP Regulation and has found there has been a clinical benefit, as many patients can now access newly available treatments, and that research is now more effectively being translated from the benchtop to the bedside.
Beyond the clinical improvement, legislation has created a set of incentives, attracting a plethora of SMEs, which are competing in an evolving, albeit immature, market. OMP-dedicated companies, often being dependent on the development of a single treatment, are too vulnerable to survive on their own in this immature market without adequate incentives. Given that there is a social belief that these companies fulfil a clearly defined societal need, long-term support should be put in place to support these companies and their medical innovations.
After all, the benefits of the OMP Regulation seem clear. The legislation has effectively created incentives, has arguably been successful in delivering new treatment options to rare disease patients. Additionally, sparking a new marketplace that, as it unfolds and matures, will behave more competitively, but that is not currently proving to be overly profitable.
Financial disclosure
OSM has consulted for most of the multinational pharmaceutical companies, including all ‘top 10ʹ. He has received fees and honoraria for such consultancies, and is currently engaged in several projects with many of these companies. He holds ownership of several start-up companies in the healthcare field, and has had in the past stock ownership of ‘Top 10ʹ pharmaceutical companies.
Précis
OMP legislation introduced incentives which have proven to be effective, springing a new industrial sector with a differentiated industrial profile than other pharmaceutical companies.
Acknowledgments
The author would like to thank Jorge Mestre Ferrandiz PhD, Mohit Jain PhD, and Ivana Cattaneo for the input on this article.
Disclosure statement
No potential conflict of interest was reported by the author.
Additional information
Funding
References
- European Parliament and Council Regulation (EC) No 141/2000 of 16 December 1999 on orphan medicinal products.
- The 97th USA Congress An Act to amend the Federal Food, Drug, and Cosmetic Act to facilitate the development of drugs for rare diseases and conditions, and for other purposes. Effective January 4, 1983
- Morel T, Lhoir A, Picavet E, et al. Regulatory watch: the orphan drug pipeline in Europe. Nat Rev Drug Discov. 2016 Jun 1;15(6):376.
- [cited 2016 Nov 15]. Available from: www.morningstar.com
- European Union. Treaty of Lisbon Amending the Treaty on European Union and the Treaty Establishing the European Community, 13 December 2007, 2007/C 306/01
- European Medicines Agency, 2015 Annual Report, EMA 2016
- [cited 2019 Dec 6]. Available from: https://ec.europa.eu/eurostat/statistics-explained/index.php/R_%26_D_expenditure
- European Medicines Agency Information on benefit ct, Work package 4 report: Benefit-risk tools and processes EMA/297405/2012
- Alvarez MJ, Martinez F. R Vidal La contribució del Sector salut a l’economia, in Estartègies per Sortir de la crisi, Fulls Econòmics del Sistema Sanitari, Oct 2009 Servei Català de la Salut.
- Panel on the return on investments in health research. Making an impact. A preferred framework and indicators to measure returns on investment in health research. Ottawa, ON (Canada): Canadian Academy of Health Science (CAHS); 2009. Available from: www.cahs-acss.ca/e/pdfs/ROI_FullReport.pdf
- Adam P, Permanyer-Miralda G, Guillamón I, et al. Impact of clinical and health care services research on advancing knowledge. Study applied to the CAHTA‟s research Calls (third edition). Barcelona: Catalan Agency for Health Technology Assessment and Research. Catalan Health Service. Department of Health. Government of Catalonia; 2010.
- Morel T, Simoens S. Market watch: are orphan drug companies the pick of the pharmaceutical industr. Nature rev Drug Discov. 2014;13:10.
- Del Montea A, Papagani E. R&D and the growth of firms: empirical analysis of a panel of Italian firms. Res Policy. 2003;32:1003–7.
- E&Y Biotechnology Report 2016: returning to Earth, E&Y 2016
- Dunne P, Hughes H. Age, size, growth and survival: UK companies in the 1980s. J Ind Econ. 1994 Jun;42(2):115–140.
- Giannuzzi V, Landi A, Bosone E, et al. Failures to further developing orphan medicinal products after designation granted in Europe: an analysis of marketing authorisation failures and abandoned drugs. BMJ Open. 2017;7:e017358.
- Drummond M, Jönsson B, Rutten F, et al. Reimbursement of pharmaceuticals: reference pricing versus health technology assessment. Eur J Health Econ. 2011;12(3):263–271.
- Hughes DA, Poletti-Hughes J. Profitability and market value of orphan drug companies: a retrospective, propensity-matched case-control study. PLoS ONE. 2016;11(10):e0164681.
- Demirel P, Mazzucato M The evolution of firm growth dynamics in the us pharmaceutical industry: is ‘structure’ in the growth process. Related to size and location dynamics? Innogen working paper no. 66; November 2008
- EvaluatePharma® Orphan Drug Report 2015; Evaluate Oct 2015. Availabe from: www.evaluategroup.com/orphandrug2015