
 ?Mathematical formulae have been encoded as MathML and are displayed in this HTML version using MathJax in order to improve their display. Uncheck the box to turn MathJax off. This feature requires Javascript. Click on a formula to zoom.
ABSTRACT
Background: In many countries, Budget Impact (BI) informs reimbursement decisions. Evidence has shown that decision-makers have restricted access based on high BI estimates but studies show that BI estimates are often inaccurate.
Objective: To assess the accuracy of BI estimations used for informing access decisions on oncology drugs in the Netherlands.
Study Design: Oncology products for which European Medicines Agency Marketing Authorisation was granted between 1-1-2000 and 1-10-2017 were selected. Observed BI data were provided by FarmInform. BI estimates were extracted from the reimbursement dossiers of the Dutch Healthcare Institute. Products without an estimated BI in the reimbursement dossier were excluded. Accuracy is defined as the ratio observed BI/estimated BI.
Setting: General community, the Netherlands.
Results: Ten products were included in the base case analysis. Mean accuracy was 0.64 and observed BI deviated by more than 40% and 100% from the estimated BI for 4 and 5 products, respectively. For all products together, €141 million BI was estimated and €82 million BI was observed, a €59 million difference.
Conclusions: The findings indicate that BI estimates for oncology drugs in the Netherlands are inaccurate. The role and use of BI in reimbursement decisions for these potentially life-saving drugs should therefore be considered carefully, as well as BI estimation methodology.
Introduction
Increased spending on oncology drugs is a global problem of major concern [Citation1,Citation2]. The global annual spending on oncology drugs was around US$ 35 billion (€28.5 billion) in 2006, compared to around US $100 billion (€81.5 billion) in 2017. This figure is expected to rise to $150 billion (€122 billion) in 2020 [Citation2]. The increasing number of oncology approvals for new and existing drugs, higher prices for personalized medicine and potential off-label use causes an increasing burden to health-care budgets and therefore results in growing affordability [Citation3–Citation5].
Budget impact analyses (BIA) are performed and submitted as part of reimbursement applications in many countries to quantify the potential budget impact (BI) [Citation5–Citation7]. Next to clinical evidence and cost-effectiveness, BI has a formal role in many countries in assessing affordability and therefore a role in informing reimbursement decisions (e.g., for orphan and specialty drugs) [Citation6,Citation8,Citation9]. Various recent cases have shown that decision-makers have restricted access to new drugs based on high BI estimates [Citation2,Citation6,Citation10–Citation13].
BI estimates used by decision-makers for informing these reimbursement decisions are however often inaccurate [Citation11,Citation14]. Keeping et al. described that BI estimates used by the All Wales Medicines Strategy Group (AWMSG), the Welsh Health Technology Assessment (HTA) agency, deviated from observed BI with more than 40% in 80% of the cases [Citation14]. Similar or even higher deviations were reported by others [Citation15,Citation16].
In the Netherlands, the estimated BI of hepatitis C drugs was nearly twice as high as the observed BI [Citation11]. Also, among other types of information (e.g., cost-effectiveness ratios), BI estimates have contributed to decisions for initial access restrictions as well as price negotiations [Citation11,Citation17]. For oncology drugs, access restrictions are currently imposed [Citation13,Citation18]. The accuracy of BI estimates for oncology is however unknown, potentially hampering decision-makers in considering the uncertainty in BI outcomes. Especially in the oncology field, various schemes have been implemented by decision-makers to manage affordability and BI, such as the Cancer Drug Fund in the UK, and various managed entry schemes frequently used for oncology drugs in, for example, Sweden, Belgium and Italy [Citation19–Citation21]. In order to provide more insight into this source of uncertainty and to allow for a better appraisal of BI, this study aims to quantify the accuracy of BI estimations using Dutch reimbursement decisions on oncology products as an example.
Methods
Data source for observed and estimated BI
The Dutch National Healthcare Institute (ZIN) is the Dutch HTA agency and conducts BIA for new medicines [Citation22]. The manufacturer of a new (expensive) medicine is obliged to provide ZIN with a reimbursement dossier, stating the product’s price and containing a description of estimated relative effectiveness, cost-effectiveness and budget impact [Citation22]. The manufacturer’s dossier is assessed and appraised ZIN after which ZIN provides the data, findings, comments and advice to the Minister of Health (MoH) in a publicly available reimbursement dossier. The results (e.g., BI) presented in this final reimbursement dossier can therefore differ from the results supplied by the manufacturer.
BI typically pertains to the additional costs associated with the implementation of a new medicine in a healthcare system [Citation5,Citation23]. BI therefore not only includes the additional costs of the new medicine but also encompasses savings due to the replacement of another treatment. ZIN estimates BI by estimating the volume of the new medicine, composed of the size of the patient population, the market penetration and the treatment duration. This volume is then multiplied by the stated medicine price. Savings due to replacement is then subtracted to obtain the estimated BI. As the medicine price is regarded as a constant, only the volume-related factors have to be estimated and are therefore uncertain. As market uptake of a new medicine is gradual, ZIN estimates BI for the first 3 years after market introduction where the BI in the third year serves as the benchmark for the reimbursement advice to the MoH [Citation22].
As (savings by) replacement of alternate therapies is hard to measure and as the relative influence of replacement of the existing treatment vs the introduction of the new treatment is expected to be low in oncology, we henceforth define BI solely as the additional expenses for the new treatment [Citation17,Citation24]. This methodology has successfully been used in other studies describing BI estimation accuracy [Citation11].
The observed BI data were provided by FarmInform [Citation25]. This Dutch population-level data source contains the monthly volume of all in- and outpatient prescription drugs. BI was calculated by multiplying the volume by the Dutch list price [Citation26]. This BI data were available for the period from 1 January 2000 to 1 March 2018. The validity of the data was assessed by crosschecking with a patient-level data source that is representative of the Netherlands [Citation27].
BI estimates were extracted from the publicly available ZIN reimbursement dossiers [Citation28]. The date of publication of the dossier was denoted as index date. The estimated BI in the entire third year after the index date was used as estimated BI. Costs or savings due to the replacement of alternate therapies were then subtracted. This yields an estimated BI that is solely composed of the costs (as price * volume) of the new medicine and is therefore comparable with the observed BI.
Product inclusion
Products were selected that obtained a European Medicines Agency (EMA) Marketing Authorization (MA) between 1-1-2000 and 1-10-2017. To select oncology products, only products were included that belonged to the L01 (antineoplastic agents) ATC category and had an initial oncology indication as specified by the European Public Assessment Report (EPAR) [Citation29]. Biosimilars, generics and products that were not designated as a ‘New Active Substance’ by the EMA were excluded. Furthermore, a ZIN BIA should be available. Finally, products without the full market data of the third year available were also excluded.
Assessment of BI estimates from reimbursement dossiers
In some cases, a BI range is given in the reimbursement dossiers. In these instances, the average of the minimum and maximum BI estimate was included.
Oncology products can have multiple indications and Dutch reimbursement decisions are typically on indication level instead of on product level. Therefore, a BIA is typically tailored to a specific indication. The observed BI data source does not contain data on indication. In order to accurately assess the BI estimation accuracy, all observed BI must be attributable to the indication covered in the BIA. In other words, there must be no second indication that generates BI as this will falsely be attributed to being generated by the indication covered in the BIA and thus alter estimation accuracy.
BI can be generated (and recorded) sometime before the index date as a form of early access or compassionate use scheme. Similarly, the actual availability of a product (and consequent BI) can lag behind the index date. We therefore assumed that when the first BI record in the dataset was at most 6 months from a product’s index date, all observed BI was generated by the indication for which BI was estimated. Only the products that meet this criterium were included in the primary analysis. The products that did not meet this criterium were included in a secondary analysis.
When an additional reimbursement dossier (including BIA) was published within the 3 years after the index date, we adapted estimated BI to reflect this. In this case, we added the estimated BI of the second indication to the estimated BI of the initial indication. This addition was performed on the publication date of the second indication’s dossier.
Accuracy definition
Estimation accuracy was calculated as:
We used this description of accuracy as primary outcome as it is frequently used and easy to interpret. When however using EquationEquation (1)(1)
(1) , underestimations yield ratios from 1 to infinity whilst overestimations yield ratios from 0 to 1 so averaging these ratios gives biased results [Citation30,Citation31]. To overcome this, a symmetric accuracy in the form of EquationEquation (2)
(2)
(2) was used as a secondary outcome [Citation30,Citation31].
In order to allow for a comparison with other literature, estimation accuracy was also calculated as percentage difference, defined in EquationEquation (3)(3)
(3) .
To illustrate the uptake and estimation accuracy over time, we plotted accuracy against the index date. For improved interpretability, loess smoothing was applied and was performed using R version 3.5.2 and ggplot2 version 3.1.1 [Citation32,Citation33].
Results
Nineteen products were included of which 10 are included in the primary analysis and 9 in the secondary analysis. displays the characteristics and outcomes of all the included products. In , the aggregated outcomes are presented.
Table 1. Characteristics and budget impact of 19 oncology products
Table 2. Aggregated budget impact accuracy. Primary analysis set indicates that a product’s first BI record occurred within 6 months of the index date
Primary analysis
shows that the BI estimate for Nexavar was least accurate with an accuracy of 0.14 and a €24 million net overestimation. As can be seen in , the mean accuracy is 0.64, the mean percentage difference is 142% and the mean symmetric accuracy is 2.50. These results illustrate that, on average, for each €1 estimated only €0.64 is observed. For each individual product, an estimated €1 compared to a mean observed BI of €0.40 or €2.50, dependent on whether BI is over- or underestimated, respectively. The total observed BI of €82 million was overestimated by €58.5 million.
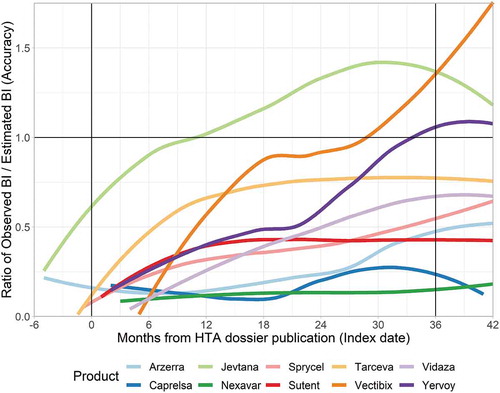
In , the development of accuracy over time is presented. Time is defined as the months from the index date. Accuracy of 1 implies that observed BI exactly matches estimated BI. As the ZIN BI estimates are for the whole third year, the average ratio in months 24–36 should ideally be 1. shows that BI uptake is rather gradual and that products that are overestimated at around 12 months generally do not reach their estimated BI.
Figure 1. Estimation accuracy of the primary analysis. Primary analysis indicates that a product’s first BI record was within 6 months of the index date
Secondary analysis
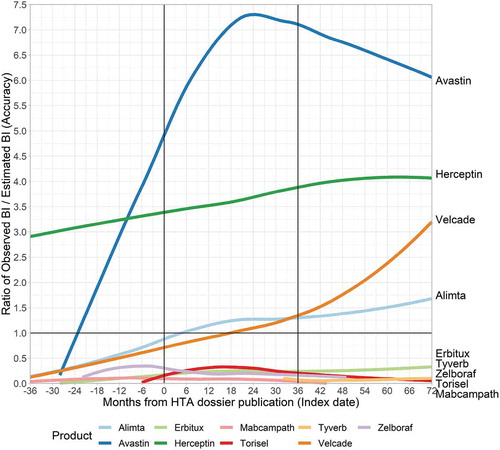
In the secondary analysis, individual accuracy (see and ) is lower than for the products included in the primary analysis. This is however at least partly due to the previously described difference in indication. For Herceptin, for example, no reimbursement dossier was available for the initial (and very large) indication of HER2-positive breast cancer [Citation34]. The Herceptin BIA, which resulted in inclusion in this study, only covered out-patient Herceptin use [Citation34]. The relative BI of this subgroup was relatively small and therefore impacts the results. For Avastin, high off-label use likely caused a very high observed BI relative to the indication for which BI was estimated.
Five products (Erbitux, Tyverb, Zelboraf, Torisel, Mabcampath) display a very low ratio. Of these products, Mabcampath, Zelboraf and Erbitux had early market exposure relative to their index date. Despite this potential availability of market data, their BI estimates were still rather inaccurate.
Figure 2. Estimation accuracy budget impact in the secondary analysis. Secondary analysis indicates that a product’s first BI record was separated from the index date by more than 6 months
Discussion
This study aimed to quantify the accuracy of BI estimates reported in reimbursement dossiers, using oncology products in the Netherlands as an example. Of the 10 products included in the primary analysis, the estimated BI was €140.7 million whilst only €82.1 million was observed. This difference would imply an aggregated accuracy of 0.58 with a mean accuracy for the individual products of 0.64. The mean symmetric accuracy and the mean percentage difference were 2.50% and 142%, respectively.
Keeping et al. assessed the accuracy of BIAs conducted by the AWMSG [Citation14]. They reported that only 18% of estimations were within 40% of observed BI as defined by percentage difference. In the third year after introduction, Keeping et al. reported that 7 (14%) and 13 (27%) products of a total of 49 were within 40% and 100% of estimated BI. In our (primary) analysis, these figures were 4 (40%) and 5 (50%). The results are not directly comparable as Keeping and colleagues only included two oncology products.
Cha et al. and Broder et al. also investigated BIA accuracy but their relevance in this regard is limited as they did not target BIAs for informing reimbursement decisions [Citation15,Citation16]. They did, however, report considerable estimation inaccuracy (5.5-fold overestimation by Broder et al. and 60% of products deviated by >40% by Cha), strengthening the evidence base that BI estimates are often inaccurate and thus pose a source of uncertainty to decision-makers that need to take BI into account.
The secondary analysis shows some interesting findings, with, for example, Mabcampath and Zelboraf, that show BI records preceding the index date by more than 6 months. For these products, observed BI remained well below the BI estimations reported in the eventual BIA. If the initial BI was generated by a different indication than covered in the BIA, the over-estimation relative to the indication in the BIA would be even greater. In other words, an indication that generated BI but is not covered in the BIA contributes to the observed BI, thereby increasing the value of the accuracy outcome (see EquationEquation 1)(1)
(1) . Therefore, for products with overestimated BI (accuracy <1; Mebcampath, Zelboraf, Tyverb, Torisel, Erbitux), it could be assumed that the reported accuracy is a best-case scenario. These five products incurred BI that deviated by >100% from estimated BI. We can therefore conclude that at least 10 of 19 (53%) products deviated by >100%, and potentially even 14 of 19 (74%) products.
Our findings thus show that BI estimates are generally inaccurate. It is known that BI estimates are often used for confidential price negotiations between manufacturers and payers [Citation35]. In that regard, a higher BI estimate could be an incentive and argument for a payer to attempt to negotiate a discount, although we have no evidence to support this suggestion. Our findings regarding BI estimation inaccuracy should, however, warrant careful consideration of the role of BI in access decisions. Given the inaccuracy and large deviation in accuracy between products, uncertainty in BI is evident and should definitely be considered when BI informs decision-making.
Furthermore, as indicated by a review by Vooren et al., limitations in current BIA methodology and/or lack of adherence to the ISPOR budget impact guidelines might be a cause for the relative lack of accuracy [Citation8,Citation36]. We believe that, given the importance of BI in decision-making, efforts should be undertaken to improve BIA methodology and, for example, to properly address uncertainty in BI estimates.
We have some limitations to address. First, our sample size with regard to the number of products was quite small. We, however, chose to impose limitations on the deviation of the first BI record from the index date to assure that the comparison of the estimated BI is accurate. Our secondary analysis shows that for at least five more products, we can conclude that their BI assessment deviated by >100%.
Second, we were unable to account for (off-label) indication extensions for which ZIN did not publish a BIA. As BIAs typically are conducted for expected BI over €2.5 million, we assume that indication extensions without BIA would have generated a relatively low BI and thus had little influence on our results [Citation23,Citation37].
Conclusion
The 10 products included in the primary analysis resulted in total BI estimates of €140.7 million whilst only €82.1 million was observed. For at least 53% of the included products, the observed BI differed from the estimated BI by more than 100%. These findings, combined with the large deviation in accuracy between different products, lead us to conclude that Dutch BI estimates for oncology drugs are often inaccurate. They are thus an inevitable source of uncertainty to the decision-maker impacting reimbursement decisions and therefore potentially leading to restricted access for patients. The role and use of BI in reimbursement decisions for these potentially life-saving drugs should therefore be considered carefully, as well as the need for improvements in BI estimation methodology.
Acknowledgments
We want to thank FarmInform for providing the observed BI data.
Data availability statement
The observed BI data used in this study are proprietary and were provided by FarmInform but third-party access is restricted by means of a confidentiality agreement. Interested third-parties can request the data at [email protected]
Disclosure statement
Joost W. Geenen is supported by an unrestricted grant from GlaxoSmithKline
Related Research Data
References
- Schumock GT, Vermeulen LC. The rising cost of prescription drugs: causes and solutions. Pharmacotherapy. 2017;37:9–8.
- Prasad V, De Jesús K, Mailankody S. The high price of anticancer drugs: origins, implications, barriers, solutions. Nat Rev Clin Oncol. 2017;14:381–390.
- Green AK, Wood WA, Basch EM. Time to reassess the cancer compendia for off-label drug coverage in oncology. JAMA. 2016;316:1541–1542.
- The Organisation for Economic Co-operation and Development (OECD). New health technologies: managing access, value and sustainability [Internet]; [cited 2018 Feb 7]. Available from: http://www.oecd-ilibrary.org/social-issues-migration-health/managing-new-technologies-in-health-care_9789264266438-en
- Cohen JP, Stolk E, Niezen M. Role of budget impact in drug reimbursement decisions. J Health Polit Policy Law. 2008;33:225–247.
- Ghabri S, Mauskopf J. The use of budget impact analysis in the economic evaluation of new medicines in Australia, England, France and the USA: relationship to cost-effectiveness analysis and methodological challenges. Eur J Health Econ. 2018;19:173–175.
- Niezen MG, de Bont A, Busschbach JJ, et al. Finding legitimacy for the role of budget impact in drug reimbursement decisions. Int J Technol Assess Health Care. 2009;25:49–55.
- Vooren K, van de DS, Curto A, et al. A critical systematic review of budget impact analyses on drugs in the EU countries. Appl Health Econ Health Policy. 2014;12:33–40.
- Flume M, Bardou M, Capri S, et al. Approaches to manage ‘affordability’ of high budget impact medicines in key EU countries. J Mark Access Health Policy. 2018;6:1478539.
- Barua S, Greenwald R, Grebely J, et al. Restrictions for medicaid reimbursement of sofosbuvir for the treatment of hepatitis C virus infection in the USA. Ann Intern Med. 2015;163:215.
- Geenen JW, Boersma C, Klungel OH, et al. Accuracy of budget impact estimations and impact on patient access: a hepatitis C case study. Eur J Health Econ [Internet]. 2019;20:857–867. [cited 2019 May 2].
- Niezen MGH, Stolk EA, Steenhoek A, et al. Inequalities in oncology care: economic consequences of high cost drugs. Eur J Cancer. 2006;42:2887–2892.
- American Society of Clinical Oncology.American society of clinical oncology position statement on addressing the affordability of cancer drugs. JOP. 2017. DOI:10.1200/JOP.2017.027359
- Keeping S, Deslandes PN, Haines KE, et al. Estimated versus observed expenditure associated with medicines recommended by the all wales medicines strategy group. Pharmacol Econ Open [Internet]. 2019;3:343–350. [cited 2019 Jan 22].
- Cha M, Rifai B, Sarraf P. Pharmaceutical forecasting: throwing darts? Nat Rev Drug Discov. 2013;12:737–738.
- Broder MS, Zambrano JM, Lee J, Marken RS. Systematic bias in predictions of new drugs’ budget impact: analysis of a sample of recent US drug launches. Curr Med Res Opin. 2018 May 4;34(5):765–773.
- Staten-Generaal TK der. Geneesmiddelenbeleid; brief regering; vergoeding hepatitis C middel sovaldi met financieel arrangement [Internet]; 2014 [cited 2018 Oct 23]. Available from: https://zoek.officielebekendmakingen.nl/dossier/29477/kst-29477-296?resultIndex=252&sorttype=1&sortorder=4
- Zorginstituut Nederland. Grote budgetimpact effectief longkankermiddel durvalumab - nieuwsbericht [Internet];. 2019 [cited 2019 May 15]. Available from: https://www.zorginstituutnederland.nl/actueel/nieuws/2019/04/03/grote-budgetimpact-effectief-longkankermiddel-durvalumab
- Aggarwal A, Fojo T, Chamberlain C, et al. Do patient access schemes for high-cost cancer drugs deliver value to society?—lessons from the NHS cancer drugs fund. Ann Oncol. 2017;28:1738–1750.
- Eichler H-G, Baird LG, Barker R, et al. From adaptive licensing to adaptive pathways: delivering a flexible life-span approach to bring new drugs to patients. Clin Pharmacol Ther. 2015;97:234–246.
- Pauwels K, Huys I, Vogler S, et al. Managed entry agreements for oncology drugs: lessons from the European experience to inform the future. Front Pharmacol [Internet]. 2017;8. [cited 2019 Apr 4]. DOI:10.3389/fphar.2017.00171/full
- Zorginstituut Nederland. Richtlijn voor het uitvoeren van economische evaluaties in de gezondheidszorg - publicatie [Internet]; 2016 [cited 2018 Oct 23]. Available from: https://www.zorginstituutnederland.nl/publicaties/publicatie/2016/02/29/richtlijn-voor-het-uitvoeren-van-economische-evaluaties-in-de-gezondheidszorg
- Zorginstituut Nederland. Kosteneffectiviteit in de praktijk [Internet]; 2015. Available from: https://www.zorginstituutnederland.nl/binaries/zinl/documenten/rapport/2015/06/26/kosteneffectiviteit-in-de-praktijk/Kosteneffectiviteit+in+de+praktijk.pdf
- Zorginstituut Nederland. GVS-advies sofosbuvir/ledipasvir (Harvoni®) bij chronische hepatitis C - advies [Internet]; 2015 [cited 2018 Mar 26]. Available from: https://www.zorginstituutnederland.nl/publicaties/adviezen/2015/05/18/gvs-advies-sofosbuvir-ledipasvir-harvoni-bij-chronische-hepatitis-c
- English - farminform [Internet]; [cited 2018 Apr 26]. Available from: https://www.farminform.nl/English
- G-standaard — Z-index [Internet]; [cited 2018 Aug 6]. Available from: https://www.z-index.nl/g-standaard
- PHARMO institute for drug outcomes research [Internet]. Pharmo; [cited 2018 Apr 26]. Available from: https://www.pharmo.nl/
- Ministerie van Volksgezondheid W en S. Home - zorginstituut nederland [Internet]; 2013 [cited 2018 May 1]. Available from: https://www.zorginstituutnederland.nl/
- European medicines agency - human medicines - European public assessment reports [Internet]; [cited 2018 May 3]. Available from: http://www.ema.europa.eu/ema/index.jsp?curl=pages/medicines/landing/epar_search.jsp&mid=WC0b01ac058001d125
- Tofallis C. A better measure of relative prediction accuracy for model selection and model estimation [Internet]. Rochester, NY: Social Science Research Network; 2014 Jul. (Report No.: ID 2635088). Available from: https://papers.ssrn.com/abstract=2635088
- Tornqvist L, Vartia P, Vartia YO. How should relative changes be measured? Am Stat. 1985;39:43–46.
- R Core Team. R: a language and environment for statistical computing [Internet]. Vienna, Austria: R Foundation for Statistical Computing; 2018. Available from: https://www.R-project.org/
- Wickham H. 2016. ggplot2: elegant graphics for data analysis [Internet]. New York: Springer-Verlag. Available from: http://ggplot2.org
- Zorginstituut Nederland. Trastuzumab (Herceptin) bij borstkanker met tumoren die een overexpressie van HER2 vertonen - rapport [Internet]; 2010 [cited 2018 Feb 20]. Available from: https://www.zorginstituutnederland.nl/publicaties/rapport/2010/04/26/trastuzumab-herceptin-bij-borstkanker-met-tumoren-die-een-overexpressie-van-her2-vertonen
- Morgan SG, Vogler S, Wagner AK. Payers’ experiences with confidential pharmaceutical price discounts: A survey of public and statutory health systems in North America, Europe, and Australasia. Health Policy. 2017;121:354–362.
- Sullivan SD, Mauskopf JA, Augustovski F, et al. Budget impact analysis—principles of good practice: report of the ISPOR 2012 budget impact analysis good practice II task force. Value Health. 2014;17:5–14.
- Zorginstituut Nederland. Format budget impact analyse GVS (voorheen kostenconsequentieraming) - publicatie [Internet]; 2016 [cited 2018 Mar 23]. Available from: https://www.zorginstituutnederland.nl/publicaties/publicatie/2016/04/06/format-budget-impact-analyse-gvs-voorheen-kostenconsequentieraming