
ABSTRACT
Background:The optimisation of vaccine policies before their implementation is beholden upon public health decision makers, seeking to maximise population health. In this case study in Serbia, the childhood vaccines under consideration included pneumococcal conjugate vaccination (PCV), rotavirus (RV) vaccination and varicella zoster virus (VZV) vaccination.
Objective: The objective of this study is to define the optimal order of introduction of vaccines to minimise deaths, quality adjusted life years (QALYs) lost, or hospitalisation days, under budget and vaccine coverage constraints.
Methods: A constrained optimisation model was developed including a static multi-cohort decision-tree model for the three infectious diseases. Budget and vaccine coverage were constrained, and to rank the vaccines, the optimal solution to the linear programming problem was based upon the ratio of the outcome (deaths, QALYs or hospitalisation days) per unit of budget. A probabilistic decision analysis Monte Carlo simulation technique was used to test the robustness of the rankings.
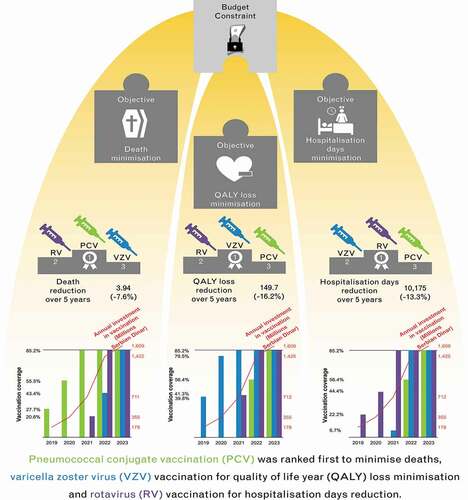
Results: PCV was the vaccine ranked first to minimise deaths, VZV vaccination for QALY loss minimisation and RV vaccination for hospitalisation day reduction. Sensitivity analysis demonstrated the most robust ranking was that for PCV minimizing deaths.
Conclusion: Constrained optimisation modelling, whilst considering all potential interventions currently, provided a comprehensive and rational approach to decision making.
Plain language summary
What is the context?
Constrained optimization (CO) was used to list and rank the introduction of new vaccines that will enhance the public health situation in Serbia exposed to a limited healthcare budget and fixed vaccine coverage rates.
What is new?
CO was used as an analysis method into a context of a small country with limited data. We applied probabilistic sensitivity analysis to test the robustness of our findings.
We were able to assess our analysis with three different outcomes of interest: deaths avoided, QALYs gained and hospital reduction.
What is the impact?
The study showed that to minimise vaccine preventable deaths, the vaccine to be implemented first would be the one that prevented childhood pneumonia. However, a vaccine against rotavirus gastroenteritis would reduce hospital days the most, and a chickenpox vaccine would be the best to improve quality of life of children overall.
Introduction
Vaccination is said to be the cornerstone of an efficient healthcare system and one of the most cost-effective healthcare interventions [Citation1]. At a time when there is considerable interest in the implementation of new vaccines, evidence-based approaches to inform decision making are increasingly being used to improve public health [Citation2]. Indeed, in order to meet a vision of a region free of vaccine preventable disease, the World Health Organization European Vaccine Action Plan defined goals. These include making evidence-based decisions on introduction of new vaccines and achieving financial sustainability of national immunisation programmes [Citation3].
Vaccination schedules across Europe differ with decision making occurring at national or regional levels [Citation4]. When a country is considering extending its vaccination schedule, choices are required regarding the order in which to implement new vaccines to gain maximum benefit for population health. The question of how best to allocate public health funds across multiple competing interventions is a problem regularly faced by decision makers in healthcare settings. With a fixed budget, how should limited financial resources be allocated for the maximum gain?
Traditionally, relative effectiveness and budget impact analysis have guided decision-making and, for a growing number of countries, cost-effectiveness analysis (CEA) has been the method of choice to assess the economic value of a new medical intervention. However, conventional CEA may not include the full value of a preventative measure such as vaccination, and critically the link with budget is not unequivocally defined. An alternative method, constrained optimisation (CO) modelling, is gaining popularity, combining in one analysis multiple interventions implemented simultaneously, considering the limited budget and the outcomes to be maximised [Citation5–10]. Indeed, this approach has been recommended by the International Society for Pharmacoeconomics and Outcomes Research and also recently in the new guidelines of the economic assessment of vaccines presented by the WHO [Citation11].
Three questions form the basis of CO modelling: (1) what is the outcome being optimised (for example, reduction in cases, quality adjusted life years (QALYs) lost, hospitalisation days, or deaths)?, (2) what is the constraint (the budget)? and (3) what are the decision variables affecting the function being optimised and the constraint (i.e., the vaccine interventions, number of vaccinees and costs)? [Citation12]. The CO method provides insights to decision makers about the optimal approach in relation to the cost and associated value of each of the available policy choices, with multiple potential interventions considered in one analysis [Citation13].
In relation to the improvement of public vaccination programs, CO modelling has been used to effect in several countries, including Japan where the competing interventions included childhood mumps, influenza, rotavirus (RV) and pneumococcal vaccination [Citation14], and Malaysia where seven interventions for infectious disease prevention and treatment were included in one analysis [Citation15]. Additionally, the CO approach has been used to provide information on the optimal prevention of influenza, targeting different age-groups with vaccines of differing characteristics [Citation16].
In Serbia, at a time when the paediatric vaccination schedule included ten mandatory antigens [Citation17], several new vaccines were available, and the question for public health policy makers was which vaccine should be implemented next to maximise population health. The options included: RV vaccination, varicella zoster virus (VZV) vaccination against chickenpox, along with pneumococcal vaccination, which was introduced just prior to this analysis. The objective of this CO modelling exercise was to inform the prioritisation of the different vaccination interventions within the projected annual budget growth, with the priority ranking dependent upon the outcome to be optimised (for example, lives saved, QALYs saved or costs avoided).
Methods
Model structure
The analysis is based on a previously described static, multi-cohort decision-tree model programmed in Microsoft Excel [Citation14,Citation15]. For each disease (RV, VZV and pneumococcal), a decision-tree was constructed accounting for disease severity and resource use as needed (see ). For each disease, the population is divided into those receiving the intervention, and those who do not; the coverage of the intervention was constrained to a maximum of 85.2%; corresponding to the lowest recorded coverage for obligatory vaccines in Serbia (namely, the combination mumps, measles and rubella, 2017) [Citation18]. Untreated individuals are at higher risk of the effects of each infectious disease than recipients of the intervention, using corresponding vaccine efficacy estimates and waning. Waning was modelled linearly with protection lasting up to 10 years of age in the case of pneumococcal conjugate vaccination (PCV), and 5 years of age in the case of RV vaccination, respectively, beginning 2 years after vaccine protection begins (4 and 2 months, respectively) [Citation14]. Regarding RV waning, these assumptions were shown to simulate observed data in Belgium more accurately and to reproduce a residual fraction of cases at a later age in the disease process [Citation19].
Figure 1. Decision tree structure to model rotavirus, varicella or pneumococcal disease
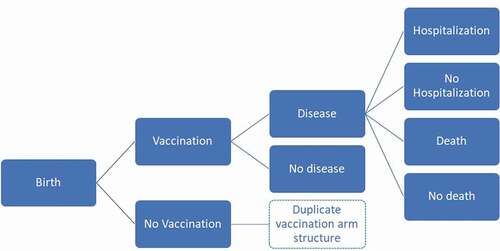
Case-severity distributions (‘low’ severity when no medical visit was sought, ‘moderate’ severity for visiting a general practitioner (GP), ‘severe’ cases for hospitalisations) were included for each disease to appropriately capture direct healthcare utilisation costs of cases by severity. The QALY loss per case averaged across severity levels is also included. Diseased individuals were also assumed to be at risk of disease-related death. The model assumes that the intervention reduces the probability of developing a case of disease but does not affect the progression to severe stagesor case-fatality. By applying this, the analysis follows a conservative approach on measuring the benefit of the vaccines in the absence of having more detailed information. For PCV, impact on pneumonia, meningitis, bacteraemia and acute otitis media (AOM) with or without myringotomy was included (myringotomy was assumed to occur in 1.5% of all-cause AOM cases across all age-groups). For RV and varicella, conservatively only the corresponding diseases were considered (for example, no impact on Herpes Zoster was included for VZV vaccination). Indirect protection was included for pneumococcal disease using a maximum of 12% proportion of vaccine efficacy; for rotaviral gastroenteritis, the maximum proportion was assumed to be 25% of vaccine efficacy (meaning, on average, unvaccinated children gained a quarter of the protection of a vaccinated individual within the same age-cohort) [Citation14].
For each of the diseases to be prevented with the new vaccines, the avoided cumulative number of cases, deaths, GP visits, hospitalisation days and disease management costs were estimated by comparing the states with and without the intervention. Cumulative QALYs gained by each intervention were estimated similarly, with disease-specific long-term sequelae and deaths counted into QALY losses over expected lifetime.
A five-year budget-horizon was considered, 2019 to 2023, with the associated budget for additional vaccines approximately doubling annually beginning with Serbian Dinar (RSD) 117,703,599 in 2019 and rising to RSD 2,843,257,579 in 2023 (extrapolating from historic Health Insurance Fund (RFZO) vaccination budgets, and as advised by the expert panel to provide an illustration for vaccine introduction). No discounting was applied due to the budget focus of the exercise. To rank the vaccines, the optimal solution to the linear programming problem was based on the ratio of outcome gained per unit of budget; an optimisation approach equivalent to using the simplex algorithm.
Data inputs
For each of the vaccines under investigation for this analysis, the disease epidemiology, costs and QALY-losses are summarized in . Population estimates for 2019 for Serbia were obtained from the Statistical Office of the Republic of Serbia [Citation20]. Age-specific mortality rates for Serbia were obtained from the same source [Citation21]. The QALYs lost from premature mortality were estimated using these age-specific mortality rates and the baseline utilities reported by year of age. The expert panel was also consulted to validate data inputs and provide estimates for Serbia when published data were not available. These estimates are indicated in .
Table 1. Summary of data inputs for vaccine interventions
Outcomes
Vaccines are ranked according to the optimisation using different criteria: reduction in disease cases, in medical visits, hospitalisation days, QALY losses, disease management costs and deaths. For each chosen criterion, the ranking provides the order the vaccines should be introduced to obtain the optimal outcome for the criterion selected, within the budget constraint. The gain obtained in each of the outcomes is provided by the model regardless of the criterion selected. The model results provide the optimal coverage for each year and each vaccine that respects the budget constraint.
Full coverage scenario
In the full coverage scenario, an additional vaccine coverage constraint was introduced in addition to the budget constraint. In this dual constraint problem, vaccine introduction was required to achieve ≥80% coverage to the maximum of 85.2% in the first year the vaccine was implemented.
Sensitivity analysis
In order to test the robustness of the ranking results from the model, a probabilistic decision analysis Monte Carlo simulation technique was used to assess the probability of alternative model findings. For each selected outcome, 1000 simulations are performed with a stochastic variation of input parameters: beta distributions were used on efficacy inputs using the 95% CI interval boundaries and for disease incidence, hospitalisations, case-fatality rate, resource use, unit costs, indirect protection and disutilities, a uniform distribution with 20% variation around the mean value was introduced, with the exception of case-fatality rate where a 50% variation on the mean value was allowed.
Results
The optimal ranking of vaccine introduction in the 5-year budget horizon, according to maximising various criteria, is presented in ; additionally, the percentage reduction in the selected criteria obtained over the 5 years is provided. To minimise deaths, the first vaccine to be introduced is PCV; optimising all other criteria would always leave PCV in third place. To minimise hospitalisation days, the first vaccine to be introduced is against RV; focusing on all other criteria leaves RV vaccination in second place. If the optimised criteria include minimising cases, GP visits, QALYs lost or costs associated with disease management, the first vaccine to be introduced is against VZV; otherwise, VZV vaccination is ranked second for hospitalisation days and third for deaths.
Table 2. The ranking of vaccine interventions when optimising the sequence of vaccine introduction by specific criteria
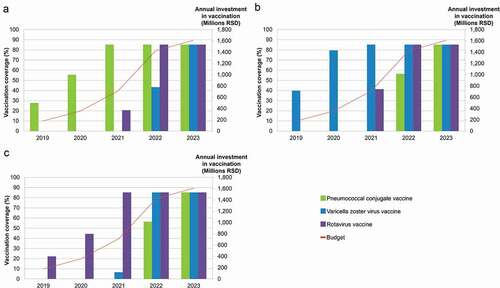
presents the sequence of vaccine introductions and the vaccine coverage achieved under budget constraint for the 5-year time-horizon. While reduction in deaths (panel A), QALYs lost (panel B) or hospitalisation days (panel C) are optimised, in the first two years of the budget horizon, only one vaccine can be partially implemented, with budget providing for maximum coverage in Year 3. In Year 3, a second vaccine can be introduced at varying levels below maximum coverage. In the fourth budget year, two vaccines can be funded fully with the third at sub-maximal coverage, with all three vaccines implemented to maximum coverage in budget Year 5. In panel A, with optimisation for deaths avoided, PCV is the first vaccine implemented, but budget constraints limit the vaccine coverage to 27.7% and 55.5% in Years 1 and 2, respectively. In the third year, maximum PCV coverage is reached and the budget constraint allows for RV vaccination to begin reaching 20.6% coverage. In the fourth year, PCV and RV vaccination coverage is maximal and VZV vaccination can be initiated (43.4%), reaching maximum coverage in the fifth year. In panel B, with QALY losses minimised, VZV vaccination is implemented in Year 1 reaching 39.8% and 79.5% coverage in Years 1 and 2, respectively. Maximum coverage for VZV vaccination is reached in Year 3 and RV vaccination can begin at 41.3% reaching maximum in Year 4 where enough budget allows for PCV to begin with coverage rising from 56.4% to maximum in Year 5. In panel C, with hospitalisation days minimised, RV vaccination is implemented first rising from 22.2%, 44.4% to maximum across the first three budget years. In Year 3, VZV vaccination can begin at 6.7% coverage, rising to maximum in Year 4 where PCV can begin at 56.4% coverage. In Year 5, all three vaccines can be implemented at full coverage.
Figure 2. Optimal sequence of vaccine introductions for maximum gain in (a) deaths prevented, (b) QALY loss minimised and (c) hospitalisation stays minimised, under budget constraint
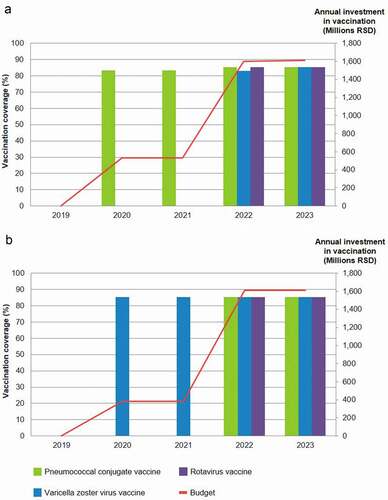
illustrates the dual constraint scenario where full vaccine coverage (>80 to ≤82.5%) within budget constraint is modelled and different criteria are optimised. Whether the number of deaths or QALYs lost are minimised, no vaccine can be implemented in Year 1 as the budget is too low for ‘full’ coverage. In the second and third budget years, PCV is implemented to optimise the avoidance of vaccine preventable deaths, and thereafter in Years 4 and 5, all three vaccines can be introduced (with varicella vaccination at a slightly lower coverage than PCV and RV vaccination in Year 4). When QALY loss is optimised, the vaccine introduced in Years 2 and 3 is VZV vaccine, followed by all vaccines at full coverage in Years 4 and 5.
Figure 3. Optimal sequence of vaccine introductions for maximum gain in (a) deaths prevented, (b) QALY loss minimised under constrained budget and vaccination coverage
Sensitivity analyses
When aiming at a maximum reduction in mortality, PCV was ranked first for all simulations even with the introduction of 50% uncertainty on case-fatality rates. Optimising the reduction in QALY loss, the first ranked vaccine was VZV vaccine in 78% of the simulations and RV vaccine in the remaining 22% simulations, with PCV always in last place. When hospitalisation days were optimised, the first ranked vaccine was RV vaccine in 54% of the simulations and VZV vaccine in the remaining 46% of the simulations, again with PCV always in third place.
Discussion
In this case-study, CO modelling was used to address a realistic question – how to invest most efficiently in new vaccines within a constrained budget and constrained vaccine coverages. The decision problem begins with defining the interventions that should be considered in competition for the resources available, and the criteria upon which to rank them. In Serbia, where the infant vaccination calendar did not include several antigens used in other countries, the analysis supported the decision to introduce PCV as the most effective programme to avoid infant deaths [Citation22,Citation23].
CEA is most often the method of choice when evaluating new healthcare interventions; however in public health decisions, it is often the case that decision makers have little understanding of an incremental cost-effectiveness ratio, or the arbitrary threshold used for decision making. In contrast, the CO approach, using a linear programming algorithm, provides a clear view of the trade-offs between several potential policy options considered simultaneously. It is the strength of this analysis method of making a direct link between the health outcome measure to be considered as the target to reach and budget required subject to a maximum constraint, adding different vaccination coverage constraints in a linear equation system. The model allows to assess different intervention options together by which it is possible to prioritise or list a ranking of the interventions. In the Serbian case-study, introducing PCV minimised infant mortality (a predicted four deaths prevented over the five budget years); however, the number of QALYs that could be saved over life-time amounted to 150 if VZV vaccination were to be introduced first, in place of PCV.
As the modelling approach allowed for optimising criteria under dual constraints of vaccine coverage and budget, it was possible to demonstrate the year in which the budget could accommodate full coverage. This avoided operational and ethical issues associated with implementing a new universal vaccination policy but having to ration access to it. In this case-study it was found that the policy decision could not be implemented in full without access to a budget higher than that available in Year 1. Finally, it should be mentioned that a multivariate probabilistic sensitivity analysis was used for testing the range of value indication in uncertain variables like disease incidence, hospitalisations, resource use, cost, among others. It was the first time that this approach was tested and successfully applied in CO modelling.
There are several limitations to this analysis, the key among them being the accuracy of information around the diseases, the associated costs and the effectiveness of the interventions. All inputs were extracted from the literature and official sources where possible; otherwise, assumptions were made, with all inputs undergoing review by a panel of local experts (as identified in the acknowledgements). Whilst the simplicity of the model aids transparency and understanding (with one decision tree structure for the three vaccine interventions), this does simplify the modelled annual health impact of each disease. It is recommended to model infectious disease using a dynamic transmission model to better capture direct and indirect effects of an infection [Citation24]; we did not capture events after 5 years that could be expected for varicella cases, the reduction in nosocomial cases affected by implementation of RV vaccination or PCV, vaccine-related adverse reactions or the impact of one disease upon another, such as VZV on Herpes Zoster [Citation25].
However, the current structure (a trade-off between complexity and user-friendliness) does provide results that comprehensively and reliably inform decision making, particularly as a result of the application of the probabilistic decision analysis. Here, alternative plausible model inputs are sampled, giving an indication of the certainty of the rankings provided by the model; a new feature that has not thus far been possible in constraint optimisation modelling for vaccine implementation [Citation14–16].
Conclusions
We present an innovative approach to optimise the prioritisation of vaccines to extend the Serbian infant vaccination schedule. CO modelling overcomes the limitations of conventional health economic techniques, such as cost-effectiveness and budget impact analyses, by considering all potential interventions concurrently thereby providing a comprehensive and rational approach to decision making. Sensitivity analyses provide an indication to decision makers regarding the confidence in the ranking of vaccine introduction provided by the analysis.
Author contribution
All named authors for this manuscript meet the criteria of authorship, according to the International Committee of Medical Journal Editors (ICMJE), have taken responsibility for the integrity of the work as a whole and have given final approval to the version to be published.
Proprietary Data Statement
Data, models and methodology used in the research are proprietary of the GSK group of companies.
Acknowledgments
The authors thank the 8 Expert Panel formed for validating the model approach and assumptions, specifically: Vladimir Petrovic, Radmila Kosic, Predrag Minic, Predrag Miljkovic, Milena Kanazir, Leposava Garotić and Goranka Lončarević. Additionally, the authors thank Business & Decision Life Sciences platform for editorial assistance and manuscript coordination, on behalf of GSK: Rachel Emerson provided writing support, and Carole Desiron coordinated manuscript development and editorial support.
Disclosure statement
BS, DA, RG and CS were working for the GSK group of companies at the time of the research. BS and RG hold shares of the GSK group of companies. CS was holding shares of the GSK group of companies. JM is employed by MiHA; his institution received consulting fees from the GSK group of companies inside and outside this submitted work. MJP received grants and honoraria from various pharmaceutical companies, inclusive of all major companies developing, producing, and marketing vaccines; and received grants from Indonesian government and various non-profit organisations (WHO and EU) outside of submitted work. MJP also holds stocks, shares and advisorships in different consultancy companies. The University and consultancies where MJP is involved are also consortium members in various Innovative Medicines Initiative (IMI) projects. All authors declare no other financial and non-financial relationships and activities.
Additional information
Funding
References
- Remy V, Zollner Y, Heckmann U. Vaccination: the cornerstone of an efficient healthcare system. J Mark Access Health Policy. 2015;(3). DOI:https://doi.org/10.3402/jmahp.v3403.27041.
- Takla A, Wichmann O, Carrillo-Santisteve P, et al. Characteristics and practices of National Immunisation Technical Advisory Groups in Europe and potential for collaboration, April 2014. Eurosurveillance. 2015;20(9):21049.
- World Health Organization. The European Vaccine Action Plan 2015–2020. https://www.euro.who.int/__data/assets/pdf_file/0007/255679/WHO_EVAP_UK_v30_WEBx.pdf. Accessed 14-Jul 2020.
- Sheikh S, Biundo E, Courcier S, et al. A report on the status of vaccination in Europe. Vaccine. 2018;36(33):4979–10.
- Standaert B, Sauboin C, DeAntonio R, et al. How to assess for the full economic value of vaccines? From past to present, drawing lessons for the future. J Mark Access Health Policy. 2020;8(1):1719588.
- Demarteau N, Breuer T, Standaert B. Selecting a mix of prevention strategies against cervical cancer for maximum efficiency with an optimization program. PharmacoEconomics. 2012;30(4):337–353.
- Standaert BA, Curran D, Postma MJ. Budget constraint and vaccine dosing: a mathematical modelling exercise. Cost Eff Resour Allocation. 2014;12(1):3.
- Sauboin C, Van Vlaenderen I, Van Bellinghen L-A SB. Reducing malaria mortality at the lowest budget: an optimization tool for selecting malaria preventative interventions applied to Ghana. MDM Policy Pract. 2019;4(2): 2381468319861346–2381468319861346.
- Knerer G, Currie CSM, Brailsford SC. Reducing dengue fever cases at the lowest budget: a constrained optimization approach applied to Thailand. BMC Public Health. 2021;21(1):807.
- Olbrecht J, Gomez JA, L-a VB, et al. Constrained optimization for pneumococcal vaccination in Brazil. Value Health Reg Issues. 2021;26:40–49.
- Mauskopf J, Standaert B, Connolly MP, et al. Economic analysis of vaccination programs: an ISPOR good practices for outcomes research task force report. Value Health. 2018;21(10):1133–1149.
- Crown WH. The potential role of constrained optimization methods in healthcare decision making. Appl Health Econ Health Policy. 2020;18(4):461–462.
- Crown W, Buyukkaramikli N, Sir MY, et al. Application of constrained optimization methods in health services research: report 2 of the ISPOR optimization methods emerging good practices task force. Value Health. 2018;21(9):1019–1028.
- Standaert B, Schecroun N, Ethgen O, et al. Optimising the introduction of multiple childhood vaccines in Japan: a model proposing the introduction sequence achieving the highest health gains. Health Policy. 2017;121(12):1303–1312.
- Varghese L, Ezat Wan Puteh S, Schecroun N, Jahis R, Van Vlaenderen I, Standaert BA. Applying a constrained optimization portfolio model to aid prioritization of public health interventions in Malaysia. Value Health Reg Issues. 2020;21:172–180.
- Standaert B, Van Vlaenderen I, Van Bellinghen LA, et al. Constrained optimization for the selection of influenza vaccines to maximize the population benefit: a demonstration project. Appl Health Econ Health Policy. 2020;18(4):519–531.
- Institute of Public Health of Serbia. Report on conducted immunization on the territory of the Republic of Serbia in 2018. http://www.batut.org.rs/download/izvestaji/Godisnji%20imunizacija%202018.pdf. Accessed 14-Jul 2020.
- Institute of Public Health of Serbia. Report of immunization implemented on the territory of the Republic of Serbia in 2017. http://www.batut.org.rs/download/izvestaji/Godisnji%20izvestaj%20imunizacija%202017.pdf. Accessed 14-Jul 2020.
- Standaert B, Strens D, Alwan A, et al. Medium- to long-term impact of rotavirus vaccination on hospital care in Belgium: a 7-year follow-up of the rotavirus Belgium impact study (RotaBIS). Infect Dis Ther. 2016;5(1):31–44.
- Statistical Office of the Republic of Serbia. https://www.stat.gov.rs/sr-latn/oblasti/stanovnistvo/. Accessed 14-Jul 2020.
- Statistical Office of the Republic of Serbia. Mortality table. https://www.stat.gov.rs/sr-Latn/oblasti/stanovnistvo/tablice-mortaliteta. Accessed14-Jul 2020.
- Republic of Serbia News N1. Anti-pneumonia vaccine becomes mandatory 2 April 2018. http://rs.n1info.com/English/NEWS/a376512/Mandatory-anti-pneumonia-vaccine.html. Accessed 14-Jul 2020.
- Healthcare Insurance Fund of the Republic of Serbia. Reimbursement list B (2020). http://rfzo.rs/download/pravilnici/lekovi/B%20Lista_primena%20od%2028.03.2020.pdf Accessed 14-Jul 2020.
- Pitman R, Fisman D, Zaric GS, et al. Dynamic transmission modeling: a report of the ISPOR-SMDM modeling good research practices task force working group–5. Med Decis Mak. 2012;32(5):712–721.
- Sauboin C, Holl K, Bonanni P, et al. The impact of childhood varicella vaccination on the incidence of herpes zoster in the general population: modelling the effect of exogenous and endogenous varicella-zoster virus immunity boosting. BMC Infect Dis. 2019;19(1):126.
- Grzesiowski P, Skoczynska A, Albrecht P, et al. Invasive pneumococcal disease in children up to 5 years of age in Poland. Eur J Clin Microbiol Infect Dis. 2008;27(9):883–885.
- Institute of Public Health of Serbia-Dr Milan Jovanović Batut (Batut) (2017). Report on communicable diseases in (Central) Serbia 2016. http://www.batut.org.rs/download/izvestaji/zarazneBolestiGodisnjiIzvestaj2016.pdf. Accessed 17-Jul 2020.
- Institute of Public Health of Vojvodina (2017). Communicable diseases in autonomous province of Vojvodina in 2016. http://www.izjzv.org.rs/publikacije/ZarazneBolesti/ZB_2016.pdf. Accessed 17-Jul 2020.
- Acute diarrheal syndrome in children. https://www.scribd.com/document/220521876/Akutni-Dijarealni-Sindrom-Kod-Dece. Accessed 17-Jul 2020.
- Patić A, Milošević V, Hrnjaković-Cvjetković I, et al. Viral gastrointestinal syndrome in our environment. Archives of Biological Sci. 2014;66(1):29–35.
- Melegaro A, Edmunds WJ. Cost-effectiveness analysis of pneumococcal conjugate vaccination in England and Wales. Vaccine. 2004;22(31–32):4203–4214.
- Forster J, Hammerschmidt T. [Burden of acute rotavirus gastroenteritis (RV-AGE) in Germany: a comparison of federal statistics and epidemiological data]. Gesundheitswesen. 2007;69(4):227–232.
- Hobbelen PHF, Stowe J, Amirthalingam G, et al. The burden of hospitalisation for varicella and herpes zoster in England from 2004 to 2013. J Infect. 2016;73(3):241–253.
- Bennett JE, Sumner W 2nd, Downs SM, et al. Parents‘ utilities for outcomes of occult bacteremia. Arch Pediatr Adolesc Med. 2000;154(1):43–48.
- Oh PI, Maerov P, Pritchard D, et al. A cost-utility analysis of second-line antibiotics in the treatment of acute otitis media in children. Clin Ther. 1996;18(1):160–182.
- Brisson M, Sénécal M, Drolet M, et al. Health-related quality of life lost to rotavirus-associated gastroenteritis in children and their parents: a Canadian prospective study. Pediatr Infect Dis J. 2010;29(1):73–75.
- Brisson M, Edmunds WJ. Varicella vaccination in England and Wales: cost-utility analysis. Arch Dis Child. 2003;88(10):862–869.
- Mrkvan T, Pelton SI, Ruiz-Guiñazú J, et al. Effectiveness and impact of the 10-valent pneumococcal conjugate vaccine, PHiD-CV: review of clinical trials and post-marketing experience. Expert Rev Vaccines. 2018;17(9):797–818.
- Poelaert D, Pereira P, Gardner R, et al. A review of recommendations for rotavirus vaccination in Europe: arguments for change. Vaccine. 2018;36(17):2243–2253.
- Henry O, Brzostek J, Czajka H, et al. One or two doses of live varicella virus-containing vaccines: efficacy, persistence of immune responses, and safety six years after administration in healthy children during their second year of life. Vaccine. 2018;36(3):381–387.
- Health Care Insurance Fund of the Republic of Serbia. Pricelist of the services in the primary health care. 2020. http://rfzo.rs/download/pravilnici/ugovaranje/Pravilnik%20o%20ceenama%20usluga%20PZZ.pdf. Accessed 17-Jul 2020.
- Healthcare Insurance Fund of the Republic of Serbia. Contracting services, prices and reimbursement amounts – supplement 2 Price of hospitalization day (2019). http://rfzo.rs/download/pravilnici/ugovaranje/Prilog%202.%20Cene%20BO%20dan.pdf. Accessed 14-Jul 2020.
- Ministry of Health, Serbia. Official pricelist. https://www.zdravlje.gov.rs/view_file.php?file_id=572&cache=sr. Accessed 14-Jul 2020.